

An interview with Jerry Harris - Stanford University
An interview with Jerry Harris - Stanford University
An interview with Jerry Harris - Stanford University

Create successful ePaper yourself
Turn your PDF publications into a flip-book with our unique Google optimized e-Paper software.
INTERVIEW<br />
12 CSEG Recorder December, 2002<br />
‘TECHNOLOGY IS IMPORTANT……’<br />
– <strong>An</strong> <strong>interview</strong> <strong>with</strong> <strong>Jerry</strong> <strong>Harris</strong><br />
<strong>Jerry</strong> <strong>Harris</strong> is Professor and Head of the Department of<br />
Geophysics at <strong>Stanford</strong> <strong>University</strong>. While in Calgary recently, to<br />
deliver the SEG/AAPG 2002 Fall Distinguished Lecture on<br />
Crosswell Seismic Profiling: The Decade Ahead , <strong>Jerry</strong> was kind<br />
enough to spare some time for an <strong>interview</strong> for the RECORDER. His<br />
impressions and opinions on different aspects of his favourite topic<br />
are contained in the following excerpts from the <strong>interview</strong>.<br />
S: <strong>Jerry</strong>, tell us about your educational background and experience?<br />
JH: I did my undergraduate studies at <strong>University</strong> of Mississippi<br />
in the early 1970s, and then went to the California Institute of<br />
Technology and majored in electrical sciences. After my master’s<br />
degree, I worked for 3 years in atmospheric geosciences, looking at<br />
microwave attenuation due to rain. You may say I am an electrical<br />
engineer at heart but I have done wave propagation all my professional<br />
career, first electromagnetics and now seismic.<br />
S: Why did you decide to go in for a teaching career? What do like<br />
best about this profession and what is the most difficult thing about being<br />
a Professor?<br />
JH: In a research university like <strong>Stanford</strong>, we teach in a many<br />
different ways. Most of us like the variety. It is not just in a classroom<br />
but all the interaction we have <strong>with</strong> students. For example, in a Ph.D.<br />
program we are really involved in research. <strong>An</strong>d through our<br />
research we are educating and teaching our students. What I really<br />
like about it is there is always an opportunity to learn yourself and<br />
an opportunity to work <strong>with</strong> smart students. So, it is an environment<br />
that you can never really outgrow because you are always renewing<br />
continually. I really enjoy the teaching career in a research institution.<br />
There are no boundaries as to what you can work on; in my case<br />
electromagnetics, seismic imaging, laboratory, field, etc. So it is<br />
something always challenging and interesting. The biggest challenge<br />
is balancing all the demands for your time, such as the<br />
teaching, your own research, proposal writing, and of course<br />
project administration.<br />
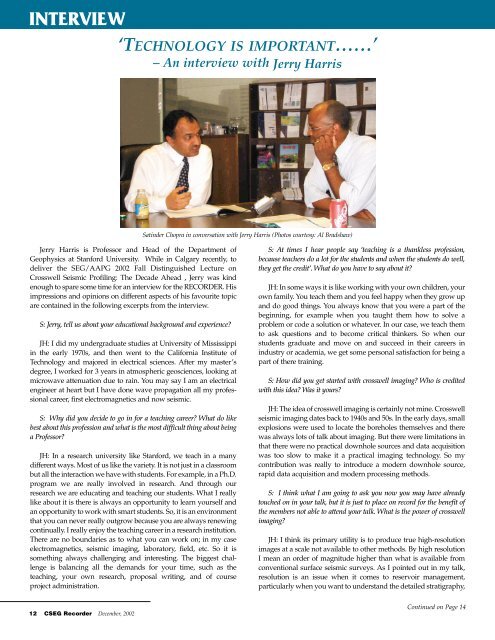
Satinder Chopra in conversation <strong>with</strong> <strong>Jerry</strong> <strong>Harris</strong> (Photos courtesy: Al Bradshaw)<br />
S: At times I hear people say ‘teaching is a thankless profession,<br />
because teachers do a lot for the students and when the students do well,<br />
they get the credit’. What do you have to say about it?<br />
JH: In some ways it is like working <strong>with</strong> your own children, your<br />
own family. You teach them and you feel happy when they grow up<br />
and do good things. You always know that you were a part of the<br />
beginning, for example when you taught them how to solve a<br />
problem or code a solution or whatever. In our case, we teach them<br />
to ask questions and to become critical thinkers. So when our<br />
students graduate and move on and succeed in their careers in<br />
industry or academia, we get some personal satisfaction for being a<br />
part of there training.<br />
S: How did you get started <strong>with</strong> crosswell imaging? Who is credited<br />
<strong>with</strong> this idea? Was it yours?<br />
JH: The idea of crosswell imaging is certainly not mine. Crosswell<br />
seismic imaging dates back to 1940s and 50s. In the early days, small<br />
explosions were used to locate the boreholes themselves and there<br />
was always lots of talk about imaging. But there were limitations in<br />
that there were no practical downhole sources and data acquisition<br />
was too slow to make it a practical imaging technology. So my<br />
contribution was really to introduce a modern downhole source,<br />
rapid data acquisition and modern processing methods.<br />
S: I think what I am going to ask you now you may have already<br />
touched on in your talk, but it is just to place on record for the benefit of<br />
the members not able to attend your talk. What is the power of crosswell<br />
imaging?<br />
JH: I think its primary utility is to produce true high-resolution<br />
images at a scale not available to other methods. By high resolution<br />
I mean an order of magnitude higher than what is available from<br />
conventional surface seismic surveys. As I pointed out in my talk,<br />
resolution is an issue when it comes to reservoir management,<br />
particularly when you want to understand the detailed stratigraphy,<br />
Continued on Page 14
INTERVIEW Cont’d<br />
TECHNOLOGY IS IMPORTANT<br />
Continued from Page 12<br />
to develop reservoir models for flow simulation and of course monitoring.<br />
When you need to estimate small-scale features, crosswell<br />
may be the only technology capable of producing the kind of reservoir<br />
models that are needed for flow simulation. Crosswell images<br />
are actually pushing the limits in terms of resolution of grid blocks<br />
in the flow simulator itself. Where else do you get this small-scale<br />
information between wells? So crosswell profiling is the only direct<br />
measurement technology available today for this problem.<br />
S: What type of sources are used in crosswell (imaging) data<br />
acquisition?<br />
JH: I have used a number of different sources: airguns were probably<br />
the first modern sources to be used, but piezoelectric sources<br />
are probably the best and easiest to use and also are relatively<br />
powerful and easy to operate. The piezoelectric sources run sweep<br />
waveforms or pulse codes that are easy signals to distinguish from<br />
background noise so high peak pressures are not required.<br />
There are other sources of course. One approach was to take low<br />
frequency surface seismic sources like hydraulic or pneumatic vibrators<br />
and repackage them for downhole use. Others have tried this<br />
<strong>with</strong> limited success. Instead, I took the approach of repackaging<br />
high frequency logging technology, making it more powerful and<br />
lower frequency. With logging-based technologies, I could build on<br />
all the expertise and experience of logging operations, that is high<br />
temperature, high pressure, and wireline operation. Of course the<br />
traditional sonic logging tool is not capable of transmitting the long<br />
distances required in crosswell, say up to a 1000m. So, we had to reengineer<br />
the piezoelectric devices to produce the right frequencies,<br />
100 - 2000 Hz, a feature that repackaged surface seismic technology<br />
was never able to accomplish.<br />
BM: You spent a lot of time as you were developing this technology.<br />
You would have many stories to tell.<br />
JH: Not only about sources, but downhole detectors and operations<br />
were issues as well. Some of the first downhole receivers we<br />
used were actually Teledyne marine streamers and hydrophones.<br />
14 CSEG Recorder December, 2002<br />
There were some good stories and bad stories about them. They<br />
worked very well as detectors but sometimes we would get things<br />
stuck in the borehole and some of the stuff we put in first actually<br />
came out first.<br />
Apart from the bad stories, we had some good times as well,<br />
for example the first time we detected a 1000 Hz signal over 500 m<br />
or so. Others could not believe that we could see those high<br />
frequencies over those distances. It was pleasantly surprising for<br />
all of us. In fact the piezoelectric source that we use now was<br />
primarily built as a reference source in many of those early tests.<br />
We were comparing a number of different sources and needed one<br />
as a reference. I built the piezoelectric because it was very repeatable<br />
and reliable. <strong>An</strong>d it turned out to be the best of all the sources.<br />
So, what started off as a reference tool ended up as a tool of choice.<br />
<strong>An</strong>d we compared that source to hydraulic vibrators, airguns,<br />
explosives, all kinds of fancy exotic sources literally from around<br />
the world. From Norway to Japan and other places, the piezoelectric<br />
always emerged as the best source.<br />
S: What type of source spacing are we talking about?<br />
JH: Typically, 1m; it depends on the imaging objective, that is<br />
whether only tomography or reflection processing is needed. The<br />
sampling interval is dictated by the frequency content and the desire<br />
to avoid spatial aliasing of the low velocity events. <strong>An</strong>other problem<br />
is the depth control needed for for small source intervals. Imagine<br />
now that you are trying to position the source at 1 m intervals at<br />
5000m depth. How do you do it? If you just start at 5000m and call<br />
for the source to move 1m at these depths, sometimes it moves,<br />
sometimes it sticks and doesn’t move the entire 1m. So having a<br />
source that operates like a logging tool, keeping it moving continuously<br />
in the borehole, takes care of the problem and keeps the source<br />
on depth <strong>with</strong> repeatability of a few inches. As the source moves, the<br />
computer is telling it to fire on depth. Again we borrowed that operation<br />
from well logging but we, at <strong>Stanford</strong>, were the first to use it<br />
<strong>with</strong> a modern crosswell source while others were operating by<br />
stopping, starting and sometimes clamping the source at depth. This<br />
shooting on the fly became very important to data quality because<br />
we have to go back and occupy those shot points several times. By<br />
keeping the downhole source continuously moving, we found we<br />
could repeat locations and the event moveouts in common-shotgathers<br />
became much smoother. We introduced that approach,<br />
shooting on the fly, at <strong>Stanford</strong> <strong>with</strong> the piezoelectric source. Now<br />
it’s used <strong>with</strong> other downhole sources, such as the airguns.<br />
S: Is there a limit to the distance between the wells to get good results?<br />
JH: Certainly there is a limit. But again, it depends on what you<br />
are trying to image and how you hope to accomplish that.<br />
Eventually high frequencies are going to be attenuated to a level<br />
below delectability. So, if you are willing to use the same frequency<br />
as surface seismic, say 100 hz, then you will be able to see the signal<br />
over distances comparable to the distances you see in surface<br />
seismic, say 1000s of meters. But in my opinion, the advantage of<br />
crosswell comes when you use the higher frequencies. The higher<br />
frequencies will still have good signal-to-noise ratio over the shorter<br />
Continued on Page 15
INTERVIEW Cont’d<br />
TECHNOLOGY IS IMPORTANT<br />
Continued from Page 14<br />
raypaths that are set by well spacing, not the<br />
target depth. A rule of thumb is that you are<br />
going to see your signal up to about 200 wavelengths.<br />
So given the frequency and the velocity<br />
of sound, figure that you will see adequate<br />
signal over paths of about 200 wavelengths. If<br />
that’s 5000m at 100 Hz, it’s probably only 500m<br />
at 1000Hz.<br />
S: Since we are using high frequency sources<br />
and because we are recording close to the borehole<br />
in the zone of interest, there are smaller associated<br />
Fresnel zones. All these contribute to the high resolution<br />
images that we see in crosswell data. Is there<br />
anything more to that? For processing crosswell<br />
data, do you use VSP processing techniques or are<br />
there special techniques?<br />
JH: I have already said that the distances<br />
the waves have to propagate are shorter. So<br />
you can transmit and receive higher frequencies<br />
over the shorter distances. There isn’t nay<br />
magic here. The geometry of the survey is also<br />
different. You are propagating say parallel to<br />
bedding in most cases rather than perpendicular<br />
to bedding. We can borrow all the<br />
processing concepts from seismic and VSP<br />
technology except the details are different<br />
because of the frequency content and geometry.<br />
Conceptually one could process crosswell<br />
data like the offset VSP, except in practice you<br />
will have to process 300-500 offset VSPs for<br />
each pair of wells. Certainly, you cannot do it<br />
one offset at a time. So, the way you do it is to<br />
borrow the concepts and algorithms from VSP<br />
but organize data in a form suited to the crosswell<br />
geometry.<br />
Continued on Page 16<br />
Page 15<br />
Advertiser: Mitcham<br />
Name of Ad: Now a larger and<br />
more diversified<br />
Size: 2/3 page<br />
Last Ran: April<br />
Page: 39<br />
Supplied originally as Film<br />
December, 2002 CSEG Recorder 15
INTERVIEW Cont’d<br />
TECHNOLOGY IS IMPORTANT<br />
Continued from Page 15<br />
The problem <strong>with</strong> migration of crosswell data is the limited aperture<br />
of the crosswell survey. Unlike medical imaging or surface<br />
seismic we are trying to image a complicated structure from data<br />
collected along two lines. We don’t have the vertical aperture you<br />
would ideally like to have for migration, so we you use is a limited<br />
aperture migration. Well, if I keep limiting the migration aperture<br />
more and more, the migration turns into a CDP reflection mapping<br />
process. So instead we tend to start <strong>with</strong> a CDP reflection mapping<br />
and then open the aperture until we start seeing unacceptable<br />
migration artifacts. One last comment is that we have incorporated<br />
Fresnel zones into the tomography algorithms, though not routinely,<br />
to capture finite bandwidth effects on the inversion.<br />
S: So it is a sort of trade off?<br />
JH: It is a trade off between wanting to collapse the Fresnel zone<br />
effects <strong>with</strong> a migration technique, but being forced to control the<br />
aperture to reduce the artifacts <strong>with</strong> a limited migration aperture.<br />
Again, the conceptual advantages and disadvantages of migration,<br />
say regarding Fresnel zone effects, are the same as for surface seismic<br />
but the practice is different.<br />
S: You referred to anisotropy determination in your talk. How much<br />
effort is being put into including anisotropy in processing crosswell data?<br />
JH: Not nearly enough in my opinion. We can extract<br />
anisotropy in the plane of the survey but not done routinely.<br />
Azimuthal anisotropy is a different beast. Tomoseis is recording<br />
crosswell using multiple wells, so they can in principle detect<br />
azimuthal anistropy. One challenge though is to separate<br />
anisotropy from heterogeneity. More sophisticated modeling is<br />
required. Nevertheless, this is one area where the detailed<br />
understanding that you get from the crosswell survey could be<br />
used to enhance the value of surface seismic by unraveling how<br />
scale affects anisotropy. As you know, heterogeneity below the<br />
scale of resolution, say due to aligned fractures, may appear as<br />
seismic anisotropy. In the simple cases of laminated shales that I<br />
have shown, high frequency crosswell data can resolve some<br />
scales of heterogeneity while other smaller scales still appear as<br />
anisotropy. Of course, the scales we resolve are an order of<br />
magnitude smaller than surface seismic so we may be able to<br />
resolve heterogeneity that appears as anisotropy in lower<br />
frequency seismic data.<br />
S: Are we in a position to do 3D imaging <strong>with</strong> crosswell technology<br />
and if yes, does that justify the cost that may be incurred?<br />
JH: We do have the technology to do 3D imaging, at least the<br />
velocity and attenuation tomograms in 3D. The issues <strong>with</strong> migration<br />
are more complicated. Now that we can survey several wells<br />
simultaneously, the aperture issues improve but sampling is still a<br />
problem. The basic technology is there but data are scarce and the<br />
devil is in the details.<br />
Now, I’ll move to the other part of your question. The cost is<br />
acceptable if the result you produce has value or answers the questions<br />
being asked. For example, someone might ask, “Do I have to<br />
16 CSEG Recorder December, 2002<br />
shut the wells in to do this, because that will cost me money?” The<br />
answer is, yes you must make the wells available to do this imaging.<br />
But shutting the wells is not a problem if the results add value. If the<br />
engineer asks the operator to shut in for a well test, there wouldn’t<br />
be any question because they know the value. So, if we can establish<br />
the value crosswell brings to reservoir analysis and monitoring, the<br />
cost for 2D or even 3D will not be an issue.<br />
S: With this 3D coverage, is it possible to get an idea about azimuthal<br />
anisotropy?<br />
JH: The limitation of crosswell in this respect is constrained by<br />
where the boreholes are located; you will not be able to get<br />
uniformly sampled azimuthal data and this lack of uniform<br />
coverage will be a problem for estimating azimuthal anisotropy.<br />
From the point of view of tomography, the rate of convergence of the<br />
different complements of the anisotropy model may be horribly<br />
different.<br />
S: It will depend on the location of the borehole.<br />
JH: Yes, and you’ll want to keep the geometry as uniform as<br />
possible. You do not want to shoot between wells a few 100 m apart<br />
and interpret anisotropy <strong>with</strong> data from other wells that are 1000 m<br />
away. So what it means is you are forced to work <strong>with</strong> the geometric<br />
pattern you have for the wells.<br />
Remember too, in surface seismic this anisotropy you are seeing<br />
may be due to heterogeneity. It appears as anisotropy because you<br />
are not resolving the heterogeneity, say fractures. It may not be<br />
intrinsic anisotropy at all. If I have the higher resolution imaging that<br />
crosswell brings you may actually image the isotropic zones<br />
between the fractured zones or see other wave phenomena associated<br />
<strong>with</strong> the fractures like guided waves, etc. So it is no longer an<br />
anisotropy problem, it is a heterogeneity problem.<br />
S: Apart from Tomoseis, what other companies offer crosswell imaging<br />
service?<br />
Continued on Page 18
INTERVIEW Cont’d<br />
TECHNOLOGY IS IMPORTANT<br />
Continued from Page 16<br />
JH: There is Schlumberger and Paulsson Geophysical and<br />
companies that do 3D VSP, though others have not been doing<br />
surveys for as long a time or as routinely as Tomoseis. The national<br />
laboratories have active programs. In addition to their work in oil<br />
and gas, the labs also work on near surface shallow environmental<br />
applications.<br />
S: Your present assignment as SEG/AAPG Distinguished Lecturer<br />
takes you to different places in North America and UK. How does this<br />
help you professionally?<br />
JH: It is very interesting. In some ways, it is an opportunity for<br />
me to see what other people are doing, what their research interests<br />
are. I am enjoying it, so far, though I am only on my 7th or 8th<br />
stop. I have 26 in all.<br />
S: This will take you to North America and UK or beyond?<br />
JH: This program is limited to North America and Western<br />
Europe, even though I had requests from South America and the<br />
Far East. I think the SEG should be responding to these distant<br />
requests, but there may be a combination of financial and political<br />
reasons for not doing them this year.<br />
S: I was wondering if you would like to share <strong>with</strong> us what<br />
research you are doing now?<br />
JH: I am giving this lecture on crosswell imaging now, but in<br />
fact much of this work was done 5 or more years ago at <strong>Stanford</strong><br />
and elsewhere. Most of the work we do in crosswell at <strong>Stanford</strong> is<br />
related to environmental and near surface applications. Moreover,<br />
my personal interest is mostly on attenuation of seismic waves.<br />
This interest is driven by the observations of attenuation that we<br />
see in crosswell data. The problem is that even when we produce<br />
an attenuation tomogram, we have no good idea about how to<br />
interpret it. We cannot go to the laboratory and measure attenuation<br />
on a piece of rock, because the way attenuation is typically<br />
measured on a core is <strong>with</strong> ultrasound waves in the megahertz<br />
range. Attenuation scaling is just not reliable as velocity scaling. I<br />
have developed this technique called Acoustical Resonance<br />
18 CSEG Recorder December, 2002<br />
Bruce Marion (Tomoseis) and Satinder in conversation <strong>with</strong> <strong>Jerry</strong><br />
Spectroscopy, for measuring attenuation or Q of a small sample of<br />
rock in the lab at frequencies of 1000 Hz or so. This will provide<br />
some ground truthing for later being able to interpret the in situ<br />
attenuation data. We can also measure Q and velocity on irregularly<br />
shaped pieces of rock, like cuttings from a borehole. It is difficult<br />
to measure those in the lab even at high frequencies because of<br />
their irregular shape. We are looking for a technology that we can<br />
potentially locate at the well site, so that as the cuttings come out<br />
from the well, we can determine their acoustic properties. So, we<br />
spend most of our time working and thinking about numerical and<br />
physical models for attenuation in porous media, and how to<br />
process data to produce attenuation images.<br />
The other area where we have funding for is related to problems<br />
related to carbon sequestration, that is, using geophysical<br />
methods to monitor the injection of carbon dioxide in depleted oil<br />
and gas fields and aquifers. So, you might say that crosswell data,<br />
because the quality is so good, opens the door for a lot of basic<br />
research in terms of how waves propagate in porous media. I am<br />
spending more of my time looking at those basic issues than say<br />
specific applications.<br />
S: <strong>Jerry</strong>, what message do you have for young geophysicists<br />
entering our industry?<br />
JH: It is a question that I hear often. My response is that technology<br />
is important. They need to understand to some extent and<br />
not fear to use it when a problem calls for leading-edge technology.<br />
Moreover, they must support its development and think ahead<br />
longer term than just a few months. The majors need to be competitive<br />
and leaders in developing and applying technology, and<br />
should support research and education. Young geophysicists<br />
should follow their hearts in choosing a career path. They should<br />
build and basics and strive to be the best at what they do.<br />
S: <strong>Jerry</strong>, we thank you for sharing your experience and<br />
spending this time <strong>with</strong> us. We wish you good luck <strong>with</strong> your<br />
work.<br />
JH: I enjoyed it. Thank you R


