Mediterranean Action Plan
Mediterranean Action Plan
Mediterranean Action Plan

Create successful ePaper yourself
Turn your PDF publications into a flip-book with our unique Google optimized e-Paper software.
MAP<br />
<strong>Mediterranean</strong><br />
<strong>Action</strong> <strong>Plan</strong><br />
Energy and sustainable development<br />
in the <strong>Mediterranean</strong>:<br />
Proceedings of the Regional Workshop<br />
Monaco, 29 - 30 March 2007<br />
Energie et développement durable en Méditerranée:<br />
Actes de l’atelier régional<br />
Monaco, 29 - 30 mars 2007<br />
MAP Technical Reports Series No. 167
Note: The designations employed and the presentation of the material in this document do not imply the<br />
expression of any opinion whatsoever on the part of UNEP/MAP concerning the legal status of any State,<br />
Territory, city or area, or of its authorities, or concerning the delimitation of their frontiers or boundaries.<br />
Note: Les appellations employées dans ce document et la présentation des données qui y figurent<br />
n'impliquent de la part du PNUE/PAM aucune prise de position quant au statut juridique des pays,<br />
territoires, villes ou zones, ou de leurs autorités, ni quant au tracé de leurs frontières ou limites.<br />
© 2007 United Nations Environment Programme / <strong>Mediterranean</strong> <strong>Action</strong> <strong>Plan</strong> (UNEP/MAP)<br />
P.O. Box 18019, Athens, Greece<br />
© 2007 Programme des Nations Unies pour l'environnement / <strong>Plan</strong> d’action pour la Méditerranée (PNUE/PAM)<br />
B.P. 18019, Athènes, Grèce<br />
This publication may be reproduced in whole or in part and in any form for educational or non-profit purposes<br />
without special permission from the copyright holder, provided acknowledgement of the source is made.<br />
UNEP/MAP would appreciate receiving a copy of any publication that uses this publication as a source.<br />
This publication cannot be used for resale or for any other commercial purpose whatsoever without permission in<br />
writing from UNEP/MAP.<br />
Le texte de la présente publication peut être reproduit en tout ou en partie à des fins pédagogiques et non<br />
lucratives sans autorisation spéciale de la part du détenteur du copyright, à condition de faire mention de la<br />
source. Le PNUE/PAM serait reconnaissant de recevoir un exemplaire de toutes les publications qui ont utilisé ce<br />
matériel comme source. Il n’est pas possible d’utiliser la présente publication pour la revente ou à toutes autres<br />
fins commerciales sans en demander au préalable par écrit la permission au PNUE/PAM.<br />
ISSN 1011-7148 (Paper) 1810 - 6218 (Online)<br />
For bibliographic purposes this volume may be cited as:<br />
UNEP/MAP/BLUE PLAN: Energy and Sustainable Development in the <strong>Mediterranean</strong>: Proceedings of the<br />
Regional Workshop, Monaco, 29 - 30 March 2007. MAP Technical Reports Series No. 167. UNEP/MAP, Athens,<br />
2007.<br />
Pour des fins bibliographiques, citer le présent volume comme suit:<br />
PNUE/PAM/PLAN BLEU: Energie et développement durable en Méditerranée: actes de l’atelier régional, Monaco,<br />
29 - 30 mars 2007. No. 167 de la Série des rapports techniques du PAM, PNUE/PAM, Athènes, 2007.<br />
The thematic structure of the MAP Technical Series is as follows:<br />
• Curbing Pollution<br />
• Safeguarding Natural and Cultural Resources<br />
• Managing Coastal Areas<br />
• Integrating the Environment and Development<br />
La Série des rapports techniques du PAM est présentée avec la structure suivante:<br />
• Maîtriser la Pollution<br />
• Sauvegarder le Patrimoine Naturel et Culturel<br />
• Gérer les Zones Côtières de Manière Durable<br />
• Intégrer l’Environnement et le Développement
The work schedule was led and coordinated by <strong>Plan</strong> Bleu under the responsibility of<br />
Stéphane Quéfélec and with the assistance of Bassima Saïdi. The compilation and the page<br />
layout of the present publication was done at <strong>Plan</strong> Bleu by Christiane Bourdeau, Isabelle<br />
Jöhr, Hélène Rousseaux and Bassima Saïdi.<br />
<strong>Plan</strong> Bleu gives wholehearted thanks to all those who contributed to the successful<br />
development of the activities, more especially to the national experts who took part in the<br />
activities and who carried out studies, the regional experts who took part in the workshop<br />
and/or made studies, without forgetting the members of the pilot committee, especially<br />
Houda Allal (OME), Samir Allal (Versailles University), Frédéric Blanc (<strong>Mediterranean</strong><br />
Institute/FEMISE), Hélène Connor (HELIO International), Anne Ged (UMET), M. Harrouch<br />
(ANME Tunisia), Stéphane Pouffary (ADEME France), Francesco Presicce (IMET Italy) and<br />
the session chairpersons during the Monaco workshop, Stéphane Pouffary, Roberto Vigotti<br />
(OME) and Benaissa Ayadi (General Manager of ANME Tunisia).<br />
The information and remarks in this document do not reflect in any way the official point of<br />
view of the <strong>Mediterranean</strong> countries or that of the European Commission.<br />
Organised by:<br />
Organisé par:<br />
With the participation of:<br />
Avec la participation de :<br />
In partnership with<br />
En partenariat avec::<br />
With the financial<br />
support of:<br />
Avec le soutien<br />
financier de :<br />
MEDENER<br />
Italian Ministry for the<br />
Environment and<br />
Territory<br />
Institut de la<br />
Méditerranée<br />
FEMISE<br />
Le programme de travail a été conduit et coordonné par le <strong>Plan</strong> Bleu sous la responsabilité<br />
de Stéphane Quéfélec avec l'assistance de Bassima Saïdi. La compilation et la mise en<br />
forme de cette publication a été effectuée au <strong>Plan</strong> Bleu par Christiane Bourdeau, Isabelle<br />
Jöhr, Hélène Rousseaux et Bassima Saïdi.<br />
Le <strong>Plan</strong> Bleu remercie vivement l'ensemble des personnes qui ont contribué au bon<br />
déroulement des activités, en particulier les experts nationaux qui ont participé aux activités<br />
et réalisés des études, les experts régionaux qui sont intervenus dans les ateliers et/ou ont<br />
produit des études ainsi que les membres du comité de pilotage, en particulier Houda Allal<br />
(OME), Samir Allal (Université de Versailles), Frédéric Blanc (Institut de la<br />
Méditerranée/FEMISE), Hélène Connor (HELIO International), Anne Ged (UMET), Hamdi<br />
Harrouch (ANME Tunisie), Stéphane Pouffary (ADEME France), Francesco Presicce (IMET<br />
Italie) et les Présidents de séance lors de l'atelier de Monaco, Stéphane Pouffary, Roberto<br />
Vigotti (OME) et Benaïssa Ayadi (Directeur Général de l'ANME, Tunisie).<br />
Les informations et propos exposés dans ce document ne reflètent en aucun cas le point de<br />
vue officiel des pays riverains de la Méditerranée ni celui de la Commission européenne.
TABLE OF CONTENTS<br />
Executive summary……………………………………………………………………… 1<br />
Résumé exécutif ………………………………………………………………………… 3<br />
Summary report………………………………………………………………………….. 5<br />
Rapport de synthèse…………………………………………………………………….. 43<br />
National reports………………………………………………………………………….. 87<br />
Bosnia & Herzegovina………………………………………………………... 87<br />
Cyprus………………………………………………………………………….. 141<br />
Egypt………………………………………………………………….………... 229<br />
Israel……………………………………………………………………………. 305<br />
Italy……………………………………………………………………….…….. 341<br />
Libya……………………………………………………………………………. 371<br />
Malta……………………………………………………………………………. 413<br />
Morocco..………………………………………………………………………. 465<br />
Syria……………………………………………………………………………. 509<br />
Turkey……………………………………………………………………......... 571<br />
List of MAP Technical Series Reports / Liste des rapports techniques du PAM
Executive summary<br />
Due to the diverse economic foci of <strong>Mediterranean</strong> countries (importing or exporting,<br />
developed or developing), the region embodies the whole range of global energy<br />
issues: including increasing energy dependence, soaring energy prices, and<br />
increases in demand for energy, particularly significant on the southern and eastern<br />
rims. The region is particularly vulnerable to the impacts of climate change, whilst at<br />
the same time responsible for an increasing share of global greenhouse gas<br />
emissions.<br />
In this context: What is the current status of and what are the future scenarios for<br />
trends in regional energy issues? Where does the region stand in regards to the<br />
objectives of the <strong>Mediterranean</strong> Strategy for Sustainable Development (MSSD)?<br />
What is the status of the region at the European level? What are the regional<br />
economic and financial issues related to the development of renewable energies<br />
(RE) and in endeavours to promote rational energy use (REU)? How developed are<br />
RE and REU policies in the various countries; what are the reported impediments<br />
and what solutions need to be implemented in the future? What are the views of civil<br />
society and international organisations on energy issues; and how do financial<br />
donors mainstream RE and REU in their programmes?<br />
These are a sample of the issues addressed in this publication, which consists of a<br />
summary report and national studies presented at the Regional Workshop of Experts<br />
on Energy and Sustainable Development in the <strong>Mediterranean</strong>, which took place in<br />
Monaco on the 29 th and 30 th March, 2007.<br />
1
Résumé exécutif<br />
Du fait de la diversité des situations des pays méditerranéens (pays producteurs,<br />
importateurs, développés et en développement), la région concentre à elle seule<br />
l’ensemble des problématiques énergétiques mondiales : croissance de la<br />
dépendance énergétique, contraintes dues à l’envolée du prix de l’énergie et<br />
croissance, particulièrement forte sur la rive Sud et Est, de la demande d’énergie. En<br />
outre, l’ensemble des pays méditerranéens fait face aux défis du changement<br />
climatique du fait de la vulnérabilité de la région à ses effets et de sa part croissante<br />
dans les émissions mondiales de gaz à effet de serre.<br />
Dans ce contexte : comment évoluent et évolueront les grandes tendances<br />
énergétiques régionales ? Où en est la région au regard des objectifs de la Stratégie<br />
Méditerranéenne de Développement Durable ? Quelle est la situation au niveau<br />
européen ? Quelles sont les questions économiques et financières régionales liées<br />
au développement des énergies renouvelables et des actions d’utilisation rationnelle<br />
de l’énergie ? Quel est le degré de développement des politiques d’ER (énergies<br />
renouvelables) et d’URE (usage des énergies renouvelables) dans les pays, quels<br />
sont les obstacles observés et les solutions à mettre en œuvre pour le futur ? Quels<br />
sont les points de vue de la société civile, des institutions internationales, et comment<br />
les bailleurs de fonds prennent-ils en compte les ER et l’URE dans leurs actions ?<br />
Autant de questions qui sont analysées dans les études nationales et la synthèse de<br />
l’atelier régional d’experts qui a eu lieu à Monaco les 29 et 30 mars 2007 qui sont<br />
contenus dans ce CD-ROM.<br />
3
SUMMARY REPORT<br />
1. Introduction<br />
Summary Report<br />
Since the turn of this century, in the early 2000s, the issues of energy and climate change<br />
have been put at the top of political and economic agendas. There are many reasons for<br />
this : petrol prices went up by 2.5 between 2002 and the first four months of 2006, the<br />
problem of energy safety and of natural gas supply are under debate, the Kyoto Protocol<br />
came into force in 2005, the European carbon market has been open since January 2006,<br />
the Stern report published in 2006 alerts the public about the economic cost of climate<br />
change, private funds for renewable energy are increasing, equipment prices are going up<br />
due to demand, the latest IPCC reports confirm the worsening of the situation, and so on and<br />
so forth.<br />
Because of the diversity in the situations of the <strong>Mediterranean</strong> countries (producer countries,<br />
importing countries, developing and developed countries) the region in itself concentrates all<br />
of the worldwide energy issues: rise in energy dependence, constraints due to the soaring of<br />
energy prices, and increase in energy demand especially from the southern and eastern<br />
<strong>Mediterranean</strong> countries. Besides this, all of the <strong>Mediterranean</strong> countries are facing the<br />
challenge of climate change because of the vulnerability of this region to the effects of the<br />
latter as well as because of the region’s growing contribution to greenhouse gas emissions<br />
throughout the world.<br />
In such a context, in what way are the regional energy trends developing and continuing to<br />
develop, how far has the region gone in the direction of the MSSD objectives and what is the<br />
European situation like? What regional financial and economic issues are there in connection<br />
with the development of renewable energies and efficient energy and the possible effects of<br />
any entailing consequences? To what extent have renewable energy and efficient energy<br />
use policies been developed in the <strong>Mediterranean</strong> countries and what obstacles have been<br />
observed and what solutions have been implemented for the future? What is the opinion of<br />
the general public and of the international institutions, and to what extent do money-lenders<br />
take renewable energies and efficient use of energy into account in their investment<br />
activities?<br />
So many questions that were analysed during the 4 sessions of the regional expert workshop<br />
organised in Monaco from 29th to 30th March 2007, permitting a review of the work carried<br />
out since January 2006.<br />
The purpose of this document is to synthesise <strong>Plan</strong> Bleu activities during 2006-2007 on the<br />
topic of energy and to present the main conclusions of the Monaco workshop.<br />
The 19 tCO2 emitted for the organisation of the « Energy and climate change » regional<br />
workshop will be compensated by <strong>Plan</strong> Bleu so that the event will be neutral in terms of carbon.<br />
2. Mandate<br />
2.1 Context<br />
Energy is a priority issue for sustainable development in the <strong>Mediterranean</strong> that <strong>Plan</strong> Bleu, in<br />
its capacity as the forecast and observatory centre for the environment and development in<br />
the <strong>Mediterranean</strong> within the UNEP/<strong>Mediterranean</strong> <strong>Action</strong> <strong>Plan</strong> (MAP), has taken into<br />
account since it was set up.<br />
The third chapter of the « <strong>Plan</strong> Bleu – Future of the <strong>Mediterranean</strong> » report, published in<br />
1989, was devoted to the topic of energy.<br />
A more specific study of this issue, entitled « Energy and the <strong>Mediterranean</strong> Environment –<br />
stakes and prospects » was published by Economica in 1993 in the « <strong>Plan</strong> Bleu Booklets »<br />
series. The latter helped to clearly identify the trends observed as well as to consider the<br />
alternatives, for this key sector of activity, the evolution of which is marked by the real or<br />
5
6<br />
ENERGY AND SUSTAINABLE DEVELOPMENT IN THE MEDITERRANEAN<br />
probable risks that it imposes on the environment, not only locally but also regionally and<br />
throughout the world.<br />
The <strong>Mediterranean</strong> report: « A sustainable future for the <strong>Mediterranean</strong> – The <strong>Plan</strong> Bleu<br />
environment and development outlook», published in 2005, helped to set up new regional<br />
energy prospective for 2025. It warns of the hazards of the current baseline scenario and<br />
discusses the objectives, the benefits and the conditions possible in an alternative scenario.<br />
2.2 Partne rs<br />
Following the adoption of the <strong>Mediterranean</strong> Strategy for Sustainable Development (MSSD,<br />
2005), and at the request of the <strong>Mediterranean</strong> countries and of the Europe Union, <strong>Plan</strong> Bleu<br />
was, from 2006-2007, put in charge of implementing work to monitor-assess MSSD progress<br />
and to examine in more depth, as of 2006, the priority topic « Energy and climate change »<br />
and to organise an experts’ workshop on the issue of energy efficiency and renewable<br />
energies<br />
One of <strong>Plan</strong> Bleu’s first tasks was to find competent partners in the field of « energy and<br />
climate change » in order to set up a pilot committee.<br />
The project, coordinated and led by <strong>Plan</strong> Bleu, was carried out in partnership with the<br />
<strong>Mediterranean</strong> networks and institutions specialised in energy: the OME (<strong>Mediterranean</strong><br />
energy observatory), MEDENER, ADEME, the MEDREP programme (The <strong>Mediterranean</strong><br />
Renewable Energy Programme). The <strong>Mediterranean</strong> institute/FEMISE and the CAR/PP in<br />
Barcelona also contributed to the activity. The NGO HELIO International also took part in the<br />
work and synergies were found with UMET (<strong>Mediterranean</strong> Summer University). These<br />
partners worked together as a technical pilot committee for the activities.<br />
The ADEME and the Italian Ministry of the Environment, territories and the sea also<br />
participated financially in the activities. The Principality of Monaco welcomed and partially<br />
funded the workshop.<br />
2.3 Objecti ve s of acti vi t ies<br />
Objectives of <strong>Plan</strong> Bleu activities in the field of « energy – climate change » are to support<br />
the MCSD to:<br />
produce information easing the follow-up and the implementation of the MSSD and NSSD<br />
in the field of « energy – climate change »;<br />
speed up the implementation of proactive policies regarding RUE and the development of<br />
RE by pointing out the advantages connected to their development (economic, social and<br />
environmental ones);<br />
identify the cut-off points, or quite the reverse, the existing levers (or potential ones) in the<br />
countries policies, at the national, local and international cooperation levels, to achieve<br />
progress towards the MSSD;<br />
follow the evolutions of the region and of the countries regarding the objectives and<br />
orientations of the MSSD;<br />
obtain information at three levels : regional, national and local.<br />
2.4 The acti vi ti es<br />
All of the activities (see Figure 1 and Attachment I) carried out since January 2006 led to<br />
discussions during the regional workshop organised in Monaco between 29th and 30th<br />
March 2007.<br />
The purpose of the workshop was:<br />
To examine the situation of the region in terms of the promoting of efficient energy use<br />
(EE) and of renewable energies (RE);<br />
To examine the economic and environmental stakes connected with them and to comment<br />
on the experiments undertaken in some <strong>Mediterranean</strong> countries;<br />
To address the recommendations to the <strong>Mediterranean</strong> Commission for Sustainable<br />
Development and to decision-makers.
Summary Report<br />
50 experts took part in the activities of the workshop and the latter brought together about 40<br />
of them (list of participants in Attachment 2), political and academic representatives,<br />
representatives from the private sector and associations, NGOs, investors, and international<br />
institutions. 12 <strong>Mediterranean</strong> countries were represented: Morocco, Tunisia, Libya, Egypt,<br />
Israel, Cyprus, Malta, Bosnia-Herzegovina, Italy, Monaco, France and Spain.<br />
The workshop activities were based on the national reports carried out in volunteer countries,<br />
regional studies, the results of the sub-regional workshop on the Clean Development<br />
Mechanism (CDM) and on the communications from regional experts (see Figure 1).<br />
The workshop programme is in Attachment 3.<br />
In order to distribute the information and documents produced during these activities, a<br />
series of Internet pages was created on the <strong>Plan</strong> Bleu website and can be consulted at the<br />
following address: http://www.planbleu.org/themes/energie_progr_travail2006_07.html .<br />
Box 1 Sub-regional workshop, national studies, regional studies and communications presented during<br />
the workshop<br />
1 Sub-regional workshop: «CDM in the southern <strong>Mediterranean</strong> countries, strengths and<br />
weaknesses, challenges and prospects – links with EE and RE projects » organised by <strong>Plan</strong><br />
Bleu and UMET in Paris in May 2006. The purpose of this workshop was to assess CDM in<br />
the region, to amalgamate experience in the field of carrying out of CDM projects, and to<br />
decide together how to make CDM projects operational and to learn from them so that the<br />
region can benefit fully from these projects. This workshop gathered together 25 experts from<br />
the northern and southern <strong>Mediterranean</strong> countries. It led to the drawing up of a summary<br />
report available in Attachment 5.<br />
12 national reports on the theme «energy efficiency and renewable energies» were drawn up:<br />
Morocco, Tunisia, Libya, Egypt, Israel, Syria, Turkey, Bosnia-Herzegovina, Spain, Italy,<br />
Cyprus and Malta.<br />
3 regional studies were carried out in the <strong>Mediterranean</strong>. They dealt with the issues of the<br />
main recent energy trends, as well as with those to come, with the cost and the lack of action<br />
in the direction of renewable energies and efficient energy use and the place and the role of<br />
development aid in RE and EE in the <strong>Mediterranean</strong> region.<br />
6 specific communications were presented during the Monaco workshop, in order to add to<br />
the viewpoints and experience sharing, by representatives of international organisations<br />
(UNEP/DTIE, IEA, EEA), of a bilateral money-lender (French Development Agency), of the<br />
finance sector (Caisse des Dépôts et consignations) and from civil society (NGO HELIO<br />
International).<br />
3. Regional context: energy situation<br />
Energy trends observed in the region and in the EU, energy challenges the region is facing<br />
and the region’s situation with regard to the objectives of MSSD were the object of in-depth<br />
presentations during the Monaco workshop. The <strong>Mediterranean</strong> Energy Observatory<br />
presented the latest available figures on the trends observed and on forecasts for 2020<br />
(baseline scenario) as well as evolution in the necessary facilities. The main items of the<br />
presentations are looked at below.<br />
7
8<br />
(Mtoe)<br />
1400<br />
1200<br />
1000<br />
800<br />
600<br />
400<br />
200<br />
0<br />
ENERGY AND SUSTAINABLE DEVELOPMENT IN THE MEDITERRANEAN<br />
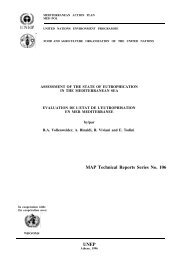
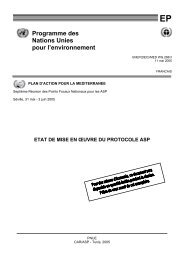
Trends in primary energy demand. Source: OME.<br />
SEMCs<br />
NMCs<br />
1971-2000<br />
Avg. growth per year<br />
Total MED. 2.6%<br />
NMCs 2%; SEMCs 5.5%<br />
12%<br />
88%<br />
Source: OME<br />
Trends in primary energy demand<br />
17%<br />
83%<br />
2000-2005<br />
Avg. growth per year:<br />
Total MED. 2.3%<br />
NMCs 1.9%; SEMCs 3.1%<br />
23%<br />
77%<br />
27%<br />
73%<br />
2005-2020<br />
Average growth per year:<br />
Total MED. 2.4%<br />
NMCs 1.3%; SEMCs 4.8%<br />
1971 1980 1990 2000 2005 2010 2020<br />
3.1 Stakes and challenge s: ene rg y a t t he centre of t he<br />
c onc erns about sus tainable de velopme nt<br />
Energy comes from natural resources (minerals, plants, wind, sun, and so on) and<br />
constitutes one of the essential supports for all human activity and economic development;<br />
the use of energy generates effects that are more or less immediate on environments,<br />
climates and health (greenhouse gas effects, air pollution, respiratory diseases, oil spill,<br />
hazardous waste, land use, and so on). Classical energy systems (production/extraction,<br />
transport, storage, distribution and consumption) often require considerable investment<br />
giving long term commitments that makes a certain inertia to the sector; a growing share of<br />
the energy consumed comes from trade and this poses the problem of energy safety for the<br />
countries and of their vulnerability to price increases.<br />
The choice of what sort of energy to use therefore requires reflection about their long-term<br />
effects and should take into account the sharing of responsibilities and costs among<br />
generations and populations.<br />
The energy situation in the <strong>Mediterranean</strong> countries illustrates this inter-dependence very<br />
clearly.<br />
Indeed, the energy system in the <strong>Mediterranean</strong> is characterised by: (i) its vulnerability,<br />
especially with regard to price and supply; (ii) the inequalities in natural endowments, access<br />
and consumption and (iii) the sometimes irreversible damage caused to the environment and<br />
to human health. This energy development model has now reached its limits and is<br />
incompatible with the objectives of sustainable development.<br />
If the trends observed over the last thirty years continue, total primary commercial energy<br />
demand in the <strong>Mediterranean</strong> region could go up from 945 Mtep to 1357 Mtep between 2005<br />
and 2020 (see graph), i.e. an increase of 44% in 15 years, and 83% of demand would be met<br />
by fossil energies (see Figure 2).<br />
Thus it is essential to meet the growing energy needs of the <strong>Mediterranean</strong> countries,<br />
connected with the rising economic and demographic growth, while not aggravating impact<br />
on the local and global environment (greenhouse gases) and at the same time to gain in<br />
competitiveness by controlling consumption, with energy savings and by using renewable<br />
energy resources in a <strong>Mediterranean</strong> market that is more and more free, open and<br />
competitive and this within the international energy context that is more and more volatile<br />
and uncertain.<br />
<strong>Plan</strong> Bleu’s alternative energy scenario («A sustainable future for the <strong>Mediterranean</strong> – The<br />
<strong>Plan</strong> Bleu environment and development outlook», 2005 report) gives an answer by<br />
demonstrating the environmental, social and economic relevancy of large development of<br />
renewable energies in the region (endowed with one of the greatest potential sources in the<br />
world) associated with massive energy savings (energy waste is between 20 and 50% of<br />
28%<br />
72%<br />
32%<br />
68%<br />
40%<br />
60%
Summary Report<br />
consumption depending on the country). Even if the <strong>Mediterranean</strong> countries are in different<br />
situations and have different priorities, they all have some scope to improve energy<br />
efficiency, to strengthen the safety of supply and to contribute to more sustainable energy<br />
development in the region. This leeway could be uncoupled in the framework of regional<br />
cooperation.<br />
This scope has to be a direct answer to the energy development challenges the region itself,<br />
the Euro-<strong>Mediterranean</strong> region and its immediate neighbours are facing, i.e.:<br />
Ensuring the sustainability of supplies,<br />
Reducing local, regional and global pollution linked to energy consumption,<br />
Enabling access to energy and energy services,<br />
Improving of energy efficiency.<br />
The decisions taken in the coming years are directly linked to the social, economic and<br />
environmental stakes that will determine the <strong>Mediterranean</strong> region’s future: climate change<br />
(see Box 3) and the effects of the energy system on biodiversity and health, macro-economic<br />
stability, competitiveness of economies and social and individual welfare. The geo-political<br />
stakes and safety of the region can be added to this.<br />
Box 2 Some energy trends in the <strong>Mediterranean</strong><br />
In 2005 the <strong>Mediterranean</strong> countries consumed 8% of the world energy supply. Energy demand<br />
was met by fossil energy for the most part and, if trends continue, mort than 80% of energy<br />
consumption could be fossil energy (petrol, gas, coal) by 2020.<br />
One of the key factors for the rise in energy demand (in the north and in the south) is electricity<br />
consumption. The OME forecasts that it will be 1000 TWh higher than 2005 levels by 2020. In the<br />
southern and eastern countries, 40% of the rise in energy use is due to electricity.<br />
In order to produce electricity, all the countries currently use natural gas except for Malta and<br />
Cyprus. If trends continue it will be more and more used to produce the necessary electricity,<br />
accelerating its contribution to the energy mix to the detriment of petrol. 26% of the energy was<br />
produced from gas in 2005 and the OME forecasts that this share will be 41% by 2020. Gas has<br />
the advantage of emitting less CO2 than petrol but this type of energy is still an expensive item in<br />
transport costs. Nevertheless, in order to meet needs, an increase in gas facilities can be<br />
observed especially in Egypt, Libya and Algeria.<br />
Other facilities are being put in place such as electric interconnections, considered necessary to<br />
optimise electricity supplies in the southern and eastern <strong>Mediterranean</strong>. There are 3 separate<br />
installations today (west, south-east and Turkish) that should be connected by electricity<br />
networks in 2007 and 2008.<br />
Petrol is used as a gap-fill; it is used as a basic energy. Petrol-consumption will increase but its<br />
share in the energy balances will go down. In the future it could be consumed together with biofuels.<br />
Coal consumption should go down in the north.<br />
Box 3 Climate change: a n undeniable fact, at great cost - throughout the WORLD -<br />
Climate change has become an undeniable fact, scarcely questioned these days. The year 2006<br />
was considered as the hottest year ever recorded. The average temperature on the earth’s<br />
surface was 0.42° C higher than the average temperature recorded between 1961-1990 (14°C).<br />
It has been proved that this evolution is due especially to an accumulation of greenhouse gases<br />
linked to human activities. The Earth’s climate is changing rapidly and some of the impact of<br />
climate change is intensifying this. Extreme weather-related events (Katrina in the USA,<br />
devastating cyclones in other regions and alterations at both poles) are alerting public opinion.<br />
Huge biological, economic and human losses could result from this.<br />
The International Energy Agency forecasts that if the observed trends continue, CO2 emissions<br />
will increase by 55% between 2004 and 2030 (Source: IEA, World Energy Outlook 2006).<br />
The report drawn up by Nicholas Stern on the consequences of climate change has established<br />
the fact that immediate and coordinated intervention by all the international players would bring<br />
9
10<br />
ENERGY AND SUSTAINABLE DEVELOPMENT IN THE MEDITERRANEAN<br />
benefits far beyond the savings made by refusing to act. Indeed, climate change would not just<br />
have effects on the environment, but also on human life, access to drinking water and agriculture.<br />
The economic models used by Nicholas Stern demonstrate an annual drop of 5% in GDP<br />
worldwide if we continue to ignore the situation. On the other hand, fast action would lead to only<br />
a 1% drop.<br />
The main conclusions of the last IPCC report (January 2007) show a worsening of the diagnosis<br />
compared to the 2001 report. According to this report, an increase in greenhouse gas effects<br />
since the start of the industrial revolution in 1750 is now an established fact without ambiguity.<br />
Warming would be between 1.1 and 6.4 degrees in the period under consideration (1980-1999)<br />
and the end of the XX1st century (2090-2099). The report points out the recent acceleration of<br />
this phenomenon and forecasts a worsening of the situation if nothing is done to reduce<br />
greenhouse gases.<br />
… and in the <strong>Mediterranean</strong><br />
The <strong>Mediterranean</strong> will be particularly affected. An average hypothetical warming of 1°C<br />
worldwide would mean for the <strong>Mediterranean</strong> (i) warming between +0.7°C and +1.6°C,<br />
depending on areas, (ii) changes in rainfall implying more drought in the south and flooding and<br />
landslides in the north and (iii) increase in extreme weather phenomena such as summer<br />
droughts, heat waves, floods, mud slides, and so on. Specific types of impact on the water cycle,<br />
marine and land eco-systems, biodiversity, agriculture and coastal areas are expected in the<br />
<strong>Mediterranean</strong> 1 . Great biological, economic and human losses are likely. This is the conclusion of<br />
a <strong>Plan</strong> Bleu study in January 2002.<br />
The financial impact of climate change can already be calculated: the heat wave in the summer<br />
of 2003 in Europe cost over 10 billion euros (for comparison purposes, the GDP of Malta was<br />
about 6 billion in 2003). In France, the economic cost of drought between 1989 and 2004 was 4<br />
billion euros (especially because of damage to buildings constructed without adequate<br />
foundations on clay soil) 1.5 billion of which was for the heat wave of 2003 2 .<br />
Energy consumption is one of the main factors (together with increases in transport) that explain<br />
global warming. Energy is responsible for 80% of all the greenhouse gas effects in the EU 3 ; this<br />
share is comparable in many of the southern and eastern <strong>Mediterranean</strong> countries.<br />
3.2 Regional answ ers: the energy o b jecti ve s of the MSSD and<br />
o f the EU<br />
The <strong>Mediterranean</strong> does not control its increase in energy consumption, essentially fossil<br />
energy, thus adding to the carbon intensity of the economies and increasing the region’s<br />
responsibility for its share in the worldwide emissions of CO2; it is a region that is particularly<br />
vulnerable to climate change effects while, on the other hand, it is endowed with an<br />
enormous potential of renewable energies and it could reduce its consumption greatly by<br />
efficient energy use; all the technologies are available in the north and there are many<br />
possibilities in the south and east.<br />
In response to this paradox, the contracting parties to the Barcelona Convention adopted the<br />
<strong>Mediterranean</strong> Strategy for Sustainable Development (MSSD) in 2005, the second priority<br />
action of which is to ensure sustainable energy management, to reduce the effects of climate<br />
change and to adapt to them, and proposed 5 main objectives:<br />
Promoting energy efficiency<br />
Valorising the potential of renewable energies<br />
Controlling, stabilising and reducing greenhouse gas emissions<br />
Including measures for adapting to climate change in the major objectives of national<br />
development plans<br />
Increasing access to electricity in rural areas<br />
1<br />
“Status of knowledge on Global Climatic Change: regional aspects and impacts in the <strong>Mediterranean</strong> basin”: <strong>Plan</strong> Bleu study,<br />
Medias, 2001 www.planbleu.org.<br />
2<br />
Parliament office for assessment of scientific and technological choices, report on the contribution of science and technology<br />
to sustainable development, volume 1: “Climate change and transition of energy: going beyond the crisis”, June 2006.<br />
3<br />
Source : EEA, 2006.
Summary Report<br />
The MSSD proposes two calculated objectives desirable by 2015:<br />
Reducing energy intensity by 1 to 2% per annum<br />
Having a 7% share of renewable energies (excluding CWR) in energy demand<br />
The text from the « Energy and climate change » chapter of the MSSD can be seen in<br />
Attachment 4.<br />
The situation of the region with regard to the objectives of the MSSD is shown in Box 6, page<br />
15 and in Attachment 7 via the monitoring indicators.<br />
Box 4 Situation and objectives of the European Union<br />
Over the last decade, energy intensity throughout the EU has gone down, while total energy<br />
consumption has risen significantly. Demand is still mainly met by fossil energy. There are now<br />
targeted objectives for RE but their share in the energy balance remains small, about 6% and<br />
they are increasing in a limited way (+3.6% between 1999 and 2003). Even if a strong rise in<br />
wind energy has been observed in the last few years, the most important renewable energy<br />
source in Europe is biomass (66.5%), followed by hydroelectric (24.1%). Bio-fuels only contribute<br />
2% to the decrease in energy intensity because they are little used.<br />
The increase in the share of natural gas to the detriment of petrol in the energy mix has brought<br />
about a decrease in CO2 emissions, but the increase in demand is such that this has been more<br />
than compensated for. European Commission scenarios estimate a possible reduction of<br />
between 35% and 45% in CO2 emissions by energy-saving measures. Some of these measures<br />
are simple such as replacing traditional light bulbs with low consumption ones.<br />
In the context of climate change, the energy issue is being examined more closely. The council of<br />
European energy ministers brought out several themes and decisions on the policy of<br />
coordinating supply, greenhouse gases, energy efficiency, the necessity for a credible<br />
cooperation policy and an action plan for RE for the period 2007-2009. This plan sets objectives<br />
by creating or by modifying European directives. The <strong>Mediterranean</strong> countries, members of the<br />
EU, are obliged by the recent decisions of the European Council to make 20% energy savings<br />
and to have a 20% share of RE in the European energy consumption by 2020. The<br />
<strong>Mediterranean</strong> countries in the European Union have for the most part commitments to the Kyoto<br />
Protocol to reduce or control their greenhouse gas emissions.<br />
Discussions have shown that the interest of energy efficiency by promoting renewable<br />
energies is virtually uncontested in the region. Regional objectives in this area exist, but they<br />
still have to be determined nationally and the determining of objectives per sector of activity<br />
is still an open debate.<br />
It has been mentioned that R&D expenditure on RE and EE is insufficient. R&D budgets in<br />
the EU in the energy field in general increased by 34% between 1990 and 2003 according to<br />
the EEA, mostly for nuclear fission. The EU budgets for RE have risen less rapidly (+10% in<br />
the same period). From the discussions, it can be concluded that the low level of R&D in RE<br />
in the <strong>Mediterranean</strong> illustrates a lack of coherence between fiscal policies, supply costs and<br />
research and that the transfer of technologies should be developed more. International<br />
cooperation is one of the main goals of the EU. Yet, although the water initiative is bearing<br />
fruit, it is not the case for energy.<br />
If industrialists are to commit themselves to producing RE equipment, clear changes have to<br />
be made in the policies. Long term vision would help to reduce the delay of the industrial<br />
sector in meeting demand for equipment, and commitment by the financial world would<br />
constitute a key factor of success.<br />
Finally, construction and transport have been unanimously identified as the two sectors<br />
where energy challenges will be of the greatest importance during this century. The building<br />
industry is a particularly strategic one because any mistakes made today in construction will<br />
have long term effects on consumption. It is therefore essential to target action sector by<br />
sector. Finally, all of the participants agreed that communication is still a major challenge to<br />
win the fight.<br />
11
12<br />
ENERGY AND SUSTAINABLE DEVELOPMENT IN THE MEDITERRANEAN<br />
4. Regional framework: economic issues<br />
Economic and financial questions linked to the development of renewable energies and<br />
action in favour of energy efficiency, as well as the effects of trials connected to this were<br />
discussed in the second session of the Monaco workshop.<br />
This session also aimed at discussing the financial aspect, often brought forward as an<br />
explanation for the slow development of RE and EE.<br />
The initial results of two regional studies were presented. One was an assessment of the<br />
cost of non action in favour of renewable energies and energy efficiency (application to<br />
Morocco’s case). The other was on the taking into account of renewable energies and<br />
energy efficiency in official development assistance (international aid) for the <strong>Mediterranean</strong>.<br />
The question of financing RE and EE was also brought forward in a contribution on « carbon<br />
credits » and the using of the Clean Development Mechanism (CDM) in the <strong>Mediterranean</strong> to<br />
incite private foreign direct investments in technologies with few greenhouse gas emissions.<br />
Finally, spin-off from trials with solar energy water heaters on the Tunisian economy was also<br />
presented (example cited in le & 6.1).<br />
4.1 The economic cos t o f non - action conc erning RE and EE<br />
This study is aimed at showing the short term economic interest (5 to 10 years) of the<br />
countries to committing themselves to reaching the regional objectives of MSSD. The macroeconomic<br />
effects of various energy strategies were analysed by putting them in the context<br />
of the main economic constraints of the southern and eastern <strong>Mediterranean</strong> countries<br />
including employment (and, therefore, growth), the budget equilibrium and the balance of<br />
payments. With this in mind, a simulation tool was put in place in the framework of the study<br />
and applied to the situation in Morocco. Simulations were carried out and an assessment of<br />
the amount of the energy bill was estimated according to the various energy strategies<br />
(including the development of RE and EE).<br />
In each of the simulations, the objective was to compare the total cost if ambitious RE and<br />
EE strategies are set up with the total cost if current trends continue. This helps to give an<br />
answer to questions of the type « how much will the gain be in millions of US dollars from<br />
action to improve energy efficiency by 1% per annum over 10 years? This gain could also be<br />
referred to as « cost of a non action », i.e. the cost of the non-integration of EE action. The<br />
interest of this type of exercise also resides in the fact that the gain can be compared to the<br />
costs of the measures to be taken to get there.<br />
Several simulations were made for Morocco for the period 2005-2015 and presented during<br />
the Monaco workshop.<br />
The initial results demonstrate that the most important potential economic gain would be in<br />
energy efficiency improvement for households and in transport. Identical improvement in<br />
energy efficiency in industries would also give interesting results: they would be about 511<br />
millions US dollars for the last three years of the period under consideration, i.e. 2013-2015.<br />
This amount is comparable to that of the compensation fund in Morocco {compensation of<br />
the differential of the international energy prices (petrol-related products) compared to the<br />
domestic price} for 2007 i.e. about 700 million US dollars, all things being equal. This budget<br />
is a heavy burden for government spending, as many press items explain regularly.<br />
Scenarios bringing the loss rate down (production and distribution) from 16 to 10% and<br />
integrating a higher input of renewable energies would give a lower potential saving.<br />
Thus, the first calculated results estimated for Morocco show that there could be a big<br />
financial potential by integrating RE and EE in the countries. The discussions confirmed the<br />
importance of presenting the expected benefits from renewable energy and energy efficiency<br />
action in monetary values and, therefore, to continue this work.
Summary Report<br />
4.2 Clean De velopment Mecha nism, evo l u t ion o f carbon<br />
m arkets and implication fo r the Me di terranean countries<br />
Box 5 Clean Development Mechanism<br />
The Clean Development Mechanism (CDM) is one of the three flexible mechanisms put in place<br />
in the framework of the Kyoto Protocol (KP). In the current international agreements concerning<br />
the climate, it is the only instrument that links the Annex 1 countries, i.e. those countries who<br />
have committed themselves to capping emissions, and the developing countries which, by<br />
ratifying the Kyoto Protocol, have not made commitments. This mechanism permits the crediting<br />
of emission reductions obtained in developing countries and the repatriating of these credits to<br />
the developed countries or to those in transition. On one hand, they make it easier for the Annex<br />
1 countries to reach conformity and, on the other hand, they send price signals to developing<br />
countries who can, if they manage to valorise the credits generated from their territory, find<br />
additional funds for development. Finally, in order to benefit from credits, the countries must use<br />
technologies with little carbon content, leading to the « clean » development of the countries<br />
concerned.<br />
The countries around the <strong>Mediterranean</strong> include Annex 1 countries, as well as non-Annex 1<br />
countries. It is, therefore, a geographical area in which regional cooperation for clean<br />
development can play an important role both to help the European countries to meet their<br />
own Kyoto objectives and to enable access by the southern <strong>Mediterranean</strong> countries to<br />
better performing, clean technologies.<br />
The discussion was partially based on the results of the sub-regional workshop organised in<br />
Paris on 5th May 2006 in the framework of a <strong>Plan</strong> Bleu/<strong>Mediterranean</strong> summer university<br />
(UMET) partnership. The summary report on this workshop is attached in Attachement 5. It<br />
analyses the reasons for the poor appeal of the region for the CDM (some progress was<br />
mentioned during the discussions), identifies the constraints and strong points for the<br />
regional institutions in the implementing of CDM in the region, analyses ways to accelerate<br />
CDM in the region. The conclusions demonstrate that apart from some pro-activity in the<br />
region (as already observed in Tunisia) where a task force has been set up to identify<br />
projects), the current situation could be positive for the region.<br />
During the Monaco workshop, emphasis was placed on the fact that the recent European<br />
carbon market could be used to valorise CDM projects. For the moment, 87% of the trading<br />
of the values made on the carbon credit markets takes place on the European market,<br />
making it the largest in the world. It is also the financial instrument that could be used to<br />
reach the EU objective of a 20% reduction in greenhouse gas emissions (while for the RE<br />
20% objective there is no comparable instrument). Its proximity could be an advantage<br />
especially as the potential purchasers of CDM are mainly in Europe, as well as in Japan.<br />
Changes in the situation in the USA could be another important factor for the future of carbon<br />
credits. Public opinion in the US is undergoing change, the business world is anticipating<br />
carbon problems and action groups are being formed in the various states concerning<br />
legislation. The existing markets and mechanisms could be linked together in the future to<br />
form a global carbon market.<br />
In the medium to long term the energy debate will depend more and more on greenhouse<br />
gas effects. Carbon credits will have a big role to play and the countries that have already<br />
acquired knowledge of the mechanisms of this type of market will have a comparative edge<br />
to put to their advantage.<br />
4.3 Renew able energies and ene rgy e f f icienc y i n de ve l opme nt<br />
aid in t he Me di terra nean re gi on<br />
An analysis of the data base of the OECD Development Aid Committee gave an inventory of<br />
to what extent RE and EE have been taken into account in the development aid received by<br />
the region.<br />
Many donor countries are still far from the objective of 0.7% of the GDP for development aid<br />
purposes. In 2005 worldwide development aid reached a peak, but a high share of the<br />
13
14<br />
ENERGY AND SUSTAINABLE DEVELOPMENT IN THE MEDITERRANEAN<br />
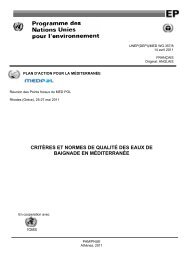
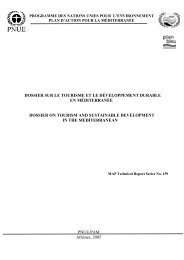
amounts were for refunds of Iraq and Nigeria’s debts. Flows of development aid to the<br />
energy sector are low compared to the total amount of development aid received in the<br />
<strong>Mediterranean</strong> (about 7 to 8%). However, there was a recent tremor in development aid for<br />
actions related to sustainable energy strategy between 2003 and 2004.<br />
10000<br />
9000<br />
8000<br />
7000<br />
6000<br />
5000<br />
4000<br />
3000<br />
2000<br />
1000<br />
0<br />
APD/AP et APD/AP secteur énergie aux pays<br />
méditerranéens 1995-2004<br />
(millions de dollars)<br />
APD/AP<br />
APD/AP Energie<br />
1995 1996 1997 1998 1999 2000 2001 2002 2003 2004<br />
1600<br />
1400<br />
1200<br />
1000<br />
800<br />
600<br />
400<br />
200<br />
APD/AD reçue par les pays méditerranéens - Secteur<br />
Energie, URE & ER (Millions USD constants)<br />
APD/AP Energie<br />
APD/AD URE<br />
APD/AD ER<br />
0<br />
1974 1977 1980 1983 1986 1989 1992 1995 1998 2001 2004<br />
Source: OECD/DAC/CRS database, 2006<br />
The « energy » development aid funds devoted to energy efficiency action are not easy to<br />
identify in the OECD database; estimations seem to indicate that this field mobilises fewer<br />
donors than for renewable energies. <strong>Mediterranean</strong> cooperation, on the other hand, (donors<br />
in the north and beneficiaries in the south) is stronger in this area than for renewable<br />
energies: in the period 1995-2004, 24% of the total development aid actions for EE in the<br />
<strong>Mediterranean</strong> came from the northern <strong>Mediterranean</strong> countries, and only 15% of the action<br />
was for RE. In the latter area of activity Germany and Japan intervene the most bilaterally.<br />
Nevertheless, it is a fact that development aid needs are still considerable in all areas and<br />
well beyond the current available amounts and that cooperation in managing energy demand<br />
and renewable energy is still too little in comparison with the needs. Besides this,<br />
development aid for renewable energies is concentrated on wind energy for 80% and<br />
German aid for renewable energies is mainly concentrated in Egypt and Morocco (about<br />
40% of the total development aid for renewable energies in the southern and eastern<br />
<strong>Mediterranean</strong> countries).<br />
From a qualitative point of view, <strong>Plan</strong> Bleu wrote in 2004 : “…development aid for RE and EE<br />
is characterised by a multitude of isolated projects that are not structurally satisfactory in the<br />
long term“; a review of the projects carried out in the years 2000 show that “stop and go”<br />
actions have not disappeared and that there is a lot of waste associated with them; finally,<br />
demand from potential beneficiary countries could also ot be oriented in priority toward RE<br />
and EE action.<br />
Nevertheless, progress has been made. Beneficiary countries integrate more donors’ actions<br />
in their national development plans, the donors use their funds in partnership with national<br />
state and private funds, actors orient actions more toward programmes than projects. In<br />
Morocco, for instance, this can be observed in the context of rural electrification programme<br />
(PERG) and in Tunisia in the solar thermal energy programme, with development aid as well<br />
as regional and national support. In these cases, development aid is an initiator and is<br />
included in financial set ups involving national state and private funds in medium-term<br />
strategies; these examples of public and private partnerships, both national and international,<br />
illustrate the important role of international cooperation to finance part of the initial burden for<br />
RE and EE.<br />
Discussions have demonstrated that progress still has to be made to improve the efficiency<br />
of such tools as Development Aid and Clean Development Mechanisms in the area of RE<br />
and EE in the <strong>Mediterranean</strong> countries. The CDM, for example, only concerns a small part of<br />
the <strong>Mediterranean</strong> region, even if, contrary to some other parts of the world, it is not just<br />
marginally interested in RE and EE. Because of a lack of demand, development aid is rarely<br />
aimed at renewable energies and energy efficiency, even if operations like those developed<br />
in Tunisia for solar powered water heaters have given satisfactory results on a modest scale.
Summary Report<br />
The resources saved by the countries themselves by improving energy efficiency will no<br />
doubt in the long term prove to be the main available resource.<br />
The speeches made during the opening session of the EVER2007 4 event demonstrated that<br />
the private sector, especially banks, is now ready to act. This illustrates the big changes that<br />
have taken place since the start of the years 2000, when private banks were still reluctant to<br />
propose investment funds to their clients for RE and EE. This change is largely due to a<br />
legislative and institutional framework for such investments.<br />
Progress in the setting up of this framework in the <strong>Mediterranean</strong> countries was the main<br />
item of discussion in the third session, based on the results of national studies.<br />
5. National reports on energy efficiency and renewable energies<br />
5.1 Context, objecti ves and na ti o na l re port specifications<br />
The MSSD is a “framework strategy” designed to help the countries develop their own<br />
national and sectoral strategies for sustainable development (SNDD). It can also help keep<br />
them up to date, as each country is naturally responsible for setting its own specific<br />
objectives.<br />
<strong>Plan</strong> Bleu has been requested to follow up the <strong>Mediterranean</strong> Strategy for Sustainable<br />
Development and to deeper analyse “energy – climate change” priority field from 2006-2007<br />
onwards. The Centre will have to gather, document and disseminate a set of indicators,<br />
deepen analyses and identify good practices. The work has to be undertaken with the<br />
voluntary countries, the EU institutions and partners and regional initiatives in the “energy –<br />
climate change” field.<br />
The works undertaken on the MSSD account are closely hinged on those conducted on the<br />
international level, in particular those programmed by the United Nations Commission on<br />
Sustainable Development whose 2006-2007 cycle (CSD 14 and CSD 15) deals in particular<br />
with “climate change and energy resources for sustainable development”.<br />
<strong>Plan</strong> Bleu invited the <strong>Mediterranean</strong> rim countries to produce national reports about energy<br />
and climate change following given specification. Those reports have two principle<br />
objectives:<br />
1) To provide information on the country’s situation and observed evolution, progress made<br />
or foreseen in terms of energy efficiency and renewable energy, tools implemented and<br />
examples of good practice. To contribute to the <strong>Mediterranean</strong> reflection, to the sharing<br />
of experiences, and to enrich the respective experiences of the countries.<br />
2) To raise awareness of the needs to get involved/engaged/committed in ambitious RUE<br />
and RE development objectives, to implement specific tools and to take into<br />
consideration the relevant benefits that would arise. If needed offering assistance to<br />
countries in developing the energy section of their national sustainable development<br />
strategies and selecting monitoring indicators and enabling their energy policies to<br />
evolve positively.<br />
To reach the objectives, the reports were to develop forecasts about the risks connected with<br />
the expected and planned changes, baseline changes, as well as directions that could be<br />
proposed in the context of stronger renewable energy and energy efficiency programmes<br />
with possibly stronger objectives, the main obstacles to be overcome, the instruments and<br />
investments to be implemented and social, economic and environmental benefits that could<br />
result from this.<br />
The reports also had to present between two and five case studies demonstrating good<br />
practices that could be applied in the <strong>Mediterranean</strong> region: examples of rural and/or urban<br />
progress in a specific sector or with remarkable spin-off for development.<br />
4 Event organised by the Principality of Monaco on the same dates, to which the participants were officially invited to attend the<br />
opening conference, in the presence of Prince Albert II, on the theme of « Financing Renewable Energies »<br />
15
16<br />
ENERGY AND SUSTAINABLE DEVELOPMENT IN THE MEDITERRANEAN<br />
Analyses developed in the national reports were based on the available statistics and<br />
indicators. The countries were also asked to give information about the monitoring indicators<br />
for the « energy and climate change » chapter of the MSSD (4 priority indicators and 14<br />
supplementary ones: see indicator list in Attachments 6 and 7) while taking into account the<br />
definitions in the files describing the indicators attached to the terms of reference, and<br />
stipulating, if need be, the definitions used in the countries.<br />
Monitoring of these indicators highlights the large trends observed with regard to changes,<br />
energy use efficiency, as well as the efforts made to develop renewable energies, control of<br />
greenhouse gases, the using of the Clean Development Mechanism included in the Kyoto<br />
Protocol.<br />
Box 6 Indicators: share of renewable energies and energy intensity in the <strong>Mediterranean</strong> countries<br />
Despite signs of a decrease in energy intensity (annual average variation of -0.3% per annum<br />
between 1992 and 2003), the reduction objectives of 1 to 2% per annum, as defined in the<br />
MSSD, will probably not be reached. This trend hides great differences from one country to the<br />
next, with results that are more or less encouraging. Tunisia, for instance, managed to reduce its<br />
energy intensity by more than 1% per year on average between 1992 and 2003. Besides this,<br />
compared to worldwide trends, (-1.6% per annum between 1992 and 2003), the <strong>Mediterranean</strong><br />
records a slower progression even if in absolute terms the <strong>Mediterranean</strong> has better performance<br />
than the other parts of the world (in the <strong>Mediterranean</strong> in 2003, 151 pet (petrol equivalent tonne)<br />
to produce 1 million dollars worth of GDP compared to 212 pet worldwide).<br />
Despite a rise in quantity in renewable energies produced in absolute values (+3% per annum<br />
between 2000 and 2004) and taking into account the simultaneous increase in demand, their<br />
share in the energy balance sheet is stable and has even gone down (3.2% in 2004, biomass not<br />
included). This is far from the MSSD objective of 7% RE (except for biomass) by 2015. It should,<br />
however, be noted that there are significant signs of development such as wind energy in Spain<br />
and solar powered water heaters in Cyprus, Turkey and Israel. In Europe, it should be pointed<br />
out that the overall trend towards an increase in RE is more on the part of the non-<strong>Mediterranean</strong><br />
countries (Germany, Denmark). This being the case, the recent decision of the Energy<br />
Committee to reach 20% of renewable energies in primary energy consumption by 2020 should<br />
allow for larger integration in most of the northern <strong>Mediterranean</strong> countries. Deliberate, adapted<br />
solutions, strategies and mechanisms still need to be put in place in the southern <strong>Mediterranean</strong><br />
countries.<br />
5.2 Main pr oblems put forw ard in t he na ti ona l repor ts and<br />
d iscussed during the Monaco w or kshop<br />
The presentations of the reports during the workshop, as well as the discussions following<br />
them highlighted the energy situations and challenges in the countries, progress in terms of<br />
renewable energies and efficient energy use, the motivating factors, the obstacles, the<br />
possible solutions and examples of good practices.<br />
Different energy strategies can be observed in the countries depending on the availability of<br />
energy sources and on the level of economic development. However, even if the experience<br />
varies considerably, the countries all show an interest, at different levels, in developing<br />
renewable energy and efficient energy use. This implies setting up an adequate institutional<br />
and statutory framework.<br />
5.2.1 An institutional framework for R E and EE under construction<br />
Even if the great majority of the countries have adopted strategies or objectives for<br />
developing renewable energies (sometimes defined by type of energy and type of<br />
technology) and/or but to a lesser extent, strategies for energy efficiency, the presentations<br />
showed contrasted situations. The energy potential of these countries is different and the<br />
countries exporting fossil energies seem less determined to promote energy efficiency and<br />
recourse to RE than those whose energy costs are high. Overall, there is more progress in<br />
the promoting of RE than in EE, while the latter, paradoxically, would seem to be the more<br />
cost-effective.
Summary Report<br />
Most of the countries have institutions to promote renewable energies and/or energy<br />
efficiency (ANME, APRUE, CDER, PEC, OEP, and so on). The legal and statutory<br />
framework, however, in these two areas has not yet been set up in most of the southern and<br />
eastern <strong>Mediterranean</strong> countries and concrete measures are not yet implemented. As an<br />
example, the work and the results of projects carried out in the building sector with the<br />
prospects of implementing thermal energy rules adapted to these countries. Despite<br />
promising results, the future challenge will be to go beyond the many simple pilot studies for<br />
RE and EE, to reach a larger scale of operations.<br />
Nevertheless, real efforts have been made to conform to international standards and to build<br />
the channels on criteria of quality in terms of both materials and professional skills. The<br />
putting in place of energy labels in some countries, such as in Tunisia and Morocco, the<br />
training programmes in Morocco and the use of solar energy for electricity in isolated rural<br />
areas (Morocco, Libya, Syria and Israel) and wind energy in Spain, a world leader, are<br />
excellent initiatives.<br />
The discussions highlighted that RE and EE are attracting more attention and that action in<br />
this direction is well-structured around identified activities that imply an integrated strategy in<br />
which the objectives are clearly announced. A clear, credible message is important in order<br />
to attract the implication of the private sector in these projects.<br />
The discussions also concluded that RE and EE should not compete; they should be<br />
developed simultaneously. The participants also underscored the importance to take into<br />
consideration long term and to integrate anticipating measures as much as correcting one.<br />
The importance of the exchange of experience and know-how was also put forward. The<br />
countries could thus adapt successful programmes to their specific situations.<br />
5.2.2 Motivation/obstacles<br />
Progress is limited but there is growing interest in RE and EE. For the northern countries, the<br />
motivating factors are supply safety and the reduction of greenhouse gas emissions<br />
(commitments to the Kyoto Protocol). In the south, the energy bill, the balance of payments,<br />
the consequences for the economy of the high prices of fossil energies motivating the<br />
governments to subsidise energy prices are determining factors that should lead to the<br />
diversification of offer and to the management of the energy demand. Finally, it would clearly<br />
seem that the countries that have made the most progress in some channels of RE and EE<br />
are those where there is more willingness on the part of politicians and where there is more<br />
backing of the institutions in charge of implementing the strategies, as in Tunisia, for<br />
instance. The presentations highlighted the essential role played by the State either locally or<br />
nationally in the choices made or the directions taken. Also they demonstrated the necessity<br />
to develop RE and EE on a large scale, i.e. on an industrial scale. The Spanish, Tunisian,<br />
Maltese and Israeli examples illustrate this.<br />
Many obstacles continue to hamper the concrete implementing of RE and EE policies and<br />
strategies. These obstacles can include: reticence on the part of the politicians,<br />
administrative and organisational problems such as a lack of coordination between ministries<br />
or breaking up of responsibilities, a lack of cooperation on the part of the big electricity<br />
operators, different interests, and so on, as well as the inexistence or insufficiency of a<br />
statutory and institutional framework, lax management, non-adapted tariffs, lack of<br />
awareness-raising of the end-users and of the decision-makers, lack of qualifications and<br />
know-how in the field of RE and EE, the relatively high cost of some ER and EE<br />
technologies, funding problems due to budget constraints, social acceptability, land-use<br />
problems, and so on. Often RE and EE development has to compete unequally with fossil<br />
energies because the legislative and statutory framework for the development of the former<br />
is not finalised or is non-existent.<br />
Obstacles for funding were often cited. The initial cost burden for energy efficiency and for<br />
renewable energies compared to the cost of fossil energies was mentioned as a setback.<br />
The overall increase in the prices of equipment for RE since the start of 2006 was also<br />
referred to as a new source of difficulty.<br />
17
18<br />
ENERGY AND SUSTAINABLE DEVELOPMENT IN THE MEDITERRANEAN<br />
5.2.3 Economic tools, technology, and awareness -raising<br />
Several countries have recourse to tools available (technical, legislative, statutory,<br />
institutional, economic, fiscal and training, awareness-raising, etc.) in order to go forward in<br />
the field of RE and EE. The participants unanimously agreed that all of the available tools to<br />
go in the direction of RE and energy efficiency should be mobilised simultaneously.<br />
The available economic instruments and tools to control energy demand or to diversify the<br />
offer are used differently from one country to the next. And the subsidised prices of fossil<br />
fuels in the southern and eastern countries, whether by exporters or importers of fossil<br />
resources, as well as in the EU, pose a problem. The various tariffs for energy that cannot be<br />
detached from social needs remain a sensitive issue in most of the <strong>Mediterranean</strong> countries.<br />
Indeed, in some countries increases in prices did not give the expected results. The question<br />
of social equity has to be taken into account and better knowledge of the elasticity of<br />
consumer prices is essential in many of the countries.<br />
In order to make RE and EE more attractive, some southern countries have recently set up<br />
subsidy systems or buy back tariffs. The relevancy of other tools for the southern and<br />
eastern <strong>Mediterranean</strong> countries, such as white certificates should be studied. The<br />
experience of the European <strong>Mediterranean</strong> countries (Spain and France especially)<br />
demonstrates the positive impact of feed in tariffs for the development of wind and solar<br />
energy connected to the networks. Concerning biomass, good results have been obtained<br />
thanks to tax and subsidy systems. Nevertheless, the discussions highlighted the fact that<br />
what is possible in the north is not necessarily the case in the south, and the adapting of<br />
such systems has to be studied. The experience of Escos in Tunisia and Israel, although<br />
recent, seem promising.<br />
Current available technologies are reliable and are no longer obstacles, but the quality of the<br />
services associated with RE and EE as well as that of the equipment were qualified by some<br />
countries (Egypt, Tunisia and Morocco) as determining factors for the success of<br />
development in these areas. There is a real need to improve competence in these fields in<br />
the southern and eastern countries of the <strong>Mediterranean</strong>.<br />
Among the possible renewable energies, using sea water was mentioned as a possibility of<br />
tempering building costs. The participants also mentioned that biomass is widely used in<br />
several countries and that it merits much more attention because there are risks attached to<br />
it such as desertification. Bio-fuels form part of the debate concerning how to use farmland<br />
efficiently.<br />
The question of awareness-raising was often said to be « crucial ». Even if it is rising in most<br />
of the countries, awareness-raising of the public and of the decision-makers with regard to<br />
the relationship between efficient energy use and climate change seems to remain low.<br />
There are problems of acceptability (of wind-energy, for instance) on the part of citizens that<br />
could be solved partially by more information and awareness-raising.<br />
Finally, the eastern and southern <strong>Mediterranean</strong> countries pointed out the necessity to<br />
strengthen international cooperation and development aid to give support to RE and EE.<br />
Box 7 Tools and incentives for RE and RUE in Italy<br />
The main tool to support renewable will remain the “Green certificate” market-based mechanism.<br />
In parallel, the feed-in tariff scheme for photovoltaic and the recent legislation on the energy<br />
efficiency in the building sector will contribute to accelerate the increase of renewable in the<br />
energy mix.<br />
Another market-based mechanism, “White Certificates”, is also used to support energy efficiency<br />
and energy saving measures to reduce consumption to the end-use. The aim is to achieve, by<br />
the end of the five-year period 2005-2009, a total energy saving of 2.9 million tep.<br />
In terms of policy priorities, the building sector has been considered a relevant sector in which it<br />
is crucial to intervene to reduce energy consumption and related emissions. Among several<br />
standards, conditions and modalities to improve the energetic performance of the buildings, the<br />
recent legislation (Legislative Decree 29th December 2006, n.311) foresees also that in all new
Summary Report<br />
buildings, or in case of restoration of existing thermal plants, at least 50% of the annual primary<br />
energy necessary to produce hot sanitary water should be provided using renewable energy<br />
sources. This limit is reduced to 20% for buildings located in historical centres.<br />
For new buildings, or in case of restoration, it is foreseen the obligation to install photovoltaic for<br />
electricity production with a power capacity to be defined in ministerial decree.<br />
Furthermore, for new buildings, or in case of restoration, it is obligatory to foresee the setting of<br />
all necessary works related to the connection to the district heating network, if this is located<br />
nearby.<br />
Energy saving and renewable energy are also boosted through specific fiscal and administrative<br />
measures, generally introduced each year with the Financial Law, such as:<br />
deduction from taxes of a certain % of total cost of the interventions devoted to the increase of<br />
the efficiency or to the installations of renewable energy equipments;<br />
reduced taxation (such as VAT) for clean technology equipments and systems<br />
reduction/rationalization of administrative procedure and cost<br />
Capital incentives are also available, but the adoption of market-based mechanisms at national<br />
level leave them mainly as regional and local measures.<br />
To support measures to reduce GHGs emissions from energy sources, a Rotation Fund, with a<br />
size of 200 M€ for each year from 2007 to 2009, has been established to support a number of<br />
priority actions such as "high-performance distributed micro-cogeneration plants for electricity<br />
and heat generation" and other interventions (including pilot projects) utilizing renewable<br />
energies.<br />
6. Examples of good practices: the points of view of the international<br />
6.1 Examples of good practices<br />
Many examples of good practices and of pilot projects have been carried out in the<br />
<strong>Mediterranean</strong> countries, and they now constitute a solid base for the large-scale<br />
development of RE and EE. A selection of 4 examples that were presented during the<br />
workshop is given below. They were extracted from the summaries of the national studies:<br />
MOROCCO: Energy efficiency: the tool to decouple economic growth and increased<br />
energy demand<br />
In Morocco, energy efficiency programs bring innovations in the field of technology,<br />
organization and funding. They include: PROMASOL, for the development of the solar water<br />
heater market, the use of improved wood savings technologies to upgrade hammams and<br />
bakery ovens, and promotional campaigns for local expertise and services.<br />
Within the framework of current national programs, the RE Development Center is working<br />
on designing the energy efficiency approach to collective housing. The approach involves<br />
capitalizing on promotional mechanisms, consolidating partnerships and supporting strategic<br />
infrastructure construction projects in the fields of Health, Housing, National Education,<br />
Hotels and Local Communities.<br />
This is a fully-integrated approach to energy in construction work. It covers heating<br />
regulations, standards and labels (architectural design, building materials and equipment),<br />
normative technical guidelines for professionals, the upgrading of the capacity of public and<br />
private operators, the development of a pilot program in the above-mentioned areas, and<br />
sustainable funding through the financial resources of the different institutions.<br />
The program was developed jointly by the partners, convinced of the need to cooperate in<br />
satisfying requirements and in meeting the ever stronger demand for comfort, by contributing<br />
to energy demand management, to environment protection and to optimized institutions<br />
budgets.<br />
19
EGYPT: wind energy development<br />
20<br />
ENERGY AND SUSTAINABLE DEVELOPMENT IN THE MEDITERRANEAN<br />
With its 230 MW wind farms installed capacity, Egypt is on top of all African and Middle East<br />
countries in grid-connected wind power generation. Since the late 1970s, Egypt started<br />
considering the use of RE where several bilateral and multilateral agreements were signed<br />
and implemented to explore potential horizons of RE use.<br />
RE resources assessments studies were conducted where the wind resource study pointed<br />
out to the great wind potential the Gulf of Suez is endowed with. This result stimulated world<br />
wide interest in developing such studies along with implementing pilot and field testing<br />
projects. The success of those projects coupled with the elaboration of Wind Atlas for Egypt,<br />
allowed the country to cross thus stage to large scale commercial utilization.<br />
Of equal importance, was the willingness of developed countries that already have an<br />
advanced record in wind resource utilization and its equipment manufacture, to cooperate<br />
with Egypt and offer adequate financing facilities from the beginning, particularly to<br />
compensate for the higher cost of RE compared to conventional and enable wind power<br />
projects development. Such countries included Germany, Denmark and at the beginning,<br />
then currently include Spain and Japan.<br />
The development of large scale grid-connected wind farms have had several benefit to the<br />
country either direct or indirect among which are: saving natural gas and oil, contributing to<br />
capacity building and know-how transfer, protecting the environment through the use of clean<br />
energy, contributing to develop remote desert areas, and finally stimulating local manufacture<br />
of about 25% of wind project material.<br />
MALTA: energy efficiency and water desalination<br />
Water in the Maltese islands is a scarce resource and with high population density, small<br />
surface area and high percentage of urban development as well as a semi-arid climate,<br />
pressures on existing water resources are intense. Water to meet the needs of the<br />
population is obtained from two main sources: groundwater and desalination. Desalination<br />
facilities were introduced in the 1980s in response to water scarcities arising from increasing<br />
demand and insufficient natural supplies. Today desalination contributes to around 50% of<br />
the potable water supply in Malta.<br />
Various projects have also been undertaken by the Water Services Corporation to improve<br />
the energy efficiency of the RO plants. Modern energy recovery technology was<br />
incorporated in existing plants as follows:<br />
Pelton wheels were installed on 6 trains employing reverse running pumps at Pembroke<br />
Phase II. This consisted in a simple replacement of the latter equipment. This project<br />
contributed to a reduction in the specific energy consumption from 4.5 kWh/m3 to 3.6<br />
kWh/m3.<br />
Pressure exchangers as incorporated in Lapsi R.O. <strong>Plan</strong>t. This required a complete reengineering<br />
of the equipment including replacement of the high pressure pump and two<br />
trains of previous rating were incorporated in the process. The specific energy<br />
consumption was reduced from 4.8 kWh/m3 to 3.2 kWh/m3 through this project.<br />
This has contributed to an annual electricity savings of approximately 13 million kWh (Water<br />
Services Corporation, 2006).<br />
TUNISIA: water heating system development<br />
PROSOL residential is a project started in 2005 to boost the solar water heating market<br />
through an innovative mechanism combining investment subsidies and interests rebate, with<br />
loans from the banking sector. The system is original in that loan reimbursement are included<br />
in the electricity bill (STEG, Sociéte Tunisienne d'Electricité & Gaz), which secures pay-back<br />
and therefore makes it possible for banks to offer more favorable interest rates. The market<br />
has undergone major recovery with PROSOL and has attracted new industrial operators and<br />
installer networks, leading to the prolongation of the PROSOL residential initiative, to the<br />
renewed involvement of the STEG and to the stronger involvement of the banking sector and
Summary Report<br />
lastly, with the support of UNEP and the Italian Ministry for the Environment, the forthcoming<br />
launch of a « tertiary PROSOL », similar to PROSOL residential.<br />
Ventes (m²)<br />
40 000<br />
35 000<br />
30 000<br />
25 000<br />
20 000<br />
15 000<br />
10 000<br />
5 000<br />
0<br />
Démarrage<br />
du projet GEF<br />
Epuisement de<br />
la subvention<br />
du GEF<br />
Lancement de<br />
PROSOL<br />
85 86 87 88 89 90 91 92 93 94 95 96 97 98 99 00 01 02 03 04 05 06 Année<br />
6.2 The poi nts Development of view of solar water of heating t he market interna in Tunisia ti onal ins ti t utions and of<br />
civi l soc iet y<br />
The last session of the workshop gave the possibility to widen the debate thanks to the<br />
presentation of the points of view of the civil society, of the international institutions and of<br />
one bilateral donor. The main lessons learnt from the communications presented and from<br />
the discussions that followed can be summed up as follows:<br />
The International Energy Agency (IEA) points out the interest of integrating RE and EE<br />
development in energy management and clearly expresses the unacceptability of the<br />
consequences of the baseline scenario. The IEA alternative scenario demonstrates that a<br />
lowering of demand by 4% worldwide by 2015 and by 10% by 2030 is possible. Yet, to obtain<br />
these results, policies need to be put in place everywhere in the world. There are, however,<br />
hurdles throughout the world that need to be crossed such as the differences in subsidies for<br />
the various types of energy and the lack of harmonisation of the technological standards. To<br />
counter these obstacles there are solutions such as feed in tariffs for electricity. And, of<br />
course, ER and EE development actions have to be socially acceptable; they would be if<br />
members of the civil society were more involved in the implementing of this development but<br />
to do this they need to get together. Large energy consumers, as already mentioned, have<br />
been associated for a long time but the smaller ones are not. They could, for example, form<br />
user advisory bodies. The key to success is for those involved to understand the stakes and<br />
to initiate policies so that solutions such as wind energy become socially acceptable. The<br />
involvement of NGOs and local players has been mentioned as an objective that could help<br />
to take local needs and vulnerability more into account.<br />
Donors and investors, as well as international cooperation are now available to invest in<br />
these areas and to trigger development. The AFD (French Agency for Cooperation) clearly<br />
expressed the fact that energy sustainability in the widest sense of the term has become of<br />
great interest in its in-house debates.<br />
Finally, the participants agreed that the definition of RE and EE policies and the<br />
implementing and monitoring of these policies require standardised, relevant and regularly<br />
updated energy efficiency indicators throughout the countries. Regional work on this topic<br />
needs to be carried out in the <strong>Mediterranean</strong>.<br />
7. Summary of recommendations: 6 key points<br />
Experts and participants to the Monaco workshop agreed on the following set of<br />
recommendations:<br />
considering that energy development in the <strong>Mediterranean</strong> must contribute to the region's<br />
sustainable development especially by reinforcing security of supply, controlling emissions<br />
21
22<br />
ENERGY AND SUSTAINABLE DEVELOPMENT IN THE MEDITERRANEAN<br />
of greenhouse gases, reducing pollution connected with it at local and regional level,<br />
promoting access to energy and energy services and improving energy efficiency,<br />
estimating that these challenges are closely linked with the socio-economic and<br />
environmental challenges, particularly climate change, which the <strong>Mediterranean</strong> countries<br />
are also facing,<br />
considering that energy demand in the <strong>Mediterranean</strong> is expected to increase by 415<br />
Mtep between 2005 and 2020 to reach 1360 Mtep, that the region has one of the highest<br />
potentials for renewable forms of energy in the world and that the various losses due to<br />
transformation, transport and different uses could reach 20 to 50% of the energy<br />
consumed depending on the country,<br />
taking into consideration the decisions of the European Council to achieve 20% of energy<br />
savings and a share of 20% renewable energy in the total European consumption by the<br />
year 2020,<br />
attached to the implementation of the Barcelona Convention and the objectives of the<br />
<strong>Mediterranean</strong> Strategy for Sustainable Development (MSSD),<br />
The participants to the meeting of experts on energy and sustainable development,<br />
convened at Monaco, on 29 and 30 March 2007, recommend to the national political<br />
authorities of the <strong>Mediterranean</strong> countries to:<br />
include, in accordance with the MSSD orientations, the rational use of energy (RUE) and<br />
the development of renewable energy (RE) in the national strategic priorities and to<br />
transpose by 2008 the relevant regional objectives to the national level as objectives<br />
which are clear, ambitious, differentiated by sector and paced in time,<br />
set up by 2010 an institutional and regulatory framework to promote the development of<br />
the RUE and RE as well as the strategies for the mobilization of various fiscal, tariff and<br />
market tools and instruments available to them, by taking into consideration the local<br />
contexts and favoring both small-scale projects and industrial ones,<br />
promote public outreach on the questions of the RUE and RE, especially by developing<br />
programmes of environmental education which focus on these issues; further to set up<br />
instruments for the effective participation of the various categories of stakeholders,<br />
particularly women, in the decision-making process concerning RUE and the promotion of<br />
RE,<br />
submit to public and private partners, especially donors, projects on the RUE and the<br />
promotion of RE, while ensuring the coordination of their interventions at the various<br />
relevant territorial scales,<br />
put in place a system for the follow-up and assessment of policies and actions undertaken<br />
in the fields of RUE and RE, by sharing and documenting the relevant indicators<br />
developed by the competent organizations, especially those used in the MSSD,<br />
reinforce regional cooperation in the RUE and the promotion of RE , especially by<br />
mutually reinforcing research and assessment capacities and sharing good practices.<br />
Moreover, the Blue <strong>Plan</strong> in collaboration with its partners is expected to:<br />
contribute to the collection in the field of energy of information which is clear, reliable,<br />
regularly updated and comparable from country to country,<br />
continue its prospective work in the energy sector by basing its scenarios on clearly<br />
formulated assumptions, particularly the economic aspects,<br />
carry out a more in-depth analysis of the link between climate change and energy by<br />
integrating the cost estimate of climate change and the adaptation and abatement<br />
measures,<br />
prepare, every two years, a report on progress registered in the <strong>Mediterranean</strong> in the<br />
fields of RUE and RE, by developing and documenting shared and relevant indicators,<br />
established according to tested methodologies and to contribute to setting up a platform<br />
for the exchange of good practices.
8. Attachments<br />
Attachment 1 – Activities Programme<br />
Attachment 2 – List of participants<br />
Summary Report<br />
Attachment 3 – Monaco Workshop Programme<br />
Attachment 4 – Energy chapter of the MSSD<br />
Attachment 5 – Summary of the sub regional workshop: « CDM in the southern<br />
<strong>Mediterranean</strong> countries, strengths and weaknesses, challenges and prospects – links with<br />
EE and RE »<br />
Attachment 6 – List of MSSD follow up indicators<br />
Attachment 7 – Indicator sheet for 3 priority indicators<br />
Attachment – Press release<br />
23
24<br />
ENERGY AND SUSTAINABLE DEVELOPMENT IN THE MEDITERRANEAN<br />
8.1 At t a c h ment 1 - Ac t i vi t ies Progra mme<br />
The activities were as follows:<br />
Meeting of the technical<br />
pilot committee<br />
MSSD Monitoring<br />
indicators<br />
Regional/international<br />
studies<br />
Meeting n°1 : 21 February 2006, <strong>Plan</strong> Bleu, Sophia-Antipolis<br />
Meeting n°2 : 17 September 2006, side meeting, UMET 5, Carthage<br />
Meeting n°3 : February 2007, Reduced committee to prepare the Monaco workshop<br />
and electronic consultation<br />
Choosing sub-indicators, preparing the glossary, writing of priority indicator files<br />
Documents are at disposal on :<br />
http://www.planbleu.org/methodologie/indicateursSmdd.html<br />
Drawing up of terms of reference and identifying the experts to carry out the 3 studies<br />
:<br />
Position of the area covered by the <strong>Plan</strong> Bleu scenarios<br />
Economic questions connected with renewable energies (RE) and energy efficiency<br />
(EE)<br />
<strong>Mediterranean</strong> cooperation and development aid policies : place of RE and EE<br />
Experts workshop Organisation of a workshop together with UMET in May 2006 in Paris, on the theme :<br />
« CDM in the southern <strong>Mediterranean</strong> countries, strengths and weaknesses,<br />
challenges and prospects – links with EE and RE »<br />
Drawing up of the meetings<br />
Documents at disposal on :<br />
http://www.planbleu.org/themes/atelier_mdp.html<br />
National studies Identification of the voluntary countries and of the national experts (12 countries<br />
altogether)<br />
Drawing up of detailed specifications (at disposal on :<br />
http://www.planbleu.org/themes/energie_progr_travail2006_07.html)<br />
Contents :<br />
- Information about national strategic consideration of RE and EE, the situation of the country<br />
with regard to implementing, forecasts and prospects if any, forecasting with MSSD and <strong>Plan</strong><br />
Bleu scenarios ;.<br />
- Two or three case studies including territorial examples (towns), the channel of activity, that<br />
demonstrate the concrete progress made, benefits obtained, tools implemented, difficulties met<br />
and identified obstacles.<br />
- An analytical and critical analysis to highlight the gains and the obstacles and to open up<br />
directions and action to be taken in the countries themselves as well as with regional<br />
cooperation.<br />
Drawing up and distributing of a short questionnaire to countries not carrying out a<br />
national study.<br />
Experts workshop Organisation of a regional workshop with 40 participants – 29 and 30 March 2007 in<br />
Monaco<br />
All the documents are at disposal on :<br />
http://www.planbleu.org/themes/atelier_energie_monaco.html<br />
Summary report 20 to 30 pages
8.2 At t a c h ment 2 – List o f parti cipants<br />
Experts<br />
Members of the steering committee<br />
1 M. Samir ALLAL, Expert Energie - IUT Mantes en Yvelines<br />
5, rue Gay Lussac, 75005 PARIS, France<br />
Tél. +33 1 30 98 13 70 - Fax +33 1 43 36 77 76 - directeur@iut-mantes.uvsq.fr<br />
2 Ms Virginia ALZINA, Director - Regional Activity Centre for Cleaner Production -<br />
CP/RAC<br />
25-27 Milanesat Street, 5th Floor, 08017 BARCELONE, Espagne<br />
Tél. +34 93 55 38 791 – Fax + 34 93 55 38 795 - valzina@cprac.org<br />
3 Mme Houda BEN JANNET-ALLAL, Responsable scientifique ER et DD -<br />
Observatoire Méditerranéen de l'Energie (OME)<br />
Arche des Dolines - 7 rue Soutrane, Les Bouillides – Garbejaïre, B.P. 248,<br />
06905 SOPHIA ANTIPOLIS Cedex, France<br />
Tél. +33 1 43 31 42 18 - +33 6 18 51 22 35 Fax +33 1 43 36 77 76 -<br />
allal@ome.org<br />
4 M. Frédéric BLANC, Directeur des études - Institut de la Méditerranée, "<br />
FEMISE network "<br />
Palais du Pharo, 58 Bd Charles Livon, 13007 MARSEILLE, France<br />
Tél. +33 4 91 31 51 95 - Fax+33 4 91 31 50 38 - f.blanc@femise.org /<br />
ins.med@femise.org<br />
5 Mme Hélène CONNOR, Présidente - HELIO INTERNATIONAL<br />
56, rue de Passy, 75016 75016 PARIS, France<br />
Tél. +33 1 42 24 51 48 - +33 6 08 23 87 86 Fax +33 1 42 24 86 33 -<br />
helene.connor@helio-international.org<br />
6 Mme Anne GED, Directeur de Missions Pole Politiques Publiques et<br />
Développement Durable, SOLVING France<br />
9, boulevard Malesherbes, 75008 PARIS, France<br />
Tél. +33 6 76 95 77 13 - +33 1 53 30 35 00 Fax +33 1 53 30 35 69 - + 33 4 42<br />
28 85 63 anne.ged@solving-france.com<br />
Summary Report<br />
CDM<br />
Workshop<br />
Paris,<br />
May 2006<br />
Expert<br />
National<br />
study<br />
Expert<br />
Regional<br />
Study<br />
Short<br />
questionnaire<br />
Monaco<br />
Workshop,<br />
March 2007<br />
√ √ √<br />
√ √<br />
√ √<br />
√ √<br />
7 M. Hamdi HARROUCH, Directeur de la Programmation, du Suivi et du<br />
Développement - ANME<br />
3 rue 8000 Montplaisir, BP 213, 1073 TUNIS, Tunisie<br />
Tél. +216 71 790 061 Fax +216 71 782 622 - hamdi.harrouch@anme.nat.tn<br />
8 M. Stéphane POUFFARY, Chef de Cellule Expertise Internationale pour la<br />
Maîtrise de l'Energie, ADEME (Agence de l'Environnement et de la Maîtrise de<br />
l'Energie)<br />
Centre de Valbonne, 500 Route des Lucioles, 06560 VALBONNE, France<br />
Tél. +33 4 93 95 79 55 - Fax +33 4 93 65 31 96 - stephane.pouffary@ademe.fr<br />
√ √<br />
9 M. Francesco PRESICCE, Expert - MEDREP/Ministry for the Environment and √ √<br />
√<br />
√<br />
Remarks<br />
25
26<br />
Experts<br />
Members of the steering committee<br />
Territory, Department for Environmental Research and Development<br />
Via C. Bavastro 174, 00147 ROME, Italie<br />
Tél. +39 06 57 22 81 62 – Fax +39 06 57 22 81 78 -<br />
presicce.francesco@minambiente.it<br />
10 M. Stéphane QUEFELEC, Economiste, <strong>Plan</strong> Bleu<br />
15, rue Beethoven, 06560 Sophia-Antipolis, VALBONNE, France<br />
Tél. +33 4 92 38 71 43 – Fax +33 4 92 38 71 31 - squefelec@planbleu.org<br />
11 M. Pierre-Etienne ALVAREZ-LUEGO, Stagiaire - Université de Versailles<br />
45 avenue des Etats Unis - 78035 Versailles cedex, France<br />
Tél. : 01 39 25 41 12 - Fax : 01 39 25 40 19 - Mob. +33 6 61 13 40 46 - pe-<br />
alvarez@neuf.fr<br />
12 M. Samir AMOUS, Expert International -APEX Conseil<br />
16 bis, rue du Docteur Alphonse Laveran, 1002 TUNIS BELVEDERE, Tunisie<br />
Tél. +216 22 545 866 - +216 71 848 094 – Fax +216 71 843 453 -<br />
amous.apex@gnet.tn<br />
13 M. Philippe ANTOGNELLI, Chef de Section à la Direction de l'Environnement,<br />
de l'Urbanisme et de la Construction<br />
Place de la Visitation, 98000 MONACO, Monaco<br />
Tél. +377 98 98 21 22 / 46 80 - Fax +377 93 50 95 91 - pantognelli@gouv.mc<br />
14 M. Benaïssa AYADI, Directeur Général - ANME<br />
3, rue 8000 Montplaisir, BP 213, 1073 TUNIS, Tunisie<br />
Tél. +216 71 782 419 - Fax +216 71 782 622 - dganme@anme.nat.tn<br />
15 M. Jean-Jacques BECKER - Bureau Exécutif du MDP - Ministère des<br />
transports, de l’équipement, du tourisme et de la mer<br />
Paris Sud - 92055 PARIS LA DEFENSE CEDEX, France<br />
Tél. +33 1 40 81 28 26 - Jean-Jacques.Becker@equipement.gouv.fr<br />
16 M. Mohamed BERDAI, Directeur coopération internationale - CDER (Centre de<br />
Développement des ER)<br />
Cité Administrative, 31, rue du Souss, RABAT, Maroc<br />
Tél. +21261 305 592 - Fax+212 37 68 39 87 -berdai@mem.gov.ma<br />
17 M. Alexis BONNEL, Responsable Division Infrastructures - Agence Française<br />
de Développement (AFD)<br />
5, rue Roland Barthes, 75598 PARIS Cedex 12, France<br />
Tél. +33 1 53 44 35 43 - Fax+ 33 1 53 44 38 65 - bonnela@afd.fr<br />
18 M. Didier BOSSEBOEUF, Expert économiste - ADEME (Agence de<br />
l'Environnement et de la Maîtrise de l'Energie), Direction exécutive Stratégie et<br />
Recherche<br />
ENERGY AND SUSTAINABLE DEVELOPMENT IN THE MEDITERRANEAN<br />
CDM<br />
Workshop<br />
Paris,<br />
May 2006<br />
Expert<br />
National<br />
study<br />
Expert<br />
Regional<br />
Study<br />
Short<br />
questionnaire<br />
Monaco<br />
Workshop,<br />
March 2007<br />
√ √ √<br />
√<br />
√<br />
√ √<br />
√ √<br />
√<br />
√<br />
√<br />
√<br />
Remarks
Experts<br />
Members of the steering committee<br />
27, rue Louis Vicat, 75737 PARIS CEDEX 15, France<br />
Tél. +33 1 47 65 23 55 – Fax +33 1 40 95 74 53 - didier.bosseboeuf@ademe.fr<br />
19 M. Abdelaziz BOURAHLA, Chargé de mission - <strong>Plan</strong> Bleu<br />
15, rue Beethoven, Sophia-Antipolis, 06560 VALBONNE, France<br />
Tél. +33 4 92 38 71 45 – Fax +33 4 92 38 71 31 - abourahla@planbleu.org<br />
20 M. George CASSAR, Operations Engineer - Malta Resources Authority (MRA)<br />
Millennia 2nd Floor, Aldo Moro Road Marsa LQA 06 Malta, LQA 06 MARSA,<br />
Malte<br />
Tél. +356 21 220 625 - +356 21 220 619 - Fax +356 21 220 622<br />
george.cassar@mra.org.mt<br />
21 M. Lucien CHABASON, Président du <strong>Plan</strong> Bleu<br />
15, rue Beethoven, Sophia-Antipolis, 06560 VALBONNE, France<br />
Tél. +33 4 92 38 71 30 - Fax +33 4 92 38 71 31<br />
22 M. Hocine CHALAL, Senior Environmental Specialist - World Bank<br />
1818 H Street, N.W., Room H8-133, WASHINGTON, DC 20433, Etats-Unis<br />
Tél. +202 458 21 53 - Fax +202 477 16 09 / 19 81 - hchalal@worldbank.org<br />
23 M. Oussama Jaoued. CHERKAOUI, CDER<br />
Rue Machaar Elharam, Quartier Issil Menara Gueliz, MARRAKECH, 40000,<br />
Maroc<br />
Tél. +212 24 30 98 22 / 09 /14 - Fax. +212 24 30 97 95 - cder@menara.ma;<br />
o.cherkaoui@cder.org.ma<br />
24 M. Hamid CHRIFI, Responsable de Département - ENDA Maghreb, Dép. Env.<br />
et Dév. Rural<br />
12 rue Jbel Moussa Appt. 13, Joli Coin, 10 000 RABAT AGDAL, Maroc<br />
Tél. +212 37 67 10 61 - Fax+212 37 67 10 64 - Hamid.chrifi@enda.org.ma<br />
25 M. Krešimir CEROVAC, Ministry of economy, labour and entrepreneurship<br />
Vukovarska avenija 78, 10000 ZAGREB, Croatie<br />
Tél. + 385 1 61 06 946 – Fax +385 1 61 09 113 - kresimir.cerovac@mingorp.hr<br />
26 M. Jean COPREAUX, Université de Versailles<br />
45, avenue des Etats Unis, 78035 Versailles cedex, France<br />
Tél. : 01 39 25 41 12 - Fax : 01 39 25 40 19 Mob. +33 6 86 95 25 67 -<br />
jean.copreaux@free.fr<br />
27 M. Christian de PERTHUIS, Conseiller à la Caisse des dépôts et Consignations<br />
- Caisse des dépôts et Consignations<br />
Direction du développement durable<br />
56, rue de Lille, 75356 PARIS 7, France<br />
Tél. +33 1 58 50 22 62 -Fax +33 1 58 50 00 30 -<br />
christian.deperthuis@caissedesdepots.fr<br />
Summary Report<br />
CDM<br />
Workshop<br />
Paris,<br />
May 2006<br />
Expert<br />
National<br />
study<br />
Expert<br />
Regional<br />
Study<br />
Short<br />
questionnaire<br />
Monaco<br />
Workshop,<br />
March 2007<br />
√ √<br />
√ √<br />
√<br />
√<br />
√<br />
√ √<br />
√<br />
√<br />
√<br />
Remarks<br />
27
28<br />
Experts<br />
Members of the steering committee<br />
28 M. Nicolas DYEVRE, Responsable Maghreb et Moyen-Orient - ADEME<br />
(Agence de l'Environnement et de la Maîtrise de l'Energie)<br />
27, rue Louis Vicat, 75015 PARIS, France<br />
Tél. +33 1 47 65 24 88 - Fax +33 1 47 65 22 29 - nicolas.dyevre@ademe.fr<br />
29 Dr. Mohamed EKHLAT, Manager of Renewable Energy Department, <strong>Plan</strong>ning<br />
Unit General Electric Company of Libya, "GECOL"<br />
Swanii Road, P.O. Box 81187, TRIPOLI, Libye<br />
Tél. +218 (21) 480 74 32 - Fax +218 21 480 74 34 - libyacigre@gmail.com<br />
30 M. Habib ELANDALOUSSI, Responsable Scientifique - Observatoire<br />
Méditerranéen de l'Energie (OME)<br />
Arche des Dolines – 7, rue Soutrane, Les Bouillides – Garbejaïre, B.P. 248,<br />
06905 SOPHIA ANTIPOLIS Cedex, France<br />
Tél. +33 4 92 96 66 97 - Fax +33 4 92 96 66 99 - andalous@ome.org<br />
31 Mme Semra FEJZIBEGOVIC, National Expert for Renewable Energy - Hydro-<br />
Engineering Institute<br />
Stjepana Tomica 1, 71 000 SARAJEVO, Bosnie-Herzégovine<br />
Tél. + 387 33 212 466 - Fax +387 33 212 467 -<br />
semra.fejzibegovic@heis.com.ba<br />
32 Mme Rabéa FERROUKHI, Responsable Scientifique - Observatoire<br />
Méditerranéen de l'Energie (OME)<br />
Arche des Dolines – 7, rue Soutrane, Les Bouillides – Garbejaïre, B.P. 248,<br />
06905 SOPHIA ANTIPOLIS Cedex, France<br />
Tél. +33 4 92 96 66 96 – Fax +33 4 92 96 66 99 - ferroukhi@ome.org<br />
33 M. Rafik Youssef GEORGY, Technical Consultant -NREA - New and<br />
Renewable Energy Authority<br />
21 Hamadan Street, 12211 GUIZA, Égypte<br />
Tél. +202 572 55 25 +20 12 38 10 014 - Fax +202 27 17 173 -<br />
rafikyousef19@hotmail.com; rafik_youssef19@yahoo.co.uk<br />
34 Mlle Atika GOUGELIN, Stagiaire, Université de Versailles<br />
45 avenue des Etats Unis - 78035 Versailles cedex, France<br />
Tél. : 01 39 25 41 12 - Fax : 01 39 25 40 19 - atika_78@hotmail.fr<br />
35 Ms Višnja GRGASOVIĆ, Ministry of Environmental Protection, physical<br />
<strong>Plan</strong>ning and Construction<br />
Ulica Republike Austrije 14, 10000 ZAGREB, Croatie<br />
Tél. +385 1 37 82 117 – Fax +385 1 37 82 157 - visnja.grgasovic@mzopu.hr<br />
36 M. François IBANEZ, Informaticien - <strong>Plan</strong> Bleu<br />
15, rue Beethoven, Sophia-Antipolis, 06560 VALBONNE, France<br />
Tél. +33 4 92 38 71 30 – Fax +33 4 92 38 71 31 - fibanez@planbleu.org<br />
ENERGY AND SUSTAINABLE DEVELOPMENT IN THE MEDITERRANEAN<br />
CDM<br />
Workshop<br />
Paris,<br />
May 2006<br />
√<br />
√<br />
Expert<br />
National<br />
study<br />
Expert<br />
Regional<br />
Study<br />
Short<br />
questionnaire<br />
Monaco<br />
Workshop,<br />
March 2007<br />
√ √<br />
√ √<br />
√ √<br />
√ √<br />
√ √<br />
√<br />
√<br />
Remarks
Experts<br />
Members of the steering committee<br />
37 M. Jan KAPPEN, Associate Expert, Renewable Energy and Finance - Energy<br />
Branch<br />
UNEP Division of Technology, Industry and Economics<br />
Tour Mirabeau, 39-43, quai André Citroën, 75739 PARIS Cedex 15, France<br />
Tél. + 33 1 44 37 76 15 - Fax + 33 1 44 37 14 74 - jan.kappen@unep.fr<br />
38 M. Mustafa KLEICHE, AFD<br />
5, rue Roland Barthes, 75598 PARIS Cedex 12, France<br />
Tél. +33 1 53 44 31 31 / 31 17 - Fax +33 1 44 87 99 39 - kleichem@afd.fr<br />
39 Dr. Ahmet KOYUN, Expert - Termodinamik Anabilim Dal, Yildiz Teknik<br />
Universitesi Besiktas Kampusu<br />
Yildiz / Istanbul, 34349 ISTANBUL, Turquie<br />
Tél. +90 533 391 82 30 +90 212 259 70 70/2549 +90 542 225 4428 -Fax +90<br />
212 261 66 59<br />
koyun@yildiz.edu.tr; alenkuyumcu@yahoo.com ; info@alargesoft.com ;<br />
tokgozb@gmail.com<br />
40 M. Ashraf KRAIDY, Head of Energy regulation department - National Energy<br />
Research Center (NERC), Ministry of Electricity<br />
Dahyet Alassad, Avenue B4. bldg. No. 37., DAMAS, Syrie<br />
Tél. +963 93 471 728 +963 93 471 728 – Fax +963 11 213 8336 - nerc@mail.sy<br />
; ashrafkraidy@yahoo.com<br />
41 Mme Fabienne LEMARCHAND-COPREAUX<br />
Journaliste<br />
Mob. +33 6 66 21 57 28 - copreaux@free.fr<br />
42 M. Mario LIONETTI, Expert - Italian Ministry for the Environment Land and Sea,<br />
Department for Environmental Research and Development<br />
Via C. Bavastro 174, 00147 ROME, Italie<br />
Tél. +39 06 57 22 81 15 – Fax +39 06 57 22 81 78 -<br />
Lionetti.Mario@minambiente.it<br />
43 Mme Maryse LOUIS, Programs Manager - Economic Research Forum<br />
7 Boulos Hanna Street, Dokki, LE CAIRE, Egypte<br />
Tél. +202 748 55 53 - +44 774 334 65 63 Fax +202 761 60 42 -<br />
mlouis@erf.org.eg<br />
Summary Report<br />
CDM<br />
Workshop<br />
Paris,<br />
May 2006<br />
44 M. Philippe MASSET, Chef du Département des Programmes Internationaux,<br />
ADEME (Agence de l'Environnement et de la Maîtrise de l'Energie)<br />
27, rue Louis Vicat, 75015 PARIS, France<br />
Tél. +33 1 47 65 23 92 - Fax +33 1 47 65 22 29 - philippe.masset@ademe.fr<br />
√<br />
45 M. Philippe MEUNIER, Secrétaire général, MIES - Mission interministérielle de √<br />
√<br />
√<br />
√<br />
Expert<br />
National<br />
study<br />
√<br />
√<br />
Expert<br />
Regional<br />
Study<br />
Short<br />
questionnaire<br />
Monaco<br />
Workshop,<br />
March 2007<br />
√ √<br />
√<br />
Remarks<br />
29
30<br />
Experts<br />
Members of the steering committee<br />
l'effet de serre<br />
20, avenue de Ségur, 75700 PARIS, France<br />
Tél. +33 1 42 19 15 64 - philippe.meunier@ecologie.gouv.fr<br />
46 Dr. Amit MOR, Chief executive officer - Eco Energy Ltd.<br />
Ackerstein Building, 103 Medinat Hayehudim Street, PO Box 4079, 46140<br />
HERZLIYA PITUACH, Israël<br />
Tél. +972 54 422 3720 Fax +972 9 956 4255 - Amitmor@ecoenergy.co.il<br />
47 M. Bastien NICAISE, Agent du Bureau de la Coopération Internationale,<br />
Département des Relations Extérieures de la Principauté de Monaco<br />
Tél. +377 93 15 42 29 - Fax +377 97 77 73 22 - ramoge@ramoge.org<br />
48 M. Néjib OSMAN, Directeur des Etudes et de la <strong>Plan</strong>ification, Responsable de<br />
la Cellule d'Information sur l'Energie Durable et l'Environnement – CIEDE,<br />
Agence Nationale pour la Maîtrise de l'Energie<br />
3, Rue 8000 Montpalisir B.P 213, 1073 Tunis, Tunisie<br />
Tél. + 216 71 787 700 – 288 997 - Fax + 216 71 784 624 - Mob. +216 98 647<br />
521 - osman.nejib@anme.nat.tn; dep.ciede@anme.nat.tn<br />
49 M. Costas PAPASTAVROS, Environment Officer - Ministry of Agriculture,<br />
Natural Resources and Environment - Environment Service<br />
17 Taghmatarhou Pouliou, Ayios Andreas, 1411 NICOSIE, Chypre<br />
Tél. +357 22 30 27 30/38 86 - +357 22 408 307 -+357 99 63 56 91 - Fax+357 22 44 51<br />
56 +357 22 7749 45<br />
cpapastavros@environment.moa.gov.cy; environm@spidernet.com.cy<br />
50 Mme Elena PITA, Oficina Española de Cambio Climático (OECC), Ministerio<br />
de Medio Ambiente<br />
Pza. San Juan de la Cruz s/n, 28071 MADRID, Espagne<br />
Tél. +34-91 597 66 37 - Fax +34-91 597 59 50 - EPita@mma.es<br />
51 M. Nicolas POUGET, SYNAGIR<br />
9, boulevard Malesherbes, 75008 PARIS, France<br />
Tel. +33 1 53 30 35 00 - Fax. +33 1 53 30 35 69<br />
52 Mme Mar SANTACANA, PNUE/PAM, CAR/PP - Centre d'activités régionales<br />
pour la production propre<br />
25 - 27 Milanesat street, 5th Floor, 08017 BARCELONE, Espagne<br />
Tél. +34 93 415 11 12 - Fax +34 93 237 02 86 - msantacana@cema-sa.org<br />
53 Mme Diane SEGAL, Regional Coordinator - ADEME (Agence de<br />
l'Environnement et de la Maîtrise de l’Energie)<br />
27, rue Louis Vicat, 75737 PARIS Cedex 15, France<br />
Tél. +33 1 47 65 21 79 - diane.segal@ademe.fr<br />
54 M. Faouzi SENHAJI, Professeur, I.A.V. Hassan II & GERERE (Groupe<br />
d'Etudes et de Recherches sur les Energies Renouvelables et<br />
ENERGY AND SUSTAINABLE DEVELOPMENT IN THE MEDITERRANEAN<br />
CDM<br />
Workshop<br />
Paris,<br />
May 2006<br />
√<br />
√<br />
√<br />
√<br />
√<br />
√<br />
Expert<br />
National<br />
study<br />
Expert<br />
Regional<br />
Study<br />
Short<br />
questionnaire<br />
Monaco<br />
Workshop,<br />
March 2007<br />
√ √<br />
√ √<br />
√<br />
Remarks
Experts<br />
Members of the steering committee<br />
l'Environnement)<br />
BP 6202, 10101 RABAT, Maroc<br />
Tél. +212 37 77 74 43 - Fax +212 37 77 58 45 & +212 37 77 81 35 &<br />
+212.37.77 62 46 - Mob. +212 61 23 34 34<br />
f.senhaji@iav.ac.ma; fasen@menara.ma; senhaji@mtds.com<br />
55 M. Roméo PRENGERE, Etudiant -<strong>Plan</strong> Bleu<br />
15, rue Beethoven, Sophia-Antipolis, 06560 VALBONNE, France<br />
Tél. +33 4 92 38 71 30 - +33 4 92 38 71 31 - romeoprengere@yahoo.fr<br />
56 Mle Bassima SAIDI, Assistante - <strong>Plan</strong> Bleu<br />
15, rue Beethoven, Sophia-Antipolis, 06560 VALBONNE, France<br />
Tél. +33 4 92 38 71 32 – Fax +33 4 92 38 71 31 - bsaidi@planbleu.org<br />
57 M. Henri-Luc THIBAULT, Directeur - <strong>Plan</strong> Bleu<br />
15, rue Beethoven, Sophia-Antipolis, 06560 VALBONNE, France<br />
Tél. +33 4 92 38 71 30 – Fax +33 4 92 38 71 31 - hlthibault@planbleu.org<br />
58 Mme Myriem TOUHAMI KADIRI, Programme Officer-Service Energie - UNEP<br />
Division of Technology, Industry and Economics, Energy Branch<br />
Tour Mirabeau, 39-43, quai André Citroën, 75739 PARIS Cedex 15, France<br />
Tél. + 33 1 44 37 16 30 – Fax + 33 1 44 37 14 74 - mtouhami@unep.fr<br />
59 M. Ronan UHEL, Head of Programme, Strategic Knowledge and Innovation -<br />
European Environment Agency<br />
Kongens Nytorv 6, 1050 COPENHAGUE, Danemark<br />
Tél. +45 33 36 71 30 - +45 33 36 72 31 - Fax +45 (33) 36 72 93 -<br />
Ronan.Uhel@eea.europa.eu<br />
60 M. Patrick VAN KLAVEREN, Délégué à l'Environnement International et<br />
Méditerranéen - Ministère d'Etat<br />
Place de la Visitation, 98000 MONACO, Monaco<br />
Tél. +377 93 15 21 22 – Fax +377 93 50 95 91 - pvanklaveren@gouv.mc<br />
61 M. Roberto VIGOTTI, Chair Renewable Committee – INERGIA, Sviluppo<br />
Business e Relazioni Esterne<br />
Via del Tritone 125, 00156 ROME, Italie<br />
Tél. +39 06 977 46 380 - +39 329 63 54 060 – Fax +39 06 977 46 381 -<br />
roberto.vigotti@inergia.it; info@inergia.it<br />
Summary Report<br />
CDM<br />
Workshop<br />
Paris,<br />
May 2006<br />
MCSD Working Group members CDM<br />
Workshop<br />
Paris,<br />
Expert<br />
National<br />
study<br />
Expert<br />
Regional<br />
Study<br />
Short<br />
questionnaire<br />
Monaco<br />
Workshop,<br />
March 2007<br />
√ √ √<br />
√ √<br />
Expert<br />
National<br />
study<br />
Expert<br />
Regional<br />
Study<br />
√<br />
√<br />
√<br />
√ √<br />
Short<br />
questionnaire<br />
√<br />
Monaco<br />
Workshop,<br />
March 2007<br />
Remarks<br />
Remarks<br />
31
32<br />
Experts<br />
Members of the steering committee<br />
62 M. Hicham ABOU JAOUDE, Président - UMCE-BUSINESSMED, Env-Energy<br />
90201 Jdeidet El Metn, Liban<br />
Tél.: +961 341 22 67 - h.aboujaoude@umce-med.org ; hichamaj@hotmail.com<br />
63 M. Khaled ABU ZEID, Regional Water Resources Program Manager -<br />
CEDARE (Centre for Environemnt & Development for the Arab Region &<br />
Europe)<br />
2 Elhegaz Street, P.O Box 1057, HELIOPOLIS BAHARY LE CAIRE, Égypte<br />
Tél. +20 2 451 39 21/23/24 - ext.665 - Fax +20 2 451 39 18 -<br />
kabuzeid@cedare.org<br />
64 Mme Romina BICOCCHI - LEGAMBIENTE- League for the Environment,<br />
Osservatorio sul Turismo Sostenibile, <strong>Mediterranean</strong> Observatory & Clean Up<br />
the Med Sea <strong>Action</strong>, Segreteria Organizzativa FestAmbiente<br />
Loc. Enaoli, 58010 RISPESCIA (GR), Italie<br />
Tél. +39 0564 487711 - Fax +39 0564 487740 -<br />
mediterraneo3@festambiente.it<br />
65 M. Mohamed Larbi CHAKROUN, Président - AIFM<br />
14, rue Louis Astouin, 13002 MARSEILLE, France<br />
Tél. +33 4 91 90 76 70 – Fax +33 4 91 90 71 62 - info@aifm.org;<br />
gaelle.fossoy@aifm.org<br />
66 Dr. Magdi IBRAHIM, Coordinateur des Programmes Environnement et<br />
Développement au Maghreb -ENDA Maghreb<br />
12 rue Jbel Moussa Appt. 13, JOLI COIN, 10 000 RABAT AGDAL, Maroc<br />
Tél. +212 37 67 10 61 Fax +212 37 67 10 64 - coord@enda.org.ma ;<br />
magdi@enda.org.ma ; endamaghreb@enda.org.ma<br />
67 M. Eriuccio NORA, Direttore Area Programmazione e Pianificazione Territoriale<br />
- AGENDE 21 Locali Italiane<br />
Provincia di Modena, Viale Martiri della Libertà 34, 41100 MODENA, Italie<br />
Tél. +39 059 209 350/434 - Fax Fax +39 059 209 398 -<br />
coordinamento.agenda21@provincia.modena.it; nora.e@provincia.modena.it<br />
68 M. Ioannis SPILANIS, Assistant Professor - Dept. of Environment-University of<br />
the Aegean, Laboratory of Local and Islands' Development<br />
Ex-Xenia Building, 81100 MYTILINI, Grèce<br />
Tél. +30 225 10 36 229 – Fax +30 225 10 36 290 - gspi@aegean.gr<br />
69 M. Constanttinos TRIANTAFILLOU - Maritime Sector, HELMEPA<br />
5, Pergamou Str., Nea Smirni, 17121 ATHENES, Grèce<br />
Tél. +30 210 934 3088 - Fax +30 210 935 3847 -training@helmepa.gr<br />
ENERGY AND SUSTAINABLE DEVELOPMENT IN THE MEDITERRANEAN<br />
CDM<br />
Workshop<br />
Paris,<br />
May 2006<br />
May 2006<br />
Expert<br />
National<br />
study<br />
Expert<br />
Regional<br />
Study<br />
Short<br />
questionnaire<br />
Monaco<br />
Workshop,<br />
March 2007<br />
√<br />
√<br />
Remarks<br />
Declined<br />
invitation<br />
Declined<br />
invitation<br />
Declined<br />
invitation<br />
Declined<br />
invitation<br />
Declined<br />
invitation<br />
Declined<br />
invitation
Summary Report<br />
8.3 At t a c h ment 3 – Monaco W orkshop Progra mme<br />
33
Regional workshop<br />
Energy and Sustainable Development<br />
in the <strong>Mediterranean</strong><br />
In partnership with<br />
With the financial support of<br />
With the participation of<br />
<strong>Mediterranean</strong> Commission on Sustainable Development<br />
Auditorium Rainier III<br />
Monaco, 29 and 30 March 2007<br />
Final agenda<br />
Italian Ministry<br />
for the<br />
Environment<br />
Land and Sea<br />
Institut de la<br />
Méditerranée /<br />
FEMISE
Objectives-context-mandate-partnerhsip<br />
Objectives<br />
This workshop aims at considering, according to the objectives of the “<strong>Mediterranean</strong> Strategy for<br />
Sustainable Development” Energy chapter, the stock of the situation about the promotion of Rational<br />
Use of Energy (RUE) and renewable energy (RE). It will enable the participants to examine the economic<br />
stakes that are related to it, to comment experiences carried out in some <strong>Mediterranean</strong> countries<br />
and to address recommendations to the <strong>Mediterranean</strong> Commission on Sustainable Development and<br />
to the decision makers.<br />
Context<br />
After the setting of the <strong>Mediterranean</strong> Commission on Sustainable Development (MCSD) in 1996, the<br />
Contracting Parties to the Barcelona Convention (the 21 <strong>Mediterranean</strong> countries and the European<br />
Community) adopted in November 2005, the “<strong>Mediterranean</strong> Strategy for Sustainable Development”<br />
(MSSD). The second priority topic of the MSSD is “Improved rational use of energy, increased renewable<br />
energy use and mitigation of and adaptation to climate change”.<br />
In this field of action, the main objectives of the MSSD are to:<br />
v<br />
v<br />
v<br />
v<br />
v<br />
Promote the rational use of energy (RUE)<br />
Enhance the potential of renewable energy (RE)<br />
Control, stabilize or reduce, as appropriate, emissions of greenhouse gasses<br />
Mainstream measures for adaptation to climate change among the major objectives in national<br />
development plans<br />
Increase access to electricity in rural areas, where necessary<br />
The MSSD is a framework strategy. It may guide the elaboration of national strategies for sustainable<br />
development (NSSD) or help the up-date of existing ones. It must be properly understood that each<br />
country must fix its own objectives. The MSSD calls also for strengthening the regional cooperation<br />
on sustainable development to reach targeted goals as well as for an intensified follow-up of the progress<br />
made and regional experiences sharing.<br />
The works undertaken on the MSSD account are closely hinged on those conducted on the international<br />
level, in particular those programmed by the United Nations Commission on Sustainable Development<br />
whose 2006-2007 cycle (CSD 14 and CSD 15) deals in particular with “climate change and<br />
energy resources for sustainable development”.<br />
Mandate<br />
<strong>Plan</strong> Bleu has been assigned to follow up the <strong>Mediterranean</strong> Strategy for Sustainable Development and<br />
to deeper analyse “energy – climate change” priority field from 2006-2007 onwards.<br />
In this context, the activities carried out enable to document a set of indicators, to deepen analyses<br />
and to identify good practices.<br />
Partnership<br />
Activities have been carried out with volunteer countries, the EU authorities and regional partnerships<br />
and initiatives in “energy-climate change” field.<br />
The activity, coordinated and facilitated by <strong>Plan</strong> Bleu, has been conducted in close partnership with<br />
<strong>Mediterranean</strong> networks and institutions specialized in energy: OME, MEDENER, ADEME, ME-<br />
DREP programme. The Institut de la Méditerranée/FEMISE and Barcelona CP/RAC also contributed<br />
to the activity. HELIO International NGO also took part in works and synergies were found with<br />
UMET. These partners constituted a technical Steering Committee for these activities.<br />
ADEME and the Italian Ministry for the Environment, Land and Sea provided their financial contribution<br />
to the activities. The Principality of Monaco hosts and partially finances this workshop.
08h15-8h45 Welcome of participants<br />
DAY 1 - 29 MARCH 2007<br />
08h45-9h15 Opening – Welcome<br />
Welcome speech by Mr Patrick Van Klaveren, Head of International and <strong>Mediterranean</strong> Environment<br />
Service, Principality of Monaco<br />
Mr Henri Luc THIBAULT, <strong>Plan</strong> Bleu Director<br />
Session 1 Regional framing: energy situation<br />
Chairman : Mr Henri-Luc THIBAULT, <strong>Plan</strong> Bleu Director<br />
09h15-10h45 Objective: this session will enable to remind <strong>Plan</strong> Bleu activities in this area, the recent trends in the<br />
region, the progress achieved towards the MSSD objectives and the situation at the European level<br />
v The energy situation and sustainable development in the <strong>Mediterranean</strong>, outlook (<strong>Plan</strong> Bleu report),<br />
MSSD and priority indicators, Stéphane QUEFELEC, <strong>Plan</strong> Bleu, 15 min<br />
v Energy trends in the <strong>Mediterranean</strong> as from 2000, Mr Habib ELANDALOUSSI, Observatoire Méditerranéen<br />
de l’Energie, 15 min<br />
v Energy and Environment in the European Union, Ronan UHEL, the European Environment Agency,<br />
presentation of the 2006 report « Energy and Environment in the European Union », 15 min<br />
v Discussion/questions : 45 min<br />
10h45-11h00 Coffee break<br />
Session 2 Regional framing: economic issues<br />
Chairman : Mr Stéphane POUFFARY, ADEME, Head of the International Expertise Division for Energy<br />
Management, Renewable Energy, Networks and Energy Markets Management<br />
11h00-13h00 Objective: this session will enable to address the economic and financial issues connected to the<br />
development of renewable energy and to rational use of energy actions and spill-over effects that<br />
might be linked to it.<br />
v<br />
v<br />
v<br />
v<br />
13h00-14h30 Lunch<br />
Economic approach: regional study, Institut de la Méditerranée/Femise/Frédéric BLANC, 15 min<br />
Progress achieved in terms of projects, carbon market development and involvements in the <strong>Mediterranean</strong><br />
region, Christian De PERTHUIS/Caisse des Dépôts, 15 min<br />
Development aid and RE/RUE: regional study, <strong>Plan</strong> Bleu/Samir ALLAL, 15 min<br />
Economic effects and spill-over impact linked to the development of renewable energy, UNEP/<br />
DTIE, Myriem TOUHAMI, 15 min<br />
Discussion/questions, 60 min<br />
v<br />
Reporters : Anne GED and Francesco PRESICCE<br />
Information about the programme of the afternoon<br />
14h45-15h00 Transfer to «salon» EVER 2007- By invitation only<br />
15h00-16h30 Opening session «salon» EVER 2007 on renewable energy<br />
Participation to the opening session in the presence of Prince Albert II<br />
16h30–17h30 Free visit of the EVER 2007 exhibition<br />
17h30–18h00 Transfer to the Auditorium Rainier III<br />
18h00-19h00 Projection of “An Inconvenien Truth”, film realized by Davis Guggenheim (leading role: Al Gore)<br />
19h15 Cocktail offered by the Principality of Monaco at the Atrium of the Centre Rainier III<br />
Free evening
DAY 2 - 30 MARCH 2007<br />
Session 3 Round table<br />
Chairman: Mr Roberto VIGOTTI, OME Steering Committee chairman of « Renewable Energy and<br />
Sustainable Development »<br />
Objective : The chairman will hand over to each expert by asking one or several questions about the<br />
situation in their country. They will be asked to take stock of the progress achieved in terms of RE and<br />
RUE policies, to identify the obstacles, the best levers, the best practices and the proposals for a more<br />
sustainable energy development.<br />
08h30–10h30 Round table 1 – Experiences in the Southern and Eastern <strong>Mediterranean</strong> countries<br />
v<br />
v<br />
v<br />
10h30–10h45 Coffee break<br />
Morocco, Mr Mohamed BERDAI v Tunisia, Mr Samir AMOUS<br />
Libya, Mr Mohamed Ali EKLHAT v Egypt, Mr Rafik Youssef GEORGY<br />
Discussion/ debate / questions : 45 minutes<br />
10h45–12h45 Ruond table 2 - Experiences in the Balkans, Israel and the northern shore<br />
v<br />
v<br />
v<br />
v<br />
Bosnia Herzegovina, Ms Semra FEJZIBEGOVIC v Israel, Mr Amit MOR<br />
Cyprus, Mr Costas PAPASTAVROS v Italy, Mr Mario LIONETTI<br />
Malta, Mr George CASSAR v Spain, Ms Virginia ALZINA<br />
Discussion /questions : 30 minutes<br />
Reporters: Houda BEN JANNET-ALLAL and Rabea FERROUKHI<br />
12h45-13h45 Lunch - buffet in the Auditorium<br />
Session 4 Civil society and international institutions view<br />
Chairman: Mr Benaïssa AYADI, Director General ANME-Tunisia<br />
Objective : take into consideration the point of view of the civil society and international institutions.<br />
The session chairman will request participants to deliver 2 proposals/messages for the development of<br />
renewable energy policies and 2 proposals/messages in favour of rational use of energy policies they<br />
consider to be of top priority.<br />
13h45-15h45 Introduction to the discussion<br />
15h45-16h00 Coffee break<br />
v Summary of the key messages and recommendations contained in the national reports, Houda BEN<br />
JANNET-ALLAL & Rabéa FERROUKHI /OME, 10 min<br />
Presentations<br />
v<br />
v<br />
v<br />
v<br />
v<br />
Recommendations by the International Energy Agency, Mr Roberto VIGOTTI, 15 min<br />
Civil society view, NGO, HELIO International, Hélène CONNOR, 15 min<br />
Donors view, Agence Française de Développement, Mr Alexis BONNEL, 15 min<br />
Need of an international benchmarking on energy efficiency, ADEME, Didier BOSSEBOEUF, Economist,<br />
15 min<br />
Discussion and questions, 50 min<br />
All participants will deliver their points of view to complete the proposed summary, proposals and key<br />
messages to be considered and passed on to.<br />
Session 5 Main messages and recommendations for the MCSD<br />
Chairman: Mr Henri Luc THIBAULT, <strong>Plan</strong> Bleu Director<br />
16h00-16h45 Summary of messages and general recommendations, <strong>Plan</strong> Bleu, 15 min<br />
Discussion, 30 min<br />
Adoption of general recommendations and conclusions by the chairman<br />
16h45-17h00 Workshop closing and thanks<br />
Mr Patrick VAN KLAVEREN, Head of International and <strong>Mediterranean</strong> Environment Service, Principality of<br />
Monaco<br />
Mr Lucien CHABASON, President of <strong>Plan</strong> Bleu
34<br />
ENERGY AND SUSTAINABLE DEVELOPMENT IN THE MEDITERRANEAN<br />
8.4 At t a c h ment 4 – Energy c ha pte r of t h e MSSD<br />
Chapter 2: Ensuring sustainable management of energy and mitigating of and<br />
adapting to the effects of climate change<br />
The energy consumption of <strong>Mediterranean</strong> countries, which are highly dependent on fossil<br />
fuels, has more than doubled over the past 30 years. Many <strong>Mediterranean</strong> countries have<br />
established pricing and tax structures that are not conducive to energy saving. Moreover,<br />
there is insufficient encouragement for renewable sources of energy. Should this trend<br />
continue, the <strong>Mediterranean</strong>’s contribution to total global greenhouse gas emissions could<br />
rise from 7% to 9%. In addition, the region’s energy dependence could greatly increase. This<br />
situation is all the more regrettable in that the <strong>Mediterranean</strong> is an eco-region that is<br />
particularly vulnerable to climate change, has a significant potential for renewable energy<br />
from natural sources (sun, wind, etc.) and could derive substantial savings from the rational<br />
use of energy. Policies which follow these orientations would encourage technological<br />
progress, create employment opportunities and increase productivity. Decisive<br />
implementation of the Untied Nations Framework Convention on Climate Change and of its<br />
Kyoto Protocol by the countries that have or will have ratified it would also provide short and<br />
long-term local and global benefits, in particular by strengthening the regional cooperation<br />
and funding sustainable development projects in <strong>Mediterranean</strong> developing countries.<br />
Objectives<br />
Promote the rational use of energy.<br />
Enhance the potential of renewable energy.<br />
Control, stabilise or reduce, as appropriate, emissions of greenhouse gases.<br />
Mainstream measures for adaptation to climate change in national development plans.<br />
Increase access to electricity in rural areas, where necessary.<br />
Orientations and actions<br />
Promote energy-saving policies and renewable and cleaner energies<br />
1) Establish overall and sectoral objectives for the promotion of rational energy use and the<br />
development of renewable energies in national and local strategies for sustainable<br />
development. A desirable target for reducing the intensity of energy consumption per unit<br />
of gross domestic product by 2015 could be in the range of 1-2% per year. A desirable<br />
target for renewable energy would be to meet 7% of the total demand for energy by such<br />
means by 2015, excluding renewable combustibles and waste (CWR).<br />
2) Encourage economic actors, local authorities and consumers to adopt sustainable<br />
energy-saving habits through pricing, targeted subsidies, tax incentives and public<br />
awareness-raising campaigns, supported by NGOs. Encourage economic mechanisms,<br />
such as Tradable Renewable Energy Certificates (TRECs), and regulations designed to<br />
promote renewable energies.<br />
Strengthen regional cooperation and support the implementation of the Framework<br />
Convention on Climate Change and its Kyoto Protocol<br />
3) Invite <strong>Mediterranean</strong> countries to cooperate in the implementation of the United Nations<br />
Framework Convention on Climate Change and flexibility mechanisms of its Kyoto<br />
Protocol, to prepare for the post-2012 phase and make progress towards regional<br />
investment designed to reduce greenhouse gas emissions.<br />
4) Develop synergies with the <strong>Mediterranean</strong> Renewable Energy Programme (MED REP),<br />
the Rome <strong>Mediterranean</strong> Energy Platform (REMEP) and the Euro <strong>Mediterranean</strong> Energy<br />
Policy.<br />
Adapt to climate change<br />
5) Mainstream the concept of adaptation to climate change in national policies. Develop<br />
plans to anticipate risks and adapt the most exposed <strong>Mediterranean</strong> areas, especially<br />
islands, deltas and arid agricultural zones, to climate change.
Access to electricity<br />
Summary Report<br />
6) Support projects and investments for access to electricity. A desirable target by 2015<br />
(compared with 1990) would be to halve the proportion of the population in developing<br />
countries who do not have access to electricity.<br />
Besides this, in the third part of the MSSD, implementing of the strategy together with the<br />
partners and progress monitoring are recommended:<br />
Implementing of the strategy: cooperation (strengthening of solidarity and of the respective<br />
commitments of the Euro-Med partners. Human capital, funding, national strategies for<br />
sustainable development and strategies in the priority areas of activity<br />
Organising the monitoring of progress:<br />
Importance of the role of MAP/MCSD, relevant framework (<strong>Mediterranean</strong>) for the progress<br />
monitoring<br />
Strengthening of the observatory networks, measuring progress: policy assessments :<br />
indicators, analyses of good practices, other targeted information.<br />
Monitoring indicators:<br />
5 of the 34 priority indicators for the monitoring of the MSSD in the energy sector.<br />
10 to 15 sub-indicators should be proposed for more accurate monitoring of progress in<br />
each of the priority areas.<br />
35
36<br />
ENERGY AND SUSTAINABLE DEVELOPMENT IN THE MEDITERRANEAN<br />
8.5 At t a c h ment 5 – Summary o f th e sub re gional w orkshop:<br />
“ C D M in t he south ern Me di terranean countries, stre ngths and<br />
w eaknesses, cha l lenges and pr ospects – links w i th EE and RE ”<br />
Summary report of the workshop “CDM in the southern <strong>Mediterranean</strong> countries: strengths<br />
and weaknesses, challenges and prospects - links with the EE & ER projects” organised by<br />
<strong>Plan</strong> Bleu and UMET with the support of ADEME, CEA, OME and UMET, 5th May 2006, 9,<br />
Avenue Malesherbes, Paris 75008 (Synagir) – France, 9 00 AM – 7 00 PM<br />
INTRODUCTION<br />
In the framework of <strong>Plan</strong> Bleu’s 2006-2007 mandate to follow up the chapter on « Energy and Climate Change » of the<br />
<strong>Mediterranean</strong> Strategy for Sustainable Development (MSSD) and of UMET’s activities for the consideration of the matter, <strong>Plan</strong><br />
Bleu and UMET, under the aegis of the <strong>Mediterranean</strong> Commission on Sustainable Development, organised a joint regional<br />
workshop on the Clean Development Mechanism (CDM) in the southern <strong>Mediterranean</strong> countries. This workshop was held in<br />
Paris on 5th May 2006.<br />
This summary synthesises the main observations and reflections developed by the participants in the workshop. It was drawn<br />
up by the members of <strong>Plan</strong> Bleu’s technical pilot committee on « Energy and Climate Change » who were present at the<br />
workshop on the basis of the in-depth minutes of this workshop.<br />
The main reasons for the scheduling of this workshop were the complexity of the topic, the opacity of the procedures and of the<br />
language, the fact that the southern <strong>Mediterranean</strong> countries are relatively late in this area compared to other countries and<br />
regions of the world, as well as the need to exchange regional experiences.<br />
The workshop brought together about thirty experts and specialists in the matter and several institutions participated: ADEME<br />
(French Agency for Environment and Energy Management), CEA (French Atomic Energy “Commissariat”), OME (<strong>Mediterranean</strong><br />
Energy Observatory), IMET (Italian Ministry of the Environment), IEPF (French-speaking nations Institute for Energy and the<br />
Environment), CDER (Moroccan Centre for the Development of Renewable Energy), ANME (Tunisian National Agency for<br />
Energy Management), CIEDE (Tunisian Information Cell for Sustainable Development and the Environment), CDC (French<br />
deposits and consignations fund), OECC (Spanish office on climate change) – Spanish Ministry of the Environment), ICF (<br />
Italian Carbon Fund – Italian Ministry of the Environment), Monaco International Cooperation Office, AFD (French development<br />
agency), UNEP-TIED (United Nations Environment Programme – Technology, Industry and Economy Division), World Bank,<br />
MIES (French inter-ministry mission for greenhouse gases) and CP-RAC (<strong>Action</strong> <strong>Plan</strong> for the <strong>Mediterranean</strong> (Barcelona)<br />
Regional Activity Centre for Cleaner Production).<br />
SUMMARY<br />
The purpose of this workshop was to assess the CDM situation in the region, to share experiences and, with the stakeholders<br />
and specialists concerned, to apprehend the questions of the operational implementing of CDM projects (EnR and URE<br />
especially) and to learn lessons from this so as to enable the region to benefit as much as possible from this mechanism. This<br />
synthesis includes the main ideas discussed during the workshop:<br />
1. CDM was included in the Kyoto protocol with the aim of helping the parties mentioned in Appendix I to fulfil their<br />
commitments while promoting the sustainable development of the non-Appendix I parties. It is based on private<br />
investment in projects to reduce greenhouse gases (GHG) in developing countries. One of the advantages of CDM for the<br />
latter is to have the CER (Certified Emission Reductions) costs borne by the Appendix I countries.<br />
2. Observation of current CDM trends demonstrates that investors are generally attracted, as is the case for all types of<br />
investment, by high returns on investment and, therefore, in competitive prices, low financial risk and few commercial<br />
barriers. In this way, competition is developing among the countries to welcome these projects. Purchasers tend to invest<br />
when risks are low and profit prospects high, often in the few countries where direct private foreign investment is already<br />
concentrated. Consequently, CDM projects are practically all oriented to a limited number of countries, mainly India, Brazil<br />
and China. Africa and, to a very little extent, the <strong>Mediterranean</strong> benefit less. Currently, 172 projects have been filed. There<br />
has, however, been sharp acceleration (63 projects) since the Montreal Conference. In May 2006, 744 new projects are in<br />
the pipeline (representing 341 Mt CO2 avoided).<br />
3. The main achievement since the Montreal Conference is the setting up of CDM technical management tools, with a higher<br />
budget allocated to file investigation and the recruitment of a number of collaborators. The constraints associated with the<br />
slow processing of the files are at present being lifted. Now the problem is the offer of high quality projects. The<br />
benchmark organisation «point carbon » has identified a set of 3000 JI (Joint Implementation) and CDM projects, 2700 of<br />
which are in the constitution phase. But in terms of tonnes of CO2 avoided, the volumes are still marginal: around 5 million<br />
tonnes per annum, i.e. 340 million tonnes by 2012. Nevertheless these amounts should increase as the project offer gets<br />
underway.<br />
4. Analysis of the market structure shows a difference depending on whether the number of projects or their CO2 equivalent<br />
is considered. Indeed, only a small number of projects avoids a considerable number of tonnes of CO2. Similarities with<br />
the SO2 market that has functioned in the USA for several years can be noticed. This market has a limited number of<br />
projects representing a very high volume of CER. The market does not depend so much on the number of projects but<br />
rather on the volume of CER per project. This being the case, once the larger projects have been carried out, the market<br />
will probably go in the direction of smaller projects.<br />
5. Examination of the geographical division of CDM demonstrates that India and China count for half of the projects. Four<br />
countries – India, South Korea, China and Brazil – represent 90% of the CER (1/3 of which are for China) concentrated on
Summary Report<br />
two greenhouse gases (N2O and HFC), more than ¾ of the reduced volumes. Seven projects are currently underway: 2<br />
in South Korea, 2 in Brazil, 2 in China, 1 in India. In the <strong>Mediterranean</strong> 3 CDM projects have been registred in Morocco (2<br />
for wind energy and 1 for solar energy) with 223 000 CER / annum on average and 1 371 000 CER expected by 2012.<br />
Four CDM projects are in the validation stage (1 in Morocco, 2 in Tunisia and 1 in Egypt).<br />
6. At the present time, analysis of the nature of the current CDM projects indicates that they do not concern either the<br />
rational use of energy or renewable energy, but rather industrial gas. The low cost of carbon per tonne is to blame. Land-<br />
fill sites and agriculture represent a large part too. Thus, projects concerned with renewable energy only develop if the<br />
price per tonne of carbon increases. « Renewable energy » projects also have the disadvantage of their small size as well<br />
as the fact that transaction costs for these projects are relatively high compared with the same cost for larger projects. A<br />
solution to this problem was discussed by the participants: project grouping would seem to be the answer.<br />
7. The evolution in the price per tonne of CO² is also a factor of incertitude, accentuated in recent weeks by fluctuations on<br />
the European market. The price per tonne of CO2 has recently been hard hit. At the end of April, several countries<br />
including France and Spain announced the quantities of CO2 emitted last year: they were lower than expected. This<br />
means that there is a surplus of quotas on the market, giving rise to a drop in the price (price divided by 3 in 5 market<br />
days between end April and the beginning of May 2006). The design of the European market that offers a short term view<br />
(3 years) is called into question. CDM demand was built on the concept of a link between the price of CDM/JI CER and<br />
the price of CO2 in Europe. Indeed, at the approach of 2012, the European market seemed to be the largest supplied in<br />
terms of purchases and the most profitable one too. Some contracts were higher than 15 euros a tonne because of this.<br />
Recent events have demonstrated that there will be less need for CER than anticipated for European industrialists by<br />
2008. The market is, therefore, called into question and the recent correction alters the conditions in which CDM projects<br />
will develop.<br />
8. On the world market, and since the Montreal Conference, important changes of a varied nature in the purchasers’<br />
behaviour have been noticed. Japan has become a big purchaser, although it is not known whether it is the state or the<br />
industrialists who are buying. In Canada the new government does not seem to be going in the direction of strengthening<br />
of the Kyoto institutional system and there are risks of a reversal of Canada’s position on the application of the protocol.<br />
On the other hand, the United States is making progress with several local projects emerging - such as Climate<br />
Exchange. Industrialists anticipate a carbon problem, including when buying CERs. The real deadline remains the<br />
presidential elections in 2008.<br />
9. In this new context, the participants emphasised the importance of regional sharing of competence for the designing of<br />
projects. For instance, India has set up a specific task force for « project production ». However, in Africa and in the<br />
<strong>Mediterranean</strong> countries, each CDM project is designed case by case, without capitalising experience. It would seem,<br />
therefore, that those who present the projects are not sufficiently aware of the negotiation processes or of the practical<br />
difficulties to be surpassed in order to carry out their projects in optimum conditions. Things are getting better, however:<br />
Tunisia has recently created a specific task force to identify CDM projects; In several southern <strong>Mediterranean</strong> countries,<br />
NDAs have been set up or are being set up (Tunisia, Morocco, Algeria, and so on); Morocco has filed several projects.<br />
But the learning process takes several years and it still has far to go.<br />
10. In the future, CDM will play a more and more important role, so the years of negotiation to come should be used to design<br />
the teams and to manage the channels through which projects can be built. Now, the difficulties that the developing<br />
countries face when launching their projects should no longer be allowed to lead to failure or to refusal to act. The<br />
<strong>Mediterranean</strong> countries have become aware that without a learning process, they risk being excluded from the CDM<br />
market. The question of CO² is in any case more and more present in development projects and projects that do not take<br />
this into account risk being excluded from official development aid (ODA). Other questions still have not been solved to<br />
develop CDM projects: the definition of “additionality” which is still a problem, the processes and procedures made too<br />
technocratic thus leading to exclusion and representing a real cutting off from civil society, as well as the temptation of the<br />
industrialists to hunt for big projects at little cost.<br />
11. Even if, from the point of view of the developing nations, CDM is disappointing at present given the number of projects<br />
that emerge, the stakes now concern the preparation of post-Kyoto. A meeting will be held in Paris in September.<br />
Discussions will focus on what could be a good post-Kyoto negotiating position for the developing countries and especially<br />
for Africa and the <strong>Mediterranean</strong> region. The question of positive discrimination for small projects was raised. Besides this,<br />
and for the post-Kyoto negotiation, the possibility for the developing countries to have commitments to limited GHG<br />
emissions without constraints and without the risk of loss will be discussed. Target objectives could be proposed to these<br />
countries. If the commitments were not respected, there would not be penalties. On the other hand, the countries that did<br />
better than their commitment could sell their surplus yield.<br />
12. One of the difficulties for implementing lies in the different approaches of the countries of the North and those of the South<br />
concerning CDM: for the North, CDM is an environmental issue; for the South CDM is a tool to solve development issue.<br />
Whether the logic is a development one or an environmental one, sometimes they can be contradictory. Besides this, in<br />
the South, CDM projects are generally studied or managed by environmental specialists, not by development ones. This is<br />
the reason for the difficulties in implementing CDM projects and in the mutual understanding of the various parties<br />
involved in the projects.<br />
37
38<br />
ENERGY AND SUSTAINABLE DEVELOPMENT IN THE MEDITERRANEAN<br />
13. CDM cannot be a substitution for the countries’ public policies. CDM participates in these policies and has to develop with<br />
them coherently. In the less developed countries, the personnel, isolated in the ministries of the environment, often find it<br />
difficult to activate private finance sector and industry; the removal of these partitions is very hard to carry out. It would be<br />
better for the countries to identify priority sectors, to gather together people concerned around a table to develop a<br />
coherent set of projects. To facilitate this, official development aid should be concentrated on the capacity to implement<br />
rather than on the projects themselves.<br />
14. CDM should find a place with regard to Official Development Aid (ODA). ODA should be considered as a starter that is<br />
only useful if private investment takes the relay. About 90% of the 110 billion dollars of direct investment abroad is<br />
concentrated in ten non-<strong>Mediterranean</strong> countries. Obviously, the same tendency can be noticed for CDM projects. On the<br />
other hand, for installations and facilities ODA is focused more on other countries, notably <strong>Mediterranean</strong> ones. Even if<br />
ODA is low compared to direct investment abroad, it remains an important source for the financing of infrastructure. When<br />
the financing of these facilities calls on a public-private partnership, as in the area of water, CDM should be able to find its<br />
place even though this is not the case at present. In the case of water installations, it is easy to have drinking water paid<br />
for but it is much more difficult to finance waste water collection and treatment. The social chapter on CDM could find its<br />
place in such a case.<br />
15. Several participants pleaded for the development of sectional policies and for sets of associated projects that would be<br />
useful for the country’s development and that could be eligible for CDM, in the construction and transport sector, for<br />
instance, that offers great potential in the <strong>Mediterranean</strong> region. The World Bank promotes these targeted sectional<br />
approaches. Currently, the developing countries’ main investments are concentrated on infrastructure and construction,<br />
but there are no CDM projects in these sectors. The consequence is a gap between the sectors requiring a lot of<br />
investment and the sectors on which CDM projects are focused. The challenge for countries is to prepare sectoral policies<br />
so as to re-orient CDM investments toward sectors that really need investment for development. The banking sector of the<br />
countries of the South should be able to help if it is more involved.<br />
16. In an analysis of the existing projects, the participants also emphasised the important risk of seeing CDM projects develop<br />
that will not have impact on sustainable development. The designated national authorities (DNA) have a crucial role to<br />
play in this matter. CDM projects are also complex financial projects. Within the financial package, the question of the rent<br />
formation, its division among the stakeholders and of the countries’ ability to negotiate should be asked. The idea of<br />
positive discrimination remains to be explored.<br />
17. The key factor for the success of CDM is participation by the private sector. It is a market mechanism and as such cannot<br />
work with only one player. The fact that the local economic sector has not appropriated CDM limits its use. In Tunisia the<br />
energy efficiency projects have not convinced the banks. The main reason is that the latter are not familiar with the sector.<br />
On the other hand, if they become interested and acquire competence in this field, they will no doubt become serious<br />
CDM partners. Thus, the future depends on the appropriation of CDM by local partners.<br />
18. Despite mitigated observation about CDM, it should be noted that transition is underway, and this should be accelerated<br />
and accompanied. The first type of transition is technological and should, with the increase in market size, permit real<br />
economies of scale for the projects. The second type of transition is geographical: Investors first focus on the large<br />
attractive countries such as China, India and Brazil, and only afterwards on countries such as Morocco, Tunisia, Egypt,<br />
and so on. Investors are much more reluctant concerning the sub-Saharan countries. The third type is institutional and<br />
involves a lot of uncertainty: What will the post-Bush policy be? And Canada’s, etc.? Finally, the fourth type of transition<br />
concerns markets: indeed, it will be necessary to pass from independent markets to an integrated global market.<br />
19. For the moment, CDM does not seem to be a solution to the <strong>Mediterranean</strong> countries’ development needs. Yet, with all<br />
this transition underway, the participants are in agreement about the fact that the attractiveness of the <strong>Mediterranean</strong><br />
countries for CDM projects could increase. The question that arises is: why is it so difficult to have a real regional policy<br />
concerning CDM while the logical way to work is in this direction? The question of creating a <strong>Mediterranean</strong> carbon fund<br />
and of the ways it would work and be supplemented is again being asked. A joining of forces and working together could<br />
lead to the minimising of transaction costs, more projects and better appropriation of CDM by the countries concerned. At<br />
the <strong>Mediterranean</strong> Region level, the question of CDM should also be linked to the energy debate, the depletion of non-<br />
renewable resources, the post-Kyoto debate and the priority development projects in the region. The examination of<br />
priority areas for the development of the south and east <strong>Mediterranean</strong> and the objectives of reducing greenhouse gases<br />
demonstrate that there is a strong synergy between these factors. CDM, but not alone, can play a role and offer<br />
opportunities for action to all the stakeholders.<br />
20. Things evolve quickly and it is essential for the <strong>Mediterranean</strong> countries which are potential CDM host to prepare (and/or<br />
accelerate their preparation- see point 9) as of now so as to be present later, after the ten years or so of maturity that are<br />
necessary. The stakeholders in the countries should be in a position to appropriate these projects, build a sectoral and<br />
programmatic cluster approach, integrating objectives and projects that include energy efficiency and renewable energy.<br />
21. Among the Appendix 1 <strong>Mediterranean</strong> countries, Spain, Italy and Monaco are already active, or would like to be, in the<br />
development of CDM projects. These countries participate or have created financial instruments (carbon funds,<br />
participation, and so on) and are developing specific administrative and institutional competence. Spain wishes to focus its<br />
CDM investments in Latin America and North Africa (it has signed an agreement with Morocco). One of the sectors<br />
focused on is energy efficiency. Italy focuses its interest on the <strong>Mediterranean</strong> and the Balkans. The World Bank is also
Summary Report<br />
an important CDM stakeholder in the MENA (Middle East and North Africa) region. The AFD worked in close collaboration<br />
with the World Bank in this field and has increased its expertise. A recent FFEM financing support has recently allowed<br />
AFD and the WB to elaborate a cooperation program to help African countries in elaborating CDM project. Northern<br />
African countries are included in this program which should start soon.<br />
22. In conclusion: the workshop highlighted the current limits of CDM as a financial instrument for the projects (renewable<br />
energy, energy efficiency, projects for infrastructure and equipment that use little carbon) in the <strong>Mediterranean</strong> region. It<br />
emphasised the need to articulate all of the financing mechanisms likely to contribute to « cleaner development » in the<br />
<strong>Mediterranean</strong>, going far beyond the framework of the market mechanisms that CDM represents as it stands today. The<br />
participants insisted on the necessity to reflect about the respective but complementary roles of official development aid<br />
and of available funds in the framework of other international conventions concerning the environment, in banks and<br />
international, regional and national financial institutions, with the objective of working out a coherent, transparent and well-<br />
balanced system to finance cleaner development of the <strong>Mediterranean</strong> region.<br />
39
40<br />
ENERGY AND SUSTAINABLE DEVELOPMENT IN THE MEDITERRANEAN<br />
8.6 At t a c h ment 6 – List o f MSSD f ollow up indicato rs<br />
List of priority indicators for Energy and Climate Change<br />
Energy intensity (total and by sector)<br />
Share of renewable energies in energy balance<br />
Greenhouse gas emissions<br />
Amount financed in the framework of the Kyoto Protocol flexibility mechanisms by the annex<br />
1 countries to the benefit of other <strong>Mediterranean</strong> countries<br />
Complementary Indicators List<br />
Energy and Climate Change<br />
External Energy Dependency<br />
RE capacity installed per inhabitant<br />
Efficiency of electricity conversion and distribution<br />
Number of energy infrastructures in coastal areas<br />
Final consumer energy price per fuel and per sector<br />
Existing incentive measures and policies for RE and RUE development at national level<br />
Cities/regions/provinces with an existing energy audit and/or a carbon audit and/or with<br />
objectives in terms of RE and RUE<br />
Expenditures in RE and RUE: RE and RUE programmes share in energy investments and<br />
R&D expenses<br />
Official development assistance share in the energy field devoted to RE and RUE<br />
Share of the population with no access to electrification<br />
Share of fuel and electricity expenditures in household budgets<br />
Job creation through the development of renewable energies and rational use of energy<br />
Frequency of ozone pick
Summary Report<br />
8.7 At t a c h ment 7 – Indi cato r sheet for 3 prior i t y i ndicators<br />
41
<strong>Mediterranean</strong> Strategy for Sustainable Development Follow-up y<br />
Ensuring sustainable energy control, reducing the effects of<br />
climate change and adapting<br />
The energy system in the <strong>Mediterranean</strong> is<br />
characterised by: (i) its vulnerability, notably<br />
in terms of price and supply; (ii) the unequal<br />
distribution of natural resources and of<br />
access and consumption of energy among<br />
the countries and (iii) the sometimes<br />
irreversible damage caused to the<br />
environment and to human health.<br />
If the trends observed over the last thirty<br />
years continue, total primary commercial<br />
energy demand in the <strong>Mediterranean</strong> could<br />
go up from 945 by 2005 to 1357 Mtoe by<br />
2020 and to be satisfied by fossil energy for<br />
more than 80 %. (according to the OME<br />
scenarios carried out for <strong>Plan</strong> Bleu.)<br />
This energy development model would not<br />
seem to be compatible with sustainable<br />
development objectives.<br />
The stakes today are to meet the energy<br />
needs that are rising rapidly in the<br />
<strong>Mediterranean</strong>, without aggravating local<br />
and global impact on the environment, while<br />
remaining competitive thanks to<br />
management of consumption, energy-saving<br />
and renewable energy in a more and more<br />
open, competitive market and in an<br />
international energy context that is more and<br />
more volatile and unsure.<br />
<strong>Plan</strong> Bleu’s scenarios find an answer to these<br />
stakes by demonstrating the environmental,<br />
social and economic relevancy of developing<br />
large-scale renewable energies in the region<br />
and of cashing in on energy savings.<br />
ENE Updated on 02/05/2007<br />
Monitoring of MSSD indicators has drawn up<br />
a mitigated balance sheet concerning the trends<br />
towards renewable energy integration (RE) in<br />
mixed energies, the evolution of control over<br />
the consumption and CO2 emission linked to<br />
the combustion of fossil energy resources:<br />
Energy intensity is progressing very slowly<br />
in the <strong>Mediterranean</strong>; the trends observed<br />
will not enable us to reach the objective of<br />
between 1 and 2 % improvement per<br />
annum. However, in absolute terms, there is<br />
better performance in the region than in the<br />
world overall.<br />
The share of RE is not progressing. It was<br />
3% in 2004 (as in 1995). A strong break<br />
from the present trend will be necessary to<br />
reach the objective of 7% by 2015.<br />
Nevertheless, the production of renewable<br />
energy is strongly progressing in the<br />
northern countries, as well as in those of the<br />
south and east. Some <strong>Mediterranean</strong><br />
countries have developed sources of<br />
renewable energy in a spectacular way (e.g.:<br />
wind energy in Spain, solar water heaters in<br />
Cyprus).<br />
The <strong>Mediterranean</strong> region is rapidly<br />
increasing greenhouse gas emissions.<br />
According to the OME projections, the<br />
CO2 emissions linked to energy activity in<br />
the <strong>Mediterranean</strong> will increase by 32% by<br />
2020. With +68% in the <strong>Mediterranean</strong><br />
countries of the south and east and +19% in<br />
the northern countries, the two shores of<br />
the <strong>Mediterranean</strong> will have comparable<br />
emission levels by 2020, while in 2005, 67%<br />
of emissions were from the northern<br />
<strong>Mediterranean</strong> countries.<br />
Total Demand of commercial primary energy in the <strong>Mediterranean</strong> region – past and scenario (in Mtoe)<br />
1400<br />
1200<br />
1000<br />
800<br />
600<br />
400<br />
200<br />
0<br />
South & East<br />
North<br />
12 %<br />
28 %<br />
40 %<br />
1971 1980 1990 2000 2010 2020<br />
Source : OME, <strong>Plan</strong> Bleu<br />
The total primary commercial energy demand has increased from<br />
44% in the last 15 years and 83% of demand is provided by fossil<br />
energy.<br />
Improvement in more rational energy management, the increased use of renewable energy<br />
sources and adaptation, by reducing them, to climate change constitute a field of action of<br />
priority importance for the <strong>Mediterranean</strong> Strategy for Sustainable Development. Its strategic<br />
objectives and monitoring indicators rely on:<br />
Promoting of rational energy use (priority indicator n° 6);<br />
Valorising the potential of renewable energies (priority indicator n°7);<br />
Controlling, stabilising and reducing greenhouse gas emissions (priority indicators n°8 and<br />
n° 9);<br />
Promoting adaptation to climate change;<br />
Increasing access to electricity in rural areas.<br />
Energy
<strong>Mediterranean</strong> Strategy for Sustainable Development Follow-up<br />
Has progress been made in efficient energy use? 6. Energy intensity<br />
More efficient energy use (energy necessary<br />
to produce 1000 dollars of GDP) should help<br />
to decouple energy consumption and<br />
economic development. The objective<br />
proposed by MSSD for all of the<br />
<strong>Mediterranean</strong> countries by 2015 is a<br />
reduction in the intensity of energy by 1 to<br />
2% per annum per GDP unit.<br />
Progress is slow in the <strong>Mediterranean</strong>: the<br />
trends observed will not permit to reach<br />
the objective: 1 to 2% improvement per<br />
year.<br />
Yet, partial decoupling of energy<br />
consumption and economic development is<br />
undeniable in Europe and worldwide, with a<br />
growth rate of energy consumption less than<br />
half of GDP over 10 years. This is not the<br />
case in the <strong>Mediterranean</strong>. Indeed, a rise in<br />
energy consumption is just under that of<br />
GDP and almost identical to GDP in the<br />
southern and eastern <strong>Mediterranean</strong><br />
countries.<br />
Between 1992 and 2003 the reduction in the<br />
growth rate of energy intensity in the<br />
<strong>Mediterranean</strong> countries (0.3% per annum)<br />
was below the 1% objective. Only Tunisia,<br />
Albania, Malta and Bosnia-Herzegovina<br />
(since 1994) succeeded, while other countries<br />
like Greece and Syria were getting there.<br />
In 2003 the energy intensity of all of the<br />
<strong>Mediterranean</strong> countries together was at the<br />
average European level (153 koe/1000 dollars<br />
for the EU-15) and below the worldwide<br />
level (212). However, disparities between the<br />
countries remain great, even between some<br />
countries with equivalent income levels.<br />
Energy intensity in Syria and in Lebanon is<br />
still at 300 while it is at less than 125 in<br />
Morocco and Tunisia.<br />
Indicator ENE_P01 Updated on 02/05/2007<br />
Italy has the best performance record among<br />
the European <strong>Mediterranean</strong> countries, while<br />
France, despite some progress, is still above<br />
the European level.<br />
In the high consumption northern<br />
<strong>Mediterranean</strong> countries, gains in energy<br />
intensity, if sufficient, could also bring about a<br />
slowing-down of the rise in energy<br />
consumption per inhabitant (or even a drop).<br />
However, between 1992 and 2003,<br />
consumption per capita continued to grow.<br />
Consumption is still high in the European<br />
<strong>Mediterranean</strong> countries (3500 koe/inhab) and<br />
even 4500 koe/inhab in France, but the<br />
growth rate is less than 1% per annum.<br />
Energy consumption per capita in the<br />
southern <strong>Mediterranean</strong> countries is under<br />
1000 koe/inhab, the worldwide average being<br />
1700 koe/inhab, but growth rates are very<br />
different depending on the countries. The rate<br />
is almost nil in Syria, about 2% in Egypt and<br />
Morocco.<br />
Definition<br />
Total energy intensity per sector of activity is<br />
the ratio of final commercial energy<br />
consumption per GDP unit. It can be broken<br />
down into sectors: agriculture, industry,<br />
services, transport and households<br />
(residential).<br />
Precautions / Notes<br />
The very high values for energy intensity<br />
should be interpreted with caution for the<br />
countries undergoing an economic crisis (with<br />
low GDP values)<br />
koe : kilo of oil equivalent<br />
Sources / References<br />
World Bank, World Development Indicators<br />
2006<br />
400<br />
350<br />
300<br />
250<br />
200<br />
150<br />
10 0<br />
50<br />
0<br />
Energy intensity 1980 – 2003 (koe/1000 dollars PPP 2000)<br />
1980 19 9 0 2000 2003<br />
M A IT TN M T GR IL ES AL CY TR FR DZ HR BA SI EG SY LB<br />
Energy intensity and energy use per inhabitant en 2003<br />
World<br />
UE-15<br />
Energy<br />
Source : WDI<br />
Source : WDI
<strong>Mediterranean</strong> Strategy for Sustainable Development Follow-up<br />
Is there any progress in the share of renewable energy? 7. Share of renewable energies in energy balance<br />
The objective announced in the MSSD was<br />
to valorise the potential of renewable energy<br />
(RE) to reach 7%, excluding biomass, of the<br />
energy demand by 2015.<br />
The share of RE is not progressing in the<br />
primary commercial energy balances. A<br />
significant break from the present trends<br />
will be necessary to reach the 7%<br />
objective by 2015.<br />
Nevertheless, renewable energy production is<br />
progressing significantly in volume. RE<br />
represents about 3.2% of the total primary<br />
energy supply in the <strong>Mediterranean</strong> countries<br />
(the figure was the same in 2000).<br />
Worldwide, renewable energy, excluding<br />
biomass, represents a little more than 3 %<br />
(6% biomass included).<br />
With biomass, that is often not<br />
commercialised, the share of RE is almost<br />
7% of the total energy balance, illustrating the<br />
importance of this type of energy. RE in the<br />
<strong>Mediterranean</strong> includes hydraulic energy<br />
(70 %), geothermic energy (20 %) and the<br />
remaining 10% concerns solar, wind and<br />
other types of energy. In the southern and<br />
eastern <strong>Mediterranean</strong>, the respective<br />
percentages are 75%, 11 % and 14 %.<br />
RE is rising greatly in volume (+2.6% per<br />
annum between 1995 and 2004 on average in<br />
the <strong>Mediterranean</strong>), but just a little higher<br />
than the total primary energy supply (2.5 %).<br />
RE (apart from hydroelectricity and biomass)<br />
is progressing well (7.8 %) but only concern<br />
1% of the total primary energy supply.<br />
Indicator ENE_P02 Updated on 02/05/2007<br />
Hydraulic energy has a significant share<br />
(20%) in the total energy of Albania. This<br />
explains the high proportion of RE in the<br />
energy balance of this country.<br />
For some decades now, the share of coal has<br />
remained stable, nuclear energy has stabilised<br />
and gas energy has been progressing well to<br />
the detriment of petrol.<br />
Globally in the <strong>Mediterranean</strong>, fossil energy<br />
(petrol, coal and gas) dominated the energy<br />
supply in 2004 with 74.4 % of consumption<br />
in the northern countries and 94.5% in the<br />
southern and eastern countries. The<br />
remainder was mainly made up of hydraulic<br />
and nuclear electricity.<br />
Definition<br />
This indicator measures the contribution to a<br />
country’s total energy consumption by<br />
renewable energy resources (hydraulic,<br />
geothermic, solar and wind-powered).<br />
Precautions / Notes<br />
This indicator includes only the following<br />
renewable energy types: hydraulic, solar,<br />
geothermal and wind-powered. The<br />
renewable combustions (solid biomass and<br />
animal products, gas and liquid from the<br />
biomass, town and industrial waste) are not<br />
included. Yet these combustibles could<br />
constitute a considerable proportion of the<br />
energy supplies in the <strong>Mediterranean</strong><br />
countries.<br />
TPES : Total Primary Energy Supply<br />
Sources / References<br />
World Bank - World Development Indicators<br />
2006<br />
35%<br />
30%<br />
25%<br />
20%<br />
15%<br />
10 %<br />
5%<br />
0%<br />
Share of renewable energies (excepted biomass) in the TPES (1990 – 2004)<br />
19 9 5 2000 2004<br />
M A LB FR SY EG GR ES IL IT SI CS TR HR CY BA AL<br />
Share of hydraulic in 2004 and TPES growth (1990-2004)<br />
7%<br />
Energy<br />
Source : AIE<br />
Source : AIE
<strong>Mediterranean</strong> Strategy for Sustainable Development Follow-up<br />
Are the <strong>Mediterranean</strong> countries controlling their CO2 emissions<br />
and are they respecting their international commitments?<br />
One of the objectives of the Kyoto Protocol,<br />
amended in Bonn in July 2001 and in force<br />
since 2005, is to reduce worldwide greenhouse<br />
gas emissions by 5.2% by 2012 compared to<br />
1990 figures. The EU committed itself to<br />
reducing 8% of its CO2 emissions by sharing<br />
out the efforts among the member states.<br />
In the <strong>Mediterranean</strong>, 7 countries are officially<br />
committed to reducing or controlling their<br />
emissions: Croatia, Monaco and Slovenia (-<br />
8 %), Italy (-6.5%), France (stabilising), Spain<br />
(+15 %) and Greece (+25 %). The other<br />
countries have no obligation to reduce<br />
emissions.<br />
CO2 emissions from fossil fuel combustion<br />
are increasing in most <strong>Mediterranean</strong><br />
countries.<br />
The rise in CO2 emissions between 1990 and<br />
2003 was higher than the national objectives in<br />
all of the countries. It was about 3% for<br />
France and 46 % for Spain. According to the<br />
EEA, Spain and Italy are not likely to reach<br />
their 2012 objectives. In the other countries<br />
there is a rise ranging from 1 to 12% in Malta<br />
and Serbia-Montenegro and by more than<br />
100% in Israel, Lebanon and Algeria. The<br />
extreme values of -58 % in Albania and over<br />
300 % in Bosnia-Herzegovina should be<br />
considered with precaution.<br />
In 2003, a <strong>Mediterranean</strong> citizen emitted an<br />
average of 5 tonnes of CO2 per annum, i.e. a<br />
little more than the world average (4 tonnes),<br />
but almost two times less CO2 than a EU-15<br />
inhabitant (9 tonnes) and almost four times<br />
less than a USA inhabitant (about 21 tonnes of<br />
CO2 per annum).<br />
Indicator ENE_P03 Updated on 02/05/2007<br />
Depending on the country, the CO2 emissions<br />
per inhabitant are extremely variable: from less<br />
than 1 tonne per inhabitant in Albania to 10 in<br />
Cyprus and Israel in 2003. The differences in<br />
CO2 emissions per inhabitant are also striking<br />
in the southern and eastern <strong>Mediterranean</strong><br />
countries. They range from 1 to 3 tonnes and<br />
even from 5 to 9 tonnes for Algeria and Libya<br />
respectively.<br />
These values can be compared to the CO2<br />
emissions for commercial energy<br />
consumption. Gaps in the <strong>Mediterranean</strong><br />
countries range from 1 to 5: France: 1.4<br />
tCO2/tep; Greece: 3.2 tCO2/tep; Algeria: 5<br />
tCO2/tep.<br />
Definition<br />
This indicator corresponds to a grouping<br />
together of the annual national emissions of<br />
human origin from the main greenhouse gases:<br />
CO2, N2O, CH4, HFC, PFC and SF6.<br />
Precautions / Notes<br />
In this fact sheet, only CO2 emissions from<br />
solid combustibles, cement works and the<br />
burning of gas are taken into account. On<br />
average, they make up 80 % of the emissions<br />
of human origin from greenhouse gases.<br />
Sources / References<br />
CDIAC, EEA<br />
500<br />
450<br />
400<br />
350<br />
300<br />
250<br />
200<br />
150<br />
10 0<br />
50<br />
0<br />
CO2 emissions (from fossil fuels) in Mt of CO2<br />
1990 1995 2000 2003 Obj 2010<br />
8. Greenhouse gas emissions<br />
M T AL CY SI LB BA TN HR M A SY CS LY IL GR EG DZ TR ES FR IT<br />
C02 emissions per energy use (tCO2/toe) and per inhabitant (tCO2/inhab) - 2003<br />
Energy<br />
Source : CDIAC<br />
Source : CDIAC
42<br />
ENERGY AND SUSTAINABLE DEVELOPMENT IN THE MEDITERRANEAN<br />
8 . 8 At t a c h ment 8 – Press release
Press release<br />
Workshop on "Energy and Sustainable<br />
Development in the <strong>Mediterranean</strong>", 29 & 30<br />
March 2007, Monaco<br />
A working group meeting was held in Monaco, on March 29 and 30, 2007, on the topic of « Energy and<br />
Sustainable Development », attended by approximately 40 experts from 12 <strong>Mediterranean</strong> countries,<br />
representatives of national authorities and institutions, of European and international institutions, of NGOs<br />
from the private sector and members of associations.<br />
This international meeting was organized by <strong>Plan</strong> Bleu and its regional partners working in the energy sector<br />
(in particular the <strong>Mediterranean</strong> Observatory on Energy, ADEME and MEDREP), under the aegis of the<br />
<strong>Mediterranean</strong> Commission for Sustainable Development. Discussions focused on rational use of energy<br />
(RUE) and renewable energies (ER).<br />
If current trends are not abated, the demand in energy of <strong>Mediterranean</strong> countries is expected to increase<br />
from 945 MToe in 2005 to 1360 in 2020, and high-CO2 emission fossil energies are expected to cover 80%<br />
of requirements. And yet, the exceptional potential of the region in renewable energies (particularly wind and<br />
solar) is still largely untapped and energy wastes are assessed at between 20 and 50% in the different<br />
countries.<br />
The combined use of both options on a large-scale is an answer to the stakes and challenges of regional<br />
development, by reducing constraints applicable to energy supply, by providing access to energy and related<br />
services, and by limiting environmental impacts at the global (regarding climate change and biodiversity) and<br />
local (air pollution) levels.<br />
This stresses the importance of improved energy demand management (rational use of energy) and of<br />
diversified energy sources through renewable energies as recommended by the <strong>Mediterranean</strong> Strategy for<br />
Sustainable Development.<br />
In the course of the two-day meeting, the participants presented national case studies on best practices in<br />
renewable energy and energy efficiency, as well as regional experiences. Discussions highlighted the need for<br />
further exchange of success stories, for the assessment of progress achieved by <strong>Mediterranean</strong> countries in<br />
energy efficiency, for the analysis of the political instruments implemented, for the identification of the main<br />
difficulties encountered and for proposals on the large-scale development of renewable energies and rational<br />
use of energy.<br />
In their conclusions, meeting participants underscored the need to implement a specific institutional and<br />
regulatory framework, to raise public awareness regarding the relationship between energy and climate<br />
change as well as to the need for limited (in the South) or reduced (in the North) energy consumption. The<br />
group of experts also recommended more in-depth reflection on economic mechanisms (pricing, subsidies,<br />
taxation, feed-in tariffs …) for renewable energies and energy efficiency initiatives.<br />
The main conclusions of this meeting will be presented to <strong>Mediterranean</strong> governmental representatives<br />
<strong>Plan</strong> Bleu<br />
15, rue Beethoven – Sophia-Antipolis – F-06560 Valbonne<br />
Tél. +33 4 92 38 71 39 – Fax +33 4 92 38 71 31<br />
E-mail : planbleu@planbleu.org - Web : www.planbleu.org
during the forthcoming meeting of the <strong>Mediterranean</strong> Commission for Sustainable Development, scheduled<br />
for May 30 and 31, 2007 in Istanbul.<br />
About the <strong>Plan</strong> Bleu:<br />
Think-tank and <strong>Mediterranean</strong> Observatory of the environment and<br />
sustainable development, the <strong>Plan</strong> Bleu is a Regional Activity Centre of<br />
the United Nations Environment Programme/<strong>Mediterranean</strong> <strong>Action</strong><br />
<strong>Plan</strong> (UNEP/MAP), set up, funded and steered by the countries<br />
bordering the <strong>Mediterranean</strong> and the European Commission. Its<br />
mission, as defined by the intergovernmental conference held in Split in<br />
1977, is to develop regional cooperation to build and make available a<br />
fund of knowledge for facilitating the implementation of sustained<br />
development respectful of the environment. The <strong>Plan</strong> Bleu carries out<br />
prospective analyses of the environment and development, and acts as a<br />
<strong>Mediterranean</strong> observatory of sustainable development and main<br />
support centre for the <strong>Mediterranean</strong> Commission for Sustainable<br />
Development (MCSD).<br />
Contact press:<br />
<strong>Plan</strong> Bleu<br />
15 rue Beethoven – Sophia Antipolis<br />
06560 Valbonne - France<br />
Tel.: +33 4 92 38 71 39<br />
Fax: +33 4 92 38 71 31<br />
planbleu@planbleu.org<br />
Web site: www.planbleu.org<br />
* * *
RAPPORT DE SYNTHESE<br />
1. Introduction<br />
Rapport de synthèse<br />
Depuis le début des années 2000, les questions d’énergie et de changement climatique<br />
progressent vers le haut des agendas politiques et économiques. Les raisons sont multiples :<br />
le pétrole a vu son prix multiplié par 2,5 entre 2002 et les quatre premiers mois de 2006, la<br />
question de la sécurité énergétique et de l’approvisionnement en gaz naturel est en débat, le<br />
Protocole de Kyoto est entré en vigueur en 2005, le marché européen du carbone est ouvert<br />
depuis janvier 2006, le rapport Stern publié en 2006 alerte sur les coûts économiques du<br />
changement climatique, les fonds privés dédiés aux énergies renouvelables se multiplient,<br />
les prix des équipements augmentent face à la demande, les derniers rapports du GIEC<br />
confirment l’aggravation de la situation …<br />
Du fait de la diversité des situations des pays méditerranéens (pays producteurs,<br />
importateurs, développés et en développement), la région concentre à elle seule l’ensemble<br />
des problématiques énergétiques mondiales : croissance de la dépendance énergétique,<br />
contraintes dues à l’envolée du prix de l’énergie et croissance, particulièrement forte sur la<br />
rive Sud et Est, de la demande d’énergie. En outre, l’ensemble des pays méditerranéens fait<br />
face aux défis du changement climatique du fait de la vulnérabilité de la région à ses effets et<br />
de sa part croissante dans les émissions mondiales de gaz à effet de serre.<br />
Dans ce contexte : comment évoluent et évolueront les grandes tendances énergétiques<br />
régionales, où en est la région au regard des objectifs de la SMDD, quelle est la situation au<br />
niveau européen ? Quelles sont les questions économiques et financières régionales liées<br />
au développement des énergies renouvelables et des actions d’utilisation rationnelle de<br />
l’énergie, et les effets d’entraînement qui peuvent être liés ? Quel est le degré de<br />
développement des politiques d’ER et d’URE dans les pays, quels sont les obstacles<br />
observés et les solutions à mettre en œuvre pour le futur ? Quels sont les points de vue de la<br />
société civile, des institutions internationales, et comment les bailleurs de fonds prennent-ils<br />
en compte les ER et l’URE dans leurs actions ?<br />
Autant de questions qui ont été analysées lors des 4 séances de l’atelier régional d’experts<br />
organisé à Monaco les 29 et 30 mars 2007 qui a permis la restitution des travaux engagés<br />
depuis janvier 2006.<br />
L’objectif de ce document est de faire la synthèse des activités du <strong>Plan</strong> Bleu en 2006-2007<br />
sur le thème de l’énergie et de présenter les principaux éléments de conclusions de l’atelier<br />
de Monaco.<br />
19 tCO2 ont été émises pour l’organisation de l’atelier régional « Energie et changement<br />
climatique » que le <strong>Plan</strong> Bleu compensera pour que la manifestation soit neutre en carbone.<br />
2. Mandat<br />
2.1 Contexte<br />
L’énergie est une problématique prioritaire de développement durable en Méditerranée que<br />
le <strong>Plan</strong> Bleu, en sa qualité de Centre de Prospective et d’Observatoire Méditerranéen de<br />
l’Environnement et du Développement au sein du PNUE/<strong>Plan</strong> d’<strong>Action</strong> pour la Méditerranée<br />
(PAM), a pris en compte depuis sa création.<br />
Le troisième chapitre du rapport « <strong>Plan</strong> Bleu – Avenirs du Bassin méditerranéen » publié en<br />
1989 est consacré au thème de l’énergie.<br />
Une étude plus spécifique sur ce thème, intitulée « Energie et Environnement en<br />
Méditerranée – Enjeux et prospective » a été publiée en 1993 dans la série « Les fascicules<br />
du <strong>Plan</strong> Bleu », aux éditions Economica. Celle-ci a permis de dégager clairement les<br />
tendances observées et les options alternatives qui s’offrent dans ce secteur clef, dont<br />
43
44<br />
ENERGY AND SUSTAINABLE DEVELOPMENT IN THE MEDITERRANEAN<br />
l’évolution est aujourd’hui marquée par les risques réels ou probables qu’il fait peser sur<br />
l’environnement, tant au niveau local qu’au niveau régional ou global.<br />
Le rapport « Méditerranée – Les perspectives du <strong>Plan</strong> Bleu sur l’environnement et le<br />
développement », publié en 2005, a permis d’établir une nouvelle prospective régionale pour<br />
l’énergie à l’horizon 2025. Il alerte sur les risques du scénario tendanciel et met en débat les<br />
objectifs, les bénéfices et les conditions possibles d’un scénario alternatif.<br />
2.2 Partena ires<br />
Suite à l’adoption de la Stratégie Méditerranéenne pour le Développement Durable (SMDD,<br />
2005), et à la demande des pays riverains et de l’Union européenne, le <strong>Plan</strong> Bleu a été<br />
chargé d’engager en 2006-2007 un travail de suivi-évaluation des progrès de la SMDD et<br />
d’approfondir dès 2006 le domaine prioritaire « Energie et changement climatique » et<br />
d’organiser un atelier d’experts sur le thème de l’efficacité énergétique et des énergies<br />
renouvelables.<br />
Une des premières tâches du <strong>Plan</strong> Bleu a été de s’entourer des partenaires compétents<br />
dans le domaine « énergie - changement climatique » pour former un comité de pilotage.<br />
Le projet, coordonné et animé par le <strong>Plan</strong> Bleu, a ainsi été conduit en partenariat avec les<br />
réseaux et institutions méditerranéens spécialisés sur l’énergie : l’Observatoire<br />
Méditerranéen de l’Energie (OME), MEDENER, l’ADEME, le programme MEDREP (The<br />
<strong>Mediterranean</strong> Renewable Energy Programme). L’institut de la Méditerranée/FEMISE et le<br />
CAR/PP de Barcelone ont aussi contribué à l’activité. L’ONG HELIO International a<br />
également participé aux travaux et des synergies ont été trouvées avec l’UMET<br />
(<strong>Mediterranean</strong> Summer University). Ces partenaires ont formé ensemble un comité<br />
technique de pilotage pour les activités.<br />
L’ADEME et le Ministère italien pour l’environnement, les territoires et la mer ont participé<br />
financièrement aux activités. La Principauté de Monaco a accueilli et financé en partie<br />
l’atelier.<br />
2.3 Objecti fs de s acti vi t és « Ene rgie » du <strong>Plan</strong> Bleu<br />
Les objectifs et les activités qui ont été proposés résultent directement du mandat du <strong>Plan</strong><br />
Bleu tel que défini par les Parties contractantes à la Convention de Barcelone lors de leur<br />
réunion de novembre 2005 à Portoroz. Ils sont les suivants :<br />
Produire une information facilitant le suivi et la mise en œuvre de la SMDD et des SNDD<br />
dans le domaine « énergie – changement climatique »<br />
Accélérer la mise en œuvre de politiques volontaristes d’utilisation rationnelle de l’énergie<br />
(URE) et le développement des énergies renouvelables (ENR) en montrant les avantages<br />
liés à leur développement (économiques, sociaux, environnementaux)<br />
Identifier les points de blocage, ou au contraire les leviers existants (ou potentiels) dans<br />
les politiques des pays, aux niveaux national, local et de la coopération internationale,<br />
pour progresser vers les objectifs de la SMDD<br />
Suivre les évolutions de la région et des pays par rapport aux objectifs et orientations de<br />
la SMDD<br />
Obtenir des informations à trois niveaux : régional, national et local<br />
2.4 Les acti vi t és<br />
Toutes les activités (cf. encadré 1 et annexe 1) conduites depuis janvier 2006 ont permis<br />
d’aboutir à un échange lors d’un atelier régional organisé à Monaco les 29 et 30 mars 2007.<br />
L’atelier avait pour objectif :<br />
d’examiner, conformément aux objectifs du chapitre « énergie » de la Stratégie<br />
Méditerranéenne de Développement Durable, la situation de la région en matière de<br />
promotion de l’utilisation rationnelle de l’énergie (URE) et des énergies renouvelables<br />
(ENR) ;
Rapport de synthèse<br />
d’examiner les enjeux économiques et environnementaux qui y sont liés, de commenter<br />
les expériences engagées dans quelques pays méditerranéens ;<br />
d’adresser des recommandations à la Commission Méditerranéenne de Développement<br />
Durable et aux décideurs.<br />
Au total, près de 50 experts ont participé aux activités et l’atelier a réuni environ 40 d’entre<br />
eux (liste des participants en annexe 2), représentants des autorités nationales, du monde<br />
académique, des secteurs privé et associatif, des ONG, de bailleurs de fonds et des<br />
institutions internationales. 12 pays méditerranéens étaient représentés : Maroc, Tunisie,<br />
Libye, Égypte, Israël, Chypre, Malte, Bosnie-H., Italie, Monaco, France, Espagne.<br />
Les travaux de l’atelier se sont appuyés sur la présentation des rapports nationaux réalisés<br />
dans les pays volontaires, des études régionales, des résultats de l’atelier sous-régional sur<br />
le MDP et sur les communications d’experts régionaux (cf encadré 1).<br />
Le programme de l’atelier figure en annexe 3.<br />
Afin de diffuser les informations et documents produits au cours des activités, une série de<br />
pages Internet a été créée sur le site web du <strong>Plan</strong> Bleu et est consultable à partir de<br />
l’adresse : http://www.planbleu.org/themes/energie_progr_travail2006_07.html<br />
Encadré 1 Atelier sous régional, études nationales, études régionales et communications présentées<br />
lors de l’atelier<br />
1 Atelier sous-régional : « Le MDP dans les pays Sud méditerranéens, forces et faiblesses,<br />
défis et perspectives - liens avec les projets d’EE & d’ER » organisé par le <strong>Plan</strong> Bleu et<br />
l’UMET en mai 2006 à Paris. L’objectif de cet atelier était de faire le point sur la situation du<br />
MDP dans la région, de mutualiser les expériences dans le domaine de la réalisation de<br />
projets MDP, d’appréhender avec les acteurs concernés les questions de mise en oeuvre<br />
opérationnelle de projets dans le cadre du MDP et de tirer des enseignements afin que la<br />
région puisse bénéficier au mieux du MDP. Cet atelier a réuni environ 25 experts des pays<br />
Méditerranéens du Nord et du Sud. Il a donné lieu à la rédaction d’un document de synthèse<br />
disponible en annexe 5.<br />
12 Rapports nationaux sur le thème «efficacité énergétique et énergies renouvelables»<br />
ont été préparés : Maroc, Tunisie, Libye, Égypte, Israël, Syrie, Turquie, Bosnie-Herzégovine,<br />
Espagne, Italie, Chypre et Malte.<br />
3 études régionales ont été réalisées à l’échelle de la Méditerranée, portant sur les thèmes<br />
des grandes tendances énergétiques récentes et à venir, du coût de la non action en faveur<br />
des ER et de l’URE et de la place et du rôle de l’Aide publique au développement en matière<br />
d’ER et d’URE en Méditerranée.<br />
6 communications spécifiques ont été présentées lors de l’atelier de Monaco, afin de<br />
compléter les points de vue et les partages d’expériences, par des représentants<br />
d’organisations internationales (UNEP/DTIE, Agence Internationale de l’énergie, Agence<br />
européenne de l’Environnement), d’un bailleur de fonds bilatéral (Agence française de<br />
Développement), du secteur financier (Caisse des Dépôts et consignations) et de la société<br />
civile (ONG HELIO International).<br />
3. Cadrage régional : situation énergétique<br />
Les tendances énergétiques observées dans la région et dans l’UE, les défis énergétiques<br />
auxquels la région fait face et la situation de la région par rapport aux objectifs de la SMDD<br />
ont fait l’objet de présentations détaillées lors de l’atelier de Monaco. L’Observatoire<br />
Méditerranéen de l’Energie a présenté les derniers chiffres disponibles sur les tendances<br />
observées et les prévisions à 2020 (scénario tendanciel) ainsi que les évolutions en matière<br />
d’infrastructures nécessaires. Les principaux éléments des présentations sont repris ciaprès.<br />
45
46<br />
ENERGY AND SUSTAINABLE DEVELOPMENT IN THE MEDITERRANEAN<br />
3.1 Enje ux et dé fis : l’éne rgie au cœur de s pré occupa ti ons du<br />
d é veloppe ment dura ble<br />
L’énergie provient de ressources naturelles (minérales, végétales, vent, soleil…) et constitue<br />
l’un des supports essentiels de toute activité humaine et de tout développement<br />
économique ; son utilisation génère des effets plus ou moins immédiats sur les milieux, les<br />
climats et la santé (effet de serre, pollution atmosphérique, maladies respiratoires, marées<br />
noires, déchets dangereux, occupation des sols…). Les systèmes énergétiques classiques<br />
(production/extraction, transport, stockage, distribution et consommation) exigent souvent<br />
des investissements lourds qui engagent sur le long terme, ce qui leur confère une grande<br />
inertie ; une part croissante de l’énergie consommée provient d’échanges commerciaux, ce<br />
qui pose la question de la sécurité énergétique des pays et de leur vulnérabilité face aux<br />
évolutions des prix.<br />
Les choix énergétiques requièrent donc tout particulièrement des réflexions sur leurs effets à<br />
long terme et doivent par conséquent prendre en compte la question du partage des<br />
responsabilités et des coûts entre les générations et les citoyens.<br />
La situation énergétique méditerranéenne illustre parfaitement ces interdépendances et cette<br />
problématique.<br />
En effet, le système énergétique en Méditerranée se caractérise par : (i) sa vulnérabilité,<br />
notamment aux prix et à l’approvisionnement ; (ii) l’inégalité des dotations naturelles, des<br />
accès et des consommations d’énergie entre pays et (iii) les dommages, parfois<br />
irréversibles, qu’il cause à l'environnement et sur la santé humaine. Ce modèle de<br />
développement énergétique montre d’ores et déjà ses limites et son incompatibilité avec des<br />
objectifs de développement durable.<br />
Or, si les tendances observées depuis 30 ans perdurent, la demande totale en énergie<br />
primaire commerciale dans l’ensemble du bassin méditerranéen pourrait passer de 945 Mtep<br />
à 1357 Mtep entre 2005 et 2020 (cf graphique), soit une augmentation de 44% en 15 ans, et<br />
être satisfaite à 83% par les énergies fossiles (voir encadré 2).<br />
Ainsi, l’enjeu est à la fois de répondre aux besoins énergétiques en forte croissance en<br />
Méditerranée, en lien avec la croissance économique et démographique, de ne pas aggraver<br />
les impacts sur l’environnement local et global (gaz à effet de serre) tout en gagnant en<br />
compétitivité grâce à la maîtrise des consommations, aux économies d’énergies et aux<br />
énergies renouvelables, dans un marché méditerranéen de plus en plus libre, ouvert et<br />
concurrentiel et dans un contexte énergétique international de plus en plus volatil et<br />
incertain.<br />
Source : OME<br />
(Mtoe)<br />
Trends Tendances in primary de energy la demande demand. en énergie Source: primaire OME.<br />
1400<br />
1200<br />
1000<br />
800<br />
600<br />
400<br />
200<br />
0<br />
SEMCs<br />
NMCs<br />
1971-2000<br />
Avg. growth per year<br />
Total MED. 2.6%<br />
NMCs 2%; SEMCs 5.5%<br />
12%<br />
88%<br />
17%<br />
83%<br />
2000-2005<br />
Avg. growth per year:<br />
Total MED. 2.3%<br />
NMCs 1.9%; SEMCs 3.1%<br />
23%<br />
77%<br />
27%<br />
73%<br />
2005-2020<br />
Average growth per year:<br />
Total MED. 2.4%<br />
NMCs 1.3%; SEMCs 4.8%<br />
1971 1980 1990 2000 2005 2010 2020<br />
Le scénario énergétique alternatif du <strong>Plan</strong> Bleu (rapport « Environnement et développement<br />
en Méditerranée », 2005) répond à ces enjeux en montrant la pertinence environnementale,<br />
sociale et économique du développement à grande échelle des énergies renouvelables dans<br />
28%<br />
72%<br />
32%<br />
68%<br />
40%<br />
60%
Rapport de synthèse<br />
la région (qui détient un des potentiels les plus importants du monde) associé à l’exploitation<br />
massive des gisements d’économie d’énergie (les gaspillages représenteraient selon les<br />
pays de 20 à 50% de la consommation). Même si les pays méditerranéens sont dans des<br />
situations et ont des priorités très différentes, ils ont tous des marges de manœuvre pour<br />
améliorer l’efficience de leurs usages énergétiques, renforcer la sécurité de leurs<br />
approvisionnements et contribuer à un développement énergétique plus durable de la région.<br />
Ces marges de manœuvre peuvent être décuplées dans le cadre d’une coopération<br />
régionale.<br />
Elles répondent directement aux défis auxquels le développement énergétique de la région<br />
fait face et, plus largement celui de la région euro-méditerranéenne et de ses proches<br />
voisins, à savoir :<br />
renforcer la sécurité de l’approvisionnement,<br />
réduire les pollutions locales, régionales et globales liées aux activités énergétiques,<br />
permettre l’accès à l’énergie et aux services énergétiques,<br />
améliorer l’efficacité énergétique.<br />
Les décisions qui seront prises dans les années à venir sont directement reliées aux enjeux<br />
socio-économiques et environnementaux qui détermineront le futur de la Méditerranée : le<br />
changement climatique (voir encadré 3) et les impacts du système énergétique sur la<br />
biodiversité et la santé, la stabilité macroéconomique, la compétitivité des économies et le<br />
bien-être social des individus. A cela, s’ajoutent les enjeux géopolitiques et de sécurité qui<br />
sont propres à la région.<br />
Encadré 2 Quelques évolutions énergétiques tendancielles en Méditerranée<br />
En 2005, les pays méditerranéens représentent environ 8% de la consommation mondiale<br />
d’énergie. La demande est satisfaite en grande majorité par les énergies fossiles et, si les<br />
tendances perdurent, plus de 80% de la consommation pourrait être assurée par les énergies<br />
fossiles (pétrole, gaz, charbon) en 2020.<br />
Un des facteurs déterminant la croissance de la demande d’énergie (au Nord comme au Sud) est<br />
la consommation d’électricité. L’OME prévoit qu’en 2020 elle sera supérieure de 1000 TWh par<br />
rapport au niveau de 2005. Dans les pays du Sud et de l’Est, elle est responsable de 40% de la<br />
hausse de la consommation d’énergie.<br />
Pour produire de l’électricité, tous les pays utilisent actuellement le gaz naturel, à l’exception de<br />
Chypre et de Malte. Si les tendances perdurent, il sera de plus en plus utilisé pour produire<br />
l’électricité nécessaire, accélérant sa pénétration dans le mix énergétique au détriment du<br />
pétrole. Si 26% de l’électricité est produite à partir de gaz en 2005, l’OME prévoit qu’en 2020<br />
cette part sera de 41 %. L’utilisation du gaz a l’avantage d’être moins émettrice de CO2 que celle<br />
du pétrole mais cette solution reste chère au regard des coûts de transports. Cependant, afin de<br />
répondre aux besoins, on assiste à une augmentation des infrastructures de gaz notamment en<br />
Égypte, Libye et Algérie.<br />
D’autres infrastructures se mettent en place comme les interconnexions électriques qui sont<br />
jugées nécessaires pour optimiser le parc d’électricité du Sud et de l’Est de la Méditerranée. Il<br />
existe aujourd’hui 3 blocs séparés (ouest, sud-est et turc) qui devraient être reliés entre eux par<br />
des réseaux électriques en 2007 et 2008.<br />
Le pétrole, pour sa part, est utilisé comme énergie de bouclage ; il fait l’objet d’une utilisation de<br />
base. Sa consommation devrait augmenter mais sa part dans le bilan énergétique diminuer.<br />
Dans le futur, sa consommation pourrait être associée aux biocarburants. Enfin, l’utilisation du<br />
charbon devrait baisser au Nord.<br />
Encadré 3 Le changement climatique : un fait avéré, une facture importante…<br />
… dans le monde …<br />
Au cours des dernières années, le changement climatique est devenu un fait avéré et n’est plus<br />
guère controversé. L’année 2006 est actuellement considérée comme la sixième année la plus<br />
chaude jamais enregistrée. La température moyenne à la surface de la terre est supérieure de<br />
47
48<br />
ENERGY AND SUSTAINABLE DEVELOPMENT IN THE MEDITERRANEAN<br />
0,42° C à la température moyenne enregistrée au cours de la période 1961-1990 (qui est de<br />
14°C). Il est prouvé que cette évolution résulte surtout de l’accumulation de gaz à effet de serre<br />
(GES) liés aux activités humaines. Le climat de la terre change rapidement et certains impacts 5<br />
du changement climatique en renforcent l’ampleur. Les événements météorologiques extrêmes<br />
(Katrina aux Etats-Unis, cyclones dévastateurs dans d’autres régions, évolutions aux pôles)<br />
alertent l’opinion publique. Des pertes biologiques, économiques et humaines colossales<br />
pourraient résulter du changement climatique.<br />
L’Agence internationale de l’énergie prévoit que si les tendances observées se poursuivent, les<br />
émissions de CO2 augmenteront de 55% entre 2004 et 2030 (Source : AIE, World Energy<br />
Outlook 2006).<br />
Le rapport rédigé par Nicholas Stern sur les conséquences économiques du changement<br />
climatique a établi qu'une intervention immédiate et coordonnée de l'ensemble des acteurs<br />
internationaux engendrerait des bénéfices bien supérieurs aux économies réalisées par un refus<br />
d'agir. En effet, le changement climatique impactera non seulement l'environnement, mais<br />
également la santé humaine, l'accès à l'eau potable et le secteur agricole. Les modèles<br />
économiques utilisés par Nicholas Stern permettent de prévoir une chute annuelle de 5% du PIB<br />
mondial en cas d'inaction. A l'opposé, une intervention prompte provoquerait une baisse annuelle<br />
de seulement 1% de cet indicateur.<br />
Les principales conclusions fournies par le dernier rapport du GIEC (janvier 2007) montrent une<br />
aggravation du diagnostic par rapport au rapport de 2001. Selon ce rapport, l’augmentation de<br />
l’effet de serre depuis le début de l’ère industrielle en 1750, est désormais un fait établi<br />
« sans équivoque » possible. Le réchauffement serait compris entre 1,1 degré et 6,4 degrés sur<br />
la période considérée (fin du XXème (1980-1999) et la fin du XXIème siècle (2090-2099). Le<br />
rapport relève l’accélération récente du phénomène. Il prévoit une aggravation dramatique de la<br />
situation si rien n’est entrepris pour combattre l’effet de serre.<br />
… et en Méditerranée<br />
La Méditerranée sera une région du globe particulièrement affectée. Un réchauffement<br />
hypothétique moyen de 1°C au niveau mondial pourrait impliquer en Méditerranée (i) un<br />
réchauffement compris entre +0,7°C et +1,6°C, selon les lieux, (ii) un changement dans le<br />
régime des pluies impliquant une accentuation des sécheresses au Sud et des inondations et<br />
glissements de terrain au Nord et (iii) une augmentation de la fréquence des phénomènes<br />
météorologiques extrêmes (sécheresses estivales, vagues de chaleur, inondations, coulées de<br />
boues…). Des impacts spécifiques en Méditerranée sur le cycle de l’eau, les écosystèmes<br />
marins et terrestres, la biodiversité, l’agriculture et les zones côtières sont attendus 6 . Des pertes<br />
biologiques, économiques et humaines très importantes sont probables. C’est la conclusion<br />
d’une étude du <strong>Plan</strong> Bleu de janvier 2002.<br />
Des impacts financiers du changement climatique sont déjà quantifiables : le coût de la canicule<br />
de l’été 2003 en Europe a été supérieur à 10 milliards d’euros (à titre de comparaison, le PIB de<br />
Malte a été de 6 milliards environ en 2003). En France, le coût économique des sécheresses<br />
entre 1989 et 2004 a été de 4 milliards d’euros (en particulier du fait des dégâts sur les bâtiments<br />
construits sans fondation adéquate sur terrain argileux), dont 1,5 milliard pour la canicule de<br />
2003 7 .<br />
La consommation énergétique est un des principaux facteurs (avec l’intensification des<br />
transports) explicatifs du réchauffement climatique. L’énergie est responsable de 80% de toutes<br />
les émissions de gaz à effet de serre dans l’UE 8 ; cette part est comparable dans de nombreux<br />
pays méditerranéens de la rive Sud Est.<br />
5<br />
Evaporation plus forte renforçant l’effet de serre, surfaces blanches moins nombreuses du fait de la fonte des glaces, moindre<br />
absorption de CO2 par les océans du fait d’une température plus élevée, …<br />
6<br />
“Status of knowledge on Global Climatic Change: regional aspects and impacts in the <strong>Mediterranean</strong> basin” Etude <strong>Plan</strong> Bleu;<br />
Medias, 2001 www.planbleu.org.<br />
7<br />
Office Parlementaire d’évaluation des choix scientifiques et technologiques, rapport sur « les apports de la science et de la<br />
technologie au développement durable », Tome 1 « Changement climatique et transition énergétique : dépasser la crise », juin<br />
2006.<br />
8<br />
Source : Agence européenne de l’environnement, 2006.
Rapport de synthèse<br />
3.2 Réponses régionales : les obje ctifs énergé ti ques de la<br />
S M DD et de l’UE<br />
La Méditerranée ne maîtrise pas l’augmentation de sa consommation d’énergie qui est<br />
essentiellement d’origine fossile, ce qui renforce continuellement l’intensité carbone des<br />
économies et accroît la responsabilité de la région dans les émissions mondiales de CO2 ;<br />
c’est une région qui d’une part est particulièrement vulnérable aux effets du changement<br />
climatique, et d’autre part dispose d’un potentiel énorme en énergie renouvelable et qu’elle<br />
pourrait réduire sensiblement sa consommation par l’utilisation rationnelle de l’énergie ;<br />
toutes les technologies sont disponibles sur la rive Nord et d’immenses possibilités<br />
d’anticipations existent encore sur les rives Sud et Est.<br />
En réponse à ce paradoxe, les Parties Contractantes à la Convention de Barcelone ont<br />
adopté, en novembre 2005, la Stratégie Méditerranéenne pour le Développement<br />
Durable (SMDD), dont le second domaine d’action prioritaire s’intitule « Assurer une gestion<br />
durable de l’énergie, atténuer les effets du changement climatique et s'y adapter » et<br />
propose 5 objectifs principaux :<br />
Promouvoir l’utilisation rationnelle de l’énergie<br />
Valoriser le potentiel d’énergies renouvelables<br />
Contrôler, stabiliser ou réduire les émissions de GES<br />
Inscrire les mesures d’adaptation au changement climatique parmi les objectifs majeurs<br />
des plans nationaux de développement<br />
Accroître l’accès à l’électricité dans les zones rurales<br />
La SMDD propose deux objectifs chiffrés souhaitables d’ici 2015 :<br />
Réduire l’intensité énergétique de 1 à 2% par an<br />
Atteindre une part de 7% d’ER (hors CWR) dans la demande en énergie<br />
Le texte du chapitre « Energie et changement climatique » de la SMDD figure en annexe 4.<br />
La situation de la région au regard des objectifs de la SMDD est exposée dans l’encadré 6<br />
page 15 et en annexe 7 au travers de l’analyse des indicateurs de suivi.<br />
Encadré 4 Situation et objectifs de l’Union européenne<br />
Au cours de la dernière décennie, dans l’UE, l’intensité énergétique totale a globalement baissé,<br />
cependant la consommation totale d’énergie a augmenté sensiblement. Pour répondre à la<br />
demande, les énergies fossiles restent la première source d’approvisionnement. Il existe<br />
désormais des objectifs ciblés pour les ERs, mais, leur part dans le bilan énergétique reste<br />
cependant faible, environ 6% et elles augmentent de manière limitée (+3,6% entre 1999 et<br />
2003). Même si on observe une croissance forte de l’éolien ces dernières années, la source<br />
d’énergie renouvelable la plus importante en Europe est la biomasse (66,5%) suivi de<br />
l’hydraulique (24.1%). Les biocarburants ne contribuent que de 2% à la baisse de l’intensité<br />
énergétique notamment en raison de leur faible utilisation.<br />
L’augmentation de la part du gaz naturel au détriment du pétrole dans le mix énergétique a<br />
permis une baisse des émissions de CO2, néanmoins l’augmentation de la demande est telle<br />
que celle-ci est plus que compensée. Les scénarios de la Commission Européenne estiment<br />
entre 35% et 45% la réduction des émissions de CO2 possibles par des mesures d’économies<br />
d’énergie. Certaines mesures sont simples comme le changement des ampoules traditionnelles<br />
par celles à basse consommation.<br />
En raison du changement climatique, on assiste à une remise à plat de la question énergétique.<br />
Le conseil des ministres européens de l’énergie a fait émerger plusieurs thématiques et<br />
décisions sur la politique de coordination de l’approvisionnement, les gaz à effet de serre,<br />
l’efficacité énergétique, la nécessité d’une politique de coopération crédible et un plan d’action<br />
pour l’UE pour la période 2007-2009. Ce plan fixe des objectifs en créant ou modifiant des<br />
directives européennes. Les pays méditerranéens membres de l’UE sont liés par les récentes<br />
décisions du Conseil européen de réaliser 20% d’économie d’énergie et 20% de part des ER<br />
dans la consommation d’énergie européenne à l’horizon 2020. Les pays méditerranéens de<br />
49
50<br />
ENERGY AND SUSTAINABLE DEVELOPMENT IN THE MEDITERRANEAN<br />
l’Union européenne sont pour la plupart engagés vis-à-vis du Protocole de Kyoto à réduire ou<br />
maîtriser leurs émissions de gaz à effet de serre.<br />
Les discussions ont montré que l’intérêt d’aborder les thèmes de l’utilisation rationnelle de la<br />
promotion des énergies renouvelables n’est quasiment pas contesté au plan régional. Des<br />
objectifs régionaux en la matière existent mais leur déclinaison au niveau national et la<br />
détermination d’objectifs sectorialisés et cadencés dans le temps est un chantier encore<br />
largement ouvert.<br />
Il a été mentionné que les dépenses de recherche et développement dans les ER et l’URE<br />
sont sous-dimensionnées. Les budgets de R&D dans l’UE dans le domaine de l’énergie en<br />
général ont augmenté de 34% entre 1990 et 2003 selon l’AEE, l’essentiel étant destiné à la<br />
fission nucléaire. Le budget des Etats membres de l’UE en faveur des ER a augmenté<br />
beaucoup moins rapidement (+10% sur la même période). Il ressort des discussions que la<br />
faiblesse de la R&D dans les ER en Méditerranée illustre un manque de cohérence entre<br />
politique fiscale, coût d’approvisionnement et recherche et que les transferts de technologies<br />
devraient être plus développés. La coopération internationale est un des volets importants de<br />
l’UE. Cependant, si l’initiative sur l’eau donne des résultats intéressants, ce n’est pas le cas<br />
dans le secteur de l’énergie.<br />
Pour que les industriels s’engagent dans la production d’équipement d’ER, des changements<br />
clairs dans les politiques sont nécessaires. Une visibilité à long terme permettrait aussi<br />
d’éviter les retards de l’activité industrielle par rapport à la demande d’équipement et<br />
l’engagement du secteur financier sera déterminant.<br />
Enfin le bâtiment et les transports ont été identifiés unanimement comme les deux secteurs<br />
dans lesquels les enjeux énergétiques seront les plus importants au cours de ce siècle. Le<br />
bâtiment est par exemple particulièrement stratégique car les erreurs commises aujourd’hui<br />
dans la construction ont des effets de long terme sur les consommations. Il existe ainsi une<br />
nécessité de cibler les actions par secteur. Au final, l’ensemble des participants s’accorde à<br />
dire que la bataille de la communication constitue aussi un enjeu majeur.
Rapport de synthèse<br />
4. Cadrage régional : questions économiques<br />
Les questions économiques et financières régionales liées au développement des énergies<br />
renouvelables et des actions d’utilisation rationnelle de l’énergie, et les effets d’entraînement<br />
qui peuvent être liés ont été abordés lors de la deuxième session de l’atelier de Monaco.<br />
Cette séance entendait également aborder la question financière, souvent avancée comme<br />
explication à la faiblesse du développement des ER et de l’URE.<br />
Les résultats préliminaires de deux études régionales ont été présentés. L’une sur<br />
l’estimation du coût de la non action au regard des ER et de l’URE (application au cas du<br />
Maroc) ; l’autre sur la prise en compte des ER et de l’URE dans l’aide internationale en<br />
Méditerranée. La question du financement des ER et de l’URE a également été abordée à<br />
travers un bilan de l’activité « finance carbone » et de l’utilisation du Mécanisme de<br />
Développement Propre en Méditerranée pour inciter les investissements directs étrangers<br />
privés dans des technologies à faible émission de GES. Enfin les effets d’entraînement sur<br />
l’économie tunisienne du développement des chauffes eau solaires ont été présentés<br />
(exemple cité dans le & 6.1).<br />
4.1 Le coût économique de la non action au re gard des ER et<br />
d e l’URE<br />
Cette étude vise à montrer l’intérêt économique de court terme (5 à 10 ans) des pays à<br />
s’engager dans des stratégies nationales de maîtrise de l’énergie permettant d’atteindre les<br />
objectifs régionaux de la SMDD. Les effets macroéconomiques de diverses stratégies<br />
énergétiques sont analysés en les mettant en relation avec les contraintes économiques<br />
principales des PSEM qui sont celles de l’emploi (et donc de la croissance), de la<br />
« soutenabilité » budgétaire et de la balance des paiements. A cette fin, un outil de<br />
simulation a été élaboré dans le cadre de l’étude et appliqué au cas du Maroc. Il a permis<br />
d’effectuer des simulations et de fournir au final une estimation du montant de la facture<br />
énergétique en fonction de différentes stratégies énergétiques (incluant le développement<br />
d’ER et d’URE).<br />
Dans chacune des simulations, l’objectif a été de comparer le total de la facture si des<br />
stratégies ambitieuses d’ER et d’URE sont mises en place avec le total de la facture si les<br />
tendances observées perdurent. Cet outil permet ainsi de répondre à une question du type<br />
« quel est le gain à attendre (en millions d’USD) d’actions améliorant l’efficacité énergétique<br />
de 1% par an pendant 10 ans ? ». Ce gain, peut aussi être qualifié de « coût de la non<br />
action », c’est-à-dire le coût de la non intégration d’actions d’efficacité énergétique. L’intérêt<br />
de ce type d’exercice réside aussi dans le fait que ce gain peut être comparé aux coûts des<br />
mesures à prendre pour y arriver.<br />
Plusieurs simulations ont été effectuées pour le Maroc pour la période 2005-2015 et<br />
présentées lors de l’atelier de Monaco.<br />
Les résultats provisoires montrent que le potentiel de gain économique le plus important se<br />
situe dans l’amélioration de l’efficacité énergétique dans le résidentiel et le transport. Une<br />
amélioration identique de l’efficacité énergétique dans l’industrie donne aussi des résultats<br />
intéressants : ils se chiffreraient à 511 millions de USD pour les 3 dernières années de la<br />
période considérée 2013/2015. On peut comparer ce montant au budget de la caisse de<br />
compensation du Maroc (compensation du différentiel du prix international de l’énergie<br />
(produits pétroliers) par rapport au prix domestique) pour 2007 qui est d’environ 700 millions<br />
d’USD selon la loi de finance. Or, le budget de cette caisse de compensation pèse<br />
lourdement sur les finances publiques, comme de nombreuses coupures de presse<br />
marocaine l’expliquent régulièrement. Des scénarios ramenant le taux de perte (production<br />
et distribution) de 16 à 10% et intégrant une plus forte pénétration des énergies<br />
renouvelables donneraient un potentiel d’économie moins important.<br />
Ainsi, les premiers résultats quantifiés estimés pour le Maroc montrent qu’un potentiel<br />
financier important semble pouvoir se dégager du fait même de l’intégration d’action d’ER et<br />
d’URE au niveau des pays. Les discussions ont affirmé l’importance de présenter en valeur<br />
51
52<br />
ENERGY AND SUSTAINABLE DEVELOPMENT IN THE MEDITERRANEAN<br />
monétaire les avantages attendus des actions d’ER et d’URE et par conséquent de<br />
poursuivre ces types de travaux.<br />
4.2 Mécanisme de déve l o ppe me nt propre, évo lution des<br />
m arc hés du carbone et impl icati ons sur la zone Mé di terranée<br />
Encadré 5 Le Mécanisme de Développement Propre<br />
Le Mécanisme pour un développement propre (MDP) est un des trois mécanismes de flexibilité<br />
mis en place dans le cadre du Protocole de Kyoto (PK). Dans l’architecture actuelle des accords<br />
climatiques internationaux, c’est le seul instrument qui crée un lien entre les pays dits de<br />
l’Annexe I c’est-à-dire qui ont pris des engagements de réduction d’émission et les pays en<br />
développement qui, en ratifiant le Protocole de Kyoto, n’ont pas pris d’engagements chiffrés. Ce<br />
mécanisme permet de créditer des réductions d’émission obtenues dans les pays en<br />
développement et de rapatrier les crédits ainsi générés (CERs) dans les pays développés ou en<br />
transition. D’un côté, ils facilitent l’atteinte de la conformité des pays de l’annexe I et, de l’autre,<br />
ils envoient un signal prix aux pays en développement qui pourront, s’ils parviennent à valoriser<br />
les CERs générés depuis leur territoire, trouver des sources de financement additionnelles pour<br />
leur développement. Enfin, pour pouvoir donner lieu à l’émission de CERs, il est nécessaire<br />
d’utiliser des technologies à faible teneur en carbone, ce qui se traduit pour les pays concernés<br />
par un développement «propre».<br />
Les pays du pourtour méditerranéen regroupent des pays tant de l’Annexe I que des pays<br />
hors Annexe I. Il s’agit donc d’un espace géographique dans lequel une coopération<br />
régionale dans le domaine du développement propre est appropriée et dans lequel le MDP<br />
peut jouer un rôle important tant pour aider les pays européens à satisfaire leurs propres<br />
objectifs de Kyoto que pour les pays sud-méditerranéens à avoir accès à des technologies<br />
plus performantes et propres.<br />
La discussion a été en partie basée sur les résultats de l’Atelier sous-régional organisé le 5<br />
mai 2006 à Paris dans le cadre d’un partenariat <strong>Plan</strong> Bleu/Université Méditerranéenne d’Été<br />
(UMET). Le compte-rendu résumé de cet atelier est attaché en annexe 5. Il analyse les<br />
raisons de la faible attractivité de la région pour le MDP (quelques progrès ont cependant été<br />
mentionnés lors des discussions), identifie les contraintes et atouts institutionnels régionaux<br />
de la mise en œuvre des projets MDP dans la région, analyse des pistes pour accélérer<br />
l’utilisation du MDP dans la région. Les conclusions montrent que sous réserve d’une<br />
certaine pro-activité des pays (telle que déjà observée en Tunisie qui a mis en place une<br />
task force dédiée pour identifier des projets), le contexte actuel pourrait être favorable à la<br />
région.<br />
Lors de l’atelier de Monaco, l’accent a été mis sur le fait que le récent marché européen du<br />
carbone pourrait être utilisé pour valoriser les projets MDP. Aujourd’hui 87% des échanges<br />
en valeur effectués sur les marchés de la finance carbone sont localisés sur le marché<br />
européen, ce qui en fait le plus important du monde. C’est aussi l’instrument qui pourra être<br />
utilisé pour atteindre l’objectif de l’UE de réduction de 20% des émissions de GES (alors que<br />
pour l’objectif de 20% d’ER, il n’existe pas d’instrument comparable). Sa proximité pourrait<br />
s’avérer être un atout, d’autant plus que les acheteurs potentiels de MDP se situent<br />
essentiellement en Europe (mais également au Japon). L’évolution aux Etats-Unis est un<br />
autre facteur important pour le futur de la finance carbone. L’opinion publique américaine<br />
évolue, le milieu des affaires anticipe des contraintes carbones, des mouvements se<br />
précisent au niveau des Etats et du système juridique. Les différents marchés et<br />
mécanismes existants pourraient être reliés à l’avenir et former un marché global du<br />
carbone.<br />
Dans le moyen/long terme, le débat énergétique se situera de plus en plus par rapport à la<br />
contrainte de l’effet de serre. La finance carbone aura un rôle plus important, les pays qui<br />
auront d’ores et déjà acquis la connaissance des mécanismes de cette finance auront un<br />
avantage comparatif pour en profiter au mieux.
Rapport de synthèse<br />
4.3 Les ER et l’URE dans l’aide publique au dé ve loppe ment<br />
( AP D ) en Mé di te rranée<br />
L’analyse de la base de données du Comité d’Aide au Développement de l’OCDE a permis<br />
d’établir un état des lieux chiffré sur la prise en compte des questions d’ER et d’URE dans<br />
l’APD reçue par la région.<br />
De nombreux pays donateurs sont encore loin de l’objectif fixé de 0,7% du PIB à destination<br />
de l’APD. En 2005, l’APD mondiale a connu un pic, néanmoins une part élevée de ces<br />
montants constitue des remises de dette accordées à l’Irak ou encore au Nigeria. Les flux<br />
d’APD à destination du secteur de l’énergie sont très faibles au regard de la part dans le total<br />
de l’APD reçue en Méditerranée (7 à 8% environ). A l’intérieur de l’APD énergie, un<br />
frémissement récent (2003-2004) apparaît néanmoins concernant les domaines d’actions<br />
des stratégies énergétiques de développement durable.<br />
10000<br />
9000<br />
8000<br />
7000<br />
6000<br />
5000<br />
4000<br />
3000<br />
2000<br />
1000<br />
0<br />
APD/AP et APD/AP secteur énergie aux pays<br />
méditerranéens 1995-2004<br />
(millions de dollars)<br />
APD/AP<br />
APD/AP Energie<br />
1995 1996 1997 1998 1999 2000 2001 2002 2003 2004<br />
1600<br />
1400<br />
1200<br />
1000<br />
800<br />
600<br />
400<br />
200<br />
APD/AD reçue par les pays méditerranéens - Secteur<br />
Energie, URE & ER (Millions USD constants)<br />
APD/AP Energie<br />
APD/AD URE<br />
APD/AD ER<br />
0<br />
1974 1977 1980 1983 1986 1989 1992 1995 1998 2001 2004<br />
Source: OECD/DAC/CRS database, 2006<br />
Les fonds d’APD « Energie » dédiés aux actions d’efficacité énergétique sont difficilement<br />
identifiables dans la base de données de l’OCDE ; les estimations semblent indiquer que ce<br />
domaine mobilise moins les bailleurs que celui des ER. En revanche, la coopération<br />
méditerranéenne (donneur rive Nord/receveur rive Sud) est plus intense dans ce dernier<br />
domaine que dans les ER : sur la période 1995-2004, 24% du total des actions APD d’URE<br />
en Méditerranée sont en provenance de pays de la rive Nord contre 15% dans les ER. Dans<br />
ce dernier domaine, ce sont l’Allemagne et le Japon qui sont les principaux acteurs<br />
bilatéraux.<br />
Il est cependant certain que les besoins en APD tous secteurs confondus restent importants<br />
et bien supérieurs aux volumes disponibles actuellement et que la coopération dans le<br />
domaine de la maîtrise de la demande d’énergie (MDE) et des ER demeure sousdimensionnée<br />
par rapport à l’ampleur des besoins. En outre l’APD pour les ER est<br />
concentrée à 80% sur l’éolien et l’aide allemande dans les ER se concentre principalement<br />
sur l'Égypte et le Maroc (environ 40% de l’APD totale ER dans les PSEM).<br />
D’un point de vue qualitatif, le <strong>Plan</strong> Bleu écrivait en 2004 : « … l’APD dans le domaine de<br />
l’ER et de l’URE se caractérise surtout par une multitude de projets isolés dont la capacité<br />
structurante à long terme n’est pas satisfaisante » ; le passage en revue de certains projets<br />
réalisés dans les années 2000 montre que les actions de « stop and go » n’ont pas disparu<br />
et que des gaspillages leur sont associés ; enfin la demande émanant des pays<br />
potentiellement receveurs peut aussi s’avérer ne pas s’orienter en priorité vers les ER et<br />
l’URE.<br />
Cependant, certains progrès ont été réalisés. Les pays receveurs intègrent mieux les actions<br />
des bailleurs dans leurs plans de développement nationaux, les bailleurs impliquent plus<br />
leurs fonds en partenariat avec des fonds publics et privés nationaux, l’ensemble des acteurs<br />
raisonnent plus en terme de programme que de projets. On l’a observé par exemple au<br />
Maroc dans le cadre de l'électrification rurale (PERG) ou encore en Tunisie dans le cadre du<br />
solaire thermique (APD et programmes de soutiens régionaux et nationaux). Dans ces<br />
exemples, l’APD joue un rôle de “démarreur” et est inclus dans des montages financiers<br />
53
54<br />
ENERGY AND SUSTAINABLE DEVELOPMENT IN THE MEDITERRANEAN<br />
impliquant des fonds publics nationaux, des fonds privés nationaux dans des stratégies à<br />
moyen terme ; ces exemples de partenariats publics privés (nationaux et internationaux)<br />
illustrent le rôle important que peut jouer la coopération internationale pour financer une<br />
partie du surcoût initial pour les ER et l’URE.<br />
Les discussions ont montré que des progrès sont encore à faire pour renforcer l’efficience<br />
des outils tels que l’APD et le MDP dans les secteurs de l’URE et de l’ER en Méditerrannée.<br />
Le MDP ne concerne par exemple que peu la région Méditerranée, même si à la différence<br />
d’autres régions du monde, il intéresse non marginalement l’URE et les ER. L’APD -faute de<br />
demande- n’est guère orientée vers l’ER et l’URE même si des opérations à dimension<br />
modeste comme celles développées en Tunisie en matière de chauffe-eau solaire ont<br />
donné, à leur échelle, des résultats satisfaisants.<br />
Ce sont in fine les ressources internes économisées au niveau des pays en améliorant<br />
l’efficacité énergétique qui pourraient se révéler être la principale ressource disponible.<br />
Les interventions entendues durant la séance inaugurale de la manifestation EVER2007 9 ont<br />
montré que le secteur privé et notamment bancaire était d’ores et déjà prêt à intervenir. Ceci<br />
illustre les grands changements qui ont eu lieu depuis le début des années 2000, date à<br />
laquelle, très peu de banques privées étaient prêtes à proposer des fonds d’investissement<br />
dans les domaines de l’ER et des URE à leurs clients. Cette évolution est en grande partie<br />
liée au développement relativement avancé dans plusieurs pays, notamment européens,<br />
d’un cadre législatif et institutionnel en faveur des ER et de l’URE.<br />
L’avancement dans la construction de ce cadre dans les pays méditerranéens est le principal<br />
sujet de discussion de la séance 3, basée sur les résultats des études nationales.<br />
9 Manifestation organisée par la Principauté de Monaco aux mêmes dates, à laquelle les participants ont été officiellement<br />
invités pour assister à la conférence inaugurale - en présence du Prince Albert II - sur le thème « Financement des énergies<br />
renouvelables ».
Rapport de synthèse<br />
5. Rapports nationaux sur l’efficacité énergétique et les énergies<br />
renouvelables<br />
5.1 Contexte, objectifs et cahier des charges des ra pports<br />
n a tiona ux<br />
La SMDD est une « stratégie cadre » pouvant inspirer l’élaboration (ou l’actualisation) des<br />
stratégies nationales de développement durable (SNDD) et de stratégies sectorielles, étant<br />
entendu qu’il revient à chaque pays de fixer ses propres objectifs.<br />
Il a été demandé au <strong>Plan</strong> Bleu d’aider les Parties Contractantes à se construire une<br />
information facilitant la mise en œuvre et le suivi de la SMDD et des SNDD. Le <strong>Plan</strong> Bleu<br />
avait notamment mandat, en 2006-2007, de réunir et diffuser un jeu d’indicateurs pour le<br />
suivi de la SMDD et de documenter les indicateurs, d’approfondir les analyses et de repérer<br />
des bonnes pratiques en matière d’efficacité énergétique, d’énergie renouvelable et de<br />
maîtrise des émissions de gaz à effet de serre.<br />
Les travaux engagés au titre de la SMDD ont été étroitement articulés avec ceux conduits au<br />
plan international, en particulier avec ceux programmés par la Commission du<br />
Développement Durable dont le cycle 2006-2007 (CDD 14 et CDD 15) traite notamment des<br />
thèmes « changements climatiques et ressources énergétiques aux fins du développement<br />
durable ».<br />
Dans ce contexte, les rapports nationaux réalisés par les pays volontaires avaient 2 objectifs<br />
principaux :<br />
7) Informer de la situation du pays et des évolutions enregistrées, des progrès réalisés ou<br />
prévus en termes d’efficacité énergétique et d’énergies renouvelables, des instruments<br />
mis en œuvre et d’exemples de bonnes pratiques. Contribuer à la réflexion<br />
méditerranéenne et au partage régional d’expériences, s’enrichir des expériences<br />
respectives des pays.<br />
8) Faire mieux prendre conscience de la nécessité de s’engager sur des objectifs ambitieux<br />
d’URE et de développement des ER, de mettre en place des outils spécifiques et de<br />
l’importance des bénéfices induits. Aider éventuellement les pays à élaborer le volet<br />
« énergie » de leurs stratégies nationales de développement durable, à sélectionner les<br />
indicateurs de suivi et à faire évoluer leurs politiques énergétiques.<br />
Pour atteindre ces objectifs, il était demandé que les rapports développent une réflexion<br />
prospective sur les risques liés aux évolutions attendues et prévues (évolutions<br />
tendancielles) ainsi que sur les pistes qui pourraient être proposées dans le cadre d’un<br />
renforcement des politiques d’URE et d’ER avec les objectifs possibles d’un scénario plus<br />
volontariste, les principaux obstacles à lever, les instruments et investissements à mettre en<br />
œuvre et les bénéfices (économiques, sociaux et environnementaux) qui pourraient en<br />
résulter.<br />
En outre, il a été demandé que les rapports présentent deux à cinq études de cas de bonne<br />
pratique à faire connaître à l’échelle méditerranéenne : exemple de progrès local en zone<br />
urbaine ou rurale ou/et exemple de progrès sectoriel ou encore d’effets induits sur le<br />
développement particulièrement remarquables.<br />
Les analyses développées dans les rapports nationaux se sont appuyées sur les statistiques<br />
et indicateurs disponibles, les pays étaient aussi invités à renseigner les indicateurs de suivi<br />
du chapitre « énergie et changement climatique » de la SMDD (4 indicateurs prioritaires et<br />
14 indicateurs complémentaires, cf. liste des indicateurs en annexe 6 et 7) en prenant en<br />
compte les définitions figurant dans les fiches descriptives des indicateurs annexées au<br />
cahier des charges et en précisant, le cas échéant, les définitions utilisées dans le pays.<br />
Le suivi de ces indicateurs met en lumière les grandes tendances observées concernant<br />
l’évolution, l’efficacité de l’utilisation de l’énergie, ainsi que les efforts accomplis pour<br />
développer les énergies renouvelables, la maîtrise des émissions de gaz à effet de serre,<br />
l’utilisation du mécanisme de développement propre du Protocole de Kyoto.<br />
55
56<br />
ENERGY AND SUSTAINABLE DEVELOPMENT IN THE MEDITERRANEAN<br />
Encadré 6 Indicateurs : part des énergies renouvelables et intensité énergétique en Méditerranée<br />
Malgré une tendance à la baisse de l’intensité énergétique (variation annuelle moyenne de -<br />
0,3% par an entre 1992 et 2003), les objectifs de réduction de 1 à 2% par an tels que définis<br />
dans la SMDD ne seront probablement pas atteints. Cette tendance cache des disparités<br />
importantes entre les pays, avec des résultats plus ou moins encourageants. A titre d’exemple, la<br />
Tunisie a déjà réussi à diminuer son intensité énergétique de plus de 1% par an en moyenne<br />
entre 1992 et 2003. Par ailleurs, comparée à la tendance mondiale (-1,6% par an entre 1992 et<br />
2003), la Méditerranée enregistre une moins bonne progression même si en terme absolu, la<br />
région enregistre une meilleure performance que celle du monde dans son ensemble (en 2003<br />
en Méditerranée, il fallait 151 tep (tonne équivalent pétrole) pour produire 1 million d’USD de PIB<br />
contre 212 tep dans le monde).<br />
Malgré une hausse de la quantité d’énergie renouvelable produite en valeur absolue (+3% par<br />
an entre 2000 et 2004) et compte tenu de l'augmentation simultanée de la demande, leur part<br />
dans le bilan énergétique est stable, voire diminue (3,2% en 2004 toutes filières confondues hors<br />
biomasse), ce qui est loin de l’objectif de la SMDD de 7% d’ER (hors biomasse) en 2015. A noter<br />
pour les pays riverains, des développements significatifs, tels que l'éolien en Espagne ou les<br />
chauffes-eau solaires à Chypre, en Turquie et en Israël. Pour les pays du Nord, il faut souligner<br />
que les tendances globales à la hausse des ER sont essentiellement le fait des pays non<br />
méditerranéens (Allemagne, Danemark). Ceci étant, la décision récente du Conseil de l’Energie<br />
d’atteindre 20% d’énergie renouvelable dans la consommation primaire d’énergie à l’horizon<br />
2020 devra permettre une intégration plus importante dans l’ensemble des PNM. Des solutions,<br />
stratégies et mécanismes volontaristes et adaptés restent à mettre en place au Sud.<br />
5.2 Principales pr o bléma ti ques mises en a vant da ns les<br />
r apports nationaux et discussions lors de l’atelier de Mo naco<br />
Les présentations des rapports lors de l’atelier, ainsi que les discussions, ont permis de<br />
mettre en évidence le contexte et les défis énergétiques des pays, les avancées dans les<br />
politiques d’ER et d’URE, les facteurs déclencheurs, les obstacles existants, les solutions<br />
possibles pour surmonter ces derniers et des exemples de bonne pratique.<br />
Des stratégies énergétiques très différentes sont observées entre les pays en fonction de la<br />
disponibilité des énergies et en raison du niveau de développement économique.<br />
Cependant, même si les expériences dans les ER et l’URE varient sensiblement selon les<br />
pays, tous affichent une volonté - plus ou moins forte - de les développer dans le futur<br />
proche, ce qui nécessite de construire un cadre réglementaire et institutionnel adéquat.<br />
5.2.1 Un cadre institutionnel en faveur des URE et des ER en cours de<br />
construction<br />
Même si quasiment tous les pays méditerranéens ont adopté des stratégies ou des objectifs<br />
cadres de développement des énergies renouvelables (parfois déclinés par type de<br />
technologie et d’énergie) et/ou dans une moindre mesure, d’efficacité énergétique, les<br />
présentations faites ont dessiné un paysage contrasté. Les potentialités énergétiques des<br />
pays concernés sont diverses et en la matière les pays exportateurs de ressources fossiles<br />
apparaissent moins déterminés à promouvoir l’URE et le recours aux ER que ceux dont la<br />
facture énergétique est lourde. Et dans l’ensemble, la promotion des ER est beaucoup plus<br />
avancée que celle de l’URE, qui, paradoxalement, apparaît comme étant le niveau d’action<br />
le plus cost-effective.<br />
La plupart des pays disposent d’institutions chargées de la promotion des énergies<br />
renouvelables et/ou de l’efficacité énergétique (ANME, APRUE, CDER, PEC, OEP…).<br />
Cependant, le cadre réglementaire relatif à l’efficacité énergétique et aux énergies<br />
renouvelables n’est pas encore abouti dans la plupart des PSEM et tarde à se décliner en<br />
mesures concrètes. A titre d’exemple, on peut citer les différents travaux et résultats des<br />
projets réalisés dans le secteur du bâtiment dans la perspective de la mise en place de<br />
réglementations thermiques adaptées aux PSEM. Malgré des résultats prometteurs, le défi à<br />
venir est de changer d'échelle et d'aller au-delà de simples actions pilotes qui ont été
Rapport de synthèse<br />
nombreuses dans les PSEM, tant dans le domaine des ER que celui de l'utilisation<br />
rationnelle de l’énergie (URE).<br />
Pour autant, sur certains sujets, de véritables efforts ont été faits pour s'aligner sur les<br />
standards internationaux et structurer les filières sur des critères de qualité tant au niveau<br />
des matériels que du renforcement de capacité des professionnels. On citera, par exemple,<br />
la mise en place des "étiquettes énergie" dans certains pays tels que la Tunisie, le Maroc,<br />
les actions de formation au Maroc et l’utilisation du solaire photovoltaïque pour<br />
l’électrification de zones rurales isolées (Maroc, Libye, Syrie, Israël), la position de leader<br />
mondial de l’éolien de l’Espagne.<br />
Les discussions ont mis en évidence que les interventions en faveur des ER et de l’URE<br />
attirent d’autant plus l’intérêt des acteurs qu’elles sont bien structurées autour d’actions bien<br />
identifiées et qui répondent à une stratégie intégrée dont les objectifs sont clairement<br />
affichés. Un message clair et crédible est déterminant pour l’implication du secteur privé.<br />
Il est ressorti également des discussions que les ER et l’URE ne devaient pas être mis en<br />
concurrence l’une avec l’autre mais être développées simultanément. Les participants ont<br />
également souligné l’importance de se situer dans une perspective de long terme et de<br />
mettre autant l’accent sur le correctif que sur l’anticipation. Dans ce cadre, il a été mentionné<br />
l’importance et l’utilité des échanges d’expériences et de savoir-faire pour que les pays<br />
puissent adapter des expériences réussies à leur contexte.<br />
5.2.2 Facteurs déclencheurs et obstacles<br />
Les avancées restent donc limitées, l’intérêt pour les questions d’ER et d’URE apparaît<br />
cependant grandissant. Pour les pays de la rive Nord, les facteurs déclencheurs sont les<br />
questions de sécurité d’approvisionnement et de réduction d’émissions de gaz à effet de<br />
serre (engagements par rapport au Protocole de Kyoto). Dans les pays de la rive Sud, le<br />
coût de la facture énergétique, l’équilibre des balances des paiements, les conséquences<br />
budgétaires de la hausse du prix des énergies fossiles incitant les gouvernements à<br />
subventionner le prix de l’énergie sont déterminants dans les volontés de diversifier l’offre et<br />
de maîtriser la demande d’énergie. Au final, il apparaît clairement que les pays les plus<br />
avancés dans certaines filières d’ER ou d’action d’URE sont ceux où la volonté politique est<br />
la plus affichée et offre le plus de soutien aux institutions en charge de la mise en œuvre<br />
(Tunisie par exemple). Les différentes présentations ont mis en évidence d’une part le rôle<br />
essentiel joué par la puissance publique et donc le pouvoir politique qu’il soit central ou local,<br />
dans les orientations ou choix retenus et d’autre part l’importance de raisonner le<br />
développement de l’URE et des ER à grande échelle et donc à l’échelle industrielle. Les<br />
exemples espagnol, tunisien, maltais, israélien en sont l’illustration.<br />
De nombreux obstacles persistent dans la mise en oeuvre concrète des politiques et<br />
stratégies d’URE et d’ER. Ces freins et obstacles sont de natures diverses : manque de<br />
volonté politique, contraintes administratives et organisationnelles (fragmentation des<br />
responsabilités, manque de coordination entre ministères concernés, manque de<br />
coopération de la part des grands opérateurs d’électricité, intérêts divergents…), inexistence<br />
ou insuffisance du cadre légal et institutionnel, contrôle laxiste, tarification non adaptée,<br />
manque de prise de conscience par les utilisateurs finaux mais aussi les décideurs, manque<br />
de qualification et de savoir-faire en matière d’ER et d’URE, coût encore élevé de certaines<br />
technologies d’ER et d’URE, difficultés de financement dues aux contraintes budgétaires,<br />
acceptabilité sociale, questions liées au foncier, etc. Au total, les ER et l’URE se retrouvent<br />
bien souvent en compétition inégale face aux énergies fossiles du fait d’un cadre non abouti<br />
(législation, réglementation….) pour leur développement.<br />
L’obstacle du financement des ER et de l’URE a par ailleurs été très souvent cité. Le surcoût<br />
initial des investissements dans les ER et l’EE par rapport au coût des énergies fossiles a<br />
notamment été mentionné comme élément de blocage. La hausse générale du prix des<br />
équipements d’énergie renouvelable depuis le début 2006 a aussi été mentionnée comme<br />
une difficulté nouvelle et supplémentaire.<br />
57
58<br />
ENERGY AND SUSTAINABLE DEVELOPMENT IN THE MEDITERRANEAN<br />
5.2.3 Utilisation des outils économiques, te chnologies, sensibilisation<br />
Plusieurs pays ont recours aux différents outils à leur disposition (outils techniques, législatifs<br />
et réglementaires, institutionnels, économiques, fiscaux, de formation et de sensibilisation…)<br />
pour progresser dans le domaine de l’URE et des ER. Les participants s’accordent pour dire<br />
que l’ensemble des outils disponibles doit être mobilisé.<br />
Les instruments et outils économiques disponibles pour réguler la demande énergétique ou<br />
diversifier l’offre sont utilisés de manière très différente selon les pays. Et en la matière le<br />
prix subventionné de l’énergie fossile dans les PSEM - que ceux-ci soient exportateurs ou<br />
importateurs de ressources fossiles – ainsi que dans l’UE pose question. La tarification de<br />
l’énergie reste un sujet très sensible dans l’ensemble des pays méditerranéens qu’il convient<br />
de ne pas détacher des nécessités sociales. En effet, selon les pays, les expériences de<br />
hausse de prix n’ont pas toujours donné les résultats escomptés. Il ressort des expériences<br />
que les questions d’équité sociale doivent être prises en compte et qu’une meilleure<br />
connaissance des élasticités prix à la consommation est nécessaire dans beaucoup de pays.<br />
Afin de rendre attractif les ER et l’URE, quelques pays de la rive Sud ont mis en place<br />
récemment des systèmes de subvention ou tarifs de rachat. La pertinence d’autres outils<br />
pour les PSEM, tels que les certificats blancs reste à étudier. L’expérience des pays<br />
méditerranéens européens (Espagne et France en particulier) montre l'impact positif des<br />
tarifs de rachat pour le développement de l'éolien et du solaire photovoltaïque connecté au<br />
réseau. Pour la biomasse, de bons résultats ont été obtenus grâce aux systèmes de taxes et<br />
subventions. Cependant, les discussions ont mis en avant que ce qui est faisable au Nord ne<br />
l’est pas forcément au Sud, et que des adaptations sont à étudier. Bien qu’elle soit récente et<br />
donc encore difficile à évaluer, l’expérience des Escos en Tunisie et en Israël semble<br />
prometteuse.<br />
Les technologies disponibles aujourd’hui sont fiables et ne constituent plus une barrière.<br />
Mais, la qualité des services associés aux ER et à l’URE ainsi que celle des équipements a<br />
été qualifiée par plusieurs pays (Égypte, Tunisie, Maroc) d’élément déterminant pour la<br />
réussite du développement des ER et de l’URE. Le besoin de renforcement de capacité dans<br />
ces domaines est aussi qualifié de réalité dans les pays du Sud et de l’Est de la<br />
Méditerranée.<br />
Parmi les sources d’énergie renouvelables possibles, l’utilisation de l’eau de mer a par<br />
exemple été mentionnée comme facteur d’avenir possible pour tempérer les bâtiments. Les<br />
participants ont aussi mentionné que la biomasse est très largement utilisée dans plusieurs<br />
pays et qu’elle mérite d’autant plus d’attention que des enjeux importants y sont liées en<br />
terme de désertification par exemple. Les biocarburants se placent dans le débat sur la<br />
manière d’utiliser les terres agricoles.<br />
La question de la sensibilisation a été qualifiée de « cruciale » à plusieurs reprises. Même si<br />
elle s’accroît dans la plupart des pays, la sensibilisation du public et des décideurs par<br />
rapport aux relations entre efficacité énergétique et changement climatique semble rester<br />
particulièrement faible. Il existe des problèmes d’acceptabilité (par exemple des éoliennes)<br />
de la part des citoyens qui pourrait être résolus en partie par plus d’information et de<br />
sensibilisation.<br />
Enfin, les pays du Sud et de l’Est de la Méditerranée ont souligné la nécessité de renforcer la<br />
coopération internationale et l’aide au développement pour appuyer le développement des<br />
ER et de l’URE.<br />
Encadré 7 Outils et incitations pour le développement des ER et de l’URE mis en place en Italie<br />
Source : extrait du résumé de l’étude nationale italienne<br />
En Italie, l'outil principal d'aide aux énergies renouvelables restera le mécanisme basé sur le<br />
marché du “Certificat Vert”. En parallèle, les tarifs de rachat pour le photovoltaïque et la récente<br />
législation sur l'efficacité énergétique dans le secteur de la construction contribueront à accélérer<br />
l’augmentation de la part des énergies renouvelables dans le mix-énergétique.
Rapport de synthèse<br />
Un autre mécanisme basé sur le marché, les “Certificats Blancs”, est également utilisé pour aider<br />
l'efficacité énergétique et les mesures d'économie d'énergie pour réduire la consommation finale.<br />
Le but est de réaliser, d'ici la fin du quinquennat 2005 – 2009, une économie d'énergie totale de<br />
2,9 millions de tep ( tonnes équivalent pétrole ).<br />
En termes de priorités politiques, le secteur de la construction est considéré comme un secteur<br />
pertinent dans lequel il est crucial d'intervenir pour réduire la consommation d'énergie et les<br />
émissions qui y sont liées. Parmi plusieurs standards, conditions et modalités pour améliorer la<br />
performance énergétique des bâtiments, la législation récente (Décret Législatif du 20 Décembre<br />
2006, N°311) prévoit aussi que dans tous les nouveaux bâtiments, ou en cas de restauration<br />
d'usines thermiques existantes, au moins 50 % de l'énergie annuelle nécessaire à la production<br />
d'eau chaude sanitaire devrait être fournie en utilisant des sources d'énergie renouvelables.<br />
Cette limite est réduite à 20 % pour les bâtiments situés dans les centres historiques.<br />
Pour les nouveaux bâtiments, ou en cas de restauration, on prévoit l'obligation d'installer du<br />
photovoltaïque pour la production électrique dont la capacité reste à définir par décret ministériel.<br />
De plus, pour les nouveaux bâtiments, ou en cas de restauration, il est obligatoire de prévoir le<br />
cadre de tous les travaux liés à la connexion au réseau de chauffage local, s'il est situé dans le<br />
voisinage.<br />
L'économie d'énergie et l'énergie renouvelable sont aussi encouragées par des mesures<br />
administratives et fiscales spécifiques, généralement introduites chaque année par la Loi de<br />
Finance, comme :<br />
Déduction des impôts d'un certain % du coût total des interventions consacrées à<br />
l'augmentation de l'efficacité ou aux installations d'équipements en énergie renouvelable.<br />
Réduction d'impôt (comme la TVA) pour les équipements et les systèmes de technologie<br />
propre ;<br />
Réduction, rationalisation des procédures administratives et du coût.<br />
Les incitations par subvention sont aussi possibles, mais l'adoption de mécanismes basés sur le<br />
marché au niveau national les laissent disponibles surtout pour les mesures régionales et<br />
locales.<br />
Pour aider les mesures en faveur de la réduction des émissions des GES en provenance des<br />
sources d’énergie, un Fond de Rotation de 200 M€ par an de 2007 à 2009 a été créé. Il aidera à<br />
financer un certain nombre d'actions prioritaires telles que des “usines haute performance<br />
utilisant la micro cogénération pour la production d'électricité et de chaleur” et d'autres<br />
interventions (incluant des projets pilotes) utilisant des énergies renouvelables.<br />
6. Exemples de bonnes pratiques ; Points de vue de la société civile et<br />
des institutions internationales<br />
6.1 Exemples de bonnes pra ti q ues<br />
De nombreux exemples de bonne pratique et de projets pilotes ont été menés en<br />
Méditerranée et forment aujourd’hui une base solide pour le développement à grande<br />
échelle des ER et de l’URE. Une sélection de 4 exemples présentés lors de l’atelier est<br />
donnée ci-dessous. Ils ont été extraits des résumés des études nationales :<br />
MAROC : L’Efficacité énergétique, une voie pour découpler croissance économique et<br />
croissance de la demande énergétique.<br />
Les projets d’efficacité énergétiques en milieu professionnel, le PROMASOL (programme de<br />
transformation du marché des chauffe-eau solaires), le programme de mise à niveau<br />
énergétique des hammams et fours boulangeries par la diffusion de technologies améliorées<br />
d’économie de bois, la promotion d’expertise et de services énergétiques de proximité, sont<br />
des programmes porteurs d’efforts d’innovations techniques, d’organisation et de<br />
financement.<br />
Ils permettent aujourd’hui au Centre de Développement des énergies renouvelables le<br />
développement conceptuel du programme d’efficacité énergétique dans le bâtiment<br />
59
60<br />
ENERGY AND SUSTAINABLE DEVELOPMENT IN THE MEDITERRANEAN<br />
collectif suivant un processus de capitalisation des mécanismes promotionnels, de<br />
consolidation des partenariats et d’accompagnement des chantiers stratégiques de<br />
construction d’infrastructures relevant des secteurs de la Santé, de l’Habitat, de l’éducation<br />
nationale, de l’Hôtellerie et des Collectivités Locales.<br />
Il s’agit d’une intégration horizontale des préoccupations énergétiques dans l’acte de bâtir<br />
englobant la réglementation thermique du bâtiment, la normalisation et la labellisation<br />
(conception architecturale, matériaux de construction, équipements énergétiques), le<br />
développement normatif et de guides techniques pour les professionnels, le renforcement de<br />
capacité des intervenants publics et privés, la réalisation d’un programme pilote touchant les<br />
secteurs clé mentionnés, le financement durable à travers les ressources budgétaires des<br />
établissements.<br />
Le programme résulte d’une maturation conjointe de l’approche chez les partenaires<br />
convaincus de la nécessité d’œuvrer ensemble pour répondre aux besoins et à l’exigence de<br />
confort croissante en contribuant à la maîtrise de la demande énergétique du pays, à la<br />
préservation de l’environnement et à l’optimisation de la gestion budgétaire des<br />
établissements.<br />
ÉGYPTE : développement de l’énergie éolienne<br />
Avec une capacité d’énergie éolienne installée de 230 MW, l’Égypte est le premier pays<br />
d’Afrique et du Moyen-Orient à bénéficier d’une production d’énergie éolienne. Depuis la fin<br />
des années 70, l’Égypte avait commencé à étudier l’utilisation des ERs; plusieurs accords<br />
bilatéraux et multilatéraux ont été signés et mis en œuvre pour explorer leur potentiel.<br />
Les études d’évaluation des ERs ont démontré le fort potentiel en énergie éolienne dont<br />
bénéficie le Golfe de Suez et ont stimulé l’intérêt mondial pour de telles études ainsi que<br />
pour la mise en œuvre de projets pilotes et de tests sur le terrain. Le succès remporté par<br />
ces initiatives, ainsi que l’élaboration du Wind Atlas a permis à l’Égypte de passer à<br />
l’utilisation commerciale à grande échelle.<br />
Il faut également mentionner ici la volonté des pays industrialisés, déjà expérimentés dans<br />
l’utilisation de l’énergie éolienne et dans la fabrication des infrastructures nécessaires, de<br />
collaborer avec l’Égypte en proposant des financements au démarrage des projets pour<br />
compenser le surcoût initial des ERs par rapport aux énergies traditionnelles et ainsi<br />
permettre le développement des infrastructures d’énergie éolienne. Ces pays incluaient<br />
l’Allemagne, le Danemark, suivis par l’Espagne et le Japon.<br />
Au niveau national, les bénéfices directs ou indirects du développement à grande échelle<br />
des éoliennes raccordées au réseau ont été nombreux, tels que les économies de gaz<br />
naturel et d’hydrocarbures, le renforcement des capacités et le partage de savoir-faire, la<br />
protection de l’environnement par la production d’énergie propre, contribuant ainsi au<br />
développement de zones désertiques isolées, et enfin en stimulant la fabrication locale des<br />
infrastructures nécessaires à hauteur de 25%.<br />
MALTE : Efficacité énergétique et dessalement<br />
Dans les îles maltaises, l'eau est une ressource rare ; or, avec une haute densité de<br />
population, de petites surfaces et un haut pourcentage de développement urbain, ainsi qu'un<br />
climat semi-aride, la pression sur les ressources en eau existantes est très forte. Pour faire<br />
face aux besoins de la population, l'eau est obtenue de deux façons : les sources et le<br />
dessalement. Les installations de dessalement ont été introduites dans les années 80 en<br />
réponse à un manque d'eau provenant d'une demande croissante et d'une insuffisance d'eau<br />
naturelle. Aujourd'hui, le dessalement contribue jusqu'à 50 % à la fourniture en eau potable<br />
de Malte.<br />
Divers projets ont aussi été entrepris par la Corporation des Services des Eaux pour<br />
améliorer l'efficacité énergétique des usines d'O.I. (Osmose Inverse). Une technologie<br />
moderne de récupération de l'énergie a été incorporée aux usines existantes comme suit :<br />
des roues Pelton ont été installées sur 6 trains utilisant des pompes pour osmose inverse<br />
à Phase Pembroke II. Cela a consisté en un simple remplacement d'un équipement plus
Rapport de synthèse<br />
ancien. Ce projet a contribué à une réduction de la consommation d'énergie de 4,5<br />
KWh/m3 à 3,6 Kwh/m3.<br />
des échangeurs de pression comme ceux incorporés dans l'installation d'O.I. De Lapsi.<br />
Cela a nécessité un changement complet de l'équipement ainsi qu'un remplacement de la<br />
pompe à haute pression et deux trains anciens ont été incorporés dans le processus. La<br />
consommation énergétique spécifique a été réduite de 4,5 Kwh/m3 à 3,2 Kwh/m3 grâce à<br />
ce projet.<br />
Cela a participé à une économie annuelle en électricité d'environ 13 millions de Kwh<br />
(Corporation des Services des Eaux, 2006).<br />
TUNISIE : développement de chauffe-eau solaires<br />
PROSOL résidentiel est un projet qui a démarré en 2005, et qui aura permis de relancer le<br />
marché du chauffage solaire de l’eau, à travers un mécanisme innovant, combinant un<br />
système de subvention à l’investissement, une bonification des intérêts, et un crédit octroyé<br />
par les opérateurs bancaires. L’originalité du système réside dans l’intégration des<br />
remboursements des crédits octroyés dans la facture électrique (STEG), ce qui permet de<br />
sécuriser le remboursement des crédits, et donc d’obtenir des taux d’intérêt plus avantageux<br />
de la part des opérateurs bancaires. Grâce à PROSOL, le marché s’est complètement repris,<br />
atteignant des niveaux record, encourageant la création de nouveaux opérateurs industriels<br />
et le développement de réseaux d’installateurs, et suscitant également le prolongement de<br />
l’expérience PROSOL résidentiel avec la reconduction de l’implication de la STEG et un<br />
engagement encore plus probant du secteur bancaire, et enfin le lancement d’un « PROSOL<br />
tertiaire » sur des bases proches de PROSOL résidentiel, qui va démarrer incessamment<br />
avec l’appui du PNUE et du Ministère italien de l’environnement.<br />
Ventes (m²)<br />
40 000<br />
35 000<br />
30 000<br />
25 000<br />
20 000<br />
15 000<br />
10 000<br />
5 000<br />
0<br />
Démarrage<br />
du projet GEF<br />
Epuisement de<br />
la subvention<br />
du GEF<br />
Lancement de<br />
PROSOL<br />
85 86 87 88 89 90 91 92 93 94 95 96 97 98 99 00 01 02 03 04 05 06 Année<br />
6.2 Poi nts de vu e Historique de la du marché société du chauffe-eau civi solaire le en Tunisie et des institu ti ons<br />
i n terna ti ona les<br />
La dernière séance de l’atelier a permis d’élargir le débat grâce à la présentation des points<br />
de vue de la société civile, d’institutions internationales et d’un bailleur de fonds bilatéral. Les<br />
principaux enseignements tirés des communications présentées et de la discussion ayant<br />
suivi peuvent être synthétisés comme suit :<br />
L’Agence internationale de l’énergie affiche tout l’intérêt d’inclure le développement des ER<br />
et de l’URE dans la gestion énergétique et exprime clairement que les conséquences d’un<br />
scénario tendanciel ne sont pas acceptables. Le scénario alternatif de l’AIE montre qu’au<br />
niveau mondial, une baisse de la demande de 4% en 2015 et de 10% en 2030 est possible.<br />
Cependant, partout dans le monde se pose la question de la mise en place des politiques<br />
permettant de tels résultats. Et, partout dans le monde, de nombreux obstacles demeurent,<br />
comme par exemple les écarts de subvention entre les différentes énergies ou encore le<br />
manque d’harmonisation entre les standards technologiques. Afin de surmonter ces<br />
obstacles, il est entre autre suggéré d’utiliser les outils tels que les tarifs de rachat de<br />
l’électricité. Mais les actions pour développer à grande échelle les ER et l’URE doivent être<br />
socialement acceptées. Elles le seront d’autant mieux que les acteurs de la société civile<br />
seront impliqués dans la mise en œuvre. Pour cela, il faut que la société civile s’organise. A<br />
titre d’exemple, il a été mentionné que les gros consommateurs d’énergie sont depuis<br />
longtemps regroupés alors que les petits ne le sont pas. Ils pourraient l’être au sein, par<br />
61
62<br />
ENERGY AND SUSTAINABLE DEVELOPMENT IN THE MEDITERRANEAN<br />
exemple, de conseils d’usagers. La compréhension des enjeux par les acteurs a aussi été<br />
indiquée comme point clef de la réussite des politiques et pour l’acceptabilité des éoliennes<br />
par exemple. L’implication des ONG locales et des acteurs locaux en général a été<br />
mentionnée comme un objectif possible pour mieux prendre en compte les besoins locaux et<br />
les vulnérabilités.<br />
Pour aider au développement des ER et de l’URE, les bailleurs de fonds et les acteurs de la<br />
coopération internationale sont désormais disponibles pour investir dans ces domaines et<br />
servir de déclencheur en offrant le « coup de pouce » nécessaire. L’AFD a clairement<br />
exprimé que les questions de durabilité énergétiques au sens large prennent de l’ampleur<br />
dans les réflexions internes.<br />
Enfin les participants s’accordent à dire que la définition des politiques d’ER et d’URE, leur<br />
mise en œuvre et leur suivi nécessitent des indicateurs d’efficacité énergétique harmonisés<br />
entre les pays, pertinents et mis à jour régulièrement. Il existe en Méditerranée un besoin de<br />
travaux régionaux sur ce thème.<br />
7. Synthèse et recommandations de l’atelier : 6 points clefs<br />
A l’issue des travaux de l’atelier de Monaco, les experts se sont mis d’accord sur l’ensemble<br />
de recommandations ci-dessous :<br />
Considérant que le développement énergétique de la Méditerranée doit contribuer au<br />
développement durable de la région en s’attachant notamment à renforcer la sécurité de<br />
l’approvisionnement, maîtriser les émissions de gaz à effet de serre, réduire les pollutions<br />
locales et régionales qui lui sont liées, permettre l’accès à l’énergie et aux services<br />
énergétiques et améliorer l’efficacité énergétique.<br />
Estimant que ces défis sont étroitement articulés avec les défis socio-économiques et<br />
environnementaux et notamment le changement climatique auxquels sont également<br />
confrontés les pays méditerranéens.<br />
Considérant que la demande en énergie en Méditerranée devrait s’accroître de 415 Mtep<br />
entre 2005 et 2020 pour atteindre 1360 Mtep, que la région dispose d’un des potentiels<br />
d’ER le plus élevé du monde et que les pertes diverses dues aux transformations, au<br />
transport et aux différents usages pourraient atteindre 20 à 50% de l’énergie consommée<br />
selon les pays.<br />
Prenant en compte les décisions du Conseil européen de réaliser 20% d’économie<br />
d’énergie et 20% de part des ER dans la consommation d’énergie européenne à l’horizon<br />
2020.<br />
Attachés à la mise en oeuvre de la convention de Barcelone et aux objectifs de la<br />
Stratégie Méditerranéenne de Développement Durable (SMDD).<br />
Les participants à la réunion d’experts sur l’énergie et le développement durable, réunis à<br />
Monaco les 29 et 30 mars 2007 recommandent aux autorités politiques nationales des pays<br />
méditerranéens :<br />
d’inscrire, conformément aux orientations de la SMDD, l’utilisation rationnelle de l’énergie<br />
(URE) et le développement des énergies renouvelables (ER) au rang de priorité<br />
stratégique nationale et décliner, en la matière et d’ici 2008, les objectifs arrêtés au plan<br />
régional en objectifs nationaux à la fois clairs, ambitieux, différenciés par secteurs et<br />
cadencés dans le temps,<br />
de mettre en place, d’ici 2010, un cadre institutionnel et réglementaire favorable au<br />
développement de l’URE et des ER et des stratégies de mobilisation des différents<br />
instruments et outils fiscaux, tarifaire, de marché disponibles selon une distribution<br />
adaptée aux contextes locaux et favorisant aussi bien les projets de dimension modeste<br />
que les projets industriels,<br />
de favoriser l’information du public sur les questions d’URE et d’ER en s’attachant<br />
notamment à développer des programmes d’éducation à l’environnement mettant l’accent<br />
sur ces questions, et de mettre en place des instruments permettant la participation<br />
effective des différentes catégories d’acteurs, notamment les femmes, à la prise de<br />
décision concernant l’URE et la promotion des ER,
Rapport de synthèse<br />
de soumettre à l’attention des partenaires publics et privés et notamment les bailleurs de<br />
fonds des projets d’URE et de promotion des ER en veillant à organiser la coordination de<br />
leurs interventions aux différentes échelles territoriales concernées,<br />
de mettre en place un système de suivi et d’évaluation des politiques et actions engagées<br />
en matière d’URE et d’ER en partageant et documentant les indicateurs pertinents<br />
développés par les organismes compétents, en particulier ceux retenus dans la SMDD,<br />
de renforcer la coopération régionale en matière d’URE et de promotion des ER en<br />
s’attachant notamment à mutualiser les capacités de recherche et d’évaluation et à<br />
partager les bonnes pratiques .<br />
En outre, il est attendu du <strong>Plan</strong> Bleu que, en liaison avec ses partenaires :<br />
il contribue à la collecte en matière énergétique d’une information claire, fiable,<br />
régulièrement actualisée et comparable entre pays,<br />
il poursuive ses travaux prospectifs dans le secteur de l’énergie en s’attachant à asseoir<br />
ses scénarios sur des hypothèses, notamment en matière économique, explicitées,<br />
d’analyser l’articulation entre changement climatique et question énergétique de manière<br />
plus approfondie en intégrant l’estimation du coût du changement climatique, des<br />
mesures d’adaptation et d’atténuation ;<br />
de rendre compte tous les deux ans des progrès enregistrés en matière d’ER et d’URE en<br />
Méditerranée en mettant en place et documentant des indicateurs partagés et pertinents<br />
établis selon des méthodologies éprouvées et de contribuer à mettre en place une plate<br />
forme d’échange de bonnes pratiques.<br />
8. Annexes<br />
Annexe 1 – Programme des activités<br />
Annexe 2 – Liste des participants aux activités<br />
Annexe 3 – Programme de l’atelier de Monaco<br />
Annexe 4 – Chapitre « Energie et changement climatique » de la SMDD<br />
Annexe 5 - Compte rendu résumé de l’atelier sous régional « Le MDP dans les pays Sud<br />
méditerranéens, forces et faiblesses, défis et perspectives - liens avec les projets d’EE &<br />
d’ER »<br />
Annexe 6 – Liste des indicateurs de suivi<br />
Annexe 7 – Fiches indicateurs renseignées pour 3 indicateurs prioritaires<br />
Annexe 8 – Communique de presse<br />
63
64<br />
ENERGY AND SUSTAINABLE DEVELOPMENT IN THE MEDITERRANEAN<br />
8.1 An n e xe 1 – Progra mme des acti vi tés<br />
Les activités sont les suivantes :<br />
Réunion Comité<br />
technique de pilotage<br />
Indicateurs de suivi de la<br />
SMDD<br />
Études régionales /<br />
internationales<br />
Réunion n°1 : 21 février 2006, <strong>Plan</strong> Bleu, Sophia-Antipolis<br />
Réunion n°2 : 17 septembre 2006, side meeting, UMET 5, Carthage<br />
Réunion N°3 : février 2007, Comité restreint pour la préparation de l’atelier de<br />
Monaco et consultations par voie électronique<br />
Sélection des indicateurs complémentaires, préparation du glossaire, rédaction des<br />
fiches indicateurs prioritaires<br />
Documents disponible sur :<br />
http://www.planbleu.org/methodologie/indicateursSmdd.html<br />
Rédaction des termes de référence et identification des experts pour la réalisation de<br />
3 études :<br />
Position de la zone par rapport aux scénarios <strong>Plan</strong> Bleu<br />
Questions économiques liées aux énergies renouvelables et l’utilisation rationnelle de<br />
l’énergie<br />
Politiques de coopération et d’aide au développement en Méditerranée : place des<br />
ER et de l’URE<br />
Atelier d’experts Organisation d’un atelier en partenariat avec l’UMET en mai 2006 à Paris, sur le<br />
thème :<br />
« Le MDP dans les pays Sud méditerranéens, forces et<br />
faiblesses, défis et perspectives - liens avec les<br />
projets d’EE & d’ER »<br />
Rédaction d’un compte rendu<br />
Documents disponibles sur :<br />
http://www.planbleu.org/themes/atelier_mdp.html<br />
Études nationales Identification des pays volontaires et des experts nationaux (12 pays au total)<br />
Rédaction du cahier des charges détaillé (disponible sur :<br />
http://www.planbleu.org/themes/energie_progr_travail2006_07.html)<br />
Contenu :<br />
- Information sur la réflexion stratégique nationale d’ER et d’URE, la situation du pays dans la<br />
mise en oeuvre, les perspectives et la prospective si elle existe, la mise en perspective avec la<br />
SMDD et les scénarios du <strong>Plan</strong> Bleu.<br />
- Deux à trois études de cas incluant des exemples territoriaux (villes), de filière et permettant de<br />
montrer de façon concrète les progrès réalisés, bénéfices obtenus, outils mis en œuvre,<br />
difficultés rencontrées, obstacles identifiés.<br />
- Une partie de synthèse analytique et plus critique permettant de mettre en évidence les<br />
principaux acquis et obstacles et de déboucher sur des pistes de propositions d’action dans le<br />
pays et au niveau de la coopération régionale.<br />
Rédaction et envoi d’un questionnaire court aux pays ne réalisant pas d’étude<br />
nationale.<br />
Atelier d’experts Organisation d’un atelier régional avec 40 participants – 29 et 30 mars 2007 à<br />
Monaco<br />
Tous les documents sont disponibles sur :<br />
http://www.planbleu.org/themes/atelier_energie_monaco.html<br />
Rapport de synthèse 20 à 30 pages
8.2 An n e xe 2 - Liste des participa n ts aux acti vi t és<br />
Rapport de synthèse<br />
La liste ci-dessous reprend l’ensemble des personnes ayant participé aux travaux « Énergie et changement climatique » ; le tableau indique le rôle et<br />
les activités auxquels les experts ont pris part.<br />
EXPERTS<br />
MEMBRES DU COMITE DE PILOTAGE<br />
1 M. Samir ALLAL, Expert Energie - IUT Mantes en Yvelines<br />
5, rue Gay Lussac, 75005 PARIS, France<br />
Tél. +33 1 30 98 13 70 - Fax +33 1 43 36 77 76 - directeur@iut-mantes.uvsq.fr<br />
2 Ms Virginia ALZINA, Director - Regional Activity Centre for Cleaner Production -<br />
CP/RAC<br />
25-27 Milanesat Street, 5th Floor, 08017 BARCELONE, Espagne<br />
Tél. +34 93 55 38 791 – Fax + 34 93 55 38 795 - valzina@cprac.org<br />
3 Mme Houda BEN JANNET-ALLAL, Responsable scientifique ER et DD - Observatoire<br />
Méditerranéen de l'Energie (OME)<br />
Arche des Dolines - 7 rue Soutrane, Les Bouillides – Garbejaïre, B.P. 248, 06905<br />
SOPHIA ANTIPOLIS Cedex, France<br />
Tél. +33 1 43 31 42 18 - +33 6 18 51 22 35 Fax +33 1 43 36 77 76 - allal@ome.org<br />
4 M. Frédéric BLANC, Directeur des études - Institut de la Méditerranée, " FEMISE<br />
network "<br />
Palais du Pharo, 58 Bd Charles Livon, 13007 MARSEILLE, France<br />
Tél. +33 4 91 31 51 95 - Fax+33 4 91 31 50 38 - f.blanc@femise.org /<br />
ins.med@femise.org<br />
5 Mme Hélène CONNOR, Présidente - HELIO INTERNATIONAL<br />
56, rue de Passy, 75016 75016 PARIS, France<br />
Tél. +33 1 42 24 51 48 - +33 6 08 23 87 86 Fax +33 1 42 24 86 33 -<br />
helene.connor@helio-international.org<br />
Atelier MDP<br />
Paris,<br />
mai 2006<br />
Expert<br />
Etude<br />
Nationale<br />
Expert<br />
Etude<br />
Régionale<br />
Questionnai<br />
re court<br />
Atelier<br />
Monaco,<br />
mars 2007<br />
√ √ √<br />
√ √<br />
√ √<br />
√<br />
√<br />
Remarques<br />
65
66<br />
EXPERTS<br />
MEMBRES DU COMITE DE PILOTAGE<br />
6 Mme Anne GED, Directeur de Missions Pole Politiques Publiques et Développement<br />
Durable, SOLVING France<br />
9, boulevard Malesherbes, 75008 PARIS, France<br />
ENERGY AND SUSTAINABLE DEVELOPMENT IN THE MEDITERRANEAN<br />
Tél. +33 6 76 95 77 13 - +33 1 53 30 35 00 Fax +33 1 53 30 35 69 - + 33 4 42 28 85 63<br />
anne.ged@solving-france.com<br />
7 M. Hamdi HARROUCH, Directeur de la Programmation, du Suivi et du Développement<br />
- ANME<br />
3 rue 8000 Montplaisir, BP 213, 1073 TUNIS, Tunisie<br />
Tél. +216 71 790 061 Fax +216 71 782 622 - hamdi.harrouch@anme.nat.tn<br />
8 M. Stéphane POUFFARY, Chef de Cellule Expertise Internationale pour la Maîtrise de<br />
l'Energie, ADEME (Agence de l'Environnement et de la Maîtrise de l'Energie)<br />
Centre de Valbonne, 500 Route des Lucioles, 06560 VALBONNE, France<br />
Tél. +33 4 93 95 79 55 - Fax +33 4 93 65 31 96 - stephane.pouffary@ademe.fr<br />
9 M. Francesco PRESICCE, Expert - MEDREP/Ministry for the Environment and<br />
Territory, Department for Environmental Research and Development<br />
Via C. Bavastro 174, 00147 ROME, Italie<br />
Tél. +39 06 57 22 81 62 – Fax +39 06 57 22 81 78 -presicce.francesco@minambiente.it<br />
10 M. Stéphane QUEFELEC, Economiste, <strong>Plan</strong> Bleu<br />
15, rue Beethoven, 06560 Sophia-Antipolis, VALBONNE, France<br />
Tél. +33 4 92 38 71 43 – Fax +33 4 92 38 71 31 - squefelec@planbleu.org<br />
Atelier MDP<br />
Paris,<br />
mai 2006<br />
Expert<br />
Etude<br />
Nationale<br />
Expert<br />
Etude<br />
Régionale<br />
Questionnai<br />
re court<br />
Atelier<br />
Monaco,<br />
mars 2007<br />
√ √<br />
√ √<br />
√ √<br />
√ √ √<br />
Remarques
Rapport de synthèse<br />
PARTICIPATION AUX ACTIVITES ATELIER<br />
MDP PARIS,<br />
11 M. Pierre-Etienne ALVAREZ-LUEGO, Stagiaire - Université de Versailles<br />
45 avenue des Etats Unis - 78035 Versailles cedex, France<br />
Tél. : 01 39 25 41 12 - Fax : 01 39 25 40 19 - Mob. +33 6 61 13 40 46 - pealvarez@neuf.fr<br />
12 M. Samir AMOUS, Expert International -APEX Conseil<br />
16 bis, rue du Docteur Alphonse Laveran, 1002 TUNIS BELVEDERE, Tunisie<br />
Tél. +216 22 545 866 - +216 71 848 094 – Fax +216 71 843 453 -<br />
amous.apex@gnet.tn<br />
13 M. Philippe ANTOGNELLI, Chef de Section à la Direction de l'Environnement, de<br />
l'Urbanisme et de la Construction<br />
Place de la Visitation, 98000 MONACO, Monaco<br />
Tél. +377 98 98 21 22 / 46 80 - Fax +377 93 50 95 91 - pantognelli@gouv.mc<br />
14 M. Benaïssa AYADI, Directeur Général - ANME<br />
3, rue 8000 Montplaisir, BP 213, 1073 TUNIS, Tunisie<br />
Tél. +216 71 782 419 - Fax +216 71 782 622 - dganme@anme.nat.tn<br />
15 M. Jean-Jacques BECKER - Bureau Exécutif du MDP - Ministère des transports, de<br />
l’équipement, du tourisme et de la mer<br />
Paris Sud - 92055 PARIS LA DEFENSE CEDEX, France<br />
Tél. +33 1 40 81 28 26 - Jean-Jacques.Becker@equipement.gouv.fr<br />
16 M. Mohamed BERDAI, Directeur coopération internationale - CDER (Centre de<br />
Développement des ER)<br />
Cité Administrative, 31, rue du Souss, RABAT, Maroc<br />
Tél. +21261 305 592 - Fax+212 37 68 39 87 -berdai@mem.gov.ma<br />
MAI 2006<br />
√<br />
√<br />
EXPERT<br />
ETUDE<br />
NATIONALE<br />
EXPERT<br />
ETUDE<br />
REGIONALE<br />
QUESTIONNAI<br />
RE COURT<br />
ATELIER<br />
MONACO,<br />
MARS 2007<br />
√ √<br />
√ √<br />
√<br />
√<br />
REMARQUES<br />
67
68<br />
ENERGY AND SUSTAINABLE DEVELOPMENT IN THE MEDITERRANEAN<br />
PARTICIPATION AUX ACTIVITES ATELIER<br />
MDP PARIS,<br />
17 M. Alexis BONNEL, Responsable Division Infrastructures - Agence Française de<br />
Développement (AFD)<br />
5, rue Roland Barthes, 75598 PARIS Cedex 12, France<br />
Tél. +33 1 53 44 35 43 - Fax+ 33 1 53 44 38 65 - bonnela@afd.fr<br />
18 M. Didier BOSSEBOEUF, Expert économiste - ADEME (Agence de l'Environnement et<br />
de la Maîtrise de l'Energie), Direction exécutive Stratégie et Recherche<br />
27, rue Louis Vicat, 75737 PARIS CEDEX 15, France<br />
Tél. +33 1 47 65 23 55 – Fax +33 1 40 95 74 53 - didier.bosseboeuf@ademe.fr<br />
19 M. Abdelaziz BOURAHLA, Chargé de mission - <strong>Plan</strong> Bleu<br />
15, rue Beethoven, Sophia-Antipolis, 06560 VALBONNE, France<br />
Tél. +33 4 92 38 71 45 – Fax +33 4 92 38 71 31 - abourahla@planbleu.org<br />
20 M. George CASSAR, Operations Engineer - Malta Resources Authority (MRA)<br />
Millennia 2nd Floor, Aldo Moro Road Marsa LQA 06 Malta, LQA 06 MARSA, Malte<br />
Tél. +356 21 220 625 - +356 21 220 619 - Fax +356 21 220 622<br />
george.cassar@mra.org.mt<br />
21 M. Lucien CHABASON, Président du <strong>Plan</strong> Bleu<br />
15, rue Beethoven, Sophia-Antipolis, 06560 VALBONNE, France<br />
Tél. +33 4 92 38 71 30 - Fax +33 4 92 38 71 31<br />
22 M. Hocine CHALAL, Senior Environmental Specialist - World Bank<br />
1818 H Street, N.W., Room H8-133, WASHINGTON, DC 20433, Etats-Unis<br />
Tél. +202 458 21 53 - Fax +202 477 16 09 / 19 81 - hchalal@worldbank.org<br />
MAI 2006<br />
23 M. Oussama Jaoued. CHERKAOUI, CDER √<br />
EXPERT<br />
ETUDE<br />
NATIONALE<br />
EXPERT<br />
ETUDE<br />
REGIONALE<br />
QUESTIONNAI<br />
RE COURT<br />
ATELIER<br />
MONACO,<br />
MARS 2007<br />
√ √<br />
√ √<br />
√<br />
√<br />
√<br />
√<br />
REMARQUES
Rapport de synthèse<br />
PARTICIPATION AUX ACTIVITES ATELIER<br />
MDP PARIS,<br />
Rue Machaar Elharam, Quartier Issil Menara Gueliz, MARRAKECH, 40000, Maroc<br />
Tél. +212 24 30 98 22 / 09 /14 - Fax. +212 24 30 97 95 - cder@menara.ma;<br />
o.cherkaoui@cder.org.ma<br />
24 M. Hamid CHRIFI, Responsable de Département - ENDA Maghreb, Dép. Env. et Dév.<br />
Rural<br />
12 rue Jbel Moussa Appt. 13, Joli Coin, 10 000 RABAT AGDAL, Maroc<br />
Tél. +212 37 67 10 61 - Fax+212 37 67 10 64 - Hamid.chrifi@enda.org.ma<br />
25 M. Krešimir CEROVAC, Ministry of economy, labour and entrepreneurship<br />
Vukovarska avenija 78, 10000 ZAGREB, Croatie<br />
Tél. + 385 1 61 06 946 – Fax +385 1 61 09 113 - kresimir.cerovac@mingorp.hr<br />
26 M. Jean COPREAUX, Université de Versailles<br />
45, avenue des Etats Unis, 78035 Versailles cedex, France<br />
Tél. : 01 39 25 41 12 - Fax : 01 39 25 40 19 Mob. +33 6 86 95 25 67 -<br />
jean.copreaux@free.fr<br />
27 M. Christian de PERTHUIS, Conseiller à la Caisse des dépôts et Consignations -<br />
Caisse des dépôts et Consignations<br />
Direction du développement durable<br />
56, rue de Lille, 75356 PARIS 7, France<br />
Tél. +33 1 58 50 22 62 -Fax +33 1 58 50 00 30 -<br />
christian.deperthuis@caissedesdepots.fr<br />
28 M. Nicolas DYEVRE, Responsable Maghreb et Moyen-Orient - ADEME (Agence de<br />
l'Environnement et de la Maîtrise de l'Energie)<br />
27, rue Louis Vicat, 75015 PARIS, France<br />
Tél. +33 1 47 65 24 88 - Fax +33 1 47 65 22 29 - nicolas.dyevre@ademe.fr<br />
MAI 2006<br />
√<br />
EXPERT<br />
ETUDE<br />
NATIONALE<br />
EXPERT<br />
ETUDE<br />
REGIONALE<br />
QUESTIONNAI<br />
RE COURT<br />
√<br />
ATELIER<br />
MONACO,<br />
MARS 2007<br />
√ √<br />
√<br />
√<br />
REMARQUES<br />
69
70<br />
ENERGY AND SUSTAINABLE DEVELOPMENT IN THE MEDITERRANEAN<br />
PARTICIPATION AUX ACTIVITES ATELIER<br />
MDP PARIS,<br />
29 Dr. Mohamed EKHLAT, Manager of Renewable Energy Department, <strong>Plan</strong>ning Unit<br />
General Electric Company of Libya, "GECOL"<br />
Swanii Road, P.O. Box 81187, TRIPOLI, Libye<br />
Tél. +218 (21) 480 74 32 - Fax +218 21 480 74 34 - libyacigre@gmail.com<br />
30 M. Habib ELANDALOUSSI, Responsable Scientifique - Observatoire Méditerranéen de<br />
l'Energie (OME)<br />
Arche des Dolines – 7, rue Soutrane, Les Bouillides – Garbejaïre, B.P. 248, 06905<br />
SOPHIA ANTIPOLIS Cedex, France<br />
Tél. +33 4 92 96 66 97 - Fax +33 4 92 96 66 99 - andalous@ome.org<br />
31 Mme Semra FEJZIBEGOVIC, National Expert for Renewable Energy - Hydro-<br />
Engineering Institute<br />
Stjepana Tomica 1, 71 000 SARAJEVO, Bosnie-Herzégovine<br />
Tél. + 387 33 212 466 - Fax +387 33 212 467 - semra.fejzibegovic@heis.com.ba<br />
32 Mme Rabéa FERROUKHI, Responsable Scientifique - Observatoire Méditerranéen de<br />
l'Energie (OME)<br />
Arche des Dolines – 7, rue Soutrane, Les Bouillides – Garbejaïre, B.P. 248, 06905<br />
SOPHIA ANTIPOLIS Cedex, France<br />
Tél. +33 4 92 96 66 96 – Fax +33 4 92 96 66 99 - ferroukhi@ome.org<br />
33 M. Rafik Youssef GEORGY, Technical Consultant -NREA - New and Renewable<br />
Energy Authority<br />
21 Hamadan Street, 12211 GUIZA, Égypte<br />
Tél. +202 572 55 25 +20 12 38 10 014 - Fax +202 27 17 173 -<br />
rafikyousef19@hotmail.com; rafik_youssef19@yahoo.co.uk<br />
34 Mlle Atika GOUGELIN, Stagiaire, Université de Versailles<br />
45 avenue des Etats Unis - 78035 Versailles cedex, France<br />
MAI 2006<br />
√<br />
EXPERT<br />
ETUDE<br />
NATIONALE<br />
EXPERT<br />
ETUDE<br />
REGIONALE<br />
QUESTIONNAI<br />
RE COURT<br />
ATELIER<br />
MONACO,<br />
MARS 2007<br />
√ √<br />
√ √<br />
√ √<br />
√ √<br />
√ √<br />
REMARQUES
Rapport de synthèse<br />
PARTICIPATION AUX ACTIVITES ATELIER<br />
MDP PARIS,<br />
Tél. : 01 39 25 41 12 - Fax : 01 39 25 40 19 - atika_78@hotmail.fr<br />
35 Ms Višnja GRGASOVIĆ, Ministry of Environmental Protection, physical <strong>Plan</strong>ning and<br />
Construction<br />
Ulica Republike Austrije 14, 10000 ZAGREB, Croatie<br />
Tél. +385 1 37 82 117 – Fax +385 1 37 82 157 - visnja.grgasovic@mzopu.hr<br />
36 M. François IBANEZ, Informaticien - <strong>Plan</strong> Bleu<br />
15, rue Beethoven, Sophia-Antipolis, 06560 VALBONNE, France<br />
Tél. +33 4 92 38 71 30 – Fax +33 4 92 38 71 31 - fibanez@planbleu.org<br />
37 M. Jan KAPPEN, Associate Expert, Renewable Energy and Finance - Energy Branch<br />
UNEP Division of Technology, Industry and Economics<br />
Tour Mirabeau, 39-43, quai André Citroën, 75739 PARIS Cedex 15, France<br />
Tél. + 33 1 44 37 76 15 - Fax + 33 1 44 37 14 74 - jan.kappen@unep.fr<br />
38 M. Mustafa KLEICHE, AFD<br />
5, rue Roland Barthes, 75598 PARIS Cedex 12, France<br />
Tél. +33 1 53 44 31 31 / 31 17 - Fax +33 1 44 87 99 39 - kleichem@afd.fr<br />
39 Dr. Ahmet KOYUN, Expert - Termodinamik Anabilim Dal, Yildiz Teknik Universitesi<br />
Besiktas Kampusu<br />
Yildiz / Istanbul, 34349 ISTANBUL, Turquie<br />
Tél. +90 533 391 82 30 +90 212 259 70 70/2549 +90 542 225 4428 -Fax +90 212 261<br />
66 59<br />
koyun@yildiz.edu.tr; alenkuyumcu@yahoo.com ; info@alargesoft.com ;<br />
tokgozb@gmail.com<br />
40 M. Ashraf KRAIDY, Head of Energy regulation department - National Energy Research<br />
Center (NERC), Ministry of Electricity<br />
MAI 2006<br />
√<br />
√<br />
EXPERT<br />
ETUDE<br />
NATIONALE<br />
√<br />
√<br />
EXPERT<br />
ETUDE<br />
REGIONALE<br />
QUESTIONNAI<br />
RE COURT<br />
√<br />
ATELIER<br />
MONACO,<br />
MARS 2007<br />
√<br />
REMARQUES<br />
71
72<br />
ENERGY AND SUSTAINABLE DEVELOPMENT IN THE MEDITERRANEAN<br />
PARTICIPATION AUX ACTIVITES ATELIER<br />
MDP PARIS,<br />
Dahyet Alassad, Avenue B4. bldg. No. 37., DAMAS, Syrie<br />
Tél. +963 93 471 728 +963 93 471 728 – Fax +963 11 213 8336 - nerc@mail.sy ;<br />
ashrafkraidy@yahoo.com<br />
41 Mme Fabienne LEMARCHAND-COPREAUX<br />
Journaliste<br />
Mob. +33 6 66 21 57 28 - copreaux@free.fr<br />
42 M. Mario LIONETTI, Expert - Italian Ministry for the Environment Land and Sea,<br />
Department for Environmental Research and Development<br />
Via C. Bavastro 174, 00147 ROME, Italie<br />
Tél. +39 06 57 22 81 15 – Fax +39 06 57 22 81 78 - Lionetti.Mario@minambiente.it<br />
43 Mme Maryse LOUIS, Programs Manager - Economic Research Forum<br />
7 Boulos Hanna Street, Dokki, LE CAIRE, Égypte<br />
Tél. +202 748 55 53 - +44 774 334 65 63 Fax +202 761 60 42 - mlouis@erf.org.eg<br />
44 M. Philippe MASSET, Chef du Département des Programmes Internationaux, ADEME<br />
(Agence de l'Environnement et de la Maîtrise de l'Energie)<br />
27, rue Louis Vicat, 75015 PARIS, France<br />
Tél. +33 1 47 65 23 92 - Fax +33 1 47 65 22 29 - philippe.masset@ademe.fr<br />
45 M. Philippe MEUNIER, Secrétaire général, MIES - Mission interministérielle de l'effet de<br />
serre<br />
20, avenue de Ségur, 75700 PARIS, France<br />
Tél. +33 1 42 19 15 64 - philippe.meunier@ecologie.gouv.fr<br />
46 Dr. Amit MOR, Chief executive officer - Eco Energy Ltd.<br />
Ackerstein Building, 103 Medinat Hayehudim Street, PO Box 4079, 46140 HERZLIYA<br />
PITUACH, Israël<br />
MAI 2006<br />
√<br />
√<br />
√<br />
EXPERT<br />
ETUDE<br />
NATIONALE<br />
EXPERT<br />
ETUDE<br />
REGIONALE<br />
QUESTIONNAI<br />
RE COURT<br />
ATELIER<br />
MONACO,<br />
MARS 2007<br />
√ √<br />
√ √<br />
√<br />
REMARQUES
Rapport de synthèse<br />
PARTICIPATION AUX ACTIVITES ATELIER<br />
MDP PARIS,<br />
Tél. +972 54 422 3720 Fax +972 9 956 4255 - Amitmor@ecoenergy.co.il<br />
47 M. Bastien NICAISE, Agent du Bureau de la Coopération Internationale, Département<br />
des Relations Extérieures de la Principauté de Monaco<br />
Tél. +377 93 15 42 29 - Fax +377 97 77 73 22 - ramoge@ramoge.org<br />
48 M. Néjib OSMAN, Directeur des Etudes et de la <strong>Plan</strong>ification, Responsable de la Cellule<br />
d'Information sur l'Energie Durable et l'Environnement – CIEDE, Agence Nationale pour<br />
la Maîtrise de l'Energie<br />
3, Rue 8000 Montpalisir B.P 213, 1073 Tunis, Tunisie<br />
Tél. + 216 71 787 700 – 288 997 - Fax + 216 71 784 624 - Mob. +216 98 647 521 -<br />
osman.nejib@anme.nat.tn; dep.ciede@anme.nat.tn<br />
49 M. Costas PAPASTAVROS, Environment Officer - Ministry of Agriculture, Natural<br />
Resources and Environment - Environment Service<br />
17 Taghmatarhou Pouliou, Ayios Andreas, 1411 NICOSIE, Chypre<br />
Tél. +357 22 30 27 30/38 86 - +357 22 408 307 -+357 99 63 56 91 - Fax+357 22 44 51<br />
56 +357 22 7749 45<br />
cpapastavros@environment.moa.gov.cy; environm@spidernet.com.cy<br />
50 Mme Elena PITA, Oficina Española de Cambio Climático (OECC), Ministerio de Medio<br />
Ambiente<br />
Pza. San Juan de la Cruz s/n, 28071 MADRID, Espagne<br />
Tél. +34-91 597 66 37 - Fax +34-91 597 59 50 - EPita@mma.es<br />
51 M. Nicolas POUGET, SYNAGIR<br />
9, boulevard Malesherbes, 75008 PARIS, France<br />
Tel. +33 1 53 30 35 00 - Fax. +33 1 53 30 35 69<br />
52 Mme Mar SANTACANA, PNUE/PAM, CAR/PP - Centre d'activités régionales pour la<br />
production propre<br />
MAI 2006<br />
√<br />
√<br />
√<br />
√<br />
√<br />
EXPERT<br />
ETUDE<br />
NATIONALE<br />
EXPERT<br />
ETUDE<br />
REGIONALE<br />
QUESTIONNAI<br />
RE COURT<br />
ATELIER<br />
MONACO,<br />
MARS 2007<br />
√ √<br />
REMARQUES<br />
73
74<br />
ENERGY AND SUSTAINABLE DEVELOPMENT IN THE MEDITERRANEAN<br />
PARTICIPATION AUX ACTIVITES ATELIER<br />
MDP PARIS,<br />
25 - 27 Milanesat street, 5th Floor, 08017 BARCELONE, Espagne<br />
Tél. +34 93 415 11 12 - Fax +34 93 237 02 86 - msantacana@cema-sa.org<br />
53 Mme Diane SEGAL, Regional Coordinator - ADEME (Agence de l'Environnement et de<br />
la Maîtrise de l’Energie)<br />
27, rue Louis Vicat, 75737 PARIS Cedex 15, France<br />
Tél. +33 1 47 65 21 79 - diane.segal@ademe.fr<br />
54 M. Faouzi SENHAJI, Professeur, I.A.V. Hassan II & GERERE (Groupe d'Etudes et de<br />
Recherches sur les Energies Renouvelables et l'Environnement)<br />
BP 6202, 10101 RABAT, Maroc<br />
Tél. +212 37 77 74 43 - Fax +212 37 77 58 45 & +212 37 77 81 35 & +212.37.77 62 46 -<br />
Mob. +212 61 23 34 34<br />
f.senhaji@iav.ac.ma; fasen@menara.ma; senhaji@mtds.com<br />
55 M. Roméo PRENGERE, Etudiant -<strong>Plan</strong> Bleu<br />
15, rue Beethoven, Sophia-Antipolis, 06560 VALBONNE, France<br />
Tél. +33 4 92 38 71 30 - +33 4 92 38 71 31 - romeoprengere@yahoo.fr<br />
56 Mle Bassima SAIDI, Assistante - <strong>Plan</strong> Bleu<br />
15, rue Beethoven, Sophia-Antipolis, 06560 VALBONNE, France<br />
Tél. +33 4 92 38 71 32 – Fax +33 4 92 38 71 31 - bsaidi@planbleu.org<br />
57 M. Henri-Luc THIBAULT, Directeur - <strong>Plan</strong> Bleu<br />
15, rue Beethoven, Sophia-Antipolis, 06560 VALBONNE, France<br />
Tél. +33 4 92 38 71 30 – Fax +33 4 92 38 71 31 - hlthibault@planbleu.org<br />
58 Mme Myriem TOUHAMI KADIRI, Programme Officer-Service Energie - UNEP Division<br />
of Technology, Industry and Economics, Energy Branch<br />
MAI 2006<br />
√<br />
EXPERT<br />
ETUDE<br />
NATIONALE<br />
EXPERT<br />
ETUDE<br />
REGIONALE<br />
QUESTIONNAI<br />
RE COURT<br />
ATELIER<br />
MONACO,<br />
MARS 2007<br />
√ √ √<br />
√ √<br />
√<br />
√<br />
√<br />
REMARQUES
Rapport de synthèse<br />
PARTICIPATION AUX ACTIVITES ATELIER<br />
MDP PARIS,<br />
Tour Mirabeau, 39-43, quai André Citroën, 75739 PARIS Cedex 15, France<br />
Tél. + 33 1 44 37 16 30 – Fax + 33 1 44 37 14 74 - mtouhami@unep.fr<br />
59 M. Ronan UHEL, Head of Programme, Strategic Knowledge and Innovation -European<br />
Environment Agency<br />
Kongens Nytorv 6, 1050 COPENHAGUE, Danemark<br />
Tél. +45 33 36 71 30 - +45 33 36 72 31 - Fax +45 (33) 36 72 93 -<br />
Ronan.Uhel@eea.europa.eu<br />
60 M. Patrick VAN KLAVEREN, Délégué à l'Environnement International et Méditerranéen<br />
- Ministère d'Etat<br />
Place de la Visitation, 98000 MONACO, Monaco<br />
Tél. +377 93 15 21 22 – Fax +377 93 50 95 91 - pvanklaveren@gouv.mc<br />
61 M. Roberto VIGOTTI, Chair Renewable Committee – INERGIA, Sviluppo Business e<br />
Relazioni Esterne<br />
Via del Tritone 125, 00156 ROME, Italie<br />
Tél. +39 06 977 46 380 - +39 329 63 54 060 – Fax +39 06 977 46 381 -<br />
roberto.vigotti@inergia.it; info@inergia.it<br />
MAI 2006<br />
MEMBRES DU MCSD WORKING GROUP ATELIER<br />
MDP PARIS,<br />
62 M. Hicham ABOU JAOUDE, Président - UMCE-BUSINESSMED, Env-Energy<br />
90201 Jdeidet El Metn, Liban<br />
Tél.: +961 341 22 67 - h.aboujaoude@umce-med.org ; hichamaj@hotmail.com<br />
63 M. Khaled ABU ZEID, Regional Water Resources Program Manager -CEDARE<br />
(Centre for Environemnt & Development for the Arab Region & Europe)<br />
MAI 2006<br />
EXPERT<br />
ETUDE<br />
NATIONALE<br />
EXPERT<br />
ETUDE<br />
NATIONALE<br />
EXPERT<br />
ETUDE<br />
REGIONALE<br />
EXPERT<br />
ETUDE<br />
REGIONALE<br />
QUESTIONNAI<br />
RE COURT<br />
ATELIER<br />
MONACO,<br />
MARS 2007<br />
√<br />
√ √<br />
QUESTIONNAI<br />
RE COURT<br />
√<br />
ATELIER<br />
MONACO,<br />
MARS 2007<br />
√<br />
REMARQUES<br />
REMARQUES<br />
Invitation<br />
déclinée<br />
75
76<br />
ENERGY AND SUSTAINABLE DEVELOPMENT IN THE MEDITERRANEAN<br />
MEMBRES DU MCSD WORKING GROUP ATELIER<br />
MDP PARIS,<br />
2 Elhegaz Street, P.O Box 1057, HELIOPOLIS BAHARY LE CAIRE, Égypte<br />
Tél. +20 2 451 39 21/23/24 - ext.665 - Fax +20 2 451 39 18 -kabuzeid@cedare.org<br />
64 Mme Romina BICOCCHI - LEGAMBIENTE- League for the Environment, Osservatorio<br />
sul Turismo Sostenibile, <strong>Mediterranean</strong> Observatory & Clean Up the Med Sea <strong>Action</strong>,<br />
Segreteria Organizzativa FestAmbiente<br />
Loc. Enaoli, 58010 RISPESCIA (GR), Italie<br />
Tél. +39 0564 487711 - Fax +39 0564 487740 - mediterraneo3@festambiente.it<br />
65 M. Mohamed Larbi CHAKROUN, Président - AIFM<br />
14, rue Louis Astouin, 13002 MARSEILLE, France<br />
Tél. +33 4 91 90 76 70 – Fax +33 4 91 90 71 62 - info@aifm.org;<br />
gaelle.fossoy@aifm.org<br />
66 Dr. Magdi IBRAHIM, Coordinateur des Programmes Environnement et Développement<br />
au Maghreb -ENDA Maghreb<br />
12 rue Jbel Moussa Appt. 13, JOLI COIN, 10 000 RABAT AGDAL, Maroc<br />
Tél. +212 37 67 10 61 Fax +212 37 67 10 64 - coord@enda.org.ma ;<br />
magdi@enda.org.ma ; endamaghreb@enda.org.ma<br />
67 M. Eriuccio NORA, Direttore Area Programmazione e Pianificazione Territoriale -<br />
AGENDE 21 Locali Italiane<br />
Provincia di Modena, Viale Martiri della Libertà 34, 41100 MODENA, Italie<br />
Tél. +39 059 209 350/434 - Fax Fax +39 059 209 398 -<br />
coordinamento.agenda21@provincia.modena.it; nora.e@provincia.modena.it<br />
68 M. Ioannis SPILANIS, Assistant Professor - Dept. of Environment-University of the<br />
Aegean, Laboratory of Local and Islands' Development<br />
Ex-Xenia Building, 81100 MYTILINI, Grèce<br />
Tél. +30 225 10 36 229 – Fax +30 225 10 36 290 - gspi@aegean.gr<br />
MAI 2006<br />
EXPERT<br />
ETUDE<br />
NATIONALE<br />
EXPERT<br />
ETUDE<br />
REGIONALE<br />
QUESTIONNAI<br />
RE COURT<br />
ATELIER<br />
MONACO,<br />
MARS 2007<br />
√<br />
REMARQUES<br />
Invitation<br />
déclinée<br />
Invitation<br />
déclinée<br />
Invitation<br />
déclinée<br />
Invitation<br />
déclinée
Rapport de synthèse<br />
MEMBRES DU MCSD WORKING GROUP ATELIER<br />
MDP PARIS,<br />
69 M. Constanttinos TRIANTAFILLOU - Maritime Sector, HELMEPA<br />
5, Pergamou Str., Nea Smirni, 17121 ATHENES, Grèce<br />
Tél. +30 210 934 3088 - Fax +30 210 935 3847 -training@helmepa.gr<br />
MAI 2006<br />
EXPERT<br />
ETUDE<br />
NATIONALE<br />
EXPERT<br />
ETUDE<br />
REGIONALE<br />
QUESTIONNAI<br />
RE COURT<br />
ATELIER<br />
MONACO,<br />
MARS 2007<br />
REMARQUES<br />
Invitation<br />
déclinée<br />
77
78<br />
ENERGY AND SUSTAINABLE DEVELOPMENT IN THE MEDITERRANEAN<br />
8.3 An n e xe 3 – Progra mme de l’atelier de Mo naco
En partenariat avec<br />
Commission Méditerranéenne de Développement Durable<br />
Atelier régional<br />
Energie et développement durable<br />
en Méditerranée<br />
Avec le soutien financier de<br />
Avec la participation de<br />
Auditorium Rainier III<br />
Monaco, 29 et 30 mars 2007<br />
Programme final<br />
Italian Ministry<br />
for the<br />
Environment<br />
Land and Sea<br />
Institut de la<br />
Méditerranée /<br />
FEMISE
Objectifs de l’atelier-contexte-mandat-partenariat<br />
Objectifs de l’atelier<br />
L’atelier a pour objectif d’examiner, conformément aux objectifs du chapitre « énergie » de la Stratégie<br />
Méditerranéenne de Développement Durable, la situation de la région en matière de promotion de<br />
l’utilisation rationnelle de l’énergie (URE) et des énergies renouvelables (ENR). Il permettra aux participants<br />
d’examiner les enjeux économiques qui y sont liés, de commenter les expériences engagées<br />
dans quelques pays méditerranéens et d’adresser des recommandations à la Commission Méditerranéenne<br />
de Développement Durable et aux décideurs.<br />
Contexte<br />
Après avoir mis en place en 1996 une Commission Méditerranéenne du Développement Durable<br />
(CMDD), les Parties Contractantes à la Convention de Barcelone (les 21 pays riverains et la Communauté<br />
Européenne) ont adopté en novembre 2005 une « Stratégie Méditerranéenne pour le Développement<br />
Durable » (SMDD). Le 2ème thème prioritaire de la Stratégie est « la gestion plus rationnelle de<br />
l’énergie, l’utilisation accrue des sources d’énergies renouvelables et l’adaptation, en les atténuant, aux<br />
effets du changement climatique”. Pour ce domaine, les objectifs principaux annoncés par la SMDD<br />
sont :<br />
v<br />
v<br />
v<br />
v<br />
v<br />
Promouvoir l’utilisation rationnelle de l’énergie (URE)<br />
Valoriser le potentiel d’énergies renouvelables (ER)<br />
Contrôler, stabiliser ou réduire, selon les cas, les émissions de gaz à effet de serre<br />
Inscrire les mesures d’adaptation au changement climatique parmi les objectifs majeurs des<br />
plans nationaux de développement<br />
Accroître l’accès à l’électricité dans les zones rurales concernées<br />
La SMDD est une « stratégie cadre ». Elle peut inspirer l’élaboration des stratégies nationales (SNDD)<br />
en cours d’élaboration ou aider à leur actualisation, étant entendu que c’est à chaque pays de se fixer<br />
ses propres objectifs. La SMDD invite aussi à un renforcement de la coopération régionale sur des objectifs<br />
ciblés de développement durable ainsi qu’à un suivi renforcé des progrès et du partage régional<br />
des expériences.<br />
Les travaux engagés au titre de la SMDD sont étroitement articulés avec ceux conduits au plan international,<br />
en particulier avec ceux programmés par la Commission du Développement Durable dont<br />
le cycle 2006-2007 (CDD 14 et CDD 15) traite notamment des thèmes « changements climatiques et<br />
ressources énergétiques aux fins du développement durable ».<br />
Mandat<br />
Le <strong>Plan</strong> Bleu a pour mandat d’effectuer le suivi de la Stratégie Méditerranéenne de Développement<br />
Durable et d’approfondir dès 2006-2007 le domaine prioritaire « énergie - changement climatique ».<br />
Dans ce contexte, les activités réalisées ont permis de documenter un jeu d’indicateurs, d’approfondir<br />
les analyses et repérer des bonnes pratiques.<br />
Partenaires<br />
Les activités ont été effectuées avec les pays volontaires, les instances de l’UE et les partenaires et initiatives<br />
régionales dans le domaine « énergie - changement climatique ».<br />
L’activité, coordonnée et animée par le <strong>Plan</strong> Bleu, a été conduite en partenariat étroit avec les réseaux et<br />
institutions méditerranéens spécialisés sur l’énergie : l’OME, MEDENER, l’ADEME, le programme<br />
MEDREP. L’institut de la Méditerranée/FEMISE et le CAR/PP de Barcelone ont aussi contribué à<br />
l’activité. L’ONG HELIO International a également participé aux travaux et des synergies ont été<br />
trouvées avec l’UMET. Ces partenaires ont formé ensemble un comité technique de pilotage pour les<br />
activités.<br />
L’ADEME et le Ministère italien pour l’environnement, les territoires et la mer ont participé financièrement<br />
aux activités. La Principauté de Monaco accueille et finance en partie cet atelier.
08h15-8h45 Accueil des participants<br />
JOUR 1 - 29 MARS 2007<br />
08h45-9h15 Ouverture – Bienvenue<br />
Discours de bienvenue par M. Patrick VAN KLAVEREN, Délégué à l’Environnement International et<br />
Méditerranéen, Principauté de Monaco<br />
M. Henri Luc THIBAULT, Directeur du <strong>Plan</strong> Bleu<br />
Session 1 Cadrage régional : situation énergétique<br />
Président : M. Henri-Luc THIBAULT, Directeur du <strong>Plan</strong> Bleu<br />
09h15-10h45 Objectif: rappeler les activités du <strong>Plan</strong> Bleu dans le domaine, les tendances récentes de la région, les<br />
progrès vers les objectifs de la SMDD et la situation énergie/environnement au niveau européen<br />
v Contexte énergétique et développement durable en Méditerranée, prospective (rapport <strong>Plan</strong><br />
Bleu), SMDD et indicateurs prioritaires, Stéphane QUEFELEC, <strong>Plan</strong> Bleu, 15 min<br />
v Tendances énergétiques en Méditerranée et évolutions depuis 2000, M. Habib ELANDALOUSSI,<br />
Observatoire Méditerranéen de l’Energie – 15 min<br />
v Energie et Environnement dans l’Union européenne, Ronan UHEL, Agence européenne de l’environnement,<br />
présentation du rapport 2006 « Energy and Environment in the European Union » - 15 min<br />
v Discussion/questions : 45 min<br />
10h45-11h00 Pause café<br />
Session 2 Cadrage régional : questions économiques<br />
Président : Stéphane POUFFARY, ADEME, chef de la Cellule Expertise Internationale pour la Maîtrise de<br />
l’Energie, Direction des Energies Renouvelables, des Réseaux et des Marchés Energétiques<br />
11h00-13h00 Objectif : appréhender les questions économiques et financières régionales liées au développement<br />
des énergies renouvelables et des actions d’utilisation rationnelle de l’énergie, et les effets d’entraînement<br />
qui peuvent être liés.<br />
v<br />
v<br />
v<br />
v<br />
13h00-14h30 Déjeuner<br />
Approche économique : étude régionale, Institut de la Méditerranée/Femise/Frédéric BLANC, 15<br />
min<br />
Etat d’avancement des mécanismes projets, évolution des marchés du carbone et implications sur<br />
la zone Méditerranée, Christian de PERTHUIS/Caisse des Dépôts, 15 min<br />
Aide au développement et ER / URE : étude régionale – <strong>Plan</strong> Bleu/Samir ALLAL, 15 min<br />
Retombées économiques et effets d’entraînements liés au développement des énergies renouvelables,<br />
UNEP/DTIE, Myriem TOUHAMI, 15 min<br />
Discussion/questions : 60 min<br />
v<br />
Rapporteurs : Anne GED et Francesco PRESICCE<br />
Annonce du programme de l’après-midi<br />
14h45-15h00 Transfert «salon» EVER 2007- Sur invitation<br />
15h00-16h30 Séance inaugurale «salon» EVER 2007 sur les énergies renouvelables<br />
Participation à la séance inaugurale en présence du Prince Albert II<br />
16h30–17h30 Visite libre de l’exposition EVER 2007<br />
17h30–18h00 Transfert vers Auditorium Rainier III<br />
18h00-19h00 Projection de « Une vérité qui dérange », film réalisé par Davis Guggenheim (Al Gore y tient le premier rôle)<br />
19h15 Cocktail offert par la Principauté de Monaco dans l’Atrium du Centre Rainier III<br />
Soirée libre
JOUR 2 - 30 MARS 2007<br />
Session 3 Tours de table<br />
Président : M. Roberto VIGOTTI, Président du Comité OME « Energies Renouvelables et<br />
Développement Durable »<br />
Objectif : Le Président de séance fera circuler la parole en posant à chacun des experts une ou<br />
plusieurs questions relatives à la situation de leur pays. Il leur sera demandé de faire le point sur les<br />
avancées des pays en matière de politique d’ER et d’URE, d’identifier les blocages, les meilleurs<br />
leviers, les meilleures pratiques et les propositions pour un développement énergétique plus durable.<br />
08h30–10h30 Table ronde 1 - Expériences dans les pays du Sud et de l’Est de la Méditerranée<br />
v<br />
v<br />
v<br />
10h30–10h45 Pause café<br />
Maroc, M. Mohamed BERDAI v Tunisie, M. Samir AMOUS<br />
Libye, M. Mohamed Ali EKLHAT v Egypte, M. Rafik Youssef GEORGY<br />
Discussion / débat / questions : 45 minutes<br />
10h45–12h45 Table ronde 2 - Expériences dans les pays des Balkans, Israël et rive Nord<br />
v<br />
v<br />
v<br />
v<br />
Bosnie-Herzégovine, Mme Semra FEJZIBEGOVIC v Israël, M. Amit MOR<br />
Chypre, M. Costas PAPASTAVROS v Italie, M. Mario LIONETTI<br />
Espagne, Mme Virginia ALZINA v Malte, M. George CASSAR<br />
Discussion/questions : 30 minutes<br />
Rapporteurs : Houda BEN JANNET-ALLAL et Rabea FERROUKHI<br />
12h45-13h45 Déjeuner - buffet à l’Auditorium<br />
Session 4 Point de vue de la société civile et des institutions internationales<br />
Présidence : M. Benaïssa AYADI, Directeur Général ANME-Tunisie.<br />
Objectif : prendre en compte les opinions de la société civile et des institutions internationales. Le Président<br />
de séance demandera aux participants de faire 2 propositions/messages pour le développement<br />
des politiques d’énergies renouvelables et 2 propositions/messages en faveur des politiques d’utilisation<br />
rationnelle de l’énergie qu’ils jugent prioritaires.<br />
13h45-15h45 Introduction au débat<br />
15h45-16h00 Pause café<br />
v Synthèse sur les messages clefs et les recommandations des rapports nationaux, Houda BEN JAN-<br />
NET-ALLAL /OME, Rabéa FERROUKHI OME, 10 min<br />
Présentations<br />
v<br />
v<br />
v<br />
v<br />
v<br />
Les recommandations de l’Agence Internationale de l’Energie, M. Roberto VIGOTTI, 15 min<br />
Regard de la société civile, ONG HELIO International, Hélène CONNOR, 15 min<br />
Regard des bailleurs de fonds, Agence Française de Développement, M. Alexis BONNEL, 15 min<br />
Nécessité d’un benchmarking international sur l’efficacité énergétique, ADEME, Didier BOSSE-<br />
BOEUF, Expert économiste, 15 min<br />
Débat et questions, 50 min<br />
La parole sera donnée à l’ensemble des participants pour compléter la synthèse proposée, les propositions<br />
et les messages clefs à retenir et transmettre.<br />
Session 5 Principaux messages et recommandations pour la CMDD<br />
Président de séance : M. Henri Luc THIBAULT, Directeur du <strong>Plan</strong> Bleu<br />
16h00-16h45 Synthèse des messages et recommandations générales – <strong>Plan</strong> Bleu - 15 min<br />
Discussion – 30 min<br />
Adoption des recommandations générales et conclusions du Président<br />
16h45-17h00 Clôture de l’atelier et remerciements<br />
M. Patrick VAN KLAVEREN, Délégué à l’Environnement International et Méditerranéen, Principauté de<br />
Monaco<br />
M. Lucien CHABASON, Président du <strong>Plan</strong> Bleu
Rapport de synthèse<br />
8.4 An n e xe 4 – Chapi t re « Ene rgie et c hange ment clima ti que »<br />
d e la SMDD<br />
Promouvoir les politiques d'économie d'énergie et les énergies renouvelables et plus<br />
propres<br />
9) Fixer dans les stratégies nationales et locales de développement durable, des objectifs<br />
globaux et par secteurs d’activités visant à promouvoir l’utilisation rationnelle de l’énergie<br />
et les énergies renouvelables. Un objectif souhaitable d'ici 2015 serait une réduction de<br />
l’ordre de 1 à 2% par an de l’intensité énergétique par unité de PIB. Un objectif<br />
souhaitable pour les énergies renouvelables serait d’atteindre 7% de la demande totale<br />
en énergie d’ici 2015, énergies renouvelables et déchets (CWR) non inclus.<br />
10) Inciter les acteurs économiques, les autorités locales et les consommateurs à adopter<br />
des comportements durables en matière d’économie d’énergie, grâce à une politique<br />
des prix, à des subventions ciblées, à des incitations fiscales et à des campagnes de<br />
sensibilisation du public soutenues par les ONG. Encourager les mécanismes<br />
économiques tels que les certificats d’énergies renouvelables et les réglementations<br />
visant à promouvoir les énergies renouvelables.<br />
Renforcer la coopération régionale et soutenir la mise en oeuvre de la Convention<br />
cadre sur le changement climatique et de son Protocole de Kyoto<br />
11) Inviter les pays méditerranéens à coopérer dans la mise en oeuvre de la Convention<br />
cadre des Nations Unies sur le changement climatique et des mécanismes de flexibilité<br />
du Protocole de Kyoto, à se préparer à la phase post 2012 et à orienter vers la région<br />
les investissements visant la réduction des émissions des gaz à effet de serre.<br />
12) Développer des synergies avec le Programme méditerranéen pour les énergies<br />
renouvelables (MEDREP), la plate-forme de Rome sur l’Energie Méditerranéenne<br />
(REMEP) et la politique énergétique euro-méditerranéenne.<br />
S'adapter au changement climatique<br />
13) Généraliser la prise en compte du concept d’adaptation au changement climatique dans<br />
les politiques nationales. Élaborer des plans pour anticiper et prévenir les risques dans<br />
les zones méditerranéennes les plus exposées, notamment les îles, les deltas et zones<br />
agricoles sèches.<br />
Accès à l'électricité<br />
14) Soutenir les projets et les investissements en matière d'accès à l'électricité. Un objectif<br />
souhaitable serait de réduire de moitié, d'ici 2015 (comparé à 1990), la part des<br />
populations des pays en développement n'y ayant pas accès.<br />
En outre, la SMDD dans sa troisième partie invite à la mise en œuvre avec les partenaires et<br />
à suivre les progrès :<br />
Mettre en œuvre la Stratégie : coopération (renforcement de la solidarité et des<br />
engagements respectifs des partenaires euro-med), capital humain, financement, stratégies<br />
nationales de développement durable et stratégies sectorielles dans les domaines<br />
prioritaires<br />
Organiser le suivi des progrès :<br />
Importance du rôle du PAM/CMDD, cadre pertinent (méditerranéen) pour le suivi des<br />
progrès<br />
Renforcer le réseau d’observatoires, mesurer les progrès réalisés : évaluations axées sur<br />
les politiques : indicateurs, analyses de bonnes pratiques, autres informations ciblées<br />
Partage régional d’expériences<br />
Des indicateurs de suivi :<br />
5 des 34 Indicateurs prioritaires pour le suivi de la SMDD concernent l’énergie<br />
10 à 15 indicateurs complémentaires à proposer pour un suivi plus précis des progrès dans<br />
chacun des différents domaines prioritaires<br />
79
80<br />
ENERGY AND SUSTAINABLE DEVELOPMENT IN THE MEDITERRANEAN<br />
8.5 An n e xe 5 - Compte rendu résum é de l’atelier sous régi o nal<br />
« Le MDP da ns les pa ys Sud médite rra néens, forces et<br />
f aiblesses, dé fis et pe rspe ctives - liens avec les pr o je ts d’EE<br />
& d’ER », At e lier or ga nisé pa r le <strong>Plan</strong> Bl eu et l’UMET sous<br />
l ’égide de la Com mission Mé di terra néenne de Déve l o ppe me nt<br />
D u rable, avec le souti en de : l’ AD E ME , du CE A, de l’OME et de<br />
l ’IMET, 5 mai 2006, 9, Ave n u e Malesherbes, Paris 75008<br />
( S yn a g ir) – France, 9h00 – 19h0 0<br />
INTRODUCTION<br />
Dans le cadre du mandat 2006-2007 du <strong>Plan</strong> Bleu de suivi du chapitre « Energie/Changement climatique » de la Stratégie<br />
Méditerranéenne de Développement Durable 10 (SMDD) et des activités de réflexion de l’UMET, le <strong>Plan</strong> Bleu et l’UMET ont<br />
organisé en partenariat, sous l’égide de la Commission Méditerranéenne de Développement Durable, le 5 mai 2006 à Paris, un<br />
atelier régional sur le Mécanisme pour le Développement Propre (MDP) dans les pays sud méditerranéens.<br />
Ce résumé 11 synthétise les principales observations et réflexions développées par les participants à l’atelier. Il a été préparé par<br />
les membres du Comité technique de pilotage des activités « Energie/Changement climatique » du <strong>Plan</strong> Bleu présents lors de<br />
l’atelier 12 sur la base du minute détaillé de l’atelier.<br />
La complexité du sujet, l’opacité des procédures et du langage, le retard relatif enregistré dans ce domaine par les pays sud<br />
méditerranéens en comparaison à d’autres pays et régions du monde et le besoin d’échange d’expériences au niveau régional<br />
sont les principales raisons de la programmation de cette journée de travail.<br />
L’atelier a réuni une trentaine d’experts et de spécialistes de la question et a vu la participation de plusieurs institutions :<br />
ADEME (Agence de l’Environnement et de la Maîtrise de l’Energie – France), CEA (Commissariat à l’Energie Atomique –<br />
France), OME (Observatoire Méditerranéen de l’Energie), IMET (Ministère de l’Environnement italien), IEPF (Institut de<br />
l’Energie et de l’Environnement de la Francophonie), CDER (Centre de Développement des Energies Renouvelables - Maroc),<br />
ANME (Agence Nationale de Maîtrise de l’Energie - Tunisie), CIEDE (Cellule d’Information sur l’Energie Durable et<br />
l’Environnement – Tunisie), CDC (Caisse des Dépôts et Consignations - France), OECC (Bureau espagnol du changement<br />
climatique - Ministère de l’Environnement Espagnol), ICF ( Italian Carbon Fund - Ministère de l’environnement italien), Bureau<br />
de la coopération internationale de la Principauté de Monaco, AFD (Agence Française de développement - France), PNUE-<br />
DTIE (Programme des Nations Unies pour l’environnement – Division Technologie, Industrie et Economie), Banque Mondiale,<br />
MIES (Mission Interministérielle pour l’Effet de Serre - France) et CAR/PP (Centre d’Activités Régionales Production Propre du<br />
<strong>Plan</strong> d’<strong>Action</strong> pour la Méditerranée – Barcelone).<br />
RESUME<br />
L’objectif de cet atelier était de faire le point sur la situation du MDP dans la région, de mutualiser les expériences,<br />
d’appréhender avec les acteurs et spécialistes concernés les questions de mise en oeuvre opérationnelle de projets<br />
(notamment EnR et URE) dans le cadre du MDP et de tirer des enseignements afin que la région puisse bénéficier au mieux de<br />
ce mécanisme. Cette synthèse reprend les principales idées discutées lors de cet atelier :<br />
15) Le MDP a été inclus dans le protocole de Kyoto dans le but d’aider les Parties visées à l’Annexe I à atteindre leurs<br />
engagements tout en favorisant le développement durable des Parties non-Annexe I. Il est fondé sur l’investissement<br />
privé dans la réalisation de projets permettant de réduire les émissions de gaz à effet de serre (GES) dans les Pays en<br />
Développement (PED). Pour ceux-ci, un des intérêts du MDP est de faire prendre en charge les CER (Certified Emission<br />
Reductions) par les pays de l’Annexe I.<br />
16) L’observation des tendances actuelles sur le MDP montre que d’une façon générale les investisseurs, comme pour tout<br />
type d’investissement, sont attirés par des retours sur investissement les plus élevés possibles et donc par des prix<br />
compétitifs, un faible risque financier et un minimum de barrières commerciales. Ainsi, une compétition est en train de se<br />
développer entre les Etats pour accueillir ces projets. Les acheteurs ont tendance à investir là où les risques sont faibles<br />
et les possibilités de profits sont fortes, souvent dans les quelques pays où l’investissement direct étranger privé se<br />
concentre déjà. En conséquence, les projets MDP s’orientent massivement vers un nombre restreint de pays,<br />
principalement l’Inde, le Brésil et la Chine. L’Afrique et dans une moindre mesure, la Méditerranée en bénéficient<br />
beaucoup moins. Actuellement, 172 projets sont enregistrés. On note cependant une nette accélération depuis la<br />
Conférence de Montréal (63 projets). En mai 2006, 744 nouveaux projets étaient en cours d’évaluation (représentant 341<br />
Mt CO2 évitées).<br />
17) Le principal acquis de Montréal concerne la mise en place d’outils de gestion technique du MDP avec un budget plus<br />
important alloué pour l’instruction des dossiers et le recrutement d’un certain nombre de collaborateurs. Les contraintes<br />
associées aux lenteurs du traitement des dossiers sont en passe d’être dépassées. Le problème réside désormais du<br />
10 Pour ce faire, le <strong>Plan</strong> Bleu s’est rapproché de différents organismes, notamment l’UMET, l’OME et MEDENER (représentée par l’ADEME et l’ANME), l’Institut de la<br />
Méditerranée/Femise, MEDREP et Hellio international. L’ADEME soutient financièrement les activités du <strong>Plan</strong> Bleu dans ce domaine. Le programme d’activités est<br />
disponible sur le site internet du <strong>Plan</strong> Bleu : http://www.planbleu.org/themes/energie_progr_travail2006_07.html. Le texte intégral de la Stratégie Méditerranéenne pour le<br />
Développement Durable est disponible à l’adresse suivante : http://www.planbleu.org/publications/smdd.pdf .<br />
11 Les informations et propos exposés ne reflètent en aucun cas le point de vue officiel des pays riverains de la méditerranée ou de la Commission européenne.<br />
12 Par ordre alphabétique : Samir ALLAL : Consultant <strong>Plan</strong> Bleu, Maître de conférence à l’Université de Versailles (C3ED/IRD) samir.allal@wanadoo.fr. Houda BEN<br />
JANNET-ALLAL, Responsable scientifique Energies Renouvelables et Développement Durable, OME (Observatoire Méditerranéen de l'Energie), allal@ome.org . Anne<br />
GED : UMET, Maître de conférence associé à l’Université Paul Cézanne, Institut de Management Public a.ged@synagir.com. Stéphane QUEFELEC : <strong>Plan</strong> Bleu,<br />
économiste - chargé des activités « énergie/changement climatique », squefelec@planbleu.com. Stéphane POUFFARY : ADEME – Chef Cellule Expertise Internationale<br />
Maîtrise de l’Energie – Direction des Energies Renouvelables, des Réseaux et des Marchés Energétiques – ADEME stephane.pouffary@ademe.fr.
Rapport de synthèse<br />
côté de l’offre de projets de bonne qualité. L’organisme de référence «point carbon » a repéré un portefeuille de 3000<br />
projets JI (Joint Implementation) et MDP, dont 2700 en phase de constitution. Mais en termes de tonnes de CO2 évitées,<br />
les volumes sont encore marginaux : de l’ordre de 5 millions de tonnes par an. Soit 340 millions de tonnes d’ici 2012. Mais<br />
ces montants devraient augmenter au fur et à mesure que l’offre de projets s’organise.<br />
18) L’analyse de la structure des marchés montre une différence selon que l’on considère le nombre de projets ou leur<br />
équivalent CO2. En effet, un petit nombre de projets permet d’éviter l’émission d’un volume important de tonnes de CO2.<br />
On note des similitudes avec le marché du SO2, qui fonctionne aux Etats-Unis depuis plusieurs années où un nombre<br />
limité de projets représente un volume très important de CER. Le marché est finalement peu dépendant du nombre de<br />
projets, mais dépend du volume de CER par projet. Ceci étant, une fois les plus gros projets réalisés, le marché devrait se<br />
porter naturellement vers des projets de plus faible taille unitaire.<br />
19) L’examen de la répartition géographique du MDP montre que l’Inde et la Chine comptabilisent la moitié des<br />
projets. Quatre pays – l’Inde, la Corée du sud, la Chine et le Brésil – représentent 90% des CER (dont 1/3 pour la Chine)<br />
concentrés sur deux gaz à effet de serre (N2O et HFC) qui représentent plus des ¾ des volumes abattus. Sept projets<br />
sont actuellement en cours : 2 en Corée du Sud, 2 au Brésil, 2 en Chine, 1 en Inde. En ce qui concerne la Méditerranée :<br />
3 projets MDP sont enregistrés au Maroc (2 pour l’énergie éolienne et 1 pour le solaire) avec 223 000 CER/an en<br />
moyenne et 1 371 000 CER attendus d’ici 2012. Quatre projets MDP sont au stade de validation (1 au Maroc, 2 en<br />
Tunisie et 1 en Égypte).<br />
20) A l’heure actuelle, l’analyse de la nature des projets MDP, indique que, pour l’essentiel, ils ne concernent ni l’utilisation<br />
rationnelle de l’énergie, ni les énergies renouvelables mais le gaz industriel. Les décharges et l’agriculture représentent<br />
également une part importante. Le faible coût de la tonne de carbone est en cause. Ainsi, les projets consacrés aux<br />
énergies renouvelables ne se développeront que si le prix de la tonne de carbone augmente. Les projets « énergies<br />
renouvelables » présentent également une difficulté qui tient à leur plus petite taille et pour lesquels les coûts de<br />
transaction sont relativement plus élevés que pour des gros projets. Une réponse à cela a été discutée entre les<br />
participants. Elle doit être recherchée dans le regroupement de petits projets.<br />
21) Les évolutions du prix de la tonne de CO² constituent également un facteur d’incertitude, accentué dans les dernières<br />
semaines par les mouvements sur le marché européen. Le prix de la tonne de CO2 y a récemment connu de fortes<br />
secousses. Fin avril, plusieurs pays, dont la France et l’Espagne ont annoncé les quantités de CO2 émises l’année<br />
précédente. Elles ont été plus faibles qu’anticipées. Il en ressort qu’il existe un surplus de quotas sur le marché d’où une<br />
chute du prix (prix divisé par 3 en 5 jours de marché entre fin avril et début mai 2006). L’architecture du marché européen<br />
qui offre une vision à court terme (3 ans) est ainsi remise en cause. La vision dans laquelle la demande MDP avait été<br />
construite reposait sur une liaison entre le prix du CER MDP/JI et le prix du CO2 en Europe. En effet, l’Europe semblait<br />
être à l’horizon 2012 le marché le plus important en terme d’achat et le plus rémunérateur aussi. Certains contrats ont<br />
ainsi dépassé 15 euros la tonne. Les évènements récents ont montré que finalement, il y aura moins besoin de CER<br />
qu’anticipés pour les industriels européens d’ici 2008. Le marché se trouve donc remis en cause et le correctif qui a eu<br />
lieu ces derniers jours modifie les conditions dans lesquelles les projets MDP vont se développer.<br />
22) Au niveau du marché mondial et depuis la conférence de Montréal, on assiste à des changements importants de natures<br />
très diverses dans le jeu des acheteurs. Le Japon est devenu un gros acheteur, sans que l’on sache très bien si c’est<br />
l’Etat ou les industriels qui achètent. Au Canada, le changement de gouvernement ne va pas dans le sens du<br />
renforcement du système institutionnel de Kyoto et risque de faire reculer la position canadienne dans l’application du<br />
protocole. En revanche, les choses vont de l’avant aux Etats-Unis. De nombreux projets locaux voient le jour (par<br />
exemple, Climate Exchange). Les industriels anticipent la contrainte carbone, y compris en achetant des CER. La vraie<br />
échéance reste 2008 avec la prochaine élection présidentielle.<br />
23) Dans ce nouveau contexte, les participants ont souligné l’importance d’avoir une mutualisation régionale des capacités<br />
d’élaboration de projets. Par exemple, l’Inde a ainsi mis en place une task force spécifique pour « produire du projet ».<br />
Mais en Afrique et dans les pays méditerranéens, chaque projet MDP s’élabore au cas par cas, sans capitalisation des<br />
expériences. Il semble aussi que les porteurs de projets ne sont pas suffisamment au courant des processus de<br />
négociation et des difficultés pratiques à surmonter pour réaliser de tels projets dans des conditions optimales. Certes les<br />
choses ont évolué : La Tunisie a récemment créée une Task force spécifique pour identifier des projets MDP ; dans<br />
plusieurs pays méditerranéens du Sud, des AND sont en place ou en cours de création (Tunisie, Maroc, Algérie…) ; le<br />
Maroc a déposé plusieurs projets et a regroupé des petits projets. Mais le processus d’apprentissage dure néanmoins<br />
plusieurs années et il n’est pas encore abouti.<br />
24) Dans le futur, le MDP est amené à jouer un rôle de plus en plus important et les années de négociation à venir doivent<br />
être utilisées pour structurer les équipes et maîtriser les filières à partir desquelles des projets peuvent se construire.<br />
Dans cette période, il faut veiller à ce que toutes les difficultés auxquelles se heurtent les pays en développement pour<br />
lancer des projets ne conduisent pas à un échec complet et à un refus de faire. Les pays méditerranéens ont ainsi pris<br />
conscience que sans processus d’apprentissage, ils courent le risque d’être exclus du marché MDP. La question du CO²<br />
est dans tous les cas de plus en plus présente dans les projets de développement et les projets qui ne le prennent pas en<br />
compte risquent d’être exclus de l’APD. D’autres questions ne sont pas encore résolues pour développer les projets<br />
MDP : la définition de l’additionalité qui pose encore problème, une trop grande technocratisation des processus qui<br />
81
82<br />
ENERGY AND SUSTAINABLE DEVELOPMENT IN THE MEDITERRANEAN<br />
aboutit à une exclusion, se traduisant par une réelle coupure avec la société civile, enfin, la tentation de la part des<br />
industriels de chasser les gros projets peu coûteux.<br />
25) Même si, du point de vue des pays en développement, le MDP est aujourd’hui décevant quant au nombre de projets qui<br />
émergent l’enjeu est maintenant la préparation du post-Kyoto. Une réunion se tiendra en septembre à Paris. Les<br />
discussions porteront essentiellement sur ce que pourrait être une bonne négociation du post Kyoto pour les pays en<br />
développement et, en particulier, pour l’Afrique et la région méditerranéenne. La question de la discrimination positive<br />
pour les petits projets a été posée. Egalement, et pour la négociation du post Kyoto, la possibilité pour les pays en<br />
développement d’avoir des engagements de limitation d’émissions de GES sans contraintes et sans risque de perte sera<br />
discutée. Des objectifs chiffrés seraient proposés à ces pays. En cas de non respect, il n’y aurait pas de pénalités. En<br />
revanche, les pays qui feraient mieux que leurs engagements pourraient vendre leur surplus de performance.<br />
26) Une des difficultés dans la mise en œuvre tient à la différence d’approche entre pays du Nord et du Sud, sur la question<br />
du MDP: pour les pays du Nord le MDP répond à une question environnementale ; pour ceux du Sud, le MDP doit<br />
répondre à des besoins de développement. Logique de développement, logique environnementale, autant de logiques<br />
qui, parfois, sont contradictoires. De plus, dans les pays du sud, les projets MDP sont généralement instruits ou gérés par<br />
des spécialistes de l’environnement et non du développement. D’où les difficultés de mise en œuvre des projets MDP et<br />
de compréhension entre les différents acteurs intervenants dans les projets.<br />
27) Le MDP ne se substitue pas aux politiques publiques des pays. Le MDP y participe et doit s’y développer en<br />
cohérence. Au sein des PED, le personnel, isolé dans les ministères de l’environnement, a souvent du mal à mobiliser le<br />
secteur privé industriel et financier ; le décloisonnement est difficile à faire. Il faudrait plutôt rechercher l’identification de<br />
quelques secteurs prioritaires par les pays et réunir les acteurs concernés autour d’une table pour travailler au<br />
développement de projets en cohérence. Pour faciliter cela, l’aide publique au développement devrait être concentrée sur<br />
la capacité de mise en œuvre et non sur les projets eux-mêmes.<br />
28) Le financement MDP doit trouver sa place par rapport à l’Aide Publique au développement. L’ADP doit être<br />
considérée comme un démarreur, qui n’est utile que si des investissements privés suivent. Quelque 90% des 110<br />
milliards de dollars d’investissement direct à l’étranger (IDE) sont concentrés dans dix pays (non méditerranéens). On<br />
retrouve naturellement la même tendance pour les projets MDP. En revanche, en ce qui concerne les infrastructures,<br />
l’APD est plus orientée vers d’autres pays notamment ceux de la Méditerranée. Même si l’APD est faible par rapport à<br />
l’IDE, elle reste une source très importante de financement des infrastructures. Lorsque le financement de ces<br />
infrastructures fait appel au partenariat public-privé, comme dans le secteur de l’eau, le MPD devrait pouvoir y trouver sa<br />
place. Ce n’est pas le cas aujourd’hui. Dans le cas des infrastructures de l’eau, il est facile de faire payer l’eau potable<br />
mais beaucoup plus difficile de financer l’assainissement. Le MDP pourrait trouver sa place dans un tel cas.<br />
29) Plusieurs participants ont plaidé pour l’élaboration de politiques sectorielles et de portefeuilles de projets associés, utiles<br />
pour le développement du pays et qui peuvent être éligibles au MDP, par exemple dans les secteurs du bâtiment et du<br />
transport qui offrent un potentiel important en Méditerranée. La Banque Mondiale promeut ces approches<br />
programmatiques sectorielles. Pour l’instant, les priorités des investissements des pays en développement se concentrent<br />
sur les infrastructures et également sur le bâtiment, mais il n’y a pas de projets MDP sur ces secteurs. La conséquence<br />
est un écart entre les secteurs comportant de grands besoins d’investissements et les secteurs sur lesquels s’orientent<br />
les projets MDP. L’enjeu pour les pays est de préparer des politiques sectorielles afin de réorienter les investissements<br />
MDP vers des secteurs ayant de réels besoins d’investissement pour le développement. Le secteur bancaire des pays du<br />
Sud devrait pouvoir y contribuer sous réserve d'être davantage impliqué.<br />
30) Dans l’analyse des projets existants, les participants ont également souligné le risque important de voir se développer<br />
des projets MDP sans impact en termes de développement durable. Les AND (Autorités Nationales Désignées) ont un<br />
rôle important à jouer sur cette question. Les projets MDP sont également des projets financiers complexes. Au sein des<br />
montages financiers, il faut également se poser la question de la formation de la rente, de sa répartition entre les parties<br />
prenantes et des capacités de négociation des pays. L’idée de discrimination positive reste à explorer.<br />
31) Le facteur clé dans la réussite du MDP est la participation du secteur privé. C’est un mécanisme de marché et, en<br />
tant que tel, il ne peut fonctionner avec un seul acteur. Le fait que le secteur économique local ne se soit pas approprié le<br />
MDP limite son utilisation. En Tunisie, les banques sont peu convaincues par les projets d’efficacité énergétique. La<br />
raison principale est qu’elles ne connaissent pas le secteur. En revanche, si elles s’intéressent et acquièrent des<br />
compétences dans ce domaine, elles deviendront vraisemblablement des partenaires sérieux pour le MDP. Ainsi, l’avenir<br />
réside dans l’appropriation du MDP par des partenaires locaux.<br />
32) Malgré ces constats mitigés sur le MDP, il faut cependant noter que des transitions sont en cours, qu’elles doivent<br />
être accélérées, et accompagnées. La première transition est technologique et devrait permettre, avec l’augmentation de<br />
la taille du marché, de véritables économies d’échelle sur les projets. La seconde est géographique : les investisseurs<br />
s’orientent d’abord vers les grands pays attractifs tels que la Chine, l’Inde et le Brésil, et seulement après vers des pays<br />
tels que le Maroc, la Tunisie, l’Égypte, etc. Les investisseurs sont beaucoup plus réticents envers les pays sub-sahariens.<br />
La troisième est institutionnelle et concentre de nombreuses incertitudes : quelle sera la politique post-Bush ? Celle du<br />
Canada ? etc... Enfin, la quatrième transition concerne les marchés : il faut en effet passer de marchés indépendants les<br />
uns des autres à un marché global intégré.
Rapport de synthèse<br />
33) Pour l’instant, le MDP ne semble pas être une réponse aux besoins de développement que connaissent les pays<br />
méditerranéens. Mais, du fait des transitions en cours, les participants s’accordent à penser que l’attractivité des pays<br />
méditerranéens pour les projets MDP pourrait augmenter. La question qui émerge aujourd’hui est la suivante : pourquoi<br />
n’arrive t-on pas à avoir une politique régionale en matière de MDP alors qu’il existe une vraie logique à travailler à ce<br />
niveau ? Ainsi, la question de la création d’un fond carbone méditerranéen et de ses modalités de fonctionnement et<br />
d’abondement est à nouveau posée? Une mutualisation et un travail en commun peuvent déboucher sur une minimisation<br />
des coûts de transaction, un nombre plus important de projets et une meilleure appropriation du MDP par les pays<br />
concernés. Au niveau de la Région Méditerranéenne, la question du MDP doit également faire le lien avec le débat sur<br />
l’énergie, l’épuisement des ressources non renouvelables, le débat sur le post-Kyoto et les priorités de développement<br />
dans la région. La déclinaison des priorités de développement des pays du Sud et de l’Est de la Méditerranée, les<br />
objectifs de réduction des GES, montrent qu’il existe une très forte synergie entre ces diverses priorités. Le MDP (mais<br />
pas tout seul) peut jouer un rôle et offrir des opportunités d’action à l’ensemble des parties prenantes.<br />
34) Les choses évoluent rapidement et il est nécessaire que les pays méditerranéens potentiellement receveurs de MDP se<br />
préparent (et/ou accentuent leur préparation – voir point 9) dès maintenant pour être présents plus tard, après les<br />
quelques dix ans de maturation nécessaire. Il est ainsi indispensable que les acteurs des différents pays puissent<br />
s’approprier ces projets. construire une démarche sectorielle avec une approche programmatique en grappes, intégrant<br />
des objectifs et des projets qui prennent en compte l’efficacité énergétique et les énergies renouvelables.<br />
35) Parmi les pays méditerranéens de l’Annexe 1, l’Espagne, l’Italie et Monaco sont déjà ou souhaitent être très actifs dans la<br />
réalisation de projets MDP. Ces pays participent ou ont créé des outils financiers (fonds carbones, participation à d'autres<br />
initiatives, ...) et développent des compétences administratives et institutionnelles spécifiques. L’Espagne souhaite<br />
orienter ses investissements MDP en priorité vers l’Amérique Latine et l’Afrique du Nord (elle a signé un MOU avec le<br />
Maroc). Un des secteurs visés en priorité est l’efficacité énergétique. La Méditerranée et les Balkans sont aussi des<br />
régions prioritaires pour l’Italie. La Banque Mondiale est également un acteur important du MDP dans la région MENA.<br />
L’AFD collabore avec la Banque mondiale dans le domaine et a amélioré ainsi sa capacité d’expertise dans le domaine.<br />
Un financement FFEM a récemment permis à l’AFD et à la BM de monter un programme d’aide au montage de projet<br />
MDP en Afrique (qui inclut les pays méditerranéens d’Afrique du Nord) qui devrait démarrer prochainement.<br />
36) Pour conclure : l’atelier a mis en évidence les limites actuelles du MDP comme outil de financement des projets (énergie<br />
renouvelable, efficacité énergétique, projets d’infrastructure et d’équipement sobre en carbone) dans la région<br />
méditerranéenne. Il a souligné la nécessité d’une articulation de l’ensemble des mécanismes de financement susceptible<br />
de contribuer au « développement propre » en Méditerranée, dépassant largement le cadre des mécanisme de marché<br />
que le MDP représente dans sa définition actuelle. Les participants ont insisté sur la nécessité de réfléchir aux rôles<br />
respectifs mais complémentaires de l’Aide Publique au Développement et des financements mobilisables au titre d’autres<br />
conventions internationales concernant l’environnement, dans les banques et institutions financières internationales,<br />
régionales et nationales, avec pour objectif d’aboutir à un système cohérent, transparent et équilibré de financement du<br />
développement propre en Méditerranée.<br />
83
84<br />
ENERGY AND SUSTAINABLE DEVELOPMENT IN THE MEDITERRANEAN<br />
8.6 An n e xe 6 – Liste des indicate urs de sui vi DE L A S M D D<br />
INDICATEURS PRIORITAIRES (ANNEXES A LA SMDD)<br />
- Intensité énergétique (totale et par secteur)<br />
- Part des énergies renouvelables dans le bilan énergétique<br />
- Emissions de gaz à effet de serre<br />
- Montant financé dans le cadre des mécanismes de flexibilité du Protocole de Kyoto par<br />
les pays Méditerranéens de l’annexe 1 au profit des pays méditerranéens de l’annexe 2<br />
INDICATEURS COMPLEMENTAIRES (SELECTIONNES DANS LE CADRE DES<br />
ACTIVITES « ENERGIE » DU PLAN BLEU)<br />
Dépendance énergétique par rapport à l’extérieur<br />
Puissance d’ER installée par habitant<br />
Efficacité de la transformation et de la distribution d’électricité<br />
Nombre d’infrastructures énergétiques sur le littoral<br />
Prix de l’énergie pour le consommateur final par combustible et par secteur<br />
Existence de mesures et politiques incitatives au développement des ER et à l’URE au<br />
niveau national<br />
Villes/régions/provinces ayant menées un audit énergétique et/ou un audit carbone et/ou<br />
dotées d’objectifs en terme d’ER et d’URE<br />
Dépenses dans les ER et l’URE : Part des ER et des programmes d’URE dans les<br />
investissements énergétiques et dans les Dépenses de R&D<br />
Part de l’aide publique au développement dans le secteur -énergétique dédiée aux ER et<br />
à l’URE<br />
Part de la population n’ayant pas accès à l’électrification<br />
Part des dépenses en fioul et électricité dans le budget des ménages<br />
Emplois générés par le développement des énergies renouvelables et l’utilisation<br />
rationnelle de l’énergie<br />
Fréquence des pics d’ozone<br />
Consommation d’énergie par habitant<br />
Les fiches méthodologiques pour chacun des indicateurs sont disponibles sur le site internet<br />
du <strong>Plan</strong> Bleu à : http://www.planbleu.org/themes/energie_progr_travail2006_07.html.
Rapport de synthèse<br />
8.7 An n e xe 7 – Fiches indicate urs re nseignées pour 3<br />
i ndicate urs pr ioritaires<br />
85
Suivi de la Stratégie Méditerranéenne de Développement Durable<br />
Assurer une gestion durable de l’énergie, atténuer les effets du<br />
changement climatique et s'y adapter<br />
Le système énergétique en Méditerranée se<br />
caractérise par : (i) sa vulnérabilité,<br />
notamment aux prix et à<br />
l’approvisionnement ; (ii) l’inégalité des<br />
dotations naturelles, des accès et des<br />
consommations d’énergie entre pays et (iii)<br />
les dommages, parfois irréversibles, causés à<br />
l'environnement et à la santé humaine.<br />
Si les tendances observées depuis 30 ans<br />
perdurent, la demande totale en énergie<br />
primaire commerciale dans l’ensemble du<br />
bassin Méditerranéen pourrait passer, selon<br />
les scénarios de l’OME réalisé pour le <strong>Plan</strong><br />
Bleu, de 945 à 1357 Mtep entre 2005 et<br />
2020.<br />
Ce modèle de développement énergétique<br />
n’apparaît pas être compatible avec les<br />
objectifs de développement durable.<br />
L’enjeu est, aujourd’hui, de répondre aux<br />
besoins énergétiques en forte croissance en<br />
Méditerranée sans aggraver les impacts sur<br />
l’environnement local et global, tout en étant<br />
compétitifs grâce à la maîtrise des<br />
consommations, aux économies d’énergies<br />
et aux énergies renouvelables et ceci dans un<br />
marché méditerranéen de plus en plus libre,<br />
ouvert et concurrentiel et dans un contexte<br />
énergétique international de plus en plus<br />
volatil et incertain.<br />
Les scénarios du <strong>Plan</strong> Bleu répondent à ces<br />
enjeux en montrant la pertinence<br />
environnementale, sociale et économique de<br />
développer à grande échelle les énergies<br />
renouvelables dans la région et d’exploiter<br />
les gisements d’économie d’énergie.<br />
ENE Mis à jour le 02/05/2007<br />
Le suivi des indicateurs de la SMDD établit un<br />
bilan mitigé en ce qui concerne les tendances à<br />
l’intégration des Energies Renouvelables (ER)<br />
dans les mixtes énergétiques, l’évolution de la<br />
maîtrise des consommations et des émissions<br />
de CO2 liées à la combustion d’énergies<br />
fossiles :<br />
L’intensité énergétique progresse très<br />
lentement en Méditerranée ; la tendance<br />
observée ne permettra pas d’atteindre<br />
l’objectif de 1 à 2 % d’amélioration par an.<br />
Cependant, en terme absolu, la région<br />
enregistre une meilleure performance que le<br />
monde dans son ensemble.<br />
La part des ER ne progresse pas. Elles<br />
représentaient 3 % en 2004 (comme en<br />
1995). Une rupture forte de tendance sera<br />
donc nécessaire pour atteindre l’objectif de<br />
7 % en 2015. Néanmoins, en volume la<br />
production d’énergie renouvelable progresse<br />
sensiblement dans les pays de la rive Nord,<br />
comme dans ceux du Sud et Est. Certains<br />
pays Méditerranéens ont développé des<br />
filières d’énergie renouvelable d’une façon<br />
spectaculaire : par exemple, l’éolien en<br />
Espagne, les chauffe-eau solaires à Chypre.<br />
La Méditerranée augmente rapidement ses<br />
émissions de gaz à effet de serre. Selon les<br />
projections de l’OME, les émissions de CO2<br />
liées à l’activité énergétique en Méditerranée,<br />
augmenteront de 32 % d’ici 2020. Avec<br />
+68 % dans les Pays du Sud et de l’est de la<br />
Méditerranée et +19 % dans les Pays du<br />
Nord (PNM), les deux rives arriveront à des<br />
niveaux d’émission comparables en 2020,<br />
alors qu’en 2005, 67 % des émissions étaient<br />
en provenance des PNM.<br />
Demande totale en énergie primaire commerciale en Méditerranée - Rétrospective et scénario (en Mtep)<br />
1400<br />
1200<br />
1000<br />
800<br />
600<br />
400<br />
200<br />
0<br />
12 %<br />
Sud & Est<br />
Nord<br />
28 %<br />
40 %<br />
1971 1980 1990 2000 2010 2020<br />
Source : OME, <strong>Plan</strong> Bleu<br />
La demande totale en énergie primaire commerciale a augmenté<br />
de 44% en 15 ans, et est satisfaite à 83% par les énergies fossiles.<br />
L’amélioration de « la gestion plus rationnelle de l'énergie », l'utilisation accrue des sources<br />
d'énergie renouvelables et l'adaptation, en les atténuant, aux effets du changement climatique<br />
constituent un domaine d’action prioritaire de la Stratégie Méditerranéenne pour le<br />
Développement Durable. Ses objectifs stratégiques et indicateurs de suivi s’attachent à :<br />
Promouvoir l’utilisation rationnelle de l’énergie (Indicateur prioritaire n° 6) ;<br />
Valoriser le potentiel d’énergies renouvelables (Indicateur prioritaire n°7) ;<br />
Contrôler, stabiliser ou réduire les émissions de gaz à effet de serre (Indicateurs prioritaires<br />
n°8 et 9) ;<br />
Favoriser l’adaptation au changement climatique ;<br />
Accroître l’accès à l’électricité dans les zones rurales.<br />
Energie
Suivi de la Stratégie Méditerranéenne de Développement Durable<br />
Progresse t-on dans l'utilisation rationnelle de l'énergie? 6. Intensité énergétique<br />
Une utilisation plus rationnelle de l'énergie<br />
(énergie nécessaire pour produire 1000<br />
dollars de PIB) devrait permettre d’assister à<br />
un découplage entre consommation d’énergie<br />
et développement économique. L’objectif<br />
souhaitable proposé par la SMDD pour<br />
l’ensemble des pays méditerranéens d'ici 2015<br />
est une réduction de 1 à 2% par an de<br />
l’intensité énergétique par unité de PIB.<br />
L’intensité énergétique progresse très<br />
lentement en Méditerranée ; la tendance<br />
observée ne permettra pas d’atteindre<br />
l’objectif de 1 à 2% d’amélioration par an.<br />
Alors qu’un découplage partiel entre<br />
consommation d’énergie et développement<br />
économique est incontestable au niveau<br />
mondial et européen (avec une croissance de<br />
la consommation d’énergie environ inférieure<br />
à la moitié de celle du PIB en 10 ans), ce n’est<br />
pas le cas en Méditerranée. En effet, la<br />
croissance de la consommation d’énergie y<br />
est juste inférieure à celle du PIB et quasi<br />
identique dans les PSEM.<br />
La réduction entre 1992 et 2003 du taux de<br />
croissance de l’intensité énergétique des pays<br />
méditerranéens (0,3 % par an) se situe en<br />
dessous de l’objectif de 1%. Seuls la Tunisie,<br />
l’Albanie, Malte et la Bosnie Herzégovine<br />
(depuis 1994) y parviennent quand d’autres<br />
pays comme la Grèce et la Syrie s’en<br />
approchent. L’intensité de l’ensemble des<br />
pays méditerranéens se situe en 2003 au<br />
niveau moyen européen (153 kep/1000<br />
dollars pour l’UE-15) et en dessous du niveau<br />
mondial (212). Mais les disparités entre pays<br />
restent importantes, même entre certains pays<br />
à niveau de revenu équivalent. Ainsi<br />
l’intensité énergétique en Syrie et au Liban est<br />
encore de 300 tandis qu’elle est inférieure à<br />
125 au Maroc et en Tunisie.<br />
Indicateur ENE_P01 Mis à jour le 02/05/2007<br />
Parmi les pays méditerranéens européens,<br />
l’Italie présente la meilleure performance alors<br />
que la France, malgré des gains importants, se<br />
situe au-dessus du niveau européen.<br />
Dans les pays à très forte consommation (rive<br />
Nord), les gains en intensité énergétique, s’ils<br />
sont suffisants, pourraient aussi se traduire par<br />
un ralentissement de la croissance de la<br />
consommation d’énergie par habitant. (ou<br />
même une baisse) Cependant entre 1992 et<br />
2003, les consommations par tête n’ont pas<br />
cessé de croître. Elles sont encore très<br />
importantes dans les pays méditerranéens<br />
européens (3500 kep/hab) et même 4500<br />
kep/hab en France (mais avec un taux de<br />
croissance inférieur à 1% par an).<br />
Les consommations d’énergie par tête dans les<br />
pays du sud sont inférieures à 1000 kep/hab<br />
(Moyenne mondiale 1700 kep/hab) mais les<br />
taux de croissance sont très différents selon les<br />
pays (quasi nuls en Syrie, environ 2 % en<br />
Egypte et au Maroc).<br />
Définition<br />
Intensité énergétique, totale et par secteur est<br />
le ratio de la consommation finale d’énergie<br />
commerciale par unité de PIB par an. Elle peut<br />
être désagrégée par secteur : agriculture,<br />
industrie, services, transport et ménages<br />
(résidentiel).<br />
Précautions / Notes<br />
Les valeurs spécialement fortes de l’intensité<br />
énergétique doivent être interprétées avec<br />
précautions pour les pays en crise économique<br />
(avec des faibles valeurs de PIB).<br />
kep : kilo équivalent pétrole<br />
Sources / Références<br />
Banque Mondiale, World Development<br />
Indicators 2006<br />
400<br />
350<br />
300<br />
250<br />
200<br />
150<br />
10 0<br />
50<br />
0<br />
Intensité énergétique 1980 – 2003 (kep/1000 dollars PPA 2000)<br />
19 8 0 19 9 0 2000 2003<br />
M A IT TN M T GR IL ES AL CY TR FR DZ HR BA SI EG SY LB<br />
Intensité énergétique et consommation d’énergie par Habitant en 2003<br />
Monde<br />
UE-15<br />
Energie<br />
Source : WDI<br />
Source : WDI
Suivi de la Stratégie Méditerranéenne de Développement Durable<br />
La part des énergies renouvelables progresse t-elle ? 7. Part des énergies renouvelables dans le bilan énergétique<br />
L’objectif affiché dans la SMDD est de<br />
valoriser le potentiel d’énergie renouvelable<br />
(ER) pour atteindre 7% (hors biomasse) de la<br />
demande énergétique en 2015.<br />
La part des ER ne progresse pas dans les<br />
bilans d’énergie primaire commerciale;<br />
une rupture forte de tendance sera donc<br />
nécessaire pour atteindre l’objectif de 7 %<br />
en 2015.<br />
Néanmoins, en volume, la production<br />
d’énergie renouvelable progresse<br />
sensiblement. Les ERs représentent environ<br />
3,2 % des approvisionnements totaux en<br />
énergie primaire des pays méditerranéens<br />
(chiffre identique en 2000).<br />
Au niveau mondial, les énergies renouvelables<br />
(hors biomasse) représentent un peu plus de<br />
3 % (6 % biomasse incluse).<br />
Avec la biomasse, souvent non<br />
commercialisée, la part des ERs est proche de<br />
7 % du bilan total énergétique, ce qui illustre<br />
l’importance de ce type d’énergie. La<br />
répartition des ER concerne en Méditerranée<br />
pour prés de 70 % l’hydraulique, 20 % la<br />
géothermie et 10 % le reste (Solaire, éolien et<br />
autres). Dans les PSEM, les pourcentages<br />
respectifs sont 75 %, 11 % et 14 %.<br />
Cependant, en volume, les ERs connaissent<br />
une forte croissance (+2,6 % par an entre<br />
1995 et 2004 en moyenne en Méditerranée)<br />
mais juste supérieure à celles des<br />
approvisionnements totaux en énergie<br />
primaire (ATEP) (2,5 %).<br />
Les ER (hors hydroélectricité et biomasse)<br />
connaissent une très forte progression<br />
(7,8 %) mais ne concernent que 1 % des<br />
ATEP.<br />
Indicateur ENE_P02 Mis à jour le 02/05/2007<br />
L’énergie d’origine hydraulique représente<br />
une part très importante (20 %) de l’énergie<br />
totale en Albanie, ce qui explique la part<br />
importante des ERs dans le bilan énergétique<br />
de ce pays.<br />
Depuis quelques décennies, la part du<br />
charbon se maintient, celle du nucléaire se<br />
stabilise et celle du gaz progresse fortement<br />
aux dépens du pétrole.<br />
Globalement, en 2004, les énergies fossiles<br />
(pétrole, charbon, gaz) dominent<br />
l’approvisionnement énergétique en<br />
Méditerranée : 74,4 % de la consommation au<br />
Nord, 94,5 % au sud et à l’Est. Le reste étant<br />
principalement constitué par l’électricité<br />
nucléaire et hydraulique.<br />
Définition<br />
Cet indicateur mesure la part de la<br />
consommation énergétique totale d’un pays<br />
qui est assurée par les ressources énergétiques<br />
renouvelables (hydraulique, géothermique,<br />
solaire et éolien.)<br />
Précautions / Notes<br />
Cet indicateur inclut uniquement les énergies<br />
renouvelables suivantes : hydraulique, solaire,<br />
géothermie, éolien. Les combustibles<br />
renouvelables (biomasse solide et produits<br />
animaux, gaz et liquides issus de la biomasse,<br />
déchets municipaux et industriels) ne sont pas<br />
inclus. Cependant ces combustibles peuvent<br />
représenter une part importante des sources<br />
d’approvisionnement énergétiques en<br />
Méditerranée.<br />
ATEP : Approvisionnements Totaux en<br />
Energie Primaire.<br />
Sources / Références<br />
Banque Mondiale - World Development<br />
Indicators 2006<br />
35%<br />
30%<br />
25%<br />
20%<br />
15%<br />
10 %<br />
0%<br />
Part des énergies renouvelables (hors biomasse) dans les ATEP (1990 – 2004)<br />
5%<br />
19 9 5 2000 2004<br />
M A LB FR SY EG GR ES IL IT SI CS TR HR CY BA AL<br />
Part de l’hydraulique en 2004 et croissance des ATEP(1990-2004)<br />
7%<br />
Energie<br />
Source : AIE<br />
Source : AIE
Suivi de la Stratégie Méditerranéenne de Développement Durable<br />
Les pays méditerranéens maîtrisent-ils leurs émissions de CO2 et<br />
respectent-ils leurs engagements internationaux?<br />
Le Protocole de Kyoto amendé en juillet 2001<br />
à Bonn et entré en vigueur en 2005, vise une<br />
réduction de 5,2 % des émissions mondiales<br />
de gaz à effet de serre (GES) à l’horizon 2012<br />
par rapport à 1990. L’UE s’est engagé à<br />
réduire de 8 % ses émissions de CO2 en<br />
répartissant les efforts entre les Etats<br />
membres.<br />
En Méditerranée, 7 pays sont ainsi<br />
officiellement engagés à réduire ou maîtriser<br />
leurs émissions : la Croatie, Monaco et la<br />
Slovénie (-8 %), l’Italie (-6,5 %), la France<br />
(stabilisation), l’Espagne (+15 %) et la Grèce<br />
(+25 %). Tous les autres pays de la région<br />
n’ont aucune obligation de réduction<br />
d’émissions.<br />
Les émissions de CO2 en provenance des<br />
combustibles fossiles augmentent dans la<br />
plupart des pays méditerranéens.<br />
La croissance des émissions de CO2 entre 1990<br />
et 2003 est partout supérieure aux objectifs<br />
natinaux. Elle est de l’ordre de 3 % pour la<br />
France et de 46 % pour l’Espagne. Selon<br />
l’AEE, l’Espagne et l’Italie risquent de ne pas<br />
atteindre leurs objectifs 2012. Dans les autres<br />
pays, cette croissance va de 1 à 12 % pour<br />
Malte et la Serbie-Monténégro à plus de 100 %<br />
pour Israël, Liban et Algérie. Les valeurs<br />
extrêmes de -58 % pour l’Albanie et plus de<br />
300 % pour la Bosnie-herzégovine sont à<br />
considérer avec précautions.<br />
En 2003, un méditerranéen émet en moyenne<br />
5 tonnes de CO2 par an, soit un peu plus que<br />
la moyenne mondiale (4 tonnes), mais presque<br />
deux fois moins de CO2 qu’un habitant de<br />
l’UE-15 (9 tonnes) et pratiquement 4 fois<br />
moins qu’un habitant des Etats-Unis (environ<br />
21 tonnes de CO2 par an).<br />
Indicateur ENE_P03 Mis à jour le 02/05/2007<br />
Selon les pays, les émissions de CO2 par<br />
habitant sont très variables : moins de 1 tonne<br />
par habitant en Albanie à plus de 10 à Chypre<br />
et en Israël en 2003. Sur la rive Sud et Est, les<br />
écarts des émissions de CO2 par habitant sont<br />
aussi importants : de 1 à 3 tonnes et même 5 et<br />
9 tonnes pour respectivement l’Algérie et la<br />
Libye.<br />
Ces valeurs peuvent être rapprochées des<br />
émissions de CO2 rapportées à la<br />
consommation d’énergie commerciale. Les<br />
écarts autour de la Méditerranée vont de 1 à 5 :<br />
France : 1,4 tCO2/tep ; Grèce : 3,2 tCO2/tep ;<br />
Algérie : 5 tCO2/tep.<br />
Définition<br />
Cet indicateur correspond aux émissions<br />
nationales annuelles anthropiques agrégées des<br />
principaux gaz à effet de serre (GES) : le<br />
dioxyde de carbone (CO2), le protoxyde<br />
d’azote (N2O), le méthane (CH4), les<br />
hydrofluorocarbones halocarbures (HFC), les<br />
hydrocarbures perfluorés (PFC) et<br />
l’hexafluorure de soufre (SF6).<br />
Précautions / Notes<br />
Dans cette fiche, seules les émissions de CO2<br />
provenant des combustibles solides, des<br />
cimenteries et du brûlage de gaz sont<br />
considérées. Elles représentent en moyenne<br />
plus de 80 % des émissions anthropiques des<br />
GES.<br />
Sources / Références<br />
CDIAC, AEE<br />
500<br />
450<br />
400<br />
350<br />
300<br />
250<br />
200<br />
150<br />
10 0<br />
50<br />
0<br />
8. Emissions de gaz à effet de serre<br />
Emissions de CO2 (provenant des combustibles fossiles) en Mt de CO2<br />
1990 1995 2000 2003 Obj 2010<br />
M T AL CY SI LB BA TN HR M A SY CS LY IL GR EG DZ TR ES FR IT<br />
Emissions de C02 par consommation d’énergie (tCO2/tep) et par habitant (tCO2/hab) - 2003<br />
Energie<br />
Source : CDIAC<br />
Source : CDIAC
86<br />
ENERGY AND SUSTAINABLE DEVELOPMENT IN THE MEDITERRANEAN<br />
8.8 An n e x e 8 – Communiqué de pr esse
Communiqué de presse<br />
Atelier Énergie et Développement Durable en<br />
Méditerranée, 29 & 30 mars 2007, Monaco<br />
Une quarantaine d’experts en provenance de 12 pays méditerranéens, représentants des autorités et<br />
institutions nationales, d’institutions européennes et internationales, d’organisations non gouvernementales,<br />
des secteurs privé et associatif, se sont réunis à Monaco les 29 et 30 mars 2007 pour participer à un atelier<br />
de travail sur le thème « Energie et développement durable ».<br />
Organisé sous l’égide de la Commission Méditerranéenne de Développement Durable, par le <strong>Plan</strong> Bleu et<br />
ses partenaires régionaux dans le domaine de l’énergie (en particulier l’Observatoire Méditerranéen de<br />
l’Energie, l’ADEME et MEDREP) cette rencontre internationale a porté sur le thème de l’utilisation<br />
rationnelle de l’énergie (URE) et des énergies renouvelables (ENR).<br />
Alors que la demande en énergie des pays méditerranéens devrait passer de 945 MioTep en 2005 à 1360 en<br />
2020 et être satisfaite à plus de 80% par les énergies fossiles fortement émettrice de C02 si la tendance ne<br />
change pas, le potentiel exceptionnel de la région en énergie renouvelable (solaire et éolien en particulier)<br />
reste sous exploité et le gaspillage d’énergie est estimé entre 20 et 50% selon les pays.<br />
Or l’exploitation simultanée et à grande échelle de ces deux options répond aux mêmes enjeux et défis<br />
auxquels fait face la région pour son développement: le desserrement des contraintes liées à la sécurité de<br />
l’approvisionnement, l’accès à l’énergie et au service énergétique, la réduction de l’impact sur<br />
l’environnement de son développement, tant au niveau global (notamment sur le changement climatique et<br />
la biodiversité) que local (pollution atmosphérique en particulier).<br />
C’est dire l’importance qui s’attache à une meilleure gestion de la demande d’énergie (utilisation rationnelle)<br />
et à la diversification de l’offre d’énergie grâce aux énergies renouvelables, comme le suggère la Stratégie<br />
Méditerranéenne de Développement Durable.<br />
Au cours des 2 journées de travail, des exemples concrets de bonnes pratiques en énergie renouvelable et en<br />
efficacité énergétique menées dans les pays, ainsi que des études réalisées à l’échelle de la Méditerranée, ont<br />
été présentés. Les échanges ont mis en évidence la nécessité de mieux partager les expériences réussies,<br />
d’établir un bilan sur les progrès réalisés en matière d’efficacité énergétique dans les pays méditerranéens,<br />
d’analyser les instruments de politique mis en œuvre, d’identifier les principaux obstacles rencontrés et de<br />
formuler des propositions pour le développement à grande échelle des énergies renouvelables et de<br />
l’utilisation rationnelle de l’énergie.<br />
Parmi les différentes conclusions issues de cette manifestation figurent la nécessité de mettre en place un<br />
cadre institutionnel et réglementaire adapté, de sensibiliser le grand public aux relations entre système<br />
énergétique et changement climatique, à la nécessité de maîtriser les consommations (au Sud) ou de les<br />
diminuer (au Nord), d’approfondir les réflexions sur les mécanismes de soutiens économiques (tarification,<br />
<strong>Plan</strong> Bleu<br />
15, rue Beethoven – Sophia-Antipolis – F-06560 Valbonne<br />
Tél. +33 4 92 38 71 39 – Fax +33 4 92 38 71 31<br />
E-mail : planbleu@planbleu.org - Web : www.planbleu.org
subvention, fiscalité, tarifs de rachat…) au développement des énergies renouvelables et des actions<br />
d’efficacité énergétique.<br />
Les principaux messages issus de ces travaux seront transmis aux représentants des gouvernements des pays<br />
Méditerranéens lors de la prochaine réunion de la Commission Méditerranéenne de Développement Durable<br />
les 30 et 31 mai prochain à Istanbul.<br />
ULe <strong>Plan</strong> Bleu :<br />
Observatoire méditerranéen de l’environnement et du développement<br />
durable, le <strong>Plan</strong> Bleu est un Centre d'activités régionales du Programme<br />
des Nations Unies pour l'Environnement / <strong>Plan</strong> d'action pour la<br />
Méditerranée (PNUE / PAM) créé, financé et piloté par les 21 pays<br />
riverains de la Méditerranée et par la Commission européenne. Son<br />
objectif a été défini par la conférence intergouvernementale tenue à Split<br />
en 1977. Le <strong>Plan</strong> Bleu est le principal centre support de la Commission<br />
méditerranéenne de développement durable (CMDD) créée en 1996,<br />
suite à la Conférence de Rio.<br />
UContact presse :<br />
<strong>Plan</strong> Bleu<br />
15 rue Beethoven – Sophia Antipolis<br />
06560 Valbonne - France<br />
Tél : +33 4 92 38 71 39<br />
Fax : +33 4 92 38 71 31<br />
HTUplanbleu@planbleu.orgUTH<br />
Site Internet : HTUwww.planbleu.orgUTH<br />
* * *
BOSNIA & HERZEGOVINA<br />
By Mrs Semra Fejzibegovic, Hydro-Engineering Institute Sarajevo<br />
TABLE OF CONTENT<br />
I. Summary ........................................................................................................................... 89<br />
1. Challenges and energy sustainability:..................................................................................................... 89<br />
2. Indicators ..................................................................................................................................................... 90<br />
3. The currently established policies in terms of RE and URE ................................................................. 91<br />
4. Difficulties, possible solutions, needed reforms ................................................................................... 91<br />
5. Success stories ........................................................................................................................................... 92<br />
II. Résumé ............................................................................................................................ 93<br />
1. Enjeux et durabilité énergétique .............................................................................................................. 93<br />
2. Indicateurs ................................................................................................................................................... 94<br />
3. Les politiques actuelles en matière de ER et d’URE ............................................................................. 95<br />
4. Difficultés, solutions possibles, réformes nécessaires : ...................................................................... 95<br />
5. Les « Success Stories » ............................................................................................................................... 96<br />
III. – National study ............................................................................................................. 97<br />
1. Introduction – Short summary of the situation in energy sector ........................................................ 97<br />
2. Energy situation in B&H: indicators and basic data.............................................................................. 98<br />
3. Rational Energy Use (RUE) - Renewable Energies (RE): policies, tools, progress, resulting<br />
effects, and case studies ............................................................................................................................. 124<br />
4. Examples of good practice, case studies ............................................................................................. 130<br />
5. Proposals for more sustainable energy development ........................................................................ 133<br />
6. Bibliography............................................................................................................................................... 137<br />
7. Table of illustrations ................................................................................................................................ 138
I. SUMMARY<br />
BOSNIA & HERZEGOVINA - Summary<br />
1. Challenges and energy sustainability:<br />
Coal insured the largest share of primary energy in Bosnia and Herzegovina in 1991. Coal<br />
was provided 59 % of primary energy. Share of the liquid fuels was 26 %. Hydro energy, the<br />
only one ecologically acceptable source of energy in Bosnia and Herzegovina participated<br />
with 7% in providing the primary energy.<br />
In 1991, primary energy supply (production and import) was 7.8 Mteo, and in 2004 it was<br />
4.71 Mteo.<br />
Total final consumption in 1991 was 5.6 Mteo, i.e. 72% of TPES and in 2004 it was 3.0 Mteo,<br />
i.e. 64% of TPES.<br />
Coal demand<br />
The authors of various studies offered different projections of the potential demand for coal<br />
in B&H by 2015. These projections range from 8.2 to 12.6 million tons for B&H.<br />
Natural gas demand<br />
With respect to the long–term projected gas needs according to World Bank studies done in<br />
1999 is around 1.5 billion m 3 for the low scenario, until 2020. In the case of low growth<br />
scenario, the energy policy would be based on the use of national energy sources, with<br />
partial use of gas where the domestic energy sources are thought non-competitive or<br />
technologically inappropriate. From the aspect of this study, this is what makes this particular<br />
scenario realistic and conceptually acceptable.<br />
Oil demand<br />
The demand for motor fuels on the domestic market in the present conditions is<br />
approximately 1.5 million tons annually. The oil refinery delivers around 500,000 tons to<br />
the market, and the rest is imported. Considering that the number of private petrol stations is<br />
on the increase and has reached approximately 300 stations, objective estimates suggest<br />
that the commercial capacities in B&H market are already oversized. The present state on<br />
the B&H oil products market suggests not only inadequate usage of own production<br />
capacities, and large imports of such products, but also the problems of the frequent imports<br />
of cheap low-quality products, especially motor fuels. This situation needs to be urgently<br />
addressed and the relations on the market improved.<br />
Demand for electricity<br />
B&H satisfies its electric power needs in total with the production of electricity from its own<br />
power stations (10.8 TWh in 2002), using for that its available hydro potential and coal<br />
resources. The situation of domestic consumption enables also the export of part of<br />
generated electricity, which in 2002 were 1.1 TWh. About 60% of electricity has been<br />
generated in thermo power plants, and the other 40% in hydro power plants. The available<br />
hydro potentials have been estimated to possible annual production of approx. 22,000<br />
GWh, while the coal reserves are over four billions of tons. The production of electric<br />
energy on today’s level is sufficient for satisfying B&H own needs in short-term time period.<br />
Energy dependency<br />
The basic identified sources of primary energy in B&H are coal and hydropower. In 2001,<br />
annual production of energy from those sources in B&H amounted to about 62 % of the total<br />
consumption of primary energy, which indicates that B&H is dependent on the imports of<br />
energy, as certain energy sources, for now, can not be replaced with domestic energy<br />
sources.<br />
89
Energy bill<br />
90<br />
Energy source Oil for<br />
heating<br />
(in<br />
Liters)<br />
ENERGY AND SUSTAINABLE DEVELOPMENT IN THE MEDITERRANEAN<br />
Final consumer energy price per fuel in 2003 for F B&H<br />
Electric<br />
power<br />
(daily<br />
tariff)<br />
kWh<br />
Electric<br />
power<br />
(late<br />
hours<br />
tariff) kWh<br />
Brown<br />
coal in<br />
tons<br />
Lignite<br />
in tons<br />
Central<br />
heating<br />
per m 2<br />
Average retail 1.02 0.14 0.07 107.08 77.43 1.07<br />
price in KM (BAM)<br />
Source: Statistical Yearbook of FB&H of 1993-1998<br />
Energy and climate changes<br />
Bosnia and Herzegovina ratified the UN Framework Convention on Climate change on<br />
September 7, 2000, and the UNFCCC entered into force on December 6, 2000.<br />
Bosnia and Herzegovina has not ratified yet the Kyoto Protocol on the Greenhouse<br />
Gases Reduction, but it is currently in the process of ratification.<br />
Regarding the environment protection, the legal and institutional environment is not strong<br />
enough for adequate approach to the environment protection problem. The problem of<br />
inexistence of inter-sector approach to this field should be added to this as well. The<br />
inexistence of the energy strategy of B&H, as well as the appropriate institutional approach<br />
and mechanisms for realization of plans precludes B&H from implementation of the requests<br />
of Athena Memorandum and Charter in the part related to the environment protection.<br />
Also, the ratification and implementation of Kyoto Protocol for B&H will be necessary,<br />
regarding that it will result with the significant opportunities and profits for the economy, as<br />
well as with the benefit in the form of reduction of air pollution. That will ensure the more<br />
favorable life environment and sustainable development.<br />
Sustainability degree of energy development and awareness degree of energy issue<br />
There are no enough incentives for introduction of new fuels and technologies which could<br />
reduce the negative impact on the environment. Because of that it is necessary to make the<br />
reform of subsidies which already have caused the damages in the environment. Besides,<br />
the taxes on motor fuel should be introduced, which would be proportional to the damage<br />
these fuel cause (e.g. to reflect the carbon content which the fuel is consisted of). The<br />
solutions for the improvement in the energy sector lies in the increase of the efficiency of<br />
fossil fuel combustion and stimulating the use of renewable energy and new technologies in<br />
energy production. It is necessary to concentrate on CO2 reduction (what means reduction of<br />
energy use or transfer to the energy sources with low CO2 emission).<br />
Awareness degree is low.<br />
2. Indicators<br />
1) Share of renewable energy resources in primary energy supply is 8.2 % in 2000,<br />
and it is hydro energy. Potential for exploitation of geo-thermal energy, wind energy,<br />
solar energy and biomass energy have not been sufficiently explored. The potential and<br />
feasibility of RE use is going to be analyzed in B&H within the document of national<br />
energy strategy which is being drafted within EU CARDS program called “Technical<br />
assistance for strengthening of energy department within Ministry of Foreign Trade and<br />
Economic Relations of B&H”(TASED project).<br />
RES estimated potential [GWh]<br />
Small Hydro 2,500 GWh/year<br />
Wind 600 MW that could be developed by 2010 according to GTZ<br />
Study<br />
Solar Theoretical potential is 74.65 PWh per year<br />
Biomass 1,000,000 m3/year
Geothermal heat 33 MWth<br />
BOSNIA & HERZEGOVINA - Summary<br />
2) Energy efficiency – energy saving<br />
Within the Energy Strategy blueprint for B&H, the Energy Efficiency and Energy<br />
conservation sector policy and strategies will be done on the basis of data, knowledge<br />
and results obtained both from WB Study and EC CARDS “TASED” Project. The first<br />
conclusions from TASED project can be expected at the end of 2007.<br />
The reduced energy consumption can be partly achieved by introduction of district<br />
heating. Most of the current systems do not achieve the satisfactory effects, partly due<br />
to inadequate maintenance, and partly because there are no instruments for measuring<br />
individual heat consumption of consumers. The possibilities of combined production of<br />
heat and electric power, an option that is convenient for larger buildings or groups of<br />
buildings, are also underutilized.<br />
Buildings are usually not good isolated, energy loss amount up to 30% in winter period.<br />
The energy price increase forces the poor to look for alternative energy sources.<br />
Domestic consumption of coal, wood and waste is widely spread in the poorest suburbs.<br />
3. The currently established policies in terms of RE and URE<br />
3) B&H will get its Energy Strategy blueprint through the EC CARDS Programme “Technical<br />
Assistance to Support the Energy Department of Ministry of Foreign Trade and<br />
Economic Relations in B&H”. Preparation of a comprehensive background energy<br />
sectors study is the first step towards the national energy strategy and is in preparation<br />
phase financed by the World Bank.<br />
4) There are no official plans for the promotion of RE sources and the plans for increasing<br />
the energy efficiency does not exist.<br />
5) Tariff systems for RES electricity<br />
Decision on methodology of determination of level of purchase prices of electric power<br />
from RES with installed power up to 5 MW was adopted (Of. Gazette FB&H 32/2002, Of.<br />
Gazette RS 71/2003).<br />
Two power utility companies in B&H and one in RS are obliged to take over the<br />
electricity produced from RES. According to decisions, the tariff systems for RES<br />
electricity:<br />
Small Hydro plants: 3.96 € cents/kWh<br />
Landfill biogas and biomass plants: 3.81 € cents/kWh<br />
Wind and geothermal plants: 4.95 € cents/kWh<br />
Solar power plants: 5.44 € cents/kWh<br />
6) Incentive economic tools do not exist.<br />
7) Specialized institutions do not exist. No training and education actions.<br />
8) There are some projects (USAID, UNDP) and associations of citizens (CETEOR,<br />
COOR, CENER, CEET) and also centers dealing with this issue within the Faculties of<br />
University in Sarajevo, Banja Luka, Tuzla, and Mostar.<br />
4. Difficulties, possible solutions, needed reforms<br />
9) The level of energy efficiency, i.e. energy intensity in B&H is among the latest in Europe.<br />
This means that in this field it is necessary and is possible to do significant<br />
improvements. The main problem for this field is that the institutional and legal<br />
framework does not exist.<br />
10) The first task of the sustainable development of energy sector of B&H is reducing energy<br />
intensity in the entire life cycle starting from the primary energy production, raw material<br />
processing and production and up to the product and final energy forms conversions into<br />
money and life quality. This includes also the use of waste heat in industrial facilities, as<br />
well as in agriculture.<br />
91
92<br />
ENERGY AND SUSTAINABLE DEVELOPMENT IN THE MEDITERRANEAN<br />
The second task is increasing the energy efficiency of fossil fuel usage (small energy<br />
cogeneration, use of the condensation boilers, use of the flue gases heat).<br />
The third task is gradually transition to the unconventional energy sources (biomass use,<br />
passive use of solar energy, larger use of hydro potential for small power plants).<br />
The most important step is now development of the energy sector strategy by which the<br />
priority directions of the energy sector development and decision to use RES will be<br />
established, as well as the instruments and dynamic for its implementation; It is<br />
necessary to develop Feasibility studies on RES use (wind and solar energy).<br />
It is necessary to simplify the procedure for obtaining the concession and license for the<br />
construction of RE installations. It is necessary to stimulate the private sector for<br />
investments, moreover for the development of all segments of energy infrastructure.<br />
5. Success stories<br />
The transition of the energy sector and industry to the sustainable forms of development<br />
cannot be expected without finalization of the privatization process in these sectors.<br />
However, the privatization is not the only aim. It is only the one component of the transition.<br />
The transition must be both the technological and environmental in the same time.<br />
The examples for this in B&H are very rare, but the extraordinary example is the Cement<br />
Factory in Kakanj, where the privatization process included technological and environmental<br />
restoration, as well as the introduction of new, more modern management system.
II. RÉSUMÉ<br />
1. Enjeux et durabilité énergétique<br />
BOSNIA & HERZEGOVINA - Résumé<br />
En 1991, les ressources en charbon de la B&H couvraient 59% des besoins en énergie<br />
primaire, contre seulement 26% pour les combustibles liquides et 7% pour l’énergie d’origine<br />
hydraulique, pourtant considérée comme la seule source d’énergie écologiquement<br />
acceptable en B&H. De surcroît, à la même époque, l’approvisionnement en énergie primaire<br />
(production et importation) était de 7.8 Mtep contre seulement 4.71 Mtep en 2004.<br />
La consommation totale atteignait 5.6Mtep, soit 72% de TPES (Total Primary Energy Supply =<br />
production totale d'énergie primaire), et en 2004, elle était de 3.0Mtep, soit 64% de TPES.<br />
La demande en charbon<br />
Les prévisions des études effectuées sur l’évolution de la demande potentielle en charbon<br />
en B&H à l’horizon 2015 diffèrent et varient de 8.2 à 12.6 millions de tonnes.<br />
La demande en gaz naturel<br />
Selon les études de la Banque Mondiale en 1999, et sous réserve de croissance lente, les<br />
prévisions à long terme des besoins en gaz approchent les 1.5 milliards de m3 d’ici à 2020.<br />
Dans un environnement de croissance lente, les politiques énergétiques seraient basées sur<br />
l’utilisation des sources d’énergie nationales, qui pourraient être partiellement remplacées<br />
par le gaz, dans les cas où elles seraient trop onéreuses ou technologiquement mal<br />
adaptées. L’étude nationale semble indiquer que ces prévisions sont à la fois réalistes et<br />
acceptables.<br />
La Demande en pétrole<br />
Dans les conditions actuelles, les besoins annuels nationaux en carburants automobiles<br />
s’élèvent à environ 1.5 millions de tonnes, dont 500.000 tonnes couvertes par l’industrie<br />
pétrolière du pays et le reste par les importations. Les estimations objectives du nombre<br />
croissant de stations-service privées, 300 à ce jour, semblent indiquer que la capacité<br />
commerciale actuelle en hydrocarbures est surdimensionnée. L’analyse du marché des<br />
hydrocarbures en B&H démontre une capacité de production nationale mal utilisée, des<br />
importations soutenues et des problématiques d’imports fréquents de carburants peu<br />
onéreux mais de mauvaise qualité, en particulier sur le marché de l’automobile. Cette<br />
situation requiert une attention immédiate et de meilleures relations commerciales.<br />
La Demande en électricité<br />
La production des centrales électriques (10.8 TWh en 2002) permet à la B&H de satisfaire<br />
ses besoins en électricité, par l’énergie d’origine hydraulique et par les ressources nationales<br />
en charbon. Les niveaux de consommation nationale permettent d’exporter une partie de la<br />
production nationale (1.1 TWh en 2002). Environ 60% de l’électricité provient des centrales<br />
thermoélectriques, et 40% des centrales hydroélectriques. Selon les estimations, le potentiel<br />
en énergie d’origine hydraulique disponible se situerait à environ 22.000 GWh par an, et les<br />
réserves de charbon à plus de 4 milliards de tonnes. Les niveaux actuels de production<br />
d’électricité couvrent les besoins à court terme de la B&H.<br />
La dépendance énergétique<br />
En B&H, le charbon et l’énergie d’origine hydraulique ont été identifiés comme les principales<br />
sources d’énergie primaire. En 2001, la production annuelle représentait 62% de la<br />
consommation totale, ce qui indique que la B&H est dépendante des importations d’énergie,<br />
étant actuellement dans l’incapacité de remplacer ces apports extérieurs par ses sources<br />
d’énergie nationales.<br />
93
Facture énergétique<br />
94<br />
ENERGY AND SUSTAINABLE DEVELOPMENT IN THE MEDITERRANEAN<br />
Tableau 1 Prix de l’énergie en 2003 (par carburant) à la charge du consommateur final<br />
Source<br />
énergétique<br />
Prix unitaire<br />
moyen en<br />
KM (BAM)<br />
Fuel de<br />
chauffage<br />
(en Litres)<br />
Electricité (tarif<br />
journalier) kWh<br />
Source: Statistical Yearbook of FB&H of 1993-1998<br />
Energie et Changement Climatique<br />
Electricité<br />
(tariff de nuit)<br />
kWh<br />
Charbon<br />
en tonnes<br />
Lignite en<br />
tonnes<br />
Chauffage<br />
central au<br />
m2<br />
1.02 0.14 0.07 107.08 77.43 1.07<br />
Le 7 septembre 2000, la B&H ratifiait la Convention Cadre des Nations Unies sur le<br />
Changement Climatique entrée en vigueur le 6 décembre 2006.<br />
A ce jour, la B&H n’a pas encore ratifié le Protocole de Kyoto visant à réduire les émissions<br />
de gaz à effets de serre, mais ce dernier est néanmoins en cours de ratification.<br />
Le cadre réglementaire et institutionnel actuel ne permet pas la mise en œuvre d’une<br />
approche environnementale suffisante et il n’existe aucune approche intersectorielle. Le<br />
manque de stratégie énergétique, d’une approche institutionnelle et de mécanismes de mise<br />
en œuvre ne permet pas aujourd’hui à B&H de se conformer aux obligations<br />
environnementales du Mémorandum d’Athènes et de sa Charte.<br />
La B&H doit également ratifier et mettre en œuvre le protocole de Kyoto, afin de bénéficier<br />
des opportunités significatives et des gains économiques importants ainsi que de la baisse<br />
de la pollution atmosphérique, toutes conditions favorables à une meilleure qualité de vie et<br />
au développement durable.<br />
Niveau de pérennité du développement énergétique et de sensibilisation à la problématique énergétique<br />
Il existe peu d’outils de promotion de la mise en œuvre des nouvelles sources d’énergie et<br />
des technologies adaptées qui permettraient de réduire significativement les impacts négatifs<br />
sur l’environnement. Les subventions déjà responsables de bon nombre de dégâts doivent<br />
faire l’objet de réformes spécifiques, telles que l’application de taxes sur les carburants<br />
automobile, au prorata de la pollution induite (teneur en carbone des carburants).<br />
Les solutions favorables à une plus grande efficacité énergétique sont liées à l’amélioration<br />
de la combustion des énergies fossiles ainsi qu’à la promotion des ERs et des nouvelles<br />
technologies. La baisse des émissions de CO2 résultera d’une moindre consommation<br />
d’énergie ou de la transition vers des sources à faible émission de CO2.<br />
Le niveau de sensibilisation est faible.<br />
2. Indicateurs<br />
1) En 2000, les ERs d’origine hydraulique représentaient 8.2% de<br />
l’approvisionnement en énergie primaire. Le potentiel d’exploitation de l’énergie<br />
géothermique, éolienne, solaire et biomasse n’a pas encore été suffisamment étudié. La<br />
faisabilité des ERs sera analysée dans la stratégie énergétique de la B&H, en cours<br />
d’élaboration dans le cadre du Programme CARDS de la Commission Européenne<br />
intitulé « Assistance et soutien technique au Département de l’Energie du Ministère du<br />
Commerce Extérieur et des Relations Economiques en B&H» (Projet TASED).<br />
Estimation du potentiel des ERs (GWh)<br />
Petites installations Hydro 2.500 GWh/an<br />
Eolienne Un potentiel de 600 MW à l’horizon 2010, selon<br />
une étude GTZ<br />
Solaire Potentiel théorique de 74,64 PWh/an<br />
Biomasse 1, 000,000 m3/an<br />
Géothermique (électricité-chaleur) 33 MWth
BOSNIA & HERZEGOVINA - Résumé<br />
2) Efficacité énergétique- Economies d’énergie<br />
La Stratégie Energétique de la B&H définira les politiques et approches en matière<br />
d’efficacité énergétique, sur la base des données, informations et résultats obtenus à<br />
partir des études de la Banque Mondiale et du Projet TASED du programme CARDS de<br />
la Commission Européenne. Les premières conclusions du projet TASED sont attendues<br />
fin 2007.<br />
La consommation d’énergie peut être partiellement réduite par l’utilisation du<br />
chauffage collectif. Les systèmes existants sont inadaptés, soit à cause d’entretien peu<br />
efficace soit à cause du manque d’instruments de mesure relevant la consommation<br />
individuelle en chauffage. La production combinée « électricité-chaleur », adaptée<br />
aux bâtiments et aux grands ensembles, reste limitée.<br />
L’isolation de ces bâtiments est de mauvaise qualité et les pertes énergétiques<br />
atteignent 30% en période hivernale. L’augmentation du prix de l’énergie oblige les<br />
classes les plus pauvres à rechercher des sources d’énergie alternatives, telles que le<br />
charbon, le bois et la biomasse, dont la consommation est très élevée dans les<br />
banlieues les plus démunies.<br />
3. Les politiques actuelles en matière de ER et d’URE<br />
1) Avec le soutien du Programme CARDS de la Commission Européenne, “Assistance et<br />
soutien technique au Département de l’Energie du Ministère du Commerce Extérieur et<br />
des Relations Economiques en B&H», la B&H se verra dotée d’un cadre d’élaboration<br />
de sa Stratégie Energétique. La première étape de l’élaboration de cette stratégie est<br />
une étude détaillée de tous les secteurs énergétiques, actuellement en cours de<br />
préparation, avec le soutien financier de la Banque Mondiale.<br />
2) La B&H ne dispose d’aucun programme national de promotion des sources d’ER ou<br />
d’URE.<br />
3) Le système de tarification d’électricité produite par les installations ERs<br />
Le choix de la méthodologie applicable à la détermination des tarifs de<br />
l’approvisionnement en électricité produite par les installations ERs, d’une capacité<br />
maximale de 5MW, a été finalisé (Of. Gazette FB&H 32/2002, Of. Gazette RS 71/2003).<br />
Deux producteurs d’électricité en Fédération de Bosnie-et-Herzégovine (FB&H) et un en<br />
République Serbe de Bosnie (RS) sont tenus de reprendre l’électricité produite à partir<br />
des sources d’ER. Les tarifs applicables se décomposent comme suit :<br />
Petite Hydraulique : 3.96 € cents/kWh<br />
Biogaz et biomasse : 3.81 € cents/kWh<br />
Eolienne et géothermique : 4.95 € cents/kWh<br />
Solaire: 5.44 € cents/kWh<br />
4) Le pays souffre d’un manque d’outils de promotion économique<br />
5) Il n’existe aucune institution spécialisée ni aucun programme de formation ou de<br />
sensibilisation.<br />
6) Quelques projets sont en cours (USAID, PNUD). Certaines associations locales<br />
(CETEOR, COOR, CENER, CEET) et certains centres universitaires à Sarajevo, Banja<br />
Luka, Tuzla, et Mostar s’intéressent à la problématique de ERs.<br />
4. Difficultés, solutions possibles, réformes nécessaires :<br />
1) La B&H figure parmi les pays les plus en retard dans le domaine de l’efficacité<br />
énergétique (intensité énergétique), ce qui constitue une opportunité significative<br />
d’amélioration, limitée néanmoins par un cadre réglementaire et institutionnel inadapté.<br />
2) Pour permettre le développement durable du secteur de l’énergie en B&H, il convient<br />
tout d’abord de réduire l’intensité énergétique en amont, dès la production de l’énergie<br />
primaire, le traitement et la production des matières premières, jusqu’au produit fini et<br />
jusqu’à la transition vers les nouvelles sources d’énergie, améliorant les revenus et la<br />
95
96<br />
ENERGY AND SUSTAINABLE DEVELOPMENT IN THE MEDITERRANEAN<br />
qualité de la vie. La récupération par l’industrie et l’agriculture de la chaleur perdue<br />
contribuerait également à la baisse de l’intensité énergétique.<br />
Dans un deuxième temps, l’efficacité énergétique des combustibles fossiles doit être<br />
accrue (cogénération, chaudières à condensation, gaz).<br />
La troisième étape est la transition progressive vers les nouvelles sources d’énergie<br />
(biomasse, solaire, utilisation plus grande de l’énergie d’origine hydraulique dans les<br />
petites centrales).<br />
L’étape la plus importante reste l’élaboration de la stratégie énergétique, qui permettra<br />
de définir les orientations du développement du secteur énergétique et de l’utilisation<br />
des ERs, ainsi que les outils et la dynamique nécessaires à sa mise en œuvre.<br />
Des études de faisabilité relatives à l’utilisation des ERs (éolienne, solaire) sont<br />
requises.<br />
La procédure relative à l’obtention des concessions et des permis de construire des<br />
installations ER doit être simplifiée.<br />
Le secteur privé doit être encouragé à participer aux investissements et au<br />
développement des infrastructures.<br />
5. Les « Success Stories »<br />
La transition des secteurs énergétique et industriel vers des sources de développement plus<br />
durables ne sera possible que lorsque le processus de privatisation aura été finalisé.<br />
Cependant, la privatisation n’est pas le seul objectif ; il ne s’agit que d’une composante de la<br />
transition qui doit être à la fois technologique et environnementale.<br />
De tels exemples sont rares en B&H, mais le plus remarquable est celui de la Cimenterie de<br />
Kakanj, qui a bénéficié d’une mise à niveau technologique et environnementale, ainsi que de<br />
la mise en œuvre d’un nouveau système de management, plus moderne.
III. – NATIONAL STUDY<br />
BOSNIA & HERZEGOVINA - – National study<br />
1. Introduction – Short summary of the situation in energy sector<br />
Bosnia and Herzegovina (BiH) has experienced massive economic and political changes since the<br />
collapse of the former Yugoslavia in 1992. Currently, the country is largely decentralized and consists<br />
of two state-like entities, the Federation of BiH (Federation), and the Republika Srpska (RS) and<br />
District Brčko. The Federation is further decentralized and made of ten cantons.<br />
The complexity of political and organizational structures extends to the energy sector where<br />
the state-like entities own and oversee three electric power companies, an oil refinery,<br />
natural gas transmission and distribution utilities, and coal mines. District heating facilities fall<br />
under the responsibility of municipal (RS) and cantonal governments (Federation). This is a<br />
unique arrangement that has emerged as a consequence of the complex political situation.<br />
Some of the major problems facing the energy sector in BiH today include an unclear<br />
authority over energy issues, the absence of a long-term energy strategy on the state level,<br />
and the absence of energy statistics and laws. BiH is lacking the legal and political basis for<br />
efficient decision-making and for delegation of responsibilities for energy and energy<br />
efficiency to different levels of government.<br />
According to available data, production and consumption of energy and the condition of<br />
energy infrastructure have not yet reached the pre-war level. With the existing level of energy<br />
intensity, more than 20 percent of national GDP is spent on energy, a clear indicator that<br />
significantly more attention has to be paid to energy efficiency.<br />
BiH satisfies its electric power needs in total with the production of electricity from its own<br />
power stations (10.8 TWh in 2002), using for that its available hydro potential and coal<br />
resources. The situation of domestic consumption enables also the export of part of<br />
generated electricity, which in 2002 was 1.1 TWh. About 60% of electricity has been<br />
generated in thermo power plants, and the other 40% in hydro power plants. The available<br />
hydro potentials have been estimated to possible annual production of approx. 22,000 GWh,<br />
while the coal reserves are over four billions of tons. The production of electric energy on<br />
today’s level is sufficient for satisfying B&H own needs in short-term time period.<br />
The overall power production system is in the process of separating on production,<br />
transmission and distribution of electricity, in accordance with the European standards.<br />
By adoption of the Law on establishment of the Independent System Operator for<br />
transmission system in BiH and by adoption of the Law on establishment of the Electricity<br />
Transmission Company in BiH, the legal framework on State level has been realized for the<br />
regulation of the transmission segment. These laws have enabled the establishment of nonprofit<br />
and independent system operator for the management of power transmission system<br />
operation in BiH (NOS), as well as the establishment of the Electricity Transmission<br />
Company ('Elektroprijenos BiH'). Regarding the work of the regulatory body, there is State<br />
Power Regulatory Commission in B&H (DERK), with the head office in Tuzla, and the Entity<br />
Power Regulatory Commissions with the head office in Mostar (FBiH) and Trebinje (RS).<br />
Also, the activities on preparation of the Energy Strategy in BiH have been started, and The<br />
Council of Ministers has already adopted the Terms of Reference for the Strategy of BiH.<br />
In coalmines in BiH, about nine millions of tons of brown coal and lignite has been produced,<br />
which is less then 60% of pre-war production. The coal has been used in greatest extent<br />
(over 70%) for the needs of electricity production in thermo power plants (TPP). We can say<br />
that the available coal reserves in BiH are sufficient for the insurance of future needs for<br />
electricity generation.<br />
BiH imports the natural gas from Russia, and the post-war level of gas consumption is up to<br />
200 millions of m3.<br />
The natural gas price in BiH on distribution level is the largest in South East Europe.<br />
97
98<br />
ENERGY AND SUSTAINABLE DEVELOPMENT IN THE MEDITERRANEAN<br />
District Heating Companies in BiH are faced with low collection rates due to the great<br />
number of consumers who do not pay the heating bills. Low level of payment does not allow<br />
for investment in maintenance of or upgrades in the system. A recently adopted Law on<br />
Consumer Protection states that the supplied energy is to be paid in accordance with<br />
consumption itself rather than by square meter, which is the present case. As a result, the<br />
system must be switched to individual heat metering. It is major priority in terms of better<br />
quality of service and better management of district heating system.<br />
According to data from Chamber of Commerce of BiH, from 1997 to 2001, the average oil<br />
derivates consumption in BiH ranged about 1.2 millions of tons yearly.<br />
The current domestic producer capacities are not sufficient to satisfy the needs of B&H<br />
market. That’s why currently BiH mainly depends from import of oil derivates.<br />
Regarding the environment protection, the legal and institutional environment is not strong<br />
enough for adequate approach to the environment protection problem. The problem of<br />
inexistence of inter-sectoral approach to this field should be added to this as well. The<br />
inexistence of the energy strategy of BiH, as well as the appropriate institutional approach<br />
and mechanisms for realization of plans precludes BiH from implementation of the requests<br />
of Athena Memorandum and Charter in the part related to the environment protection.<br />
Also, the ratification and implementation of Kyoto Protocol for BiH will be necessary,<br />
regarding that it will result with the significant opportunities and profits for the economy, as<br />
well as with the benefit in the form of reduction of air pollution. That will ensure the more<br />
favourable life environment and sustainable development.<br />
2. Energy situation in B&H: indicators and basic data<br />
2.1 Share of t he Energy S ecto r and Insti tu ti onal Specificities<br />
2.1.1 Energy sector economic weight<br />
Energy share in the GDP (%)<br />
Up to 1991, the annual computation of the social product has been done. The computation of<br />
the social product has been performed according to the production method, i.e. the start<br />
point of the computation is the production unit. In social product computations each<br />
production activities of the social, mixed and private sector of economy were included.<br />
Therefore, the computations of social product has been performed for the following<br />
production activities: Industry and mining, agriculture, forestry, water management, civil<br />
engineering, traffic, commerce, catering and tourism, production part of utility activities (water<br />
utility companies, district heating companies etc.). In Statistic Annual of Socialistic Republic<br />
of B&H from 1992, the prices of the producers from 1972 were taken for the computations of<br />
the social product according to the permanent prices. The given data on social product in<br />
permanent prices give the information on what the social product would be in the considered<br />
period if the prices had been unchanged, i.e. if the structure of prices had been as in 1972.<br />
The computation has been done according to the principle of clear activities applying the<br />
unique classification of the activities.<br />
From 1961, in computation of social product per activities and branches, two types of<br />
computation have been done: first according to main economic activity of the organization<br />
and its head office (organizational principle) and, second one, according to the activities and<br />
location of the facility and other units of the working organization (principle of clear activity<br />
and territory principle).<br />
The total results of the computation, done according to organizational and according to clear<br />
activity principle are not identical. The difference comes from the reason that the computation<br />
of the social product according to organizational principle, i.e., according to main economic<br />
activity, includes also the part of the organization activity that has not the production<br />
character. According to the principle of clear activities in computing the social product, only<br />
the results of working units dealing with material production and production services are<br />
taken into account [1].
BOSNIA & HERZEGOVINA - – National study<br />
Table 2 Share of energy sector in social product (SP) of B&H for period 1970 –1980- 1990 in prices of<br />
1972 in thousand of dinars according to principle of clear activities<br />
Total<br />
SP in<br />
B&H<br />
Elektroprivreda<br />
(Electricity<br />
production)<br />
Coal<br />
production<br />
Coal<br />
processing<br />
Oil<br />
derivates<br />
production<br />
Total SP of<br />
energy<br />
sector<br />
Share of energy<br />
sector in total SP<br />
(%)<br />
1970 2,678 82 79 23 22 206 7.69<br />
1972 3,027 96 88 22 24 230 7.59<br />
1974 3,413 114 95 23 27 259 7.58<br />
1976 3,614 127 98 31 32 288 7.33<br />
1978 4,205 145 98 31 37 311 7.39<br />
1980 4,587 163 108 33 39 343 7.47<br />
1982 4,851 158 115 34 39 346 7.13<br />
1984 4,973 180 127 48 41 396 7.96<br />
1986 5,240 205 147 48 38 438 8.35<br />
1988 5,040 218 138 48 42 446 8.84<br />
1990 4,664 210 146 33 42 431 9.24<br />
Source: The data for SP per branches of activities have been taken from Statistical Yearbook of SR B&H of 1992<br />
for period of 1970-1990<br />
In connection with Bosnia and Herzegovina independence, starting process of property<br />
realignment on economy and transition to market economy, created a needs for<br />
transformation of statistic services. That is why from 1993 and in the work program for a<br />
future, the Statistic Institute predicted using SNA methodology (System of National accounts)<br />
for calculating a macroeconomic aggregate and for monitoring of development of the entire<br />
economy and its factors. SNA methodology is the basic statistic standard that has been<br />
recommended by UN, and which has been using in all countries having market economy.<br />
For 1992, 1993 and 1994, neither the computation of social product nor the computation of<br />
Gross Domestic product (GDP) has been done due to the war situation in B&H.<br />
For the 1995 and 1996 the Institute of Statistics conducted the statistical researches on the<br />
territory of Federation of B&H (FB&H)- one Entity in B&H, by means of that collected<br />
elements necessary for calculation of GDP in all area of activities. Data for Republic of<br />
Srpska (RS) – the other entity in B&H, are obtained from Institute of Statistics of Republic of<br />
Srpska.<br />
All accounts of GDP are now published according to Standard classification of activities,<br />
which has been harmonized, with European Classification of activities (NACE). According to<br />
that classification all computations were done in USD by rate of exchange 11.35 dinars for 1<br />
USD in 1990. For 1995, the rate of exchange for USD was 141.0 BHD or 2.72 Yugoslav<br />
Dinars, and for 1996 1 USD was 151.0 BHD or 4.95 Yugoslav Dinars [2].<br />
Table 3 Share of industry and mining in GDP of B&H for period of 1995 - 1996 in million of USD<br />
Year Total GDP in Total GDP of industry Share of industry and mining in<br />
B&H<br />
and mining<br />
total GDP (%)<br />
1995 2,029 493 24.29<br />
1996 2,778 594 21.38<br />
Source: The data for GDP per branches of activities have been taken from Statistical<br />
Yearbook of Federation of B&H of 1993-1998 for period of 1995-1996<br />
Table 4 Share of energy sector for RS for period of 2000 - 2005<br />
Year GDP- Structure in % for Electricity, gas<br />
and water supply<br />
GDP- Structure in % for Mining<br />
and quarrying<br />
2000 9.9 1.3<br />
2001 10.0 0.8<br />
2002 7.5 0.5<br />
2003 8.8 1.7<br />
2004 7.6 1.8<br />
2005 7.6 2.4<br />
99
100<br />
ENERGY AND SUSTAINABLE DEVELOPMENT IN THE MEDITERRANEAN<br />
Table 5 Share of energy sector for FB&H for period of 2000-2005<br />
Year GDP- Structure in % for Electricity, gas<br />
and water supply<br />
GDP-Structure in % for Mining<br />
2000 6.04 2.28<br />
2001 6.15 2.09<br />
2002 5.23 2.26<br />
2003 5.46 2.29<br />
2004 n/a n/a<br />
2005 n/a n/a<br />
Source: For period of 2000-2005 only separate data per Entity (RS and FB&H) are<br />
available within the national accounts (SNA methodology) from Institute of Statistics of RS<br />
and FB&H.<br />
Energy shares in export and import (absolute value and percentage of total) per type<br />
of energy (oil, gas, coal, electricity, other)<br />
Table 6 Share of energy sector in export in thousands of dinars for period 1970 –1982<br />
Year Total export in<br />
B&H<br />
Electricity<br />
(Absolute<br />
value)<br />
Share<br />
(%)<br />
Coal and<br />
derivates<br />
(Absolute<br />
value)<br />
Share<br />
(%)<br />
Oil and<br />
derivates<br />
(Absolute<br />
value)<br />
Share (%)<br />
1970 3, 026, 391 - - 102,189 3.37 28, 489 0.94<br />
1972 3, 767,163 20, 798 0.55 42, 148 1.11 18, 715 0.49<br />
1974 7, 841, 232 - - 115, 127 1.46 54, 153 0.69<br />
1976 11, 628, 911 39, 623 0.34 198, 492 1.7 739 0.006<br />
1978 13, 003,875 54, 752 0.42 460, 568 3.54 7, 720 0.059<br />
1980 52, 076, 087 254,767 0.48 827, 380 1.58 29, 826 0.057<br />
1982 62, 713,170 - - 1, 183, 775 1.88 58, 861 0.09<br />
Note: According to parity 1 USD = 41.80 dinars for period 1980-1982<br />
Table 7 Share of energy sector in import in thousands of dinars for period 1970 –1982<br />
Year Total import<br />
in B&H<br />
Electricity<br />
(Absolute<br />
value)<br />
Share<br />
(%)<br />
Coal and<br />
derivates<br />
(Absolute<br />
value)<br />
Share<br />
(%)<br />
Oil and<br />
derivates<br />
(Absolute<br />
value)<br />
Share (%)<br />
1970 3, 755, 964 - - 383, 622 10.21 343, 358 9.14<br />
1972 4, 644, 440 - - 620, 919 13.36 455, 962 9.81<br />
1974 11, 236, 446 - - 962, 640 8.56 2, 349, 727 20.91<br />
1976 15, 705, 786 11, 735 0.07 2, 524, 342 16.07 2, 924, 787 18.62<br />
1978 20, 011, 715 1, 368 0.006 2, 355, 403 11.77 3, 633, 215 18.15<br />
1980 78, 469, 465 - - 5, 888, 229 7.50 21, 748, 424 27.71<br />
1982 76, 461, 661 575, 029 0.75 7, 232, 409 9.45 23, 306, 060 30.48<br />
Source: The data for export and import per branches of activities have been taken from Statistical Yearbooks of<br />
SR B&H of 1975 and of 1979 and of 1983, for period 1970 - 1982<br />
Table 8 Share of the energy sector in export in million of dinars for period 1983 –1985<br />
Year Total export Electricity Share Coal and Share Oil and Share<br />
in B&H<br />
(%) derivates (%) derivates (%)<br />
1983 267, 444 - - 3, 076 1.15 521 0.19<br />
1984 279, 083 1, 022 0.36 2, 594 0.92 1, 254 0.45<br />
1985 279 ,678 - - 3, 130 1.119 3, 014 1.07<br />
Note: 1 USD = 185.70 dinars<br />
Table 9 Share of the energy sector in import in million of dinars for period 1983 –1985<br />
Year Total import Electricity Share Coal and Share Oil and Share<br />
in B&H<br />
(%) derivates (%) derivates (%)<br />
1983 304, 578 2, 230 0.73 34, 521 11.33 90, 483 29.7<br />
1984 311, 032 6, 449 2.07 31, 517 10.13 101, 690 32.69<br />
1985 306, 169 4, 682 1.52 35, 411 11.56 81, 234 26.53<br />
Source: The data for export and import per branches of activities have been taken from Statistical Yearbook of SR<br />
B&H of 1986, for period 1983 –1985.
BOSNIA & HERZEGOVINA - – National study<br />
Table 10 Share of the energy sector in export in thousands dinars for period 1988 –1991<br />
Year Total export in<br />
B&H<br />
Electricity Share<br />
(%)<br />
Coal and<br />
derivates<br />
Share<br />
(%)<br />
Oil and<br />
derivates<br />
Share<br />
(%)<br />
1988 455, 463 - - 4,559 1.00 2,389 0.52<br />
1990 23, 271, 331 - - 117,403 0.50 159, 502 0.68<br />
1991 40, 093, 370 44, 194 0.11 46,000 0.115 189, 436 4.72<br />
Note: current rate of exchange<br />
Table 11 Share of the energy sector in import in thousands dinars for period 1988 – 1991<br />
Year Total import in<br />
B&H<br />
Electricity Share<br />
(%)<br />
Coal and<br />
derivates<br />
Share<br />
(%)<br />
Oil and<br />
derivates<br />
Share<br />
(%)<br />
1988 378, 410 1, 265 0.33 47,115 12.45 67,663 17.88<br />
1990 21, 130, 488 104, 225 0.49 1, 635,773 7.74 4,974,558 23.54<br />
1991 32, 371, 081 324, 258 1.00 1,177,416 3.63 3,323,896 10.26<br />
Source: The data for export and import per branches of activities have been taken from Statistical Yearbook of SR<br />
B&H of 1992, for 1988 –1991.<br />
The following data are only for Federation of B&H.<br />
Table 12 Share of the energy sector in export in thousands dinars for period 1999- 2003 for FB&H<br />
Year Total export in<br />
B&H<br />
Electricity,<br />
gas,<br />
steam<br />
and hot<br />
water<br />
supply<br />
In thousands of KM<br />
Share<br />
(%)<br />
Coal and peat<br />
mining<br />
Share<br />
(%)<br />
Petroleum and<br />
natural gas<br />
extraction<br />
Share<br />
(%)<br />
1999 950,213 44,274 4.65 4,891 0.51 31 0.003<br />
2000 1,429,561 74,566 5.21 6,504 0.45 - -<br />
2001 1,644,576 77,554 4.71 10,326 0.62 56 0.003<br />
2002 1,513,957 102,270 6.75 18,203 1.20 - -<br />
2003 1,720,185 81,254 4.72 22,647 1.31 - -<br />
Table 13 Share of the energy sector in import in thousands dinars for period 1999- 2003 for FB&H<br />
Year Total import in<br />
B&H<br />
Electricity,<br />
gas, steam<br />
and hot<br />
water<br />
supply<br />
In thousands of KM<br />
Share<br />
(%)<br />
Coal and peat<br />
mining<br />
Share<br />
(%)<br />
Petroleum and<br />
natural gas<br />
extraction<br />
Share<br />
(%)<br />
1999 4,458,976 23,125 0.51 3,292 0.07 36 8.07<br />
2000 4,852,232 59,482 1.225 4,812 0.99 593 0.01<br />
2001 5,382,633 44,431 0.82 6,716 0.12 85 0.001<br />
2002 5,609,956 38,523 0.68 2,767 0.05 12 2.14<br />
2003 5,705,517 57,624 1.01 12,429 0.217 4 7.01<br />
Source: The data for export and import per branches of activities have been taken from from Statistical Yearbook<br />
of Federation B&H of 2004 for 1999-2003.<br />
Data for energy share in export and import for period of 1999-2003 in RS are not available.<br />
The status of consumption within the country enables also the export of part of generated<br />
electricity, which in 2002 was 1.1 TWh for the entire B&H. [11].<br />
101
102<br />
ENERGY AND SUSTAINABLE DEVELOPMENT IN THE MEDITERRANEAN<br />
Number of jobs in the energy sector absolute value and percentage of the total<br />
Table 14 Share of jobs in energy sector in total number of jobs in SRB&H for period of 1970-1980<br />
Year Total number<br />
of employees<br />
B&H<br />
Electricity Share<br />
(%)<br />
In thousands<br />
Coal and<br />
derivates<br />
Share<br />
(%)<br />
Oil and<br />
derivates<br />
Share<br />
(%)<br />
1970 511. 4 6.3 1.23 24.5 4.79 1.5 0.29<br />
1973 581.4 7.6 1.31 26.1 4.49 1.8 0.31<br />
1975 668.4 9.2 1.37 24.7 3.69 1.9 0.28<br />
1978 754.0 9.5 1.26 25.8 3.42 1.4 0.18<br />
1980 820.8 11.3 1.38 25.9 3.15 1.3 0.16<br />
Source: Number of employees per branches of activities in social sector according to Statistical Yearbook of<br />
SRB&H of 1979 and of 1986<br />
Table 15 Share of jobs in energy sector in total number of jobs in SRB&H for period of 1983-1991<br />
In thousands<br />
Total number<br />
of employees<br />
B&H<br />
Electricity Share<br />
(%)<br />
Coal and<br />
derivates<br />
Share<br />
(%)<br />
Oil, gas and<br />
derivates<br />
Share<br />
(%)<br />
1983 926.0 13.5 1.46 28.9 3.12 1.4 0.15<br />
1985 989.7 14.9 1.50 32.0 3.23 1.9 0.19<br />
1988 1,061.2 16.9 1.59 30.4 2.86 1.4 0.13<br />
1990 1,026.2 16.3 1.58 32.4 3.16 1.6 0.15<br />
1991 945.9 16.1 1.70 29.9 3.16 1.5 0.16<br />
Source: Number of employees per branches of activities in social sector according to Statistical Yearbook of<br />
SRB&H of 1992<br />
Table 16 Share of jobs in energy sector in total number of jobs in Federation of B&H for period of 1999-<br />
2005 in thousands<br />
Total number<br />
of employees<br />
B&H<br />
Electricity,<br />
gas, steam<br />
and hot<br />
water<br />
supply<br />
Share<br />
(%)<br />
Mining of coal<br />
and peat<br />
Share<br />
(%)<br />
Manufacturing of<br />
coke, petroleum<br />
products and<br />
nuclear fuel<br />
Share<br />
(%)<br />
1999 407,754 11,563 2.83 14,528 3.56 1,333 0.32<br />
2000 410,808 11,237 2.73 14,500 3.53 1,283 0.31<br />
2001 407,199 10,536 2.58 14,401 3.54 1,183 0.29<br />
2002 394,132 10,098 2.56 13,781 3.49 1,124 0.28<br />
2003 387,381 9,799 2.53 13,526 3.49 1,083 0.28<br />
Source: Statistical Yearbook of FB&H for 2004<br />
Data for energy sector for 2003 taken from Chamber of Commerce of Republic of Srpska is<br />
the following:<br />
The total number of employees in energy sector is 10,039 or 4.27% comparing to total number of<br />
employees in RS, or 12.77% comparing to total number of employees in industrial sector.<br />
Relative importance of the energy sector within the State budget<br />
Energy sector played an important role in the development of Bosnia and Herzegovina. Energy share<br />
in the industry production structure of Bosnia and Herzegovina during 1990 was over 15 %, and was<br />
officially lower only from the industry processing of metal. The total level of energy consumption in<br />
Bosnia and Herzegovina before the war (data from 1991) was 324 x 10 15 J, i.e. about 73 GJ per<br />
inhabitant yearly. That was more then the world average (about 69 GJ per inhabitant yearly). In<br />
developing countries, the level of energy consumption was 25.6 GJ per inhabitant yearly.<br />
Coal, including the coal for coke production insured the largest share of primary energy in Bosnia and<br />
Herzegovina in 1991. Coal was provided 59 % of primary energy. Share of the liquid fuels was 26 %.<br />
Hydro-energy, the only one ecologically acceptable source of energy in Bosnia and Herzegovina<br />
participated with 7% in providing the primary energy.<br />
In the world, in 2000, 10.41 GJ of energy in average was used for the insurance of 1,000 US$ of GDP.<br />
In the same year, the developing countries used 22.57 GJ for 1,000 US$ and in Bosnia and<br />
Herzegovina for the same amount of GDP, the energy of 30.1 GJ was consumed.<br />
In Bosnia and Herzegovina, the final energy consumption was far below average level of consumption<br />
in the world. This data shows the energy unfavourable economy structure, but also the inefficient and
BOSNIA & HERZEGOVINA - – National study<br />
irrational production and consumption of energy. The ratio of total consumption of final energy and<br />
total consumption of primary energy was 0.35 in 1991 in Bosnia and Herzegovina, while in the world it<br />
was 0.70.<br />
In Bosnia and Herzegovina as well as in other countries having the planning economy, the<br />
energy had systematically lower price comparing to the prices in other parts of the world. [6]<br />
Fiscal revenue linked to energy taxation (percentage and total fiscal revenue)<br />
Data on percentage of energy taxation to the total fiscal revenue are not available.<br />
Fiscal planning and management is difficult due to decentralized government structure: 94%<br />
of total budget consumption goes to entity and lower levels, while in Federation of B&H 55%<br />
of budget consumption goes to Cantonal and municipality levels, and in RS 22% of the<br />
consumption goes to the municipality level.<br />
Entity governments adopted mid-term framework of expenditures for period 2004 - 2006. The<br />
Program of Fiscal Reform in BiH in total is basically consistent with the mid-term framework<br />
of expenditures of each of Entity.<br />
From the document Strategy of industrial policy of REPUBLIC of SRPSKA issued by Ministry<br />
of industry and technology of RS in Banja Luka, in September 2000, we can find out the<br />
following:<br />
The stable fiscal system and the budget balance have positively influenced the industry<br />
development in Republic of Srpska. Entities have the source revenue (taxes, fees, custom<br />
duties and excise) and take over also the obligations on basis of public revenues. However,<br />
the filling out of budget does not satisfy the needs of budget users. Also, many economy<br />
stakeholders for current activities ask for assistance from the budget. The stability of fiscal<br />
policy and balance of tax basis will contribute to the faster development of industry in entire<br />
B&H. In that sense, the introduction of VAT can positively influence the situation (the way<br />
that tax has been calculated in the most of European countries).<br />
For example, total public expenditures in Federation of B&H in 2005 was 1,031.9 millions of<br />
KM (BAM).<br />
Only 4.4% of budget expenditures relate to incentives for agriculture, industry, mining and<br />
veterinary, what is somewhat more then in 2000.<br />
With the aim to creating a model of future cooperation with the EU in the field of fiscal policy<br />
in B&H, the economy fiscal programs for B&H should be prepared in 2006.<br />
Share of the total investment in the country, and of the total industrial investment<br />
Table 17 Share of energy sector in total investment according to the nature of construction technical<br />
structure and purpose in million dinars<br />
Total<br />
investments<br />
in B&H<br />
Investment in<br />
industry and<br />
mining<br />
Investment in<br />
energy sector<br />
Share in total<br />
investment in the<br />
country<br />
Share in industry<br />
investment<br />
1970 6, 312 2, 528 770 12.19 30.45<br />
1978 44, 179 22, 088 8, 903 20.15 40.30<br />
1984 190, 782 105, 360 38, 093 19.96 36.15<br />
Source: Statistical Yearbook of SR B&H for 1985<br />
Table 18 Share of energy sector in total investment in 1990 according to the nature of construction<br />
technical structure and purpose in thousands of dinars:<br />
Total<br />
investments in<br />
B&H<br />
Investment in<br />
industry and<br />
mining<br />
Investment in<br />
energy sector<br />
Share in total<br />
investment in the<br />
country<br />
Share in industry<br />
investment<br />
1990 14, 562, 845 5, 173, 353 2, 090, 697 14.35 40.41<br />
Source: Statistical Yearbook of SR B&H for 1992<br />
There are no statistical data for the investments in post-war period. There are only data of<br />
given international donations and credits for the reconstruction of energy sector.<br />
103
104<br />
ENERGY AND SUSTAINABLE DEVELOPMENT IN THE MEDITERRANEAN<br />
The main objective of the Electric power reconstruction project «Power III» for B&H is<br />
continuation of the Program of post-war reconstruction of energy sector of B&H, enabling of<br />
continuously supply of electricity with lower prices, reducing negative impacts on<br />
environment, as well as whole reform of the power sector.<br />
Led by the World Bank, Power III involves total financing of about US$ 234 million and<br />
includes contributions from the World Bank, the EBRD, the European Investment Bank, the<br />
European Commission, and bilateral donor countries including the US, Switzerland, Norway,<br />
Spain, the UK and Italy. Power III is project that is also known under the name of Third<br />
Electric Power Reconstruction Project, which is being implemented under the Stability Pact's<br />
"Quick Start" programme.<br />
Electric Power Reconstruction Project of EBRD has aim of Supply and installation of a<br />
SCADA/EMS system for the electricity transmission network in the Federation of Bosnia and<br />
Herzegovina and Republika Srpska. Following the signing of this loan in November 2000, a<br />
further loan of €20 million for environmental investments at four thermal power plants (Tuzla,<br />
Kakanj, Gacko and Ugljevik) is being considered. The project will re-establish Bosnia and<br />
Herzegovina's interconnection with the Union for the Coordination of Transmission in Europe<br />
(UCTE), thereby increasing and facilitating power trade in the region. It will also help reduce<br />
environmental pollution in the region through investments in four power plants.<br />
Currently, the realization of all components of Project III is intensively ongoing within the RS<br />
and Elektroprivreda RS. Total estimate value of Project III for all three Elektroprivredas<br />
(electricity management companies) in B&H is 231 million of US$, out of what more than 1/3<br />
is for Elektroprivreda of RS.<br />
EBRD has provided a €50 million sovereign loan to improve and integrate the country's electricity<br />
network. The loan is a continuation of the EBRD's Emergency Power System Rehabilitation Project,<br />
which supplied essential power to the country's big cities, as well as small and remote villages,<br />
following the end of the war. It is also part of the Power III.<br />
Power Distribution Reconstruction Project of EBRD is aiming at modernising the electricity distribution<br />
systems of three regional utilities in Bosnia & Herzegovina, enabling the three local power utilities (or<br />
“Electroprivredas”) to improve the reliability of electricity supply and to increase energy efficiency by<br />
minimising losses of electricity. The Borrower, the State of BiH will on-lend to the three<br />
Electroprivredas that will implement the project on their own territories. Bank’s funding will be used for<br />
the supply and installation of new metering equipment, protective cables and for the rehabilitation of<br />
substations [7].<br />
In RS, in the period of post-war reconstruction and reconstruction of power structures, the<br />
implementation of donation and credits for restoration and reconstruction of power energy structures<br />
including the end of 2002 was 174,136,395 KM in total, out of what 32,511,443 were credit funds, and<br />
the rest are the funds from different donators in the amount of 141,624,952 KM [8].<br />
Infrastructures: number of refineries, of power stations, length of the electricity<br />
network...<br />
Coalmines and Power stations: There is only exploitation of brown coal and lignite. In Tuzla<br />
basin (Kreka, Banovići and Đurđevik), Central Bosnia basin (Kakanj, Zenica and Breza), and<br />
Ugljevik and Gatački basin, more then 80% of coal has been produced in B&H, on which basis<br />
the large thermo power systems have been constructed. Presently, there are approximately 30<br />
coalmines in operation. Thermal power plants have been built in the direct or close proximity to<br />
those areas in Gacko, Ugljevik, Tuzla and Kakanj. The mines are dependent on power plants<br />
as the only consumers of coal. In return, the power plants supply the coalmines with electricity.
BOSNIA & HERZEGOVINA - – National study<br />
Figure 1 The mines and thermo-power plants in B&H<br />
Today, in B&H there are three separated vertically organized companies that are in charge<br />
for production, transmission and distribution of electricity.<br />
Elektroprivreda B&H with head office in Sarajevo (EPB&H)<br />
Elektroprivreda of Croatian Community of Herceg Bosna with head office in<br />
Mostar (EPCCHB)<br />
Elektroprivreda of Republic of Srpska with head office in Trebinje (EPRS)<br />
Besides, there are also newly established state level Transmission Company Transco in<br />
Banja Luka, then newly established Independent System Operator (ISO) and also State<br />
Regulatory Power Commission (SRPC) in Tuzla. The production capacities per companies in<br />
B&H are the following: [4]<br />
Table 19 The electricity production capacities per companies in B&H<br />
EPB&H EPCCHB EPRS TOTAL<br />
Total capacity in 1,849 or 47%of 762 or 19% of B&H 1,346 or 34% of<br />
3,957<br />
MW<br />
B&H total<br />
total<br />
B&H total<br />
HPP (without small<br />
HPP)<br />
492 or 26% 762 or 100% 746 or 55% 2,000 or 51%<br />
TPP 1,357 or 74% 0 or 0% 600 or 45% 1,957 or 49%<br />
Source: <strong>Plan</strong> for construction of new power production capacities in FB&H<br />
Length of electricity network: The B&H high-voltage system consists of 992 km of 400 kV<br />
transmission line, 1,691 km of 220 kV transmission line, and 3,680 km of 110 kV<br />
transmission line. Total transforming capacity in 134 high-voltage substations is 12,013 MVA.<br />
[7].<br />
System of gas supply: The main features of the gas system in BiH are: length of 191 km<br />
and the projected annual capacities of 1 billion m 3 . The existing leased transport capacities to<br />
BiH are 750 million m 3 /year, and the takeover pressure of incoming natural gas from<br />
receiving-distribution gas station in Zvornik is 26 bars.<br />
105
106<br />
ENERGY AND SUSTAINABLE DEVELOPMENT IN THE MEDITERRANEAN<br />
Figure 2 The gas supply system in B&H<br />
Refineries: The first basic capacity is Petroleum refinery in Bоsаnski - Srpski Brоd, which<br />
processes the import raw petroleum into the derivates – engine fuels, LPG and numerous<br />
other products, especially for needs of civil engineering and road construction. Capacity of<br />
Petroleum refinery is approx. 3 millions of tons per year. The second capacity is Refinery of<br />
engine oils and lubricants in Моdriča, which is technological continuation of processing and<br />
refinement of products from Petroleum Refinery in Brоd.<br />
Installed capacity of Oil refinery in Modriča is 80, 000 tons of engine oil and 50, 000 tons of<br />
lubricants [9].<br />
2.1.2 National energy resources and potential saving<br />
Fossil energy resources:<br />
Coal<br />
It has been estimated that total coal reserves in Bosnia and Herzegovina are:<br />
a) Brown coal 1,886 millions of tons<br />
b) Lignite 3,578 millions of tons<br />
What gives total of 5,464 millions of tons. [4].<br />
Oil and gas<br />
Preliminary research surveys of oil and gas, which were interrupted by the war, had indicated<br />
the presence of promising deposits on a number of sites in certain areas of BiH. Information<br />
about this research is not publicly available (although the off-balance sheet reserves are<br />
estimated at about 50 million tons of oil, and less than 10 percent of potential deposits has<br />
been surveyed) and it is not known what the future plans are regarding exploration of oil<br />
deposits. Depending on the results of the preliminary research, these should continue, but,<br />
for now, liquid fuels and natural gas need to be imported [3].<br />
2.1.3 Potentials of renewable energies<br />
Potential for exploitation of geo-thermal energy, wind energy, solar energy and bio-mass<br />
energy have not been sufficiently explored, but the share of these energy sources in the<br />
overall consumption will certainly remain modest, as is the case in the world, where it is<br />
projected that in 2020 the share of all renewable sources (including hydro-power, which<br />
holds the most significant share) will amount to about 7,7 percent. However, the increased<br />
use of renewable sources of energy in the world is significant and their potential and<br />
feasibility of their use is going to be analyzed in B&H within the document of national strategy<br />
which is being drafted within EU CARDS program called “Technical assistance for<br />
strengthening of energy sector within Ministry of Foreign Trade and Economic Relations of<br />
B&H”.
BOSNIA & HERZEGOVINA - – National study<br />
Further in text the data can be found that are available in this moment at the level of B&H<br />
from the available sources. [5]<br />
Wind potential<br />
Due to insufficient measurements it is impossible to estimate the energy potential of wind in<br />
B&H in this moment. In a preliminary study carried out on behalf of the GTZ (Deutsche<br />
Gesselschaft fur Technische Zusammenarbeit) from Germany it was established that there is<br />
an economic potential of approx. 600 MW that could be developed by 2010, on the<br />
assumption that an appropriate incentive system to build wind power installation is set up.<br />
There are promising wind values shown by measurements taken before the war for the<br />
region of Trebinje through Mostar to Bugojno, and more up-to-date measurements in Kupres<br />
and Podveleţje, with average speed of 10 m/s.<br />
Solar energy<br />
The annual average of daily-allocated Sun energy on horizontal surface of B&H is 3.4-4.4<br />
kWh/m2. At 1 m2 of horizontal surface, the Sun radiates to about 1,240 kWh/year of energy<br />
in the north of B&H and about 1, 600 kWh/year in the south of B&H. Theoretical potential of<br />
solar energy in territory of B&H is 74.65 PWh per year and technical potential is 685 PJ. [5]<br />
Hydroenergy<br />
Economic hydro energy potential of large watercourses in B&H according to Study “Current<br />
knowledge of hydro energy potential of SRB&H” done by Institute of energy management<br />
Sarajevo in 1986, is approx. 18,600 GWh/year. Total usage of that potential is about 40% or<br />
7,182 GWh/year.<br />
However, a large part of this hydro energy potential is permanently lost due to spatial,<br />
ecological and economic limitations, which were result of the past period.<br />
Besides hydro energy potential of large watercourses, B&H also abounds with hydro energy<br />
potential of smaller watercourses on which large number of small hydro power plants could<br />
be built. It has been estimated that such potential is 12% of total hydro energy potential of<br />
large watercourses [4].<br />
The latest report of EBRD [2] states that theoretical hydro potential in B&H is 99,256<br />
GWh/year and technical hydro potential is 23,395 GWh/year out of what 2,599 GWh/year is<br />
in small HPP.<br />
Biomass<br />
There is considerable potential for the use of biomass for energy generation in the forestry<br />
sector (roughly 50% of the land area of B&H is wooded) and in the agriculture. According to<br />
a study conducted by INNotech HT GmbH, Berlin, Germany in 2003 on behalf of the GTZ,<br />
there is an unexploited potential of approx. 1 million m3/a of residual wood, wood waste etc<br />
which could be used to provide heat to 130,000 residences or 300,000 inhabitants.<br />
There is ongoing project within FP6 program of EU where Mechanical Faculty of Sarajevo<br />
participates (together with partners from Greece, Germany, Portugal, Croatia and Serbia),<br />
within which the potential of biomass would be estimated.<br />
Geothermal energy<br />
Hydrothermal deposits of low enthalpy were located in 9 hydrothermal regions in B&H.<br />
Utilization and usage is about 5% [5].<br />
According to some studies geothermal potential is 33 MWth. It must be said though, that the<br />
temperature at three known locations in Bosanski Šamac (85°C), Kakanj (54°C) and<br />
Sarajevo (58°C) is too low for electricity generation, which is why the reserves are currently<br />
only under the consideration for thermal exploitation. [10].<br />
2.1.4 Estimate of the potential energy saving<br />
According to the estimates for 2000, the households and the commercial sector in BiH<br />
accounted for 50 percent, the industry for 25 percent and the transport for 25 percent of the<br />
107
108<br />
ENERGY AND SUSTAINABLE DEVELOPMENT IN THE MEDITERRANEAN<br />
total energy consumption. Therefore, the share of households and the commercial sector in<br />
the consumption of energy is the highest. The energy consumed by the households and the<br />
commercial sector is used (predominantly) for heating (water heating and treatment, cooking,<br />
illumination and electrical appliances and equipment.<br />
The reduced energy consumption in this segment can be partly achieved by introduction of<br />
district heating. Most of the current systems do not achieve the satisfactory effects, partly<br />
due to inadequate maintenance, and partly because there are no instruments for measuring<br />
individual heat consumption of consumers. The possibilities of combined production of heat<br />
and electric power, an option that is convenient for larger buildings or groups of buildings, are<br />
also underutilized. Because of its efficiency, the district heating saves fuel, and also<br />
contributes to reduced emission of CO2. The district heating systems can be used in<br />
hospitals, hotels, recreational and trade centres, and other larger public facilities, particularly<br />
those where the natural gas can be used as a fuel.<br />
In addition, taking into account that the largest share of energy is used for heating, and that<br />
the relative consumption of energy for heating in BiH is much higher than in the EU countries<br />
(according to the assessments made in the EU countries, at least one fifth of the energy<br />
consumed in households and commercial sectors is “easily savable”), and, obviously, there<br />
is a lot of room to reduce the energy consumption in this area. The methodology for<br />
designing energy performance indicators in buildings, used in Bosnia and Herzegovina, is<br />
mostly outdated and the revision of methodology would assist in both achieving energy<br />
savings in the buildings and reducing the investments for energy infrastructure in newly<br />
constructed buildings. This could also have an important role in the reconstruction, i.e.<br />
restoration of buildings.<br />
In the transport sector, significant changes need to be made with respect to energy demand,<br />
especially taking into account that the primary source of energy used is imported oil, i.e.<br />
petroleum products. For this reason, ways to increase the share of rail transport relative to<br />
road transport, which would allow for a greater use of domestic energy sources, should be<br />
considered.<br />
The possibilities for energy savings in the industry sector are also considerable. Most<br />
industries treat energy as tangible cost and include the energy cost in the final price of the<br />
product, which does not promote energy savings. The cost of energy should be registered<br />
separately, compared with the energy costs in the same activities in the developed<br />
economies, and measures should be taken to rationalize the consumption. Subsidies could<br />
present an effective solution for such measures. Generally, the awareness about the savings<br />
that could be achieved with the increased energy consumption efficiency should be raised.<br />
Energy savings require investments, but these investments pay off quickly [3].<br />
The existing legislation and tax policy do not stimulate the energy saving (e.g. more rational<br />
construction of heating and cooling systems, greater use of construction insulation materials<br />
etc.).<br />
Institutional specificities and energy policies<br />
On the state level there is no Ministry for energy but the necessity to have some competence<br />
on the state level regarding energy sector was recognized and now Ministry of Foreign Trade<br />
and International Relations is responsible for energy at the state level. Special energy<br />
department is in establishing phase in the scope of this Ministry. Ministry of Foreign Trade<br />
and Economic Relations is responsible for policy formulation and for the international policy<br />
of Bosnia and Herzegovina in the energy sector. The Department for Energy within this<br />
Ministry is responsible for preparation of national energy strategy and policy. The role of this<br />
sector is to maintain contacts with all energy stakeholders in the country, including also the<br />
international community.<br />
Also, this department has a role of coordinator between Entity ministries responsible for<br />
energy and State Government and between international donators and institutions giving<br />
loans and its Consultants working in B&H.
BOSNIA & HERZEGOVINA - – National study<br />
In Federation of BiH Ministry of Energy, Mining and Industry is responsible for energy. All ten<br />
cantons have some ministries responsible for energy.<br />
In Republic of Srpska Ministry of Energy and Mining is responsible for energy in the Republic<br />
of Srpska.<br />
The Law on Electric Power Transmission, System Regulator and Operator of B&H (Of.<br />
Gazette of B&H, No.7/02, 13/03) entered into force on 18 April 2002 and represents the first<br />
step in realization of aims of energy sector reform. The idea of this Law is to make conditions<br />
for unlimited and free trade and continuously supply of electricity according to defined<br />
standard for quality. The intention of this Law and also Entity Laws on Electricity (Law on<br />
electricity in FB&H – Of. Gazette of FB&H 41/02, 24/05, 38/05, as well as Law on Electricity<br />
of RS-Of. Gazette of RS 66/02, 29/03, 86/03, 111/04 and law on Electricity of Brčko District-<br />
Of. Gazette of BD, No.36/04) is to enable and speed the establishment of electricity market<br />
in B&H, integration into the regional market, introduction of the competition and<br />
strengthening the buyer protection.<br />
The Law on Electric Power Transmission, System Regulator and Operator specifies the<br />
institutions of Bosnia and Herzegovina in charge of electricity transmission:<br />
State Electricity Regulatory Commission (Drţavna regulatorna komisija za električnu<br />
energiju - DERK), has jurisdiction over and is responsible for power transmission,<br />
transmission system operations and international trading in electric power. DERK is to be<br />
an independent and non-profit institution, which will operate on the basis of principles of<br />
objectivity, transparency and equality.<br />
Independent System Operator -ISO (Neovisni operator sistema - NOS), is responsible<br />
for the management of the transmission network operating and dispatching in Bosnia and<br />
Herzegovina and for the governing, maintenance planning and coordination, network<br />
construction and expansion in cooperation with the elektroprivredas. NOS will be a nonprofit<br />
agency, independent from any individual the market participant and from electricity<br />
production, distribution and supply activities. ISO shall not venture into trading with<br />
electricity, keeping its independence and authority, and the owners of the Electricity<br />
Transmission Company will devolve all relevant responsibilities for the management of the<br />
system to ISO. ISO will operate in line with objectivity, transparency and equality principles<br />
and will have full authority to coordinate the electric power transmission system.<br />
Single Power Transmission Company is responsible for the transmission, maintenance,<br />
construction, expansions and the management of the electricity transmission network.<br />
With the new Law on establishment of Power Transmission Company in B&H (Of. gazette<br />
B&H No. 35/04) the conditions were created from 1 February 2006 for the entire asset of<br />
high-voltage transmission power network to be transferred to the single newly established<br />
Power Transmission Company (Transco) with the head office in Banja Luka. However, the<br />
production and distribution stayed in the competency of electric power enterprises<br />
described below.<br />
Electric Power has been produced in B&H in hydro and thermo power plants.<br />
In BiH, there are at present three vertically integrated electricity monopolies in charge of the<br />
generation, transmission and distribution:<br />
Elekroprivreda BiH (Electric Power Enterprise) of Bosnia and Herzegovina (EPBiH);<br />
Elektroprivreda (Electric Power Enterprise) of the Croatian Community Herzeg-Bosnia<br />
(EPHZHB); and<br />
Elektroprivreda (Electric Power Enterprise) of the Republika Srpska (EPRS).<br />
For the market to become functional gradually and for the competition to be introduced,<br />
electric power suppliers’ freedom of choice will be limited to qualified consumers and<br />
independent electric power traders, who will be able to purchase power directly from<br />
production or trading companies. There will be three categories of qualified consumers:<br />
Qualified Consumers (QC): In the beginning, this category will include major industrial<br />
consumers, who will have a right to a free selection of their power supplier. While the<br />
109
110<br />
ENERGY AND SUSTAINABLE DEVELOPMENT IN THE MEDITERRANEAN<br />
qualified consumers purchase power directly form the producers, the role of transmission<br />
and distribution will include only the delivery of the purchased power;<br />
Regional Electricity Traders (RET): RETs are fully separate trading operations of the<br />
distribution companies, empowered to purchase power from anyone. A RET will be able to<br />
purchase power from the production company or to contract a delivery from another RET<br />
or from independent traders.<br />
Independent Retail Traders will be companies with the exclusive function of buying and<br />
selling electric power to the qualified consumers and other power traders.<br />
Coal sector<br />
The coal sector comprises 15 separate organizational units, many of which manage several<br />
separate mines. There are not either forms of horizontal or vertical integration between the<br />
mines, or any shared infrastructure, market or any other links.<br />
In BiH there are two types of mines:<br />
Mines supplying coal for thermal power plants<br />
Mines working for the general market (market competition).<br />
In both entities, the competences for the mines lie with the line ministries<br />
The FBiH Ministry of Energy, Mining and Industry and<br />
RS Ministry of Economy, Energy and Development.<br />
The Federation of B&H and Republika Srpska own the coalmines. In Republika Srpska, the<br />
mines are embedded in the power plant operation while in the Federation they are separate<br />
companies yet closely operating with the power plants.<br />
Natural Gas sector<br />
All natural gas is imported from the Russian Federation and is transported to BiH via the gas<br />
transport systems in Ukraine, Hungary and Serbia and Montenegro.<br />
The legal and institutional framework in this sector is still non-existent, which prevents any<br />
foreign investment and any development of gas sector.<br />
Just like the entire energy complex in the post-war BiH, the gas sector is also in the<br />
competence of the entities and this structure is at the root of all problems in the sector. It<br />
could be said that, out of the three predominant segments of the energy sector (electric<br />
power, liquid fuels and gas), the gas sector is the least developed. The existing gas sector of<br />
BiH comprises four companies, two in each entity:<br />
In RS:<br />
Gaspromet Pale (manages the transmission line Karakaj - Zvornik - approximately 20<br />
km)<br />
Sarajevogas Lukavica (transmission line Zvornik - Kladanj and distribution in the<br />
municipality of Srpsko Sarajevo)<br />
In FBiH:<br />
BH Gas - Sarajevo (transmission lines Kladanj - Sarajevo - Zenica, the biggest postconflict<br />
supplier and gas wholesaler in Bosnia and Herzegovina)<br />
Sarajevogas - Sarajevo (gas distribution in Sarajevo)<br />
Although it no longer formally conducts the transport and distribution of gas, the<br />
Energoinvest Sarajevo needs to be added to the above list of entities (until the outbreak of<br />
the war, Energoinvest Sarajevo managed the entire gas system in BiH and was the exclusive<br />
gas supplier for the territory of BiH). Because of outstanding debts from the period before<br />
and during the war, and the obligations under long-term contracts with Russian suppliers,<br />
this company continues to be a major player on the complicated BiH gas market.
BOSNIA & HERZEGOVINA - – National study<br />
The international processes where B&H is actively participating, first of all the process of<br />
establishment of Energy Community of South East Europe, will have great impact on the gas<br />
sector organization as well as on the development of gas infrastructure in B&H.<br />
Oil sector<br />
In the existing BiH economic structure, the oil industry sector encompasses imports and<br />
refining of imported crude oil and production of petroleum products.<br />
The BiH oil sector developed production and transport capacities.<br />
The production segment comprises production organized in two refineries within the<br />
’’NIRS’’ (Naftna industrija RS – RS Oil Industry) Company. The first, basic capacity is the oil<br />
refinery in Bоsаnski - Srpski Brоd, where imported crude oil is refined into various products -<br />
mоtоr fuels, liquid petroleum gаs and a range of others, especially those for the needs of<br />
construction and road construction. The second of these capacities is the Refinery of Motor<br />
Oils and Lubricants in Моdriča, which is essentially the next technological stage in the<br />
processing and refining of the Brod refinery products. This refinery produces high–quality<br />
motor oils, as well as various special purpose technical oils for the industry and for other<br />
industrial and commercial purposes, paraffin and various motor and other lubricants for<br />
industry, and especially transport, as well as for households.<br />
The installed production capacities are used at the level of around 25 percent of the pre–war<br />
production. The commercial sphere in Bosnia and Herzegovina comprises the oil products<br />
distribution capacities, especially for motor fuels, oils and lubricants. In both entities, there<br />
are two major State–owned distributors, but small private distributors cover the greatest<br />
share of the market.<br />
After the war, the oil sector legislation was passed neither at entity nor at BiH levels. The<br />
Yugoslav regulations dating back to the 1980s on transport and management of fuels, gas<br />
and inflammable substances, as well as the applicable rule books on storage and transfer of<br />
highly inflammable substances are still in force. In regulating the rights of the production in<br />
the oil industry and in performing other related activities, the entity ministries of energy and<br />
their inspectorates have the main role.<br />
2.1.5 Recent evolution in energy strat egy<br />
B&H signed the Treaty on establishment of Energy Community of South East Europe on 25<br />
October 2005 in Athens, Greece. Treaty already should have been entered into force in June<br />
2006, after the ratification process by 6 signatory countries. After the ratification process<br />
which is soon expected, B&H will be obliged to, inter alia, implement Acquis Communautaire<br />
of EU on energy, environment, competition and renewables.<br />
BiH is a member of the Energy Charter Conference and signatory of the Energy Charter<br />
Treaty (ECT) and the Protocol on Energy Efficiency and Related Environmental Aspects<br />
(PEEREA), which was signed in London in December 1994 along with the Treaty. B&H<br />
participated in the Review of the Energy Charter Process, which was concluded in December<br />
2004, and its implementation thereafter.<br />
As already mentioned above regarding the preparation of national energy strategy, there is<br />
ongoing the EC CARDS Project “Technical assistance for strengthening of energy sector<br />
within Ministry of Foreign Trade and Economic Relations of B&H” which started 6 February<br />
2006 and is planned to be finished on 5 February 2008.<br />
Within the document of National energy Strategy that will be prepared within this project, also<br />
the strategies for each energy sub-sector will be prepared separately (coal mining,<br />
petroleum, natural gas, electric power sector, district heating sector, renewable energy sector<br />
and energy efficiency and energy conservation issue).<br />
In parallel with this project, there is also ongoing the preparation of detailed energy study<br />
analysis in B&H by World Bank as assistance to B&H according to the plans of the signed<br />
Treaty on energy community of SEE countries which results will help in preparation of the<br />
national strategy. The preparation of the study started 1 July 2006, and foreseen completion<br />
is 30 June 2007.<br />
111
112<br />
ENERGY AND SUSTAINABLE DEVELOPMENT IN THE MEDITERRANEAN<br />
2.2 Energy S u pply, Dema n d and Produc ti o n: evo luti on and<br />
s tr uc tu re<br />
2.2.1 Electricity access<br />
Production of the electricity in 1990 in B&H was 12,613 GWh. The consumption was<br />
11,535 GWh. The system was consisted of 13 hydro power plants with total capacity of<br />
2,034 MW and annual production of about 5,500 GWh per year and of 4 thermo power plants<br />
with total of 15 blocks with the capacity of 1,957 MW and with production of 9,678 GWh in<br />
1990. All power energy system capacities were part of one company Elektroprivreda B&H<br />
which also was operating with the system.<br />
The restoration of the power energy system after the war enables the achievement of the<br />
total production in B&H in 2003 of 11,257 GWh per year (89% from the 1990 level), and the<br />
consumption in 2003 was 10,407 GWh (90% compared to 1990).[3]<br />
The drop is attributed mainly to the sharp decline in industrial output and in general economic<br />
activity.<br />
Data on electricity access of the population in rural areas are not available for period of 1990.<br />
Objective of indicator: halving the proportion of the populations with no access to electricity<br />
in the concerned rural areas up to 2015 (comparing to 1990).<br />
In 1999, the three statistical organizations in B&H (State Agency for Statistics for B&H, the<br />
RS Institute of Statistics-RSIS, and the FB&H Institute of Statistics-FIS) began work on the<br />
design of a Living Standards Measurement Study Survey (LSMS) to collect data needed for<br />
assessing the living standards of the population and for providing the key indicators needed<br />
for social and economic policy formulation. The LSMS survey collected data from households<br />
and individuals concerning their overall welfare levels, including their access to electricity.<br />
Therefore, the 2001 Bosnia and Herzegovina Living Standards Measurement Study (LSMS)<br />
survey provides individual level and household level socio-economic data from 5,402<br />
households drawn from urban and rural areas in the two entities of Bosnia and Herzegovina,<br />
the Federation of Bosnia and Herzegovina and the Republic of Srpska.<br />
A probability sample of 5,400 households was selected and interviewed throughout the<br />
country: 2,400 in the RS and 3000 in the FB&H. The resulting data are representative at the<br />
state and entity level as well as by type of municipality: urban, rural, semi urban. To ensure<br />
the highest quality data, direct informants were used.<br />
Table 20 1999 data for the purpose of Indicator ENE_C10<br />
Indicator Source National level<br />
Rural areas<br />
Share of the<br />
population with<br />
no access to<br />
electrification<br />
LSMS Survey<br />
Module 2- done<br />
by three<br />
statistical<br />
organizations in<br />
B&H<br />
2.2.2 Evolution and structure of the energy demand<br />
Coal<br />
National level<br />
Rural areas<br />
(households) (population)<br />
0,65 % 0,47 %<br />
The authors of various studies offered different projections of the potential demand for coal in<br />
BiH by 2015. These projections range from 5 to 8.6 million tons for the FBiH, and from 3.2 to<br />
4 million tons for the RS, i.e. from 8.2 to 12.6 million tons for BiH. The coal demand of four<br />
thermal power plants is satisfied from the mines in their immediate vicinity. The thermal<br />
plants Kakanj and Tuzla are supplied by railway, trucks and transporters from several mines,<br />
and the thermal plants Gacko and Ugljevik are supplied by continuous conveyor, so that,<br />
besides economic links, there are also physical links between the mines and the thermal<br />
power plants. In all other mines, the production plan is based on the coal demand of the
BOSNIA & HERZEGOVINA - – National study<br />
traditional long-term consumers, with individual market offer and creation of competition in<br />
the market. [3]<br />
Natural gas<br />
With respect to the long–term projected gas needs, previous studies (as early as 1999, the<br />
World Bank financed the preparation of two studies on the reform and the development of<br />
the gas secotr in BiH: Study on Natural Gas Sector Reconstruction (NERA) and Study on<br />
Natural Gas Sector Development (RAMBOLL) analysed three different scenarios (high, low<br />
and basic) by comparing economic indicators with other countries and conducting separate<br />
analysis across all consumption sectors. The demand projections for all three scenarios are<br />
similar for both methods, and amount to 3 billion m3 for the high scenario, 2 billion m3 for the<br />
basic scenario and around 1.5 billion m3 for the low scenario, until 2020. In the case of low<br />
growth scenario, the energy policy would be based on the use of national energy sources,<br />
with partial use of gas where the domestic energy sources are thought non-competitive or<br />
technologically inappropriate. From the aspect of this study, this is what makes this particular<br />
scenario realistic and conceptually acceptable.<br />
Oil<br />
The demand for motor fuels on the domestic market in the present conditions is<br />
approximately 1.5 million tоns annually. The oil refinery delivers around 500,000 tons to the<br />
market, and the rest is imported. Considering that the number of private petrol stations is on<br />
the increase and has reached approximately 300 stations, objective estimates suggest that<br />
the commercial capacities in BiH market are already oversized. The present state on the BiH<br />
oil products market suggests not only inadequate usage of own production capacities, and<br />
large imports of such products, but also the problems of the frequent imports of cheap lowquality<br />
products, especially motor fuels. This situation needs to be urgently addressed and<br />
the relations on the market improved.<br />
2.2.3 Non commercial energy demand data<br />
During the war, there was a chaotic forest situation. Local experts evaluated the cutting and<br />
production range in forest industry in this period about 10 - 20% out of total pre-war planned<br />
production.<br />
Table 21 Cutting and processing of forest products in Bosnia and Herzegovina in 1990<br />
m 3<br />
%<br />
Total 4,310,000 100.0<br />
Industrial wood 3,167,000 73.5<br />
Technological wood 265,000 6.1<br />
Fuel-wood 878,000 20.4<br />
Source: GTZ Study for forestry sector in B&H<br />
During the war, wood was primarily used for heating as fuel-wood. And also after the war<br />
such use is significant, but presents the great danger due to large number of mines.<br />
Additionally, the illegal cutting of wood has been reported as well as related sale and<br />
uncontrolled export of wood of good quality abroad, because of what the supply of wood for<br />
private plants in Bosnia and Herzegovina has been difficult and opportunities for usage of<br />
value transferred abroad.<br />
Although the forest and wood industry are not in State jurisdiction, the actual legislation does<br />
not permit the log export [13]. It was possible to find statistics data only for the below given<br />
period.<br />
Table 22 Fuel-wood consumption in industry in stacked cubic meter<br />
1970 1972 1974<br />
Fuel-wood 8,586 173,908 84,007<br />
Source: Statistical Yearbook of SRB&H of 1975 and<br />
113
2.2.4 Demand for electricity<br />
114<br />
ENERGY AND SUSTAINABLE DEVELOPMENT IN THE MEDITERRANEAN<br />
Before the war, the power sector organization in Bosnia and Herzegovina was related to only<br />
one company and that is Elektroprivreda B&H.<br />
Table 23 Total demand for the period 1990-2005 of Elektroprivreda BiH<br />
Year Total demand of Elektroprivreda Total demand of Elektroprivreda<br />
B&H in GWh<br />
B&H in TWh<br />
1990 7,490 7.49<br />
1991 7,466 7.47<br />
1992 3,264 3.26<br />
1993 1,235 1.23<br />
1994 1,552 1.55<br />
1995 1,788 1.79<br />
1996 2,831 2.83<br />
1997 4,299 4.30<br />
1998 5,222 5.22<br />
1999 5,258 5.26<br />
2000 6,069 6.07<br />
2001 5,427 5.43<br />
2002 5,919 5.92<br />
2003 5,701 5.70<br />
2004 6,618 6.62<br />
2005 6,237 6.24<br />
Source: Elektroprivreda B&H<br />
Today we have two more electricity companies in the territory of Bosnia and Herzegovina<br />
and those are:<br />
Elektroprivreda (Electric Power Enterprise) of the Croatian Community Herzeg-Bosnia<br />
(EPHZHB)<br />
Electricity demand data of EPHZHB is not available.<br />
Elektroprivreda (Electric Power Enterprise) of the Republika Srpska (ERS), established on<br />
2 nd of June 1992, for production, transmission and distribution of electricity and coal, as<br />
well as for the management for the electric power system in Republika Srpska.<br />
Elektroprivreda of Republika Srpska gives the information that the production of electricity<br />
currently satisfies the demand in Republic of Srpska, and part of the electricity has been<br />
exported.<br />
2.2.5 The final relative consumption percentage per sector in GWh<br />
Table 24 Final relative electricity consumption per sector in GWh<br />
1971 1975 1981 1985 1986 1987 1988 1989 1990 1991<br />
Industry and<br />
mining<br />
2,332 2,929 5,062 6,927 7,286 7,203 6,928 7,523 6,657 6,314<br />
Households 740 1,357 2,239 2,570 2,743 2,950 2,897 2,980 3,187 3,120<br />
Electrical and<br />
rail traction<br />
- 108 145 163 171 177 195 189 170 179<br />
Trams 14 - 19 28 29 31 32 32 37 39<br />
Source: Statistical Yearbook for 1993-1998, Federal Institute for Statistics<br />
Table 25 Final relative electricity consumption percentage per sector<br />
1971 1975 1981 1985 1986 1987 1988 1989 1990 1991<br />
Industry and<br />
mining<br />
68.9 61.7 62.0 66.2 66.6 61.8 55.7 62.3 53.0 49.3<br />
Households 21.9 28.6 27.4 24.6 25.1 25.3 23.3 24.7 25.3 24.4<br />
Electrical and<br />
rail traction<br />
- 2.3 1.8 1.6 1.6 1.5 1.6 1.6 1.3 1.4<br />
Trams 0.4 - 0.2 0.3 0.3 0.2 0.3 0.3 0.3 0.3<br />
Source: Statistical Yearbook for 1993-1998, Federal Institute for Statistics
BOSNIA & HERZEGOVINA - – National study<br />
Table 26 Consumption of coal in industry in SR B&H in thousands of tons<br />
Year Brown coal Lignite Stone-coal Coke Anthracite<br />
1970 2,086 1,904 1,720 793 8<br />
1972 1,967 2,772 1,706 792 42<br />
1974 2,317 3,704 1,744 720 67<br />
1978 435 238 - 27 17<br />
1982 875 491 - 36 0.439<br />
1991 119 49 - 30 -<br />
Source: Statistical Yearbook of SRB&H for 1975, 1983 and 1992<br />
Table 27 Consumption of oil derivates for industry purpose in SRB&H<br />
Year Liquid fuels in Fuel oil in<br />
tons thousands of tons<br />
1970 29,584 180<br />
1972 32,030 301<br />
1974 44,175 361<br />
1978 72,426 520<br />
1982 242,217 411<br />
1991 138,020 174<br />
Source: Statistical Yearbook of 1975, 1983 and 1992<br />
The estimated consumption of crude oil and products in B&H in 2005 is about 25,000 barrels<br />
per day.<br />
Table 28 Consumption of gas for industry purpose in SRB&H<br />
Year Natural gas in m 3<br />
Liquid gas in tons<br />
1970 - -<br />
1972 - -<br />
1974 - -<br />
1978 80,000 58,226<br />
1982 255,777,000 34,272<br />
1991 287,587,000 36,933<br />
Source: Statistical Yearbook of 1979, 1983 and 1992<br />
The overall gas consumption in B&H ranged on the level of approx. 400 millions of m3 in<br />
1979 ÷ 1984, and the peak consumption was in 1990, when it was 610 millions of m3. In the<br />
period 1992 - 1999 the natural gas consumption has been reduced. In the last few years the<br />
natural gas consumption has been gradually increasing, primarily thanks to the increasing of<br />
the consumption in industrial sector, as well as extension of the distribution network.<br />
Table 29 Energy consumption per inhabitant on Level of Bosnia and Herzegovina<br />
Annual energy consumption per<br />
inhabitant<br />
Total primary<br />
energy supply<br />
Population<br />
Unit Years Mtoe/inhabitant Mtoe Million<br />
1996 0,550 1,72 3,13<br />
1998 0,517 1,95 3,77<br />
1999 0,518 2,01 3,88<br />
Sources: International Energy Agency<br />
Post-war consumption of gas for B&H is at level of up to 200 millions m3. There is no data for<br />
consumption of gas per sector.<br />
According to data of Chamber of Commerce of B&H, from 1997 to 2001, the average<br />
consumption of oil derivates in B&H ranges about 1.2 millions of tons /year.<br />
The main consumers of the final forms of energy are households and the commercial sector<br />
(often considered as one consumer category), the industry and the transport sector. The<br />
share of individual consumer groups varies depending on a number of factors, climate being<br />
one of the most important.<br />
According to the estimates for 2000, the households and the commercial sector in BiH<br />
accounted for 50 percent, the industry for 25 percent and the transport for 25 percent of the<br />
115
116<br />
ENERGY AND SUSTAINABLE DEVELOPMENT IN THE MEDITERRANEAN<br />
total energy consumption. Therefore, the share of households and the commercial sector in<br />
the consumption of energy is the highest. The energy consumed by the households and the<br />
commercial sector is used (predominantly) for heating (water heating and treatment, cooking,<br />
illumination and electrical appliances and equipment.<br />
2.2.6 Evolution and structure of production<br />
Primary energy production per source<br />
The basic identified sources of primary energy in B&H are coal and hydropower.<br />
The coal, including coal for coking insured the greatest share of primary energy in Bosnia<br />
and Herzegovina in 1991.The coal insured 59% of primary energy, the liquid fuels share was<br />
26% and hydro-energy participated 7% in insurance of primary energy.<br />
Coal<br />
In 1990, the production in the mines in FB&H totalled approximately 12 million tons of coal,<br />
with approximately 27,000 workers. Two-thirds of the coal was produced in strip mines and<br />
one-third in subsurface mines. In the mines on the territory of the RS, the production in the<br />
same year was approximately 4 million tons of coal, and with over 95 percent of the coal<br />
produced in strip mines. In the post-war period (2001), the annual production of coal in FB&H<br />
was 5.5 million tons, and 3.3 million tons in RS. [3]<br />
There is more data available from other sources [9].<br />
Table 30 Coal production in B&H in thousands of tons<br />
Year Brown coal Lignite Total<br />
1972 5,741 5,250 10,991<br />
1978 6,433 5,613 12,046<br />
1980 7,221 6,104 13,324<br />
1981 8,099 5,781 13,880<br />
1982 8,117 6,277 14,394<br />
1985 9,820 7,989 17,809<br />
1987 9,476 8,892 18,368<br />
1989 9,615 8,359 17,974<br />
1991 6,663 7,450 14,113<br />
1992 2,402 1,628 4,030<br />
1993 763 607 1,370<br />
1994 925 676 1,601<br />
1995 1,112 663 1,775<br />
Source: Statistical Yearbook of FB&H of 1993-1998 and of SRB&H of 1992<br />
Table 31 Coal production in FB&H in tons<br />
Year Brown coal Lignite Total<br />
1996 1,414,963 772,259 2,187,222<br />
1997 1,942,573 1,318,004 3,260,577<br />
1998 2,392,379 1,720,028 4,112,407<br />
1999 2,414,913 1,409,516 3,824,429<br />
2000 2,759,212 1,590,074 4,349,286<br />
2001 2,762,962 1,666,484 4,429,446<br />
2002 3,246,119 1,826,663 5,072,782<br />
2003 3,295,517 2,123,542 5,419,059<br />
Source: Chamber of Commerce of FB&H<br />
Table 32 Coal production in RS in tons<br />
Year TPP Gacko TPP Ugljevik Total<br />
1998 1,412,425 1,816,675 3,229,100<br />
1999 1,719,776 1,538,977 3,384,169<br />
2000 1,738,874 1,224,613 2,963,487<br />
2001 1,745,089 1,174,746 2,919,835<br />
2002 1,305,648 2,444,171 3,749,819<br />
Source: Chamber of Commerce of RS
Electricity production per source<br />
BOSNIA & HERZEGOVINA - – National study<br />
Following the post-war reconstruction projects, total electricity production has been restored<br />
to 84 per cent of pre-war level. The sources of power are balanced between hydro and<br />
thermal (52 and 48 per cent respectively)[8].<br />
Table 33 Electricity production in B&H in power plants (1970-1996)<br />
Year Total in GWh In TWh<br />
1971 6,374 6.37<br />
1975 8,241 8.24<br />
1977 9,604 9.60<br />
1979 10,556 10.55<br />
1981 11,299 11.29<br />
1983 11,252 11.25<br />
1985 11,991 11.99<br />
1987 13,387 13.38<br />
1990 14,632 14.63<br />
1991 15,031 15.03<br />
1992 4,097 4.09<br />
1993 3,035 3.03<br />
1994 3,663 3.66<br />
1995 3,881 3.88<br />
Source: Statistical Yearbook of FB&H of<br />
1993-1998 and of SRB&H of 1992<br />
Table 34 Electricity production in FB&H (1993-2002)<br />
Year HPP TPP Total in<br />
GWh<br />
In TWh<br />
1996 2,652 1,301 3,953 3.95<br />
1997 3,090 1,955 5,045 5.04<br />
1998 3,124 2,509 5,633 5.63<br />
1999 2,893 2,990 5,884 5.88<br />
2000 2,614 3,895 6,509 6.50<br />
2001 3,191 4,062 7,253 7.25<br />
2002 2,427 4,844 7,272 7.27<br />
2003 2,508 4,648 7,156 7.15<br />
Source: Statistical Yearbook of FB&H of 2004<br />
Table 35 Electricity production in RS (1993-2002)<br />
HPP TPP Total in<br />
GWh<br />
In TWh<br />
1993 1,318.9 276.3 1,595.2 1.59<br />
1994 2,299.2 163.7 2,462.9 2.46<br />
1995 2,340.7 14.1 2,354.8 2.35<br />
1996 2,892.8 1,076.7 3,969.5 3.96<br />
1997 2,372.0 1,708.7 4,080.6 4.08<br />
1998 2,026.4 2,290.5 4,316.8 4.31<br />
1999 2,629.8 2,374.9 5,004.7 5.00<br />
2000 2,212.7 2,181.5 4,394.1 4.39<br />
2001 2,625.47 2,050.58 4,676.0 4.67<br />
2002 1,870.42 2,206.24 4,076.66 4.07<br />
Source: Chamber of Commerce of Republic of Srpska<br />
Table 36 Production of oil derivates in B&H in thousands of tons<br />
Year Petrol White spirit Diesel fuel Lubricants oils Fuel oil Bitumen<br />
1972 225 1,260 355 25 412 171<br />
1978 335 1,929 387 39 836 242<br />
1979 378 3,378 513 36 714 294<br />
1981 312 4,789 475 34 718 216<br />
1982 355 3,306 530 31 645 210<br />
1985 328 2,884 384 46 598 140<br />
1987 364 2,315 399 43 615 104<br />
1989 361 3,979 434 46 718 149<br />
1990 396 2,703 477 42 832 121<br />
1991 210 2,100 393 37 512 88<br />
1993 - No data - 2 No data No data<br />
117
118<br />
ENERGY AND SUSTAINABLE DEVELOPMENT IN THE MEDITERRANEAN<br />
Year Petrol White spirit Diesel fuel Lubricants oils Fuel oil Bitumen<br />
1994 - No data - 2 No data No data<br />
1995 - No data - 1 No data No data<br />
Source: Statistical Yearbook of SRB&H of 1983 and 1992<br />
The actual production in 2005 in Bosanski Brod refinery was just 135,349 tones per year,<br />
equivalent to about 2,800 barrels per day. That is only 3% of the refinery’s theoretical<br />
capacity, which is obviously a good indicator of Bosanski Brod’s financial problem.<br />
The Modriča lubricants refinery, produced just 11,127 tones in 2005, compared with 107,726<br />
tones in 1990.<br />
2.3 Impa cts and risks of th e observed and f ore cast evo l u t ions<br />
2.3.1 Energy dependence and Energy bill, reduction in exports capacities<br />
The basic identified sources of primary energy in BiH are coal and hydropower. In 2001,<br />
annual production of energy from those sources in BiH amounted to about 62 percent of the<br />
total consumption of primary energy, which indicates that BiH is dependent on the imports of<br />
energy, as certain energy sources, for now, can not be replaced with domestic energy<br />
sources.<br />
Electric power generation accounts for three-quarters of coal demand. The remainder is<br />
delivered for the industrial and district heat generation purposes, sold on the general market<br />
or exported.<br />
The bulk of coal (about 70% in 1990, more than 90% in 1997 and about 78% in 2001) is<br />
used for power production. Taking into account the economy of coal exploitation, as well as<br />
the existing efficiency of the transformation of coal energy into other forms of energy, a part<br />
of coal used in the production of electricity could be reduced in comparison with the existing<br />
situation. The present level of consumption of oil and gas is significantly lower than the prewar<br />
consumption. The liquid fuels and natural gas, for now, need to be imported.<br />
The consumption of oil and gas should rise once the economy revives. It will remain<br />
necessary to import oil in the coming years. The imports of petroleum products and the<br />
processing of oil will depend on the resolution of political issues in BiH, as the processing<br />
capacities in the country are sufficient for virtually the total of consumption of petroleum<br />
products in the country.<br />
Current gas consumption is significantly lower than in 1990, again due to the poor conditions<br />
in the industrial sector. Due to the unfavourable natural gas consumption mix (relatively high<br />
share of heating and household consumption), the dynamics of consumption are also<br />
unfavourable (winter consumption is considerably higher), resulting in increased prices of<br />
natural gas. In addition, gas is procured over only one pipeline and from one supplier only,<br />
which makes supply stability an issue.<br />
The problem of storing oil and, possibly, natural gas, has not been resolved, although some<br />
solutions for gas storage facilities exist. [3]<br />
Electricity<br />
Table 37 Indicator Electricity dependency rate of B&H for period of 1970-1996<br />
Year Export of<br />
electricity in<br />
GWh<br />
Import of<br />
electricity in<br />
GWh<br />
Net electricity import Export/production<br />
1971 2,499 141 -2,358 2,358/6,374=0.37<br />
1981 1,889 - -1,889 1,889/11,299=0.16<br />
1991 3,150 1,580 -1,570 1,570/15,031=0.10<br />
1994 283 17 -266 266/3,663=0.07<br />
1996 - - - -<br />
Source: Statistical Yearbook of FB&H of 1993-1998<br />
This indicator shows that B&H is net electricity exporter.
BOSNIA & HERZEGOVINA - – National study<br />
B&H satisfies its power needs in total by generation of electricity in its own power stations<br />
(10.8 TWh in 2002), using for that the available hydro potential and domestic coal. The status<br />
of domestic consumption enables also the export of part of generated electricity, which in<br />
2002 was 1.1 TWh.<br />
Also, small quantities of coal have been exported.<br />
Table 38 Indicator: Electricity dependency rate of B&H for 2002<br />
Year Export of<br />
Production of Export/production<br />
electricity in TWh electricity in TWh<br />
2002 1.1 10.8 0.10<br />
For the calculation of this indicator for coal, oil and gas, there were no data of energy<br />
balance for B&H, so that it was impossible to calculate that without the data of export and<br />
import in tons. There are only export and import in dinars (the currency of ex-Yugoslavia).<br />
Natural gas<br />
All natural gas is imported from the Russian Federation and is transported to BiH via the gas<br />
transport systems in Ukraine, Hungary and Serbia. Due to the above mentioned post-war<br />
dissolution of the energy system, BiH is facing an absurd situation – in the entire gas<br />
transport (over 5,000 km) from the gas wells in Siberia to Sarajevo (which is the main<br />
consumer in BiH) the intermediaries involved in the internal transport of gas in BiH<br />
outnumber the transport intermediaries up to the BiH border.<br />
Oil<br />
The current processing capacities of oil are not enough to satisfy the needs of B&H market.<br />
Because of that, B&H currently mainly depends on import of oil derivates; hence the market<br />
is very sensitive to each disturbance in supply of this strategic energy source. The oil market<br />
in B&H is completely liberalized and it has been supplied from import mostly from refineries<br />
in Croatia, Hungary, Serbia and Montenegro.<br />
The imported quantities of mineral fuel in B&H for period 2000 – 2004 was 1,108,495.217<br />
tons. In import of oil derivates, the largest share has Croatia with 63.09%, Hungary with<br />
17.42%, Serbia and Montenegro with 10.86%. These three countries participate in supply of<br />
B&H with oil derivates with 91.37%. Currently the largest export of mineral fuels is in Serbia<br />
and Montenegro with 96.89%.<br />
With regard to the estimated consumption of crude oil and products in B&H, which is in 2005<br />
about 25,000 barrels per day, these estimates suggests that Bosanski Brod is only supplying<br />
approximately 10% of the domestic market. By subtraction, imported products must account<br />
for about 90%.<br />
2.3.2 Greenhouse gas effect<br />
Bosnia and Herzegovina ratified the UN Framework Convention on Climate change on<br />
September 7, 2000, and the UNFCCC entered into force on December 6, 2000.<br />
Bosnia and Herzegovina has not ratified yet the Kyoto Protocol on the Greenhouse Gases<br />
Reduction, but it is currently in the process of ratification.<br />
The National Focal Point for UNFCCC is the Ministry of Physical <strong>Plan</strong>ning, Civil Engineering<br />
and Ecology of Republic of Srpska, while the operating unit is the Institute for Urbanism of<br />
the Republic of Srpska (IURS) in Banja Luka.<br />
Bosnia and Herzegovina under the assistance of UNDP, as the selected Implementation<br />
Agency, has prepared the Project proposal for the First National Assessment and Inventory<br />
of Greenhouse Gasses, and submitted to the Convention Secretariat in July 2002. The<br />
project is still in the phase of approval within the Convention Secretariat. Under the technical<br />
assistance and financial support of the Government of Greece, Bosnia and Herzegovina<br />
participated in the implementation of the project “Capacity Building in Balkans in order to deal<br />
with the Climate Changes Problem” which was completed in October 2002. The Sub-<br />
119
120<br />
ENERGY AND SUSTAINABLE DEVELOPMENT IN THE MEDITERRANEAN<br />
Committee for supervision of the UNFCCC implementation was appointed by the National<br />
Steering Committee for Environment and Sustainable Development in September 2002.<br />
At the beginning of 2004, the most important institutions in Bosnia and Herzegovina related<br />
to climate protection and participation of B&H as a Non-Annex I Party in the UN Framework<br />
Convention on Climate Change negotiation process were:<br />
National Focal Point B&H to the UNFCCC-Ministry of Physical <strong>Plan</strong>ning, Civil Engineering<br />
and Ecology of the Republic of Srpska;<br />
B&H Committee for Climate Changes and Sub-Committees for Climate Changes;<br />
GEF Political and Operational Focal Point for climate changes;<br />
Administrative Committee for Sustainable Development.<br />
The Ministry of Physical <strong>Plan</strong>ning, Civil Engineering and Ecology of the Republic of Srpska<br />
and the Federal Ministry of Physical <strong>Plan</strong>ning and Environment of the Federation of Bosnia<br />
and Herzegovina (recently changed into Ministry of Environment and Tourism) are<br />
responsible for the management of the environment and should provide legislation and<br />
administrative management bases for implementation of international conventions, such as<br />
UNFCCC.<br />
As defined by the B&H Law on Ministries, the relevant authority at the State level remains<br />
with the Ministry of Foreign Trade and Economic Relations (MOFTER). More specifically, this<br />
Ministry is responsible for carrying out tasks related to defining policies and basic principles,<br />
coordinating activities and harmonizing plans of the Entity authorities and bodies at the<br />
international level for, among other topics, protection of the environment, development and<br />
use of natural resources.<br />
In accordance with the national law requirements, the IURS produced a long-term Physical<br />
<strong>Plan</strong> for the Republic of Srpska in 1996. The Physical <strong>Plan</strong> includes elements related to<br />
climate data and monitoring, climate applications and climate change impact studies. This<br />
sub-program has two components: the long-term strategic plan (for 1996-2015) and the<br />
implementation plan and set up of the climate monitoring system. These actions are aimed at<br />
supporting and further development of national meteorological and hydrological observing<br />
networks in order to ensure participation in the Global Climate Observing System and the<br />
implementation of other climate-related UNFCCC commitments.<br />
In accordance with the Low on meteorological and hydrological activities of Republic of<br />
Srpska (Official Gazette of the Republic of Srpska, 20/2000), the Republic Hydrometeorological<br />
Institute of the Republic of Srpska, as the governmental organization, is<br />
responsible, among other, for climate change monitoring, climate data exchange and data<br />
base management, application study and climate predictions in the framework of the various<br />
scientific and technical programs of the World Meteorological Organization.<br />
The Law on Hydro-Meteorological affairs, being of interest to the Republic Bosnia and<br />
Herzegovina (RBiH 10/76), also presents a legal basis for the work of FBiH Institute for<br />
Meteorology (the law is inherited from RBiH/SFRY). This law describes in detail the tasks of<br />
the Institute in the field of hydrology and meteorology. Considering the Institute an active<br />
partner in communication with the World Meteorological Organization (WMO), whose<br />
member is also Bosnia and Herzegovina, the Institute follows in its work various WMO<br />
Guidelines in the field of meteorology and hydrology.<br />
It is expected that the adoption of the new legal regulation on environment shall unavoidably<br />
lead to organizational restructuring of authorities per sectors and administrative bodies both<br />
in FB&H and RS. This means that it will be necessary to reinforce institutionally the<br />
proficiency and capabilities of the existing resource ministries (more space, equipment and<br />
employees), and to clearly define competences and authorities related to environmental<br />
issues, as well as to improve compatibility and coordination of relevant bodies in assigning or<br />
even overlapping responsibilities in the field of environmental protection.<br />
Through the efforts undertaken by BiH National Focal Point to UNFCCC and other<br />
responsible institutions, the climate change issues were addressed in identifying the various<br />
environmental problems and challenges facing BiH. Hence economic Development Strategy
BOSNIA & HERZEGOVINA - – National study<br />
of BiH (DSPRSP) for the realization of the national sustainable development and poverty<br />
reduction for the period 2003-2007 based on Millennium Development Goals underlines<br />
climate change consequences and sets up a several priority actions with respect to climate<br />
protection. The National Environmental <strong>Action</strong> <strong>Plan</strong> (NEAP) has been developed with the<br />
assistance of the World Bank and it was adopted in 2003 by the Entities. BiH NEAP based<br />
on national sustainable development priorities, Rio Agenda 21 and objectives and priorities<br />
of The Sixth European Community Environment <strong>Action</strong> Program 2001-2010, also considers<br />
climate change issues (NEAP BiH, 2003). It contains a concrete list of main existing<br />
problems and provides measures for their solutions. In Chapter 3 on the Environmental<br />
Management in BiH, the NEAP recognizes the necessity to establish an Environmental<br />
Information System.<br />
In Bosnia and Herzegovina, there is no institution to be responsible for collection of activity<br />
data necessary for GHG inventory emission development, in accordance with UNFCCC<br />
guidelines and IPCC methodology. Particular problem is the fact that Bosnia and<br />
Herzegovina consists of two entities - FB&H and RS as well as District Brcko, and these<br />
activities are carried out on the entity level, so there is an urgent need to promote<br />
cooperation in that field between the entities.<br />
2.3.3 Regarding public awareness:<br />
The Climate change (CC) issues are still not included in the schools’ and universities’<br />
curricula.<br />
During the past period there were no activities in the field of capacity building in the<br />
education system.<br />
There is no department or person within the ministries or public agency working on<br />
education on climate change (e.g. development of educational materials, guidelines, or<br />
recommendations for curricula, and training materials for teachers).<br />
The governmental staff of the Ministries responsible for climate change has not been<br />
trained on the access and the participation rights of the public; also, the staff responsible<br />
for disclosure of information has not been trained on climate change issues.<br />
Limited public awareness generally on CC related issues, as the CC is not among the<br />
priorities of the society;<br />
Lack of information on issues related to Kyoto mechanisms;<br />
Lack of support for participation of experts in international workshops;<br />
Limited number of international workshops in country;<br />
Lack of financial support for training and certificate programs;<br />
National Communications and Inventories are not prepared.<br />
Total CO2 emissions in Bosnia and Herzegovina for the period from 1970 to 2002.<br />
Table 39 Indicator ENE_PO3 Greenhouse gas effect emissions<br />
Year Total CO2 emissions<br />
1970 11,284.0<br />
1971 10,694.2<br />
1972 10,771.6<br />
1973 11,578.2<br />
1974 12,472.4<br />
1975 12,607.9<br />
1976 13,181.5<br />
1977 14,019.5<br />
1978 14,838.6<br />
1979 16,616.0<br />
1980 16,528.3<br />
1981 16,757.9<br />
1982 17,400.2<br />
1983 19,011.9<br />
1984 20,576.3<br />
1985 21,229.4<br />
1986 22,038.2<br />
1987 22,245.3<br />
1988 20,775.1<br />
121
2.3.4 Other impacts on the environment<br />
122<br />
ENERGY AND SUSTAINABLE DEVELOPMENT IN THE MEDITERRANEAN<br />
Year Total CO2 emissions<br />
1989 20,402.8<br />
1990 20,922.2<br />
1991 27,055.9<br />
1992 15,735.6<br />
1993 13,275.4<br />
1994 3,431.8<br />
1995 3,642.7<br />
1996 4,455.0<br />
1997 9,360.1<br />
1998 12,130.1<br />
1999 11,540.1<br />
2000 14,270.2<br />
2001 14,870.3<br />
2002 13,960.2<br />
Source – World Resources Institute: http://earthtrends.wri.org/<br />
Units: Thousand metric tons of carbon dioxide<br />
Table 40 Indicator ENE_CO4 Number of infrastructures on coastal areas<br />
Indicator Source<br />
Number of<br />
energy<br />
infrastructures<br />
on coastal areas<br />
NEAP for<br />
B&H<br />
Thermal Power <strong>Plan</strong>t Gacko, although it is not located directly in the<br />
coastal area, its pollution causes negative impacts in this area, and<br />
that is the reason why it was included here.<br />
TPP Gacko is power plant of block type with installed power of 300 MW. As a fuel, it uses<br />
lignite from the surface pit of Gračanica, which annual consumption is 1,800,000 tons. The<br />
content of the sulphur in the coal is 1.33% and it is specifically used for the TPP boiler<br />
combustion in the quantity of 300-350 t/h.By combustion of coal, about 79 t/h of ash and slag<br />
in average has been produced what is in total 420,000 per year.<br />
From the start period of TPP operation in 1982 up to 1992, the ash has been transferred by<br />
trucks and deposited in the disposal site of Draţljevo, which is 7 km far from the location of<br />
TPP. The disposal site of Draţljevo is full and about 3.5 millions of tons of ash have been<br />
deposited there. The area of this site is about 18 ha. Currently, the plans are to prepare this<br />
site for the permanent conservation although the nature itself partially attributes to it. The<br />
erosion cannals are noticeable which directs the water from the top to the bottom of the<br />
disposal site where the significant layer of the humus has been taken away by those canals.<br />
Thermo power plant is located in the very top of catchment areas of Trebišnjica River, so that<br />
the polluting products appearing in combustion of coal in the thermo-power plant directly<br />
threatens the downstream area. Today the solid residues of lignite combustion in the boiler of<br />
the thermo-power plant – ash and slag, have been deposited in the internal deposit site of<br />
the surface pit of Gračanica. This ash is known as hazardous raw material, and its chemical<br />
composition is shown in the following table.<br />
Table 41 Chemical composition of ash from TPP Gacko<br />
Parameter<br />
SiO2<br />
Fe2O3<br />
Al2O3<br />
Surface pit<br />
Gračanica %<br />
8.08<br />
2.00<br />
6.69<br />
CaO 66.25<br />
MgO 3.50<br />
SO3<br />
P2O5<br />
TiO2<br />
7.91<br />
0.37<br />
0.49<br />
Na2O 0.32
BOSNIA & HERZEGOVINA - – National study<br />
Parameter<br />
Surface pit<br />
Gračanica %<br />
K2O 0.95<br />
The ecological problem is evident, taking into consideration that water excess has been<br />
discharged into the recipient of Gračanice and Mušnica Rivers, and further into the<br />
catchment area of reservoir Bileća of Trebišnjica River. The reservoir Bileća is the largest<br />
artificial reservoir on the Balkan, and the Trebišnjica River is the largest sinking river in<br />
Europe and that basin is the basic reservoir of drinking water in the region. Currently the ash<br />
disposal has been carried out in improvised way, which has not been approved by the B&H<br />
institutions and it is necessary to carry out the implementation of the ash disposal project in<br />
the form of dense hydro-mixture that satisfy all legal and technological requirements and by<br />
which the requested ecological standards are fully satisfied. It has been assumed that ash<br />
transfer by wind leads to endangerment of the area that is 15 times larger then the disposal<br />
site.<br />
Indicator Source<br />
Ozone picks<br />
frequency<br />
3.17<br />
Table 42 Indicator ENE_C13 Ozone picks frequency<br />
www.eionet.europa.eu There is no data showing ozone picks frequency<br />
2.4 Financ ing and inve s t ment needs<br />
There is no national strategy for investments available in this moment. It will be done after<br />
the national strategy for energy is adopted.<br />
There are available some studies done by Elektroprivreda B&H. It says in the study:<br />
In different studies (foreign and domestic) for restoration of production capacities (technical<br />
restoration + environment protection), the different scope of activities has been foreseen, in<br />
the sense of amounts and dynamics of investing the necessary resources. The illustration is<br />
given on the picture below where the necessary resources and dynamics of investments for<br />
restoration of existing TPP of PC<br />
Elektroprivreda B&H (TPP Tuzla and TPP Kakanj) are given according to one of the<br />
researches (Fichtner Study).<br />
Figure 3 The necessary funds for restoration of existing TPP of PC Elektroprivreda B&H (according to<br />
Fichtner Study)<br />
The power plants, candidates for construction in PC Elektroprivreda B&H up to 2010 for<br />
satisfying the higher scenario of development are shown in Table 43.<br />
123
124<br />
ENERGY AND SUSTAINABLE DEVELOPMENT IN THE MEDITERRANEAN<br />
Table 43 Power plants-candidates for construction in PC Elektroprivreda B&H up to 2010<br />
Source: Bosnia and Herzegovina – Study of electricity tariffs, scheme of social protection and<br />
scheme of improvement of payment status, EBRD/Fichtner/ESBI, 1999<br />
3. Rational Energy Use (RUE) - Renewable Energies (RE): policies, tools,<br />
progress, resulting effects, and case studies<br />
3.1 RUE and RE policies<br />
Development and adoption of Energy Strategy for B&H is one of the short-term priorities of<br />
Stabilization and Association Agreement (SAA). When doing that, full consideration should<br />
be given to envisaged reforms and liberalization of the energy sector in South-East Europe.<br />
B&H will get its Energy Strategy blueprint through the EC CARDS Programme “Technical<br />
Assistance to Support the Energy Department of Ministry of Foreign Trade and Economic<br />
Relations in B&H”. Preparation of a comprehensive background energy sectors study was<br />
the first step towards the national energy strategy. That study will be done by World Bank.<br />
The duration of implementation of this study is between 12-24 months. The need for such<br />
studies was justified because of fundamentally changed energy situation in individual<br />
countries after the disintegration of former Yugoslavia, break-up of former economic relations<br />
and industrial cooperation, consequences of the war, and intensive activities driven by the<br />
EC towards establishment of regional energy markets, particularly in network-based energies<br />
(electricity and gas).<br />
The determining factors of decision-making are the following international agreements:<br />
ECSEE Treaty<br />
Energy Charter Treaty (ECT) and protocol on Energy Efficiency and Related<br />
Environmental Aspects (PEEREA), and<br />
Stabilization and Association Agreement (SAA).<br />
ECSEE Treaty<br />
Bosnia and Herzegovina signed the ECSEE-Traty establishing Energy Community in South<br />
East Europe (ECSEE) on 25 October 2005 in Athens, Greece. Based on information<br />
gathered at the last PHLG meeting in Vienna (8-9 March 2006), the Treaty is likely to enter<br />
into force (i.e. become legally binding) by June 2006 after the successful ratification process<br />
at least in six signatory countries.<br />
Three main activities of the Energy Community include:<br />
the extension of the Acquis communautaire<br />
Mechanism for operation of Network Energy markets<br />
The creation of a single energy market.<br />
When ratifies this Treaty, B&H will be obliged to implement the Acquis Communautaire on<br />
energy, environment, competition and renewables.
Just to mention some particular obligations:<br />
BOSNIA & HERZEGOVINA - – National study<br />
Implement the EC Directives 2003/54 (on electricity) and 2003/55 (on natural gas) within<br />
12 months of entry into force of the Treaty<br />
Implement Directive 2001/80/EC on large combustion plants by 31 December 2017<br />
Make endeavours to accede to Kyoto Protocol<br />
Within one year of entry into force, to provide to the EC a plan to implement the Directive<br />
2001/77/EC and 2003/30/EC on renewable energy sources.<br />
Chapter VI of the ECSEE Treaty is called The renewable energy sources and energy<br />
efficiency and it says in Article 35 that The Energy Community can adopt Measures for<br />
development strengthening in the field of RE and EE, with regard to its advantages in relation<br />
with supply safety, environment protection, social cohesion and regional development.<br />
ECT and PEEREA<br />
B&H is a member of the Energy Charter conference and signatory of the Energy Charter<br />
Treaty (ECT) and the Protocol on Energy Efficiency and Related Environmental Aspects<br />
(PEEREA) which was signed in London in December 1994 along with the Treaty. B&H<br />
participated in the review of the Energy Charter process, which was concluded in December<br />
2004, and its implementation thereafter. According to the ECT and PEEREA, the main issue<br />
areas include:<br />
Investments<br />
Trade and Transit<br />
Energy Efficiency.<br />
ECT requires that all member states strive to minimize, in an economically efficient manner,<br />
harmful environmental impacts resulting from energy-related activities (ECT Article 19).<br />
PEEREA is designed to reinforce energy efficiency policies and programmes focusing on<br />
principles of developing energy efficient strategies, real-costs reflecting prices, transparency<br />
of regulatory frameworks, transfer of technologies, establishment of domestic programmes<br />
for EE and promotion of investment in EE.<br />
SAA<br />
With respect to Stabilization and Association Agreement, in accordance to Council of the EU<br />
Decision on the principles, priorities and conditions in the European Partnership with B&H<br />
(Annex to the Annex, B&H: 2005 European Partnership), there are the two following priorities<br />
for B&H:<br />
Chapter 3.1, Short-term priorities (under sectoral policies, Energy)<br />
Start implementing the commitments undertaken in the framework of the Energy<br />
Community Treaty;<br />
Develop and adopt a comprehensive Energy Strategy, pursue reforms and<br />
liberalization of the energy sector<br />
Ensure that the Independent System operator (ISO= and the Transmission<br />
Company (Transco) become rapidly fully operational, each as a single State-level<br />
company.<br />
Chapter 3.2, Medium-term priorities (under sectoral policies, Energy)<br />
Implement the Entities’ <strong>Action</strong> <strong>Plan</strong>s for the restructuring of the energy sector<br />
Consolidate the State and Entity Energy Regulators<br />
Take steps to achieve concrete progress in relation to the gas sector, inter alia by<br />
developing a gas strategy, establishing a system operator and regulator and<br />
developing the internal gas market.<br />
There a several Consultant within the MoFTER of B&H who will assist Energy Department of<br />
MoFTER in the preparation of progress reports on accomplishment of B&H obligations to<br />
125
126<br />
ENERGY AND SUSTAINABLE DEVELOPMENT IN THE MEDITERRANEAN<br />
SAA and the mentioned agreements in the energy sector and in addressing the mentioned<br />
issues.<br />
3.1.1 Rational energy use (RUE) policies<br />
Energy efficiency – energy saving<br />
The level of energy efficiency, i.e. energy intensity in B&H is among the latest in Europe. This<br />
means that in this field it is necessary and possible to do significant improvements. For this<br />
field the institutional and legal framework does not exist. [11]<br />
Within the Energy Strategy blueprint for B&H, the Energy Efficiency and Energy conservation<br />
sector policy and strategies will be done on the basis of data, knowledge and results<br />
obtained both from WB Study and EC CARDS “TASED” Project. The first conclusions from<br />
TASED project can be expected at the end of 2007, under the basic assumption that the WB<br />
study is implemented in a timely and coordinated manner with the project. For example,<br />
should the WB Study be completed by the end of June 2007, as it is currently planned, the<br />
draft Blueprint would be ready by the end of September 2007, and the final Blueprint by mid-<br />
November 2007.<br />
3.1.2 Renewable energy (RE) development policies<br />
Within the Energy Strategy blueprint for B&H, the Renewable Energy sector policy and<br />
strategy will be done on the basis of data, knowledge and results obtained both from WB<br />
Study and EC CARDS “TASED” Project.<br />
3.2 Ins tr ume n ts and measures to be taken in fa vo u r of R UE and<br />
RE<br />
3.2.1 Tools and measures in favour of RUE<br />
There are still no any RUE policies in the country. There are no economic applicable<br />
measures at the state and entity levels (incentives and disincentives relative to the attitude<br />
toward RUE).<br />
In B&H there is no any energy efficiency and emissions reduction fund. Municipal finance is<br />
tightly controlled, with a large proportion of funds being allocated centrally according to costs<br />
incurred.<br />
Budget periods extend only to one year, so there is little scope for municipal energy<br />
managers to take a longer term view.<br />
3.2.2 Tools and measures in favor of RE<br />
Regarding the laws on the entity level in the Federation of BiH there is a law on electricity<br />
("Official Gazette of the Federation of Bosnia and Herzegovina" 41/02) and an action plan of<br />
the Federation of Bosnia and Herzegovina on restructuring and privatization of electroenergy<br />
sector in Bosnia and Herzegovina ("Official Gazette of the Federation of Bosnia and<br />
Herzegovina" 67/02) and Decision on methodology of determination of level of electricity<br />
price from renewable energy for plants of 5MW ("Official Gazette of the Federation of Bosnia<br />
and Herzegovina" 32/02).<br />
In the Republic of Srpska an existing law on electricity (Official Gazette of RS 66/02) and an<br />
action plan of the Republic of Srpska on restructuring and privatization of electro-energy<br />
sector in Bosnia and Herzegovina (Official Gazette of RS 66/02).<br />
By this Decision electricity public utilities at the territory of the Federation of Bosnia and<br />
Herzegovina (Elektroprivreda BiH and Elektroprivreda HZHB) are obliged to accept electricity<br />
from renewable energy sources if producer has the Use Permit for production plant and Work<br />
Permit.
BOSNIA & HERZEGOVINA - – National study<br />
Table 44 Indicator ENE_CO8 RUE and RE programmes share in energy investment and R&D<br />
investments<br />
Indicator Number<br />
Expenditures in RE and RUE programmes 0<br />
Table 45 Average Energy Sources Prices in dinars (ex-Yugoslavia currency) in B&H for the period of<br />
1970-1990<br />
1977 1979 1984 1990<br />
Electricity- higher tarrif per kWh 0.66 0.91 4.71 0.84<br />
Lignite per ton 442.16 602 4,463 561.21<br />
Brown coal - - - 861.13<br />
Fuel oil per liter - - - 3.06<br />
Wood per stacked cubic meter 356.45 518 3,241 per m 3<br />
-<br />
Source: Statistical Yearbook of SRB&H for 1980 and 1992<br />
Table 46 Indicator ENE_CO5: Final consumer energy price per fuel in 2003 for F B&H<br />
Indicator Oil for<br />
heating<br />
(in<br />
Litres)<br />
Average retail price in<br />
KM (BAM)<br />
Electric<br />
power<br />
(daily<br />
tarrif) kWh<br />
Source: Statistical Yearbook of FB&H of 1993-1998<br />
Electric<br />
power(late<br />
hours tariff)<br />
kWh<br />
Brown<br />
coal in<br />
tons<br />
Lignite<br />
in tons<br />
Central<br />
heating<br />
per m 2<br />
1.02 0.14 0.07 107.08 77.43 1.07<br />
Table 47 Indicator ENE_C11 Share of fuel and electricity expenditures in household budgets in B&H in<br />
percentages (average per member of household)<br />
Year All<br />
households<br />
Agricultural<br />
households<br />
Mixed<br />
households<br />
Nonagricultural<br />
households<br />
1990 7.6 7.7 7.3 7.8<br />
Source: Statistical Yearbook of SRB&H for 1992<br />
Table 48 Indicator ENE_CO6 Existing incentives measures and policies for RE and RUE development at<br />
national level<br />
Existing incentive measures and policies for RE<br />
and RUE developments at national level<br />
Indicator Number<br />
Table 49 Indicator ENE_CO7 Cities/regions/provinces with an existing energy audit and/or carbon audit<br />
and/or with objectives in terms of RE and RUE<br />
Cities/regions/provinces with an existing energy<br />
audit and/or a carbon audit and/or with objectives<br />
in terms of RE and RUE<br />
Indicator Number<br />
Table 50 Indicator ENE_PO4 total sum of investments made within the Kyoto protocol’ Flexibility<br />
mechanism<br />
Total sum of investments made within the Kyoto<br />
protocol’s Flexibility Mechanism<br />
Indicator Number<br />
The Kyoto Protocol has not been ratified yet in B&H. Today, participation in Kyoto CDM<br />
mechanism is not possible for B&H, because of the fact that B&H does not have sufficient<br />
capacity and does not fulfil other conditions required from host countries for CDM projects<br />
development and implementation. B&H, today, does not have any regulations/legal<br />
framework, which would able implementation of the Kyoto protocol mechanisms. Committee<br />
for Climate Changes, UNFCCC Focal Point, as well as institutions and individuals, tried to<br />
initiate ratification of Kyoto Protocol on several occasions, but the official procedure, which<br />
should be initiated by the Ministry of Foreign Trade and Economic Relations of B&H, has<br />
0<br />
0<br />
0<br />
127
128<br />
ENERGY AND SUSTAINABLE DEVELOPMENT IN THE MEDITERRANEAN<br />
never been started. Problems are lack of professional institutions, as well as giving low<br />
priority to the climate changes issue.<br />
Practical actions taken by some NGOs, associations and international programmes<br />
Energy Efficiency Housing Project of UNDP<br />
This project aims to introduce low cost methods of saving energy when building or<br />
reconstructing buildings, thus mitigating the emissions of greenhouse gases while at the<br />
same time reducing the operational costs and increasing the comfort level of the buildings.<br />
The project is focused on dissemination of know-how and hands-on experience by training of<br />
local municipal officials, representatives from housing maintenance companies and<br />
homeowner associations in energy efficiency design, principles, management and planning.<br />
Based on the training component, 1-3 buildings will be selected and reconstructed according<br />
to an energy efficient plan that is to be developed during the practical part of the training.<br />
The project will also explore through a feasibility study the potential for using individual small<br />
biomass-fired boilers for local wood waste in rural households.<br />
Association of small producers of electricity from renewables up to 5MW in Bosnia and<br />
Herzegovina has the following main objectives:<br />
Developing, widening and improving activities of the production of electricity from<br />
renewables (water, wind, biomass solar).<br />
Establishing the influence on improvement and development of microeconomic and<br />
macroeconomic surrounding for this activity<br />
Giving the expert opinion and support to the members form different fields (taxes, legal<br />
aspect, new technologies)<br />
Improving the competition in domestic and international market<br />
Defining and giving proposals of legal and regulatory reforms with the aim of improving<br />
and development of generation of electricity from RE.<br />
Engagement the experts for RES development and use policy<br />
Education of human resources with the aim of elevation of quality of RES use<br />
Other activities<br />
Website: apeorbih.com.ba<br />
ENERGY SUPPLY AND ENERGY EFFICIENCY done by CETEOR (Center for Economic,<br />
Environmental and Technological Development) in Sarajevo<br />
Study on the energy supply of Central-Bosnia Canton (in the frame of the physical plan<br />
for Central-Bosnia Canton) (2001)<br />
Seminar on energy consumption measuring in central heating systems Travnik (2001)<br />
Phare program “Promotion of energy cogeneration in low-power plants (1999),<br />
Concept on energy efficiency in Sarajevo (1997)<br />
Report on system of payment of natural gas in Sarajevo (1997)<br />
Center for Ecology and Energy from Tuzla - Project: Energy Brigade of B&H<br />
Center for Ecology and Energy from Tuzla is the member of International Energy Brigades –<br />
(IEB) from 1 October 2003 and representative of B&H in this network.<br />
In the first year of project implementation of the Project, the Center have done the insulation<br />
of windows and doors in five schools and two NGOs in B&H, and by that the efficient use of<br />
energy have been achieved and also the public has been ecologically awarded by education<br />
and through the media.<br />
There are also some more projects (USAID for example) and more centers dealing with this<br />
issue within the Faculties of University in Sarajevo, Banja Luka, Tuzla, and Mostar.
BOSNIA & HERZEGOVINA - – National study<br />
3.3 Energy E f fi ciency E vo l u ti on - decoupl ing<br />
Table 51 Indicator ENE_P01 Total energy intensity<br />
Units<br />
Years<br />
Electricity intensity<br />
Final electricity<br />
consumption<br />
GDP<br />
in MWh/000 USD MWh 000 USD<br />
1995 0.57 788,000 1,392,041<br />
1996 0.82 1,657,000 2,018,912<br />
1997 0.75 2,132,000 2,840,560<br />
1998 1.32 4,196,000 3,183,126<br />
1999 1.46 4,895,000 3,356,220<br />
2000 1.81 5,716,000 3,161,429<br />
Place:<br />
Sources:<br />
Level of Federation of Bosnia and<br />
Herzegovina<br />
Statistical Yearbook of Federation of Bosnia and<br />
Herzegovina<br />
The basic characteristic of B&H energy sector is poor efficiency of energy use in the whole<br />
life cycle (from the coal extraction or import of fuels up to conversion of of energy in money<br />
or comfort). The consequence is the very high energy intensity- in 1991, B&H had almost 2.5<br />
times higher energy consumption per GDP unit then it was in some other ex-Yugoslavia<br />
republics, such as Croatia and Macedonia. One of the reasons of high-energy intensity in<br />
B&H in that time was export of electricity, with low prices in some other republics of ex-<br />
Yugoslavia. [15]<br />
3.4 Renew able Ene rgy e vo l u ti on<br />
Table 52 Indicator ENE_P02 Renewable energy share in total energy<br />
Share of consumption of<br />
renewable energy<br />
(electricity) resources<br />
Total production Hydro power<br />
Units<br />
Years % GWh GWh<br />
1990 11.39 7,490 853<br />
1991 19.50 7,446 1,452<br />
1992 33.82 3,264 1,104<br />
1993 45.05 1,183 533<br />
1994 57.79 1,303 753<br />
1995 55.55 1,460 811<br />
1996 50.96 2,298 1,171<br />
1997 34.55 3,511 1,213<br />
1998 32.26 4,045 1,305<br />
1999 36.56 4,100 1,499<br />
2000 27.16 4,695 1,275<br />
Place: Federation of B&H<br />
Sources: Annual Report 2000 of Electricity utility "Elektroprivreda B&H"<br />
3.5 Existing or expecte d effects and bene f its of RE and R UE<br />
There are no activities within the RUE sector or RE sector that would give importance in<br />
terms of job creation, international trade, technology transfer, and etc.<br />
129
130<br />
ENERGY AND SUSTAINABLE DEVELOPMENT IN THE MEDITERRANEAN<br />
Table 53 Indicator ENE_C12 Job creation through the development of RE and RUE<br />
Job creation through the development of RE and<br />
RUE<br />
Indicator Number<br />
Table 54 Indicator ENE_C08 Expenditures in RE and RUE: RE and RUE programmes share in energy<br />
investments<br />
4. Examples of good practice, case studies<br />
Indicator Number<br />
Expenditures in RE and RUE 0<br />
4.1 Content of good practice and case studies<br />
4.1.1 Landfill gas migration and utilization at Sarajev o landfill- Case Study<br />
Today, the landfill gas, produced with the process of anaerobic degradation of solid waste<br />
has been considered as alternative energy source. Sarajevo landfill, where it has been<br />
estimated that 3 millions of tons of mainly household waste of organic origin have been<br />
deposited from 1963 until today, is related to extremely negative experiences with the<br />
uncontrolled explosions and fires of landfill gas. Because of that, in the process of recovery<br />
activities which are particularly intensive from 1996 until today, the problem of landfill gas<br />
monitoring, and also in the future of its utilization, has been considered with the special<br />
attention. The main design for landfill gas migration has been prepared according to which<br />
the wells for gas collection have been built. At the temporary sanitary landfill, of area of 1<br />
hectare, the experimental boreholes for landfill gas collection have been constructed. Six<br />
boreholes is connected to the torch of the capacity 60-300 m 3 /h with the aim of experimental<br />
insurance of possibility of utilization of landfill gas, for the electricity generation. In the study,<br />
the results of the evaluation of the landfill gas quantity are given for the Sarajevo landfill by<br />
application of the multiphase mathematic model, as well as the results of the quality and<br />
quantity of the landfill gas from the temporary experimental disposal site.<br />
The technology of the landfill gas utilization is consisted of:<br />
The evaluation of the quantity and the level of landfill gas production on the basis of the<br />
composition and age of deposited solid waste<br />
Engineering of the collection system for landfill gas which is the most adequate on the<br />
selected landfill, as well as the way of the disposal of the waste itself<br />
Obtaining the most cost-efficient scheme for landfill gas utilization<br />
The priority has been put on the landfill gas monitoring. For that purpose, 14 boreholes of<br />
110mm profile have been performed on the sanitary disposal site at the area of 1 hectare. In<br />
the centre of the borehole, perforated PE-HD pipes have been put for collection of the landfill<br />
biogas. The pipes are buried with pebble of 80-120 mm granulation and with the glass. The<br />
distance between the boreholes is 60m. Their purpose was to accept the landfill gas and<br />
ventilate it in the atmosphere. In that way, the further accumulation of the gas within the<br />
landfill body has been stopped and the probability for repeated fires and explosions have<br />
been reduced.<br />
It has been estimated that 3 millions of tons of mainly household waste of organic origin has<br />
been deposited from 1963 until today. Considering that gas produced at the landfill is a result<br />
of microbiological degradation of organic fraction of the deposited solid waste, it can be<br />
concluded that Sarajevo landfill presents the great potential for production of sufficient<br />
quantities of landfill gas that can be utilized in cost-efficient way.<br />
0
BOSNIA & HERZEGOVINA - – National study<br />
Table 55 Composition and quantity of solid waste deposited on Sarajevo landfill<br />
CATEGORY ANNUAL QUANTITY (TONS)<br />
1972 1991 1993 June, 1997/July<br />
1998<br />
Household waste 44,700 119,322<br />
Street waste 4,450<br />
Mixed industrial<br />
9,300<br />
waste<br />
Foundry sand 5,000<br />
Coal loess, ash 4,750<br />
Glass carst 940<br />
Debris 8,750 57,406<br />
Bulky waste 152<br />
Soil 176,128<br />
Other 84<br />
TOTAL IN TONS 78,042 165,128 71,442 352,939<br />
TOTAL IN m 3 259,940<br />
NUMBER OF<br />
280,000 500,000 280,000<br />
INHABITANT<br />
Kg/inhabitant daily 0.76 0.90 0.70<br />
Source: Strategy for management of solid waste in B&H, October 2000<br />
Table 56 Gas characteristics from Sarajevo landfill<br />
Methane (%) Flow speed<br />
(m/s)<br />
Gas flow (m 3 /h) Pressure<br />
(mbar)<br />
Combustion<br />
temperature<br />
(ºC)<br />
1999 August 44.83 19.75 297.5 -26.67 948.33<br />
September 50.15 19.63 296.3 -25.84 1,021.5<br />
October 50.1 19.74 297 -27.7 1,036<br />
November 51.6 19.59 295.2 -30.2 1,034<br />
December 56.37 19.15 291.2 -34.37 1,032<br />
Source: Data taken from Public Waste Utility Company RAD, Sarajevo<br />
The results of these measurements show that the methane concentration in the gas of about<br />
55% and the quantity of produced gas of about 300 m 3 /h are very favourable for further<br />
efficient utilisation of landfill gas, as well as that the existing system for gas collection and<br />
combustion of collected gas is operating very well. It should be mentioned that because of<br />
the limited capacity of the torch, the inflow of gas is reduced almost for one half what shows<br />
that the real values of the produced quantity of landfill gas are bigger then the measured one.<br />
4.1.2 Utilization of the geothermal source for district heating system of<br />
Gračanica City-Case Study<br />
Instead of the proposed case study of biomass utilization in Konjuh, Ţivinice furniture factory,<br />
the results of case study of prospectives and possibilities of district heating system on the<br />
basis of geothermal potential in Gračanica City, B&H are attached here.<br />
The existing way of the heating of the buildings in Gračanica is mainly with the use of<br />
individual boiler houses, which significantly pollute the environment. By the construction of<br />
buildings-settlements, the individual heating system for these settlements has been designed<br />
with the individual boiler houses.<br />
Today those boiler houses are mainly devastated having equipment older then 15 years.<br />
On the basis of the previous studies done in 1980’s for possibilities of utilization of thermo<br />
mineral waters for district heating system of Gračanica City,the municipality authorities made<br />
a decision for preparation of a new study for supply of Gračanica City with the heat<br />
energy.For this purpose, one company from Seegen, Austriy has been selected which has a<br />
significant experiences in designing and implementation of district heating systems of smaller<br />
cities in Austria. The objective of this study was to find possibilities of supply of Gračanica<br />
City and its outskirts with the heat energy, by which the air quality would be significantly<br />
improved, and the ecological, local and favourable supply of heat energy would be offered to<br />
citizens. The task of this study was to analyse the feasibility of district heating system of<br />
Gračanica, to propose the best solution and the most optimal technical solution and the way<br />
of financing for project implementation.<br />
131
132<br />
ENERGY AND SUSTAINABLE DEVELOPMENT IN THE MEDITERRANEAN<br />
The heat potential which has been obtained by polling of the citizens of Gračanica was<br />
59,418,580 kWh i.e. theoretical power of the connection was 62,545 kW. The calculation of<br />
the probability showed that currently amount of 18,512,263 kWh of heat energy is possible to<br />
sell. The evaluation has been done on the basis of the criteria from the poll where the<br />
potential users answered if they already have the central heating and if they are interested to<br />
have connection to district heating station.<br />
As possible energy source for supply of the City with heat energy, the Study elaborated five<br />
options.<br />
Option 1- Heating station with the energy from geothermal source, biomass and coal<br />
Option 2- Heating station with the energy from biomass<br />
Option 3- Heating station with the energy from coal<br />
Option 4- Heating station with the energy from geothermal source<br />
Option 5- Heating station with the energy from TPP Tuzla<br />
Total investment of these five studies can be presented as in Table 56. The total investment<br />
will influence the price of heating, so there are heating prices each of the five options shown<br />
in Table 56.<br />
Table 57 Total investments of five options of possible heat energy source<br />
Option 1 Option 2 Option 3 Option 4 Option 5<br />
EUR<br />
Heating station 850,000 750,000 750,000 400,000 350,000<br />
Hot water<br />
pipeline<br />
2,580,000 2,580,000 2,580,000 2,580,000 12,580,000<br />
Transmission<br />
station<br />
710,000 710,000 710,000 710,000 710,000<br />
Technical<br />
plants<br />
3,270,000 2,810,000 3,000,000 6,112,308 1,050,000<br />
TOTAL 7,410,000 6,850,000 7,040,000 9,802,308 14,840,000<br />
The result of the study showed that Option 4 (heating station with the energy from<br />
geothermal source) is the most favourable. Considering that geothermal source utilization is<br />
related to the need for boring a new well up to 1,500 m and with the investment for<br />
boreholes, which is estimated on 3,450,000 Euro, it presents a great risk factor in the sense<br />
of obtaining new quantities of thermo-mineral water with the expected characteristics of 100<br />
l/sec and temperature of 100ºC.<br />
In option 1 (heating station with the energy from geothermal source, biomass and coal), the<br />
utilization of geothermal energy has been foreseen from the existing geothermal well PEB-4.<br />
The quantities of biomass and coal can be purchased on the regional market.<br />
From the above-mentioned reasons, the option 1 has been chosen as the main option.<br />
Option 1 provide the heat energy which would be produced in combined heating station<br />
where the basic energy would be produced from geothermal source and biomass, and the<br />
rest of energy from biomass and coal (if available biomass quantities are not sufficient).<br />
The technical data of the plant of such option are given in Table 58. The heat form<br />
geothermal source would cover up to 30% of annual needs, with the cost and utilization of<br />
part of biomass energy. The rest of energy would be covered from biomass.<br />
The Study showed that the sale of heat energy in amount of 18,512 MWh is needed for the<br />
start of the project, having in mind that it will increase in coming years. The experiences in<br />
similar projects of the Study author show that the other quantity of sale comes after decision<br />
for the project and during construction.<br />
Table 58 Technical data of Option 1 of possible heat energy source<br />
Part of the plant Power in kW<br />
Boiler K1- biomass 3,000<br />
Boiler K2- biomass 6,000<br />
Heat pump of 5,000 kW 2,000<br />
Boiler K3 for maximum load (fuel oil) 8,000<br />
Pipe network-exit DN 250<br />
Length of the main network 12,500 Trm
BOSNIA & HERZEGOVINA - – National study<br />
Part of the plant Power in kW<br />
Boiler house- fenced area-covered Approx. 5,500 m 3<br />
Storage-fenced area-covered Approx. 3,500 m 3<br />
Outside area Approx. 2,500 m 2<br />
After all, there is a data that is most important for final users, and that is the price for heat<br />
that would be offered to the users. Technical solution in the Study foresees the measurement<br />
of the heat energy by meters (calorimeters), and that means paying per KJ of the consumed<br />
energy.<br />
Why geothermal and biomass: because<br />
Both are CO2 neutral<br />
In B&H 0.7 m 3 of wood is growing each second, and currently only 30% of that is used<br />
From 2006, the CO2 market will appear<br />
Possibility for production of bioelectricity.<br />
5. Proposals for more sustainable energy development<br />
5.1 Sum mary o f unde r expl oi ted RE and RUE<br />
The possibilities for energy savings in the industry sector in B&H are very considerable. Most<br />
industries treat energy as tangible cost and include the energy cost in the final price of the<br />
product, which does not promote energy savings. The cost of energy should be registered<br />
separately, compared with the energy costs in the same activities in the developed<br />
economies, and measures should be taken to rationalize the consumption. Subsidies could<br />
present an effective solution for such measures.<br />
Generally, the awareness about the savings that could be achieved with the increased<br />
energy consumption efficiency should be raised. Energy savings require investments, but<br />
these investments pay off quickly.<br />
Energy efficiency in Bosnia and Herzegovina, both on the production and transformation<br />
side, and on the consumption side, is low, relative to the developed economies. The energy<br />
production in BiH is based on technologies developed some thirty years ago, from the period<br />
of the construction of a number of blocks in the thermal power plants. In the case of<br />
construction of new plants and in major reconstructions of the existing facilities, new<br />
technologies should be introduced whenever possible.<br />
Renewable energy sources (except hydro-power), at the current level of development and at<br />
the current share in the overall energy consumption, could serve as a complement, rather<br />
than a replacement for the major plants. However, due to their low environmental impact,<br />
these technologies are developing rapidly and their use is increasing and it is for sure that<br />
B&H should pay more attention to this field in general.<br />
The reduced energy consumption can be partly achieved by introduction of district heating.<br />
Most of the current systems do not achieve the satisfactory effects, partly due to inadequate<br />
maintenance, and partly because there are no instruments for measuring individual heat<br />
consumption of consumers. The possibilities of combined production of heat and electric<br />
power, an option that is convenient for larger buildings or groups of buildings, are also<br />
underutilized. Because of its efficiency, the district heating saves fuel, and also contributes to<br />
reduced emission of CO2. The district heating systems can be used in hospitals, hotels,<br />
recreational and trade centres, and other larger public facilities, throughout B&H, particularly<br />
those where the natural gas can be used as a fuel.<br />
Taking into account that the largest share of energy is used for heating, and that the relative<br />
consumption of energy for heating in BiH is much higher than in the EU countries (according<br />
to the assessments made in the EU countries, at least one fifth of the energy consumed in<br />
households and commercial sectors is “easily savable”), and, obviously, there is a lot of room<br />
to reduce the energy consumption in this area. The methodology for designing energy<br />
performance indicators in buildings, used in Bosnia and Herzegovina, is mostly outdated and<br />
the revision of methodology would assist in both achieving energy savings in the buildings<br />
133
134<br />
ENERGY AND SUSTAINABLE DEVELOPMENT IN THE MEDITERRANEAN<br />
and reducing the investments for energy infrastructure in newly constructed buildings. This<br />
could also have an important role in the reconstruction, i.e. restoration of buildings.<br />
In the transport sector, significant changes need to be made with respect to energy demand,<br />
especially taking into account that the primary source of energy used is imported oil, i.e.<br />
petroleum products.<br />
For this reason, ways to increase the share of rail transport relative to road transport, which<br />
would allow for a greater use of domestic energy sources, should be considered.<br />
Priorities for energy sector in general, from the BIH MEDIUM TERM DEVELOPMENT<br />
STRATEGY (PRSP) for 2004-2007 will remain the following:<br />
1) Establish, develop and implement clear, well-designed energy policy and appropriate<br />
action plans<br />
Adopt the BiH Energy Development Strategy, in coordination of the BiH Ministry of<br />
Foreign Trade and Economic Relations and the competent FBiH and RS ministries,<br />
and with cooperation of domestic and international experts,<br />
Complete the establishment of the Energy Department in the BiH Ministry of Foreign<br />
Trade and Economic Relations,<br />
Develop the methodology for collection of energy statistics.<br />
2) Encourage energy saving in households and industry<br />
to reduce energy consumption, use existing and available technologies such as heat<br />
isolation, more efficient electrical appliances etc.<br />
as a priority, encourage greater use of public transportation and rationalize use of cars<br />
in cities<br />
increase awareness on savings possible through increased energy efficiency.<br />
3) Reform the energy pricing system<br />
Prices must be based on economic criteria and include costs of environmental<br />
protection.<br />
4) Encourage application of renewable and alternative energy sources, research and<br />
application of new energy technologies and other technologies increasing energy efficiency<br />
Intensify construction of planned hydropower plants through a concessionary model,<br />
and build small hydro-power plants,<br />
Install pilot facilities for utilization of wind, solar, geothermal and biomass energy.<br />
For the electric power sector the priorities are the reconstruction and privatization program<br />
of the separation of three vertically integrated elektroprivredas in BiH into transmission,<br />
production and distribution. The newly established transmission company is jointly owned by<br />
the two entities, while the production and the distribution will be privatized, to attract<br />
investments to BiH, ensure better governance and create efficient competition. The study<br />
entitled “BiH: Power Sector Restructuring and Privatization Analysis and <strong>Action</strong> <strong>Plan</strong>” done<br />
by American consulting firm “PA Consulting Group”, December 2001 worked out the<br />
sequence, scope and the dynamics of restructuring and privatization of the three<br />
elektroprivredas by early 2004, formulated a set of recommendations for the restructuring of<br />
the energy sector in BiH and defined the privatization strategy, designed to attract major<br />
strategic investors.<br />
The solutions for strategic issues in the coal sector should start with the integral approach<br />
to coal basins and coal beds and proceed to selection of specific adequate technological<br />
processes, taking into account the following elements:<br />
Demand outlook for energy from coal for the period up to 2015,<br />
Status and potential total balance and exploitation reserves and possibilities for<br />
introduction of new technologies (subsurface gasification, IGCC coal gasification<br />
technology and refined processing).
BOSNIA & HERZEGOVINA - – National study<br />
The existing studies and adopted international and national documents contain guidelines for<br />
a comprehensive transformation of coalmines into independent for-profit companies. In that<br />
context, the action plans have been prepared, with a particular focus on the electric power<br />
sector (elektroprivredas) and specifying the required resources. The privatization of the coal<br />
sector, following its restructuring, is proposed in principal. In principle, after restructuring,<br />
privatization of the coal sector through tenders is envisaged.<br />
The gas sector must undergo a process of reform and restructuring. The reform of the gas<br />
sector will be implemented in accordance with the BiH Strategy of Energy Sector<br />
Development, which is expected to be adopted later the completion of TASED project,<br />
according to the agreement between the BiH Ministry of Foreign Trade and Economic<br />
Relations and the line ministries in FBiH and RS.<br />
The key reform steps in the gas sector are:<br />
1) Transform legislative and institutional framework<br />
Adopt the Gas Sector Development Strategy within the BiH Strategy of Energy Sector<br />
Development.<br />
Adopt appropriate legislation and regulations, establish an independent system<br />
operator and resolve the regulatory functions by establishing one common regulator for<br />
oil and gas,<br />
Create an internal gas market,<br />
Introduce a tariff system.<br />
2) Strengthen capacities and improve efficiency of the gas sector<br />
Build an alternative supply route (When it comes to alternative supply and distribution<br />
network development, in addition to the undisputed “northern connection”, it will be<br />
necessary to determine the “external preconditions” in order for BiH network to develop<br />
further – meaning here the final route of the future South-European Gas Ring, as well<br />
as the routes of other gas interconnections in the immediate surroundings).<br />
Build underground storages and improve the load factors in the existing gas system,<br />
Diversify the sources of gas supply,<br />
Expand the gas distribution network to include several cities to which gas can be costeffectively<br />
supplied through the extensions of the existing system,<br />
Make preparations for attracting strategic partners – prepare the privatization<br />
documentation<br />
Ultimately, this means implementation of the EU Gas Directive and liberalization of the<br />
market, which is a precondition for integration into the European market.<br />
3) Actively represent BiH interests on the international scene<br />
Protect BiH interests in planning the regional energy networks;<br />
Take part in the establishment of the regional gas market;<br />
Strive to have one of the legs of the South-European Gas Ring pass through BiH.<br />
The oil sector can and should be a significant factor for the development of the economy of<br />
BiH and both entities. This is why it is considered that the cоncеpt of the development of the<br />
oil sector in BiH should become an integral part of the Medium-Term Development Strategy<br />
for BiH. The initial improvements were already made by the adoption of the Decision on the<br />
Quality of Liquid Oil Fuels by the BiH Council of Ministers of in September 2002, stipulating<br />
the obligation and the need of importing only the liquid fuels that correspond to the<br />
regulations and meet the EU quality standards.<br />
The key tasks in this sector are:<br />
Adopt the BiH oil industry development policy (under the BiH Strategy of Energy Sector<br />
Development);<br />
135
136<br />
ENERGY AND SUSTAINABLE DEVELOPMENT IN THE MEDITERRANEAN<br />
Adopt appropriate legislation and regulations on the basic principles of separation of<br />
functions of production, transport, storing, distribution and trade, for the purpose of<br />
establishing an open market and secure supply with this fuel;<br />
Set up a single agency to perform the regulatory function in this sector for all energy<br />
activities.<br />
The key tasks in district heating sector are:<br />
Establish the legislative and regulatory framework<br />
Adopt a strategy for resolving problems in the district heating sector;<br />
Establish a system of regulating the district heating prices at the level of BiH within the<br />
framework of a general energy price regulation system.<br />
Improve efficiency and accessibility of district heating<br />
Improve technical efficiency of the district heating systems – complete the rehabilitation<br />
projects and introduce the necessary oversight mechanisms;<br />
Expand the district heating coverage in cities and towns where the district heating<br />
systems have been reconditioned;<br />
Modernize existing district heating systems and make possible conversions to the heat<br />
from thermal power plants where this is possible, or to natural gas in the cities that will be<br />
connected to the gas network.<br />
The above considerations clearly indicate that the preparation of the BiH Energy Sector<br />
Development Strategy is a precondition for implementing all activities in this area, without<br />
which there will be no reduction of poverty, nor any significant economic development. At<br />
long last, it should become clear that the strategy must cover the entire BiH, because without<br />
the single energy policy, there can be no hope of accession to the EU.<br />
Table 59 Indicators for monitoring the energy sector reforms<br />
Indicator Source Estimate for BiH<br />
(2000/2001)<br />
2007<br />
Consumption of electric energy/per<br />
WDI 2002<br />
540.0 1,050<br />
capita (kwh/pc) (World Development Indicators)<br />
GDP per unit of consumed energy<br />
On the basis of WDI 2002,<br />
47.5 40<br />
(economic efficiency indicator) calculated for IHR MRC Report<br />
Emission of carbon dioxide/per capita<br />
IHR MRC Report<br />
3.2 3.5<br />
(u 1,000 kg) (Human Development Report<br />
- Millenium Development Goals –<br />
BiH 2003)<br />
Source: BiH Medium term Development Strategy (PRSP) (2004-2007)<br />
Although it is very hard to surely foreseen how the energy sector system will look like in the<br />
future, in this moment the solution is in establishment of the clear vision of the energy sector<br />
system which will include all dimensions of problem and will be harmonized with the changes<br />
in the energy sector of the developed countries, as well as with the solutions that in the best<br />
way respond to the interests in the development of Bosnia and Herzegovina. Surely that the<br />
limitations in achieving the objectives are very important here, and which first of all comes<br />
from the process of transition of Bosnia and Herzegovina, as well as the situation in economy<br />
and successfulness of the process of changes in total life of Bosnia and Herzegovina. Taking<br />
into consideration the experiences of the countries that are going through or already went<br />
through these processes, this is very complex, demanding and by dynamics uncertain<br />
process.<br />
Regarding the energy potential of BiH, the issue of energy sector is very important,<br />
especially in the context of regional cooperation because Bosnia and Herzegovina is one of<br />
the signatory countries of the Athena Memorandum. On the basis of establishment of the<br />
Energy Community for the South East Europe, the opportunity is open for BiH for the<br />
integration in energy market of EU, regardless of in which phase of the Process of<br />
Stabilization and Association the BiH is in. BiH will realize this through taking over the<br />
concrete part of acquis, which relates to energy, environment protection, competition and<br />
renewable energy resources.
BOSNIA & HERZEGOVINA - – National study<br />
Regardless to these limitations, today we can set out some starting, general characteristics,<br />
such as:<br />
Energy system of the future period must suit the needs of the users,<br />
Energy system must be diverse and must use different available sources and<br />
technologies,<br />
Energy system should be more and more decentralized,<br />
Energy efficiency and requests for initiating the process of increasing the energy<br />
efficiency,<br />
Requests for use of cleaner energy resources and technologies,<br />
Development of energy market with the active policy of state authorities, how in legal<br />
sense, so as well in the measures of economy policy,<br />
Researches, development and implementation of the new, clean and efficient<br />
technologies.<br />
6. Bibliography<br />
Basics for the preparation of the development strategy for energetics of Federation of Bosnia and Herzegovina,<br />
Mechanical Faculty of University in Sarajevo, Center for Energy.<br />
Chamber of Commerce of Republic of Srpska, Energy sector.<br />
Document of the Euroepan Bank for Reconstruction and Development (EBRD) - Strategy for Bosnia and<br />
Herzegovina, as approved by the Board of Directors at its meeting on 4 May 2005.<br />
Draft for preparation of energy development strategy for FB&H, Final version, Sarajevo, April 2003.<br />
Elektroprivreda Republike Srpske website.<br />
Environmental Performance Reviews for Bosnia and Herzegovina, ECE United Nations, 2004.<br />
Evaluation of the sustainable development in Bosnia and Herzegovina, Report of B&H for the World Summit on<br />
the Sustainable Development (WSSD), June 2002.<br />
GTZ Study of development of wood processing industry and furniture industry in Bosnia and Herzegovina,<br />
Technical cooperation with Bosnia and Herzegovina, November 2001.<br />
On the Road to Montreal 2005: Intergovernmental meeting under UNFCCC and the Kyoto Protocol, COUNTRY<br />
ASSESSMENT REPORT, September 2005.<br />
<strong>Plan</strong> for the construction of power production capacities in FB&H, FB&H Government, January 2005.<br />
PRSP, Poverty Reduction Strategy Paper for BiH, March 2004.<br />
Statistical Yearbook for FB&H of 1993-1998.<br />
Statistical Yearbook for SRB&H for 1992. Federal Statistical office, Sarajevo.<br />
Strategy of B&H Integration to EU, Council of Ministers of B&H, Directorate for EU Integration, April 2006.<br />
The analysis of achieved results of stakeholder operation in the economy and social activities in FBiH in 2005.<br />
The research and development- the relevant assumptions of the future energy sector in Bosnia and Herzegovina,<br />
Energoinvest-Institut za energetiku.<br />
137
7. Table of illustrations<br />
138<br />
ENERGY AND SUSTAINABLE DEVELOPMENT IN THE MEDITERRANEAN<br />
Figure 1 The mines and thermo-power plants in B&H ................................................................................................................. 105<br />
Figure 2 The gas supply system in B&H ...................................................................................................................................... 106<br />
Figure 3 The necessary funds for restoration of existing TPP of PC Elektroprivreda B&H (according to Fichtner Study) ................... 123<br />
Tableau 1 Prix de l’énergie en 2003 (par carburant) à la charge du consommateur final ................................................................ 94<br />
Table 2 Share of energy sector in social product (SP) of B&H for period 1970 –1980- 1990 in prices of 1972 in thousand<br />
of dinars according to principle of clear activities ............................................................................................................... 99<br />
Table 3 Share of industry and mining in GDP of B&H for period of 1995 - 1996 in million of USD .................................................. 99<br />
Table 4 Share of energy sector for RS for period of 2000 - 2005 ................................................................................................... 99<br />
Table 5 Share of energy sector for FB&H for period of 2000-2005 .............................................................................................. 100<br />
Table 6 Share of energy sector in export in thousands of dinars for period 1970 –1982 .............................................................. 100<br />
Table 7 Share of energy sector in import in thousands of dinars for period 1970 –1982 .............................................................. 100<br />
Table 8 Share of the energy sector in export in million of dinars for period 1983 –1985 .............................................................. 100<br />
Table 9 Share of the energy sector in import in million of dinars for period 1983 –1985 ............................................................. 100<br />
Table 10 Share of the energy sector in export in thousands dinars for period 1988 –1991 .......................................................... 101<br />
Table 11 Share of the energy sector in import in thousands dinars for period 1988 – 1991 ......................................................... 101<br />
Table 12 Share of the energy sector in export in thousands dinars for period 1999- 2003 for FB&H ............................................ 101<br />
Table 13 Share of the energy sector in import in thousands dinars for period 1999- 2003 for FB&H ............................................ 101<br />
Table 14 Share of jobs in energy sector in total number of jobs in SRB&H for period of 1970-1980............................................. 102<br />
Table 15 Share of jobs in energy sector in total number of jobs in SRB&H for period of 1983-1991 In thousands ........................ 102<br />
Table 16 Share of jobs in energy sector in total number of jobs in Federation of B&H for period of 1999-2005 in<br />
thousands ....................................................................................................................................................................... 102<br />
Table 17 Share of energy sector in total investment according to the nature of construction technical structure and<br />
purpose in million dinars ................................................................................................................................................. 103<br />
Table 18 Share of energy sector in total investment in 1990 according to the nature of construction technical structure<br />
and purpose in thousands of dinars: ................................................................................................................................ 103<br />
Table 19 The electricity production capacities per companies in B&H ......................................................................................... 105<br />
Table 20 1999 data for the purpose of Indicator ENE_C10 ........................................................................................................ 112<br />
Table 21 Cutting and processing of forest products in Bosnia and Herzegovina in 1990 .............................................................. 113<br />
Table 22 Fuel-wood consumption in industry in stacked cubic meter .......................................................................................... 113<br />
Table 23 Total demand for the period 1990-2005 of Elektroprivreda BiH ................................................................................... 114<br />
Table 24 Final relative electricity consumption per sector in GWh ............................................................................................... 114<br />
Table 25 Final relative electricity consumption percentage per sector ......................................................................................... 114<br />
Table 26 Consumption of coal in industry in SR B&H in thousands of tons .................................................................................. 115<br />
Table 27 Consumption of oil derivates for industry purpose in SRB&H ........................................................................................ 115<br />
Table 28 Consumption of gas for industry purpose in SRB&H ..................................................................................................... 115<br />
Table 29 Energy consumption per inhabitant on Level of Bosnia and Herzegovina ....................................................................... 115<br />
Table 30 Coal production in B&H in thousands of tons ............................................................................................................... 116<br />
Table 31 Coal production in FB&H in tons.................................................................................................................................. 116<br />
Table 32 Coal production in RS in tons ...................................................................................................................................... 116<br />
Table 33 Electricity production in B&H in power plants (1970-1996) ......................................................................................... 117<br />
Table 34 Electricity production in FB&H (1993-2002) ............................................................................................................... 117<br />
Table 35 Electricity production in RS (1993-2002) .................................................................................................................... 117<br />
Table 36 Production of oil derivates in B&H in thousands of tons ............................................................................................... 117<br />
Table 37 Indicator Electricity dependency rate of B&H for period of 1970-1996 ......................................................................... 118<br />
Table 38 Indicator: Electricity dependency rate of B&H for 2002 ................................................................................................ 119<br />
Table 39 Indicator ENE_PO3 Greenhouse gas effect emissions .................................................................................................. 121<br />
Table 40 Indicator ENE_CO4 Number of infrastructures on coastal areas ................................................................................... 122<br />
Table 41 Chemical composition of ash from TPP Gacko ............................................................................................................. 122<br />
Table 42 Indicator ENE_C13 Ozone picks frequency .................................................................................................................. 123<br />
Table 43 Power plants-candidates for construction in PC Elektroprivreda B&H up to 2010 ......................................................... 124<br />
Table 44 Indicator ENE_CO8 RUE and RE programmes share in energy investment and R&D investments ................................... 127<br />
Table 45 Average Energy Sources Prices in dinars (ex-Yugoslavia currency) in B&H for the period of 1970-1990 ......................... 127<br />
Table 46 Indicator ENE_CO5: Final consumer energy price per fuel in 2003 for F B&H ................................................................ 127<br />
Table 47 Indicator ENE_C11 Share of fuel and electricity expenditures in household budgets in B&H in percentages<br />
(average per member of household) ................................................................................................................................. 127<br />
Table 48 Indicator ENE_CO6 Existing incentives measures and policies for RE and RUE development at national level ................ 127
BOSNIA & HERZEGOVINA - – National study<br />
Table 49 Indicator ENE_CO7 Cities/regions/provinces with an existing energy audit and/or carbon audit and/or with<br />
objectives in terms of RE and RUE .................................................................................................................................... 127<br />
Table 50 Indicator ENE_PO4 total sum of investments made within the Kyoto protocol’ Flexibility mechanism ............................. 127<br />
Table 51 Indicator ENE_P01 Total energy intensity .................................................................................................................... 129<br />
Table 52 Indicator ENE_P02 Renewable energy share in total energy ......................................................................................... 129<br />
Table 53 Indicator ENE_C12 Job creation through the development of RE and RUE ..................................................................... 130<br />
Table 54 Indicator ENE_C08 Expenditures in RE and RUE: RE and RUE programmes share in energy investments ........................ 130<br />
Table 55 Composition and quantity of solid waste deposited on Sarajevo landfill ....................................................................... 131<br />
Table 56 Gas characteristics from Sarajevo landfill .................................................................................................................... 131<br />
Table 57 Total investments of five options of possible heat energy source ................................................................................... 132<br />
Table 58 Technical data of Option 1 of possible heat energy source ............................................................................................ 132<br />
Table 59 Indicators for monitoring the energy sector reforms ...................................................................................................... 136<br />
139
CYPRUS<br />
By M. Costas PAPASTAVROS, Ministry of Agriculture, Natural Resources and<br />
Environment<br />
TABLE OF CONTENTS<br />
I. Summary ........................................................................................................................ 143<br />
1. Challenges and energy sustainability.................................................................................................... 143<br />
2. Indicators ................................................................................................................................................... 143<br />
3. Currently established policies in terms of RE and URE ...................................................................... 144<br />
4. Difficulties, possible solutions, needed reforms ................................................................................. 145<br />
5. Success story............................................................................................................................................. 145<br />
II. Résumé ......................................................................................................................... 147<br />
1. Défis et durabilité énergétique............................................................................................................... 147<br />
2. Les indicateurs .......................................................................................................................................... 147<br />
3. Politiques mises en œuvre en termes d’ER et d’URE ......................................................................... 148<br />
4. Difficultés, solutions possibles et réformes nécessaires ................................................................... 149<br />
5. Success stories ......................................................................................................................................... 149<br />
III. National study .............................................................................................................. 151<br />
1. Introduction ............................................................................................................................................... 151<br />
2. PART I: The country's energy situation: indicators and basic data....................................................154<br />
3. PART II: Rational energy use (REU) - Renewable energies (RE)........................................................ 173<br />
4. PART III: Examples of good practice, case studies............................................................................. 206<br />
5. PART IV: Proposals for more sustainable energy development ....................................................... 224<br />
Bibliography........................ .......................................................................................................................... 228
I. SUMMARY<br />
CYPRUS - Summary<br />
1. Challenges and energy sustainability<br />
The total electricity production in Cyprus was 4,348 GWh during 2005 against 4,176 GWh in<br />
2004. This corresponds to an increase of 4.1% compared to the previous year, covering the<br />
total energy demand of the residential, urban, industrial and rural areas under the effective<br />
control of the Government of the Republic of Cyprus. The Gross Production for 1990 was<br />
1,974 GWh, of which 1,445 GWh was the actual consumption.<br />
The demand for electricity in Cyprus continues to rise. The Cyprus Energy Regulatory<br />
Authority (CERA) and the Transmission System Operator (TSO), which are both regulators,<br />
have provided data for historic demand and made estimates of future demand up to 2015.<br />
Their projections are based on an analysis of maximum demand on an hourly basis and at<br />
different times of the year. A strong correlation between actual electricity demand and gross<br />
domestic product (GDP) was identified for the period 1995 to 2005, despite the fact that GDP<br />
was not taken into account in the CERA/TSO analysis. This was then projected based on<br />
Ministry of Finance GDP projections to 2009, and beyond to 2015 assuming the same rate of<br />
increase in GDP. Gross demand is expected to increase from 4,910 MWh in 2007 to 7,004<br />
MWh in 2015, an average increase of 5.2% per annum.<br />
National targets for the contribution of energy efficiency measures are set for all Member<br />
States in the Energy End-Use Efficiency and Energy Services Directive (Directive<br />
2006/32/EC of 27 th April 2006). Cyprus has set the indicative targets of 5% contribution of<br />
RUE to electricity demand up to 2010. It is assumed that for the period until 2015 the same<br />
increase will be achieved.<br />
The potential contributions of Renewable Energy Sources (RES) have already been defined<br />
by the Cyprus Energy Service. These figures are consistent with the report that Cyprus has<br />
submitted to the EC on the implementation of the Directive on the Promotion of Electricity<br />
from Renewable Energy Sources (2001/77/EC) up to 2010, indicates a target of 6% for the<br />
contribution of RES to electricity demand in 2010. It is assumed that for the period until 2015<br />
the same increase will be achieved.<br />
Cyprus being an island does not import or export energy.<br />
Cyprus ratified the UNFCCC as a non-Annex I party on 15 th October 1997, and on the same<br />
basis, subsequently ratified the Kyoto Protocol on 16 th July 1999. It follows that Cyprus has<br />
no emissions limitation commitments under the KP. Indeed, out of 25 EU Member States,<br />
only Cyprus and Malta have no commitments. Although Cyprus does not have any individual<br />
reduction limitation commitments, as a Member State of the European Union, Cyprus is now<br />
bound by the obligations set out in European Union legislation.<br />
The Greenhouse Gas Emissions for 2004 were 10281 kt CO2 eq, of which 7613 kt CO2 eq<br />
were from the sector of energy, in comparison to the total of 6011 kt CO2 eq and 4453 kt CO2<br />
eq from the energy sector in 1990. Emissions caused by the sector of Energy for 2004<br />
accounted for 74% of total GHG emissions, corresponding to an increase of 71% in<br />
comparison to 1990 levels, and 3.4% in comparison to 2003.<br />
2. Indicators<br />
The following energy contribution to the country‟s energy balance is expected by year 2010,<br />
provided that all £42 million are offered in the form of grants and/or subsidies. Increase of the<br />
share of energy from renewable sources from 4% in 1995 to 9% of total energy consumed in<br />
2010. Increase of electricity generated from renewable energies, from the presently zero<br />
level, to 6% by 2010; 4.6% based on wind energy projects (small and large), 0.1% by<br />
utilisation of solar energy (photovoltaics); 1.2% utilisation of energy originating from biomass<br />
and 0.1% from Hydroelectric energy.<br />
Regarding wind potential (on-shore), in Cyprus there are some areas with mean wind<br />
velocity of 5-6 m/s and few areas with 6,5-7m/sec. The estimated maximum exploitable<br />
143
144<br />
ENERGY AND SUSTAINABLE DEVELOPMENT IN THE MEDITERRANEAN<br />
potential is 150-250MW. Utilisation of wind energy in Cyprus is affected by anticyclones<br />
moving from west to east, from the Siberian anticyclone during the winter and from the low<br />
pressure crated in the area of India and expanded until the area of Cyprus during the<br />
summer; sea breezes generated in coastal areas as a result of the different heat capacities<br />
of sea and land, which give rise to different rates of heating and cooling; and mountain valley<br />
winds created when cool mountain air warms up in the morning and begins to rise while cool<br />
air from the valley moves to replace it. During the night the flow reverses. The prospect of<br />
installing wind turbines in the Southern coast of Cyprus (near shore applications) is currently<br />
been investigated. Initial studies showed that due to the high depth of the sea at relatively<br />
short distance from the shore, more that 30m depth at a distance of 300 m from the shore,<br />
the cost of the installation of the wind turbines is expected to be very high, to the extend that<br />
the wind potential which exists at those areas will not be enough to compensate the<br />
investment.<br />
Concerning solar energy potential, the Meteorological service of Cyprus has classified the<br />
Island in 14 zones from a climatic point of view. However, from the considerations, affecting<br />
the use of solar energy, the classification may be broadened to 3 zones – coastal, central<br />
plains and mountains. The collection of sunshine duration data at a number of meteorological<br />
stations started in 1959. Statistical analysis shows that all parts of Cyprus enjoy a sunny<br />
climate. The mean daily sunshine, i.e. the time interval from sunrise to sunset, for Cyprus<br />
varies from 9.8 hours in December to 14.5 hours in June.<br />
The theoretical potential is always estimated from data for the cultivated areas for each crop<br />
and the residue yield. Then the available potential can be evaluated with the assumption that<br />
only a portion of the theoretical potential is available for energy exploitation since there are<br />
other uses for most agricultural residues. Current biomass exploitation refers to a significant<br />
amount of agricultural residues in connection to the traditional wood stoves and the<br />
prospects of the development of energy crops, even though, further analysis and on site<br />
investigation may identify possible difficulties on harvesting of agricultural by-products for<br />
bioelectricity production.<br />
Biomass resources in Cyprus include a wide range of biomass residues, agricultural and<br />
forest, municipal solid waste, sewage water sludge and a considerable potential of energy<br />
crops, which include traditional herbaceous corps, or short rotation woody crops. A large<br />
energy potential exists from energy crops that can be grown on deforested or otherwise<br />
degraded lands. The potential for small hydro plants is very limited, especially with the water<br />
shortages over the last years. The suitable sites are estimated as being adequate for a<br />
maximum of about 1MW installed capacity.<br />
3. Currently established policies in terms of RE and URE<br />
The first formulation of Renewable Energy and Energy Conservation <strong>Action</strong> <strong>Plan</strong> was<br />
completed in 1985 and revised in 1998. This included the first energy support Scheme for the<br />
sectors of manufacturing industry, hotels and agriculture. In year 2000, the Applied Energy<br />
Centre and the Cyprus Institute of Energy were established. Moreover, the Electricity<br />
Authority of Cyprus (EAC) agreed to purchase electricity generated from RES; the<br />
independent authority of Transmission System Operator (TSO) was set; procedures have<br />
been specified for licensing and interconnection of wind and photovoltaic installations to the<br />
national grid; an <strong>Action</strong> <strong>Plan</strong> (2002-2010) for RES was formulated; the legislative framework<br />
for the promotion of RES and conservation of energy (2003) was established; Cyprus Energy<br />
Regulatory Authority (CERA) (2004) was instituted; New support schemes have been<br />
initiated (2004); and New Enhanced Support Schemes for RES and RUE (2006) were<br />
created.<br />
To enforce the provisions of Directive 2001/77/EC of the European Parliament, Cyprus has<br />
introduced relevant legislation for the implementation and monitoring of the announced<br />
energy policy.<br />
A new law [33(I) 2003], provides for the creation of a Special Fund whose proceeds will<br />
come from a levy of £0.13 per kWh (approximately 0.74 euro cent) on all electricity
CYPRUS - Summary<br />
consumption, donations and government grants. The Fund finances programmes for the<br />
promotion of renewable energy sources and energy conservation which are approved by the<br />
Council of Ministers. It is managed by a Committee headed by the Permanent Secretary of<br />
the Ministry of Commerce, Industry and Tourism. Its implementation is monitored by the<br />
Energy Service of the Ministry of Commerce, Industry and Tourism. The Energy Service<br />
operates its own Applied Energy Centre (AEC), which in close collaboration with the Cyprus<br />
Institute of Energy (CIE), serves as the focal point for all efforts in the field of energy<br />
conservation and renewable energy sources.<br />
Grants and/or subsidies are provided for investments by companies, households and public<br />
sector bodies in energy conservation and in renewable energy systems such as wind, solar<br />
thermal, photovoltaic, small hydro, biomass and desalination.<br />
4. Difficulties, possible solutions, needed reforms<br />
As it can be validated by researches performed by EUROSTAT, Cyprus is one of the first<br />
countries in the EU that the public recognises Climate Changes, and their associated<br />
problems. However, very small percentage recognises that large investments have to be<br />
made in the energy sector, and priorities have to be set by the stakeholders. Nevertheless,<br />
the feedback from the energy saving/ renewable energy schemes are very promising, since<br />
more and more people apply for the available funding.<br />
For help the strengthening of country‟s sustainable development policies diversification of the<br />
energy supply sources is the primary concern. This corresponds to construction of a<br />
receiving / regasification terminal for Liquefied Natural Gas (LNG), which would make<br />
possible the importation of natural gas. The overall environmental situation in Cyprus is<br />
characterized by deficiencies in environmental infrastructure, particularly in the area of urban<br />
waste water treatment, solid and hazardous waste management. Moreover, a continuous<br />
degradation of the natural environment particularly in the coastal areas was observed, due<br />
mainly to tourist development, whereas in the area of the energy intensity of the economy<br />
and the green house gases emissions, the relevant indicators for Cyprus are at relatively<br />
higher levels as compared to the EU average. This is to be explained by the technology used<br />
in the generation of electricity (use of heavy fuel oil); the operation of energy intensive<br />
industries such as cement production; and the absence of public transport systems such as<br />
railways, simultaneously with the fact that the bus system is not well developed.<br />
Energy consumption is steadily increasing, whereas the transport sector accounts for a<br />
significant percentage of the total energy consumption.<br />
5. Success story<br />
In terms of Renewable Energy Sources (RES), 4% of the country‟s energy originates from<br />
solar energy, and is mainly used for the heating of water. 1% of the energy supply comes<br />
from solids, and is used for industry. With respect to the solar energy use, the EU Study “Sun<br />
in <strong>Action</strong>” ranks Cyprus first with approximately 1m² of installed solar collector per capita.<br />
Today, about 690,000 m² of solar collectors are installed in Cyprus. Approximately 90% of<br />
privately owned houses, 80% of apartments and 50% of hotels are equipped with solar water<br />
heating systems.<br />
145
II. RÉSUMÉ<br />
1. Défis et durabilité énergétique<br />
CYPRUS - Résumé<br />
La production d'électricité totale à Chypre était de 4,348 GWh en 2005 contre 4,176 GWh en<br />
2004. Cela correspond à une augmentation de 4,1% par rapport à l'année précédente,<br />
couvrant la demande totale en énergie des zones résidentielles, urbaines, industrielles et<br />
rurales sous le contrôle effectif du Gouvernement de la République de Chypre. La production<br />
brute en 1990 était de 1,974 GWh dont 1,445 GWh représentait la consommation réelle.<br />
La demande d'électricité à Chypre continue à augmenter. L'Autorité de Régulation de<br />
l'Energie de Chypre (AREC) et l'Opérateur du Système de Transmission (OST), qui sont tous<br />
deux des régulateurs, ont fourni des données historiques de demande, et ont estimé la future<br />
demande jusqu'en 2015. Leurs projections sont basées sur une analyse de la demande<br />
maximum sur une base horaire, à différentes périodes de l'année. On a identifié une forte<br />
corrélation entre la demande en électricité réelle et le produit national brut (PNB) pour la<br />
période de 1995 à 2005, en dépit du fait que le PNB n'a pas été pris en compte dans<br />
l'analyse de l'AREC/OST. On a alors projeté le PNB sur la base des données du Ministère<br />
des Finances jusqu'en 2009 et au-delà jusqu'en 2015, assumant que le taux d'augmentation<br />
du PNB resterait inchangé. On s'attend à ce que la demande brute augmente de 4,910 MWh<br />
en 2007 à 7,004 MWh en 2015, ce qui représente une augmentation moyenne de 5,2 % par<br />
an.<br />
Les cibles nationales et leur participation par des mesures pour l'efficacité énergétique sont<br />
fixées pour tous les États Membres par la Directive sur l'Efficacité de l'Utilisation Finale de<br />
l'Energie et sur les Services en Énergie (Directive 2006/32/CE du 27 avril 2006). Chypre a<br />
fixé les cibles indicatives d'une participation de 5% de l'URE à la demande en électricité d‟ici<br />
2010. On suppose que pour la période jusqu'en 2015 la même augmentation sera réalisée.<br />
Les contributions potentielles des Sources d'Énergie renouvelables (SER) ont déjà été<br />
définies par le Service de l'Énergie de Chypre. Ces chiffres concordent avec le rapport que<br />
Chypre a soumis à la CE sur les applications de la Directive sur la Promotion de la<br />
production d'Électricité par des Sources d'énergie Renouvelables (2001/77/CE) jusqu'en<br />
2010, et qui montre une cible de 6% pour la contribution du SER à la demande en électricité<br />
en 2010. On estime que pour la période jusqu'en 2015 la même augmentation sera atteinte.<br />
Chypre étant une île, elle n'importe ni n'exporte son énergie.<br />
Chypre a ratifié la partie UNFCCC en tant que partie non-annexe 1 le 15 octobre 1997 et sur<br />
la même base, a subséquemment ratifié le protocole de Kyoto le 16 Juillet 1999. Il s'ensuit<br />
que Chypre n'a pas d'engagements de limitation d'émissions selon le PK. En fait, des 25<br />
Membres de l'UE, seules Chypre et Malte n‟ont pas d‟engagements. Bien que Chypre n'ait<br />
pas d'engagement individuel de limitation, en tant qu'État Membre de l'UE, elle est<br />
maintenant liée par les obligations existant dans la législation de l'UE.<br />
En 2004, les Émissions des Gaz à Effet de Serre étaient de 10281 kt CO2 eq, dont 7613 Mt<br />
CO2 eq provenaient du secteur de l'énergie, comparé au total de 6011 kt CO2 eq et 4453 kt<br />
CO2 eq provenant du secteur de l'énergie en 1990. Les émissions provoquées par ce<br />
secteur en 2004 représentaient 74 % du total des EGES, ce qui correspond à une<br />
augmentation de 71 % par rapport aux niveaux de 1990 et 3,4 % par rapport à 2003.<br />
2. Les indicateurs<br />
La participation énergétique suivante à l'équilibre en énergie du pays est attendue vers<br />
l'année 2010, pourvu que 42 millions de livres soient accordées sous forme de subventions<br />
et/ou d'allocations. Augmentation de la part des énergies renouvelables de 4 % en 1995 à 9<br />
% de l'énergie totale consommée en 2010. Augmentation de l'énergie provenant de sources<br />
d'énergies renouvelables du niveau zéro à 6 % vers 2010 ; 4,6% basées sur des projets<br />
concernant l'énergie éolienne (petits et grands), 0.1% provenant de l'énergie solaire<br />
(photovoltaïque) ; 1,2% par l'utilisation d'une énergie provenant de la biomasse et 0,1% de<br />
l'énergie hydroélectrique.<br />
147
148<br />
ENERGY AND SUSTAINABLE DEVELOPMENT IN THE MEDITERRANEAN<br />
En ce qui concerne le potentiel éolien (sur terre), à Chypre, il y a des zones où la vitesse des<br />
vents va de 5 à 6 m/s et quelques zones à 6,7 à 7 m/s. Le potentiel maximum exploitable est<br />
de 150 à 250 MW. L'utilisation de l'énergie éolienne à Chypre est affectée par des<br />
anticyclones se déplaçant d'ouest en est, provenant de l'anticyclone sibérien en hiver et de la<br />
basse pression créée dans la région de l'Inde et se développant jusqu'à la région de Chypre<br />
pendant l'été ; par les brises côtières prenant naissance près de la mer provenant des<br />
variations de températures entre la mer et la terre ce qui donne lieu à différents degrés de<br />
réchauffement et de rafraîchissement. De plus, les vents des vallées créés quand l'air frais<br />
des montagnes se réchauffe le matin et commence à s'élever alors que l'air frais de la vallée<br />
se met en mouvement pour le remplacer. Pendant la nuit, le flux s'inverse. On envisage<br />
d'installer des éoliennes sur la côte sud de Chypre (installations non loin de la côte). Les<br />
études préliminaires ont montré qu'à cause de la grande profondeur de la mer à une faible<br />
distance de la côte, plus de 30 m de profondeur à 300 m du rivage, le coût des installations<br />
d'éoliennes sera important, tellement que la ressource éolienne importante qui existe dans<br />
ces zones ne sera pas suffisante pour compenser le coût de production. Ces projets sont<br />
donc économiquement non viables.<br />
En ce qui concerne le potentiel d'énergie solaire, le service météorologique de Chypre a<br />
classé l'île en 14 zones climatiques. Cependant, à partir de ces considérations, et pour<br />
l'énergie éolienne, la classification peut être ramenée à 3 zones principales – côtière, plaines<br />
centrales et montagnes. La collecte des informations de la durée d'ensoleillement dans un<br />
certain nombre de stations météorologiques a commencé en 1959. L'analyse statistique<br />
montre que toutes les parties de Chypre jouissent d'un climat ensoleillé. La durée moyenne<br />
d'ensoleillement, c'est à dire l'intervalle entre le lever et le coucher du soleil, pour Chypre,<br />
varie entre 9,8 heures en décembre et 14,5 heures en juin.<br />
Le potentiel théorique est toujours estimé d'après les informations sur les zones cultivées<br />
pour chaque récolte et leur rendement résiduel. Alors, le potentiel disponible peut être<br />
évalué, en supposant que seule une partie du potentiel théorique est disponible pour<br />
l'exploitation énergétique. Il y a en effet d'autres utilisations à la plupart des résidus<br />
agricoles. Lorsqu'on fait référence à l'exploitation de la biomasse courante on parle d'une<br />
quantité significative de résidus agricoles en relation avec les chaudières à bois<br />
traditionnelles et des projets de développement des cultures à des fins énergétiques, même<br />
si des analyses plus poussées et des recherches sur site peuvent permettre d'identifier des<br />
difficultés possibles à la récoltes de produits d'origine agricole pour la production de<br />
bioélectricité.<br />
Les ressources en biomasses à Chypre incluent une grande variété de résidus, agricoles ou<br />
forestiers, les ordures municipales solides, les boues des eaux usées et un potentiel<br />
considérable en cultures pour l'énergie incluant les cultures herbacées traditionnelles ou les<br />
cultures de bois à rotation courte. Un grand potentiel existe à partir de cultures qui peuvent<br />
être réalisées sur les terres déforestées ou dégradées. Le potentiel en énergie des petites<br />
usines hydroélectriques est très limité, spécialement à cause des pénuries en eau des<br />
dernières années. On estime que des sites convenables pourraient avoir une capacité de<br />
production d'au maximum environ 1 MW.<br />
3. Politiques mises en œuvre en termes d’ER et d’URE<br />
La première formulation d'un <strong>Plan</strong> d'<strong>Action</strong> pour la Conservation de l'Énergie et les Énergies<br />
Renouvelables a été faite en 1985 et révisée en 1998. Elle incluait un premier <strong>Plan</strong> d'aide<br />
énergétique aux secteurs de l'industrie, des hôtels et de l'agriculture. En 2000, le Centre d'<br />
Énergie Appliquée et l'Institut de l'Energie de Chypre furent créés. De plus, l'Autorité<br />
Électrique de Chypre (EEC) fut d'accord pour acheter l'électricité générée par SER.<br />
L'Opérateur du Système de Transmission (OST) fut fondé. On établit des procédures pour<br />
inclure à la grille nationale les installations réalisant une interconnexion entre le vent et les<br />
installations photovoltaïques. Un <strong>Plan</strong> d'<strong>Action</strong> (2000-2010) pour les SER fut mis au point. Le<br />
cadre législatif pour la promotion des SER et la conservation de l'énergie (2003) a été établi.<br />
En 2004, l'Autorité de Régulation de l'Energie de Chypre a été instituée. De nouveaux plans
CYPRUS - Résumé<br />
d'aide ont été mis en oeuvre (2004) et de Nouveaux <strong>Plan</strong>s d'Aide au SER et à l'URE (2006)<br />
ont été créés.<br />
Pour appliquer les dispositions de la Directive 2001/77/CE du Parlement Européen, Chypre a<br />
introduit une législation adaptée à l'application et au suivi de la politique énergétique<br />
annoncée.<br />
Une nouvelle loi [33(1) 2003] prévoit la création d'un Fonds Spécial dont les recettes<br />
proviendront d'une taxe de £0,13 par KWh (environ 0,74 Euro) sur toute consommation<br />
d'énergie, de dons et de subventions gouvernementales. Le Fonds finance des programmes<br />
en faveur de la promotion de sources d'énergie renouvelables et la conservation de l'énergie,<br />
approuvés par le Conseil des Ministres. Il est dirigé par un Comité à la tête duquel se trouve<br />
le Secrétaire permanent du Ministère du Commerce, de l'Industrie et du Tourisme. Sa mise<br />
en oeuvre est dirigée par le Service de l'Energie du Ministère du Commerce, de l'Industrie et<br />
du Tourisme. Le Service de l'Energie gère son propre Centre pour l'énergie Appliquée (CEA)<br />
qui – en proche collaboration avec le Centre de l'énergie de Chypre – sert de point focal à<br />
tous les efforts dans le domaine de la conservation de l'énergie et des sources d'énergies<br />
renouvelables. Des allocations et/ou subventions sont attribuées pour des investissements<br />
par des sociétés, des ménages et des entités du secteur public dans la conservation de<br />
l'énergie et les systèmes d'énergies renouvelables tels que le vent, le chauffage solaire, le<br />
photovoltaïque, les petites unités hydrologiques, la biomasse et la désalinisation.<br />
4. Difficultés, solutions possibles et réformes nécessaires<br />
Comme on peut le vérifier par les recherches réalisées par EUROSTAT, Chypre est l'un des<br />
premiers pays de l'UE dans lequel le public est conscient des changements climatiques et<br />
des problèmes associés. Cependant, un très petit pourcentage reconnaît que de grands<br />
investissements doivent être réalisés dans le secteur de l'énergie et que des priorités doivent<br />
être fixées par les parties prenantes. Cependant, le retour des plans pour l'économie et<br />
l'énergie renouvelable sont très prometteurs car de plus en plus de gens font appel aux<br />
fonds disponibles.<br />
Pour aider au renforcement des politiques de développement durable, la diversification des<br />
sources d'approvisionnement est le premier enjeu. Cela correspond à la construction d'un<br />
terminal pour la réception / regasification du gaz naturel liquéfié (GNL) qui rendrait possible<br />
l'importation de gaz naturel. La situation environnementale globale de Chypre se caractérise<br />
par des manques dans l'infrastructure environnementale, particulièrement dans la zone du<br />
traitement des eaux usées urbaines, et la gestion des déchets solides et dangereux. De plus,<br />
une dégradation continue de l'environnement naturel, surtout dans la zone littorale, a été<br />
observée ; elle est surtout due au développement touristique, alors que dans le domaine de<br />
l'intensité de l'énergie de l'économie et dans les émissions de gaz à effet de serre, les<br />
indicateurs concernant Chypre sont à des niveaux relativement hauts en comparaison à la<br />
moyenne de l'UE. Cela peut s'expliquer par la technologie utilisée pour produire l'électricité<br />
(utilisation de fioul) ; par le fonctionnement des industries demandeuses d'énergie telles que<br />
la production de ciment ; par l'absence de systèmes de transport en commun tel que le<br />
chemin de fer, alors que le système de bus n'est pas assez développé.<br />
La consommation énergétique s'accroît de façon stable, alors que le secteur des transports<br />
intervient pour un pourcentage significatif dans la consommation totale de l'énergie.<br />
5. Success stories<br />
En termes de Sources d'Énergies Renouvelables (SER), 4% de l'énergie du pays provient de<br />
l'énergie solaire et elle est surtout utilisée pour chauffer l'eau. 1% de l'approvisionnement en<br />
énergie vient de solides et est utilisé pour l'industrie. En ce qui concerne l'utilisation de<br />
l'énergie solaire, l'étude de l'UE “Soleil en <strong>Action</strong>” classe Chypre en tête avec 1m2 de<br />
panneaux solaires installés par habitant. De nos jours, environ 690 000 m2 de panneaux<br />
solaires sont installés à Chypre. Environ 90 % des maisons privées, 80 % des appartements<br />
et 50 % des hôtels sont équipés d'un système de chauffage de l'eau solaire.<br />
149
III. NATIONAL STUDY<br />
1. Introduction<br />
CYPRUS- III. National Study<br />
This report has been prepared by Dr. Costas Papastavros, with the assistance of<br />
Theodoulos Mesimeris and Nicoletta Kythreotou, Environment Officers in Environment<br />
Service of the Ministry of Agriculture, Natural Resources and Environment. The Expert<br />
Service Provider Contract was signed between “<strong>Plan</strong> Bleu” and “The Consultant” (Dr Costas<br />
Papastavros).<br />
The data presented in this report primarily concern the areas under the effective control of<br />
the Government of the Republic of Cyprus.<br />
The main components of the report are:<br />
PART I – The country’s energy situation: indicators and basic data<br />
• Share of the Energy Sector and Institutional Specifications<br />
• Energy Supply, Demand and production: evolution and structure<br />
• Impacts and risks of the observed and forecast evolutions<br />
• Financing and investment needs<br />
PART II – Rational Energy Use (REU)-Renewable Energies (RE): policies, tools,<br />
progress, resulting effects, case studies<br />
• RUE and RE Policies<br />
• Instruments and measures to be taken in favour of RUE and RE<br />
• Energy Efficiency Evolution-decoupling<br />
• Renewable Energy evolution<br />
• Existing or expected effects and benefits of RUE and RE<br />
PART III – Examples of good practice, case studies<br />
• Content of good practice and case studies<br />
• Examples<br />
PART IV – Proposals for more sustainable energy development<br />
• Summary of under exploited RUE and RE<br />
• Proposals for a sustainable energy development<br />
151
152<br />
ENERGY AND SUSTAINABLE DEVELOPMENT IN THE MEDITERRANEAN
CYPRUS- III. National Study<br />
2. PART I: The country’s energy situation: indicators and basic data<br />
2.1 Share of the Energy Sector and Institutional Specificities<br />
2.1.1 The Sector’s economic weight<br />
The most recent data show that during 2005 there was an increase in the rate of economic<br />
growth in this sector 1 , estimated at 5.3%, compared to 3.5% in 2004. Generation,<br />
transmission and distribution of electric energy is by far the most important industry of the<br />
sector and in 2005 contributed 80.0% to the sectoral value added. Sales of electricity rose by<br />
5.4% and reached 3,930.7 million kWh in 2005 from 3,729.3 million kWh in 2004. The<br />
highest increases were recorded in the construction and health and social work. In the<br />
manufacturing sector, the largest increases in the usage of electricity were recorded in<br />
chemical and chemical products and metal products industries. Decreases were observed in<br />
the clothing and refined petroleum products industries. Consumption of electricity by<br />
households rose by 8.9%, for water pumping purposes by 2.9% and for public lighting by<br />
13.9%.<br />
Expenditure on fixed assets in the sector dropped to C£62.1 million from C£95.6 million in<br />
2004. Construction works for the extension and reinforcement of the electricity transmission<br />
system and the water supply network accounted for 66.5% of total investment. Machinery<br />
and equipment accounted for 32.3% and transport equipment for the remaining 1.2%.<br />
Employment in the sector increased from 1.6 thousand persons in 2004 to 1.7 thousand in<br />
2005, which represents less than 0.5% of the total gainfully employed population for the<br />
production of the Gross Domestic Product.<br />
2.1.2 National energy resources and potential saving<br />
The energy system of Cyprus depends almost entirely on the imported fuels; 97% of Cyprus’<br />
primary energy supply needs originate from imported crude oil and final oil products. The<br />
transport sector consumes almost all the Gasoline and Kerosene imported, and 50% of<br />
diesel. Diesel is also used by all demand sectors. LPG is used in the domestic and services<br />
sectors, whereas coal and fuel oil are used only by industry. The principal fuel for electricity<br />
generation is heavy fuel oil. Concerning coal, there are no mining activities in Cyprus, but<br />
some small quantities are imported for cement production; no import restrictions are applied.<br />
In general, solid fuels are not important for Cyprus. No gas is used for energy production in<br />
Cyprus, but studies have been carried out for the examination of import scenarios for the<br />
harmonisation with the requirements of the European Union.<br />
In terms of Renewable Energy Sources (RES), 4% of the country’s energy originates from<br />
solar energy, and is mainly used for the heating of water. 1% of the energy supply comes<br />
from solids, and is used for industry. 50% of the energy supply is used for transportation,<br />
whereas industrial, residential and tertiary sectors use 27%, 15% and 8% respectively. Oil<br />
1 In Cyprus, the sector also includes gas and water in addition to electricity<br />
153
154<br />
ENERGY AND SUSTAINABLE DEVELOPMENT IN THE MEDITERRANEAN<br />
products, mainly used for transportation, contribute the most to the net domestic<br />
consumption per fuel (80%), with electricity, solar and coal providing 16%, 2% and 1%<br />
respectively. The net domestic consumption per fuel, gives a total of 1.66 Mtoe (according to<br />
2000 data). With respect to the solar energy use, the EU Study “Sun in <strong>Action</strong>” ranks Cyprus<br />
first with approximately 1m² of installed solar collector per capita. Today, about 690,000 m² of<br />
solar collectors are installed in Cyprus. Approximately 90% of privately owned houses, 80%<br />
of apartments and 50% of hotels are equipped with solar water heating systems.<br />
2.1.3 Institutional specificities and energy policies<br />
The main institutional specificities regarding energy administrative organization, production<br />
and distribution, market structure the decision making process for energy process and users<br />
associations are the following:
Electricity Authority of Cyprus (EAC)<br />
CYPRUS- III. National Study<br />
Even though the market has been liberalized, at the moment, the only energy provider in<br />
Cyprus is the Electricity Authority of Cyprus, with the exceptions of some industrial units that<br />
are directly consuming fuel for the production electrical energy.<br />
The Electricity Authority of Cyprus is an independent, semi government corporation<br />
established under the Electricity Development Law Cap.171 of 1952 in order to exercise and<br />
perform functions relating to the generation and supply of electric energy in Cyprus.<br />
Transmission System Operator (TSO)<br />
The basic provisions of the Law regarding the establishment of the Transmission System<br />
Operator are the following:<br />
• The Transmission System Operator Unit upon the issue of license by the<br />
Cyprus Energy Regulatory Authority (CERA), will be the Transmission System<br />
Operator<br />
• The TSO is exclusively responsible for the operation of the Transmission<br />
System and has the responsibility for the credibility, security and its optimum<br />
economic operation and management. In order to be in a position to operate<br />
objectively, the TSO compiles Transmission and Distribution Rules that<br />
regulate the technical characteristics and the basic operation procedures of<br />
the Transmission System<br />
• In the framework of operation and management of the electricity market, the<br />
TSO compiles and applies Trading and Settlement Rules, according to which<br />
all power trading is carried out<br />
• The TSO prepares studies defining the charges for the connection and use of<br />
the Transmission System by the users. The users of the Transmission System<br />
are also obliged to sign protocols or enter into agreements with the TSO<br />
• The TSO is responsible for the preparation of Demand Forecasts, Total<br />
Consumption Forecasts and Forecasts on the future behaviour of the<br />
Transmission System<br />
• The TSO is responsible for securing the development and maintenance of the<br />
Transmission System, according to forecasts about its behaviour for the<br />
coming decade. For this reason it studies and prepares the Ten Year<br />
Development <strong>Plan</strong> of the Transmission System.<br />
Cyprus Energy Regulatory Authority (CERA)<br />
CERA in an independent authority of the Government of Cyprus with executive power and<br />
authorities in the field of energy. Among others, CERA has the power and authority to:<br />
• Give, monitor, enforce, modify or recall permits<br />
• Consult the Minister in all the issues relevant to electricity<br />
• Ensure that the transfer, distribution, and electricity market regulations, are prepared and<br />
approved in accordance to the relevant legislation<br />
• Ensure sufficiency in electric supply<br />
• Control prices<br />
• Determine quality levels<br />
155
156<br />
ENERGY AND SUSTAINABLE DEVELOPMENT IN THE MEDITERRANEAN<br />
Energy Service (Ministry of Commerce, Industry and Tourism)<br />
The Energy Service of the Ministry of Commerce, Industry and Tourism has the overall<br />
responsibility of Energy in Cyprus and specifically for:<br />
• Monitoring and coordinating the supply and availability of sufficient energy capacity for<br />
domestic needs.<br />
• Monitoring and participating in the formation of the European Policy for energy issues.<br />
• Suggesting ways for the implementation of the European Acquis, assists in the<br />
preparation of Laws, Regulations, Rules etc and implements programmes for their<br />
promotion.<br />
• Preparing and implementing programmes for energy conservation, the promotion of<br />
renewable energy sources (RES) and the developing of technologies for the utilization of<br />
RES<br />
• Assisting the Government in the formation of the national energy policy for Cyprus in<br />
coordination with all other bodies involved<br />
Recent evolution in energy policies<br />
The first formulation of Renewable Energy and Energy Conservation <strong>Action</strong> <strong>Plan</strong> was<br />
completed in 1985 and revised in 1998. This included the first energy support Scheme for the<br />
sectors of manufacturing industry, hotels and agriculture. In year 2000, the Applied Energy<br />
Centre and the Cyprus Institute of Energy were established. Moreover,<br />
• the Electricity Authority of Cyprus (EAC) agreed to purchase electricity generated from<br />
RES;<br />
• the independent authority of Transmission System Operator (TSO) was set;<br />
• procedures have been specified for licensing and interconnection of wind and photovoltaic<br />
installations to the national grid;<br />
• an <strong>Action</strong> <strong>Plan</strong> (2002-2010) for RES was formulated;<br />
• the legislative framework for the promotion of RES and conservation of energy (2003) was<br />
established;<br />
• Cyprus Energy Regulatory Authority (CERA) (2004) was instituted;<br />
• New support schemes have been initiated (2004); and<br />
• New Enhanced Support Schemes for RES and RUE (2006) were created.<br />
Support measures have been set and applied for RES (wind energy, biomass, and solar<br />
collectors) as measures of RES promotion.
CYPRUS- III. National Study<br />
157
158<br />
ENERGY AND SUSTAINABLE DEVELOPMENT IN THE MEDITERRANEAN<br />
2.2 Energy supply, demand and production: evolution and<br />
structure<br />
2.2.1 Electricity access<br />
The total of Electricity produced in the government controlled areas of the Republic of Cyprus<br />
(with the exception of those north of the confrontation line where the Cyprus Government<br />
does not exercise effective control) consists of:<br />
1) The total electrical energy generated by the three Power Stations of EAC<br />
2) The energy produced by Auto-producers<br />
3) The power produced by Independent Power Producers by the use of:<br />
♦ Renewable Sources of Energy<br />
♦ Conventional Generating Units<br />
During 2005, only Power Stations of cases 1 and 2 above operated. The total energy<br />
produced for 2005 increased to 4,376,042,038 kWh. The total energy imported in the<br />
Transmission System, excluding the losses in the Power Stations and the Transmission<br />
System, amounted to 4,102,483,700 kWh.<br />
The overall production by the three Power Stations of the Electricity Authority of Cyprus was<br />
4,347,942,740 kWh during 2005 against 4,176,149,000 kWh in 2004. This corresponds to an<br />
increase of 4.1% compared to the previous year, covering the total energy demand of the<br />
residential, urban, industrial and rural areas under the effective control of the Government of<br />
the Republic of Cyprus. The Gross Production of 1990 was 1,974,480 MWh, of which<br />
1,445,452 MWh was the actual consumption.<br />
2.2.2 Evolution and structure of energy demand and production<br />
The evolution of the energy production and demand since 1966 (up to 2006) are presented in<br />
Figure 2.1, whereas the sectoral demand is presented in Figure 2.2.<br />
Electricity (´000GWh)<br />
9<br />
8<br />
7<br />
6<br />
5<br />
4<br />
3<br />
2<br />
1<br />
0<br />
Figure 2.1. Total electricity production and consumption (1966-2005)<br />
Total<br />
Consumption GWh<br />
Gross<br />
Production GWh<br />
1966 1970 1974 1978 1982 1986 1990 1994 1998 2002
Electricity (´000GWh)<br />
4<br />
3<br />
2<br />
1<br />
0<br />
CYPRUS- III. National Study<br />
Figure 2.2. Total electricity consumption by category (1966-2005)<br />
1966 1970 1974 1978 1982 1986 1990 1994 1998 2002<br />
Structure of the energy production<br />
1. Vasilikos Power Station<br />
Vasilikos Power Station, with an installed capacity of 298 MW (2 x 130 MW Steam Units and<br />
38 MW Gas Turbine Unit) generated in 2004, 1,718,062 MWh, which corresponds to 41.14%<br />
of the total electricity generated from the Authority’s Power Stations. During the same period<br />
the Station exported, 1,619,717 MWh, which corresponds to 41.00% of the total electricity<br />
exported from the Authority’s Power Stations.<br />
The thermal coefficient of efficiency of the Steam Units for units generated reached 39.45%<br />
whereas the corresponding thermal coefficient of efficiency for the Gas Turbines reached<br />
27.84%.<br />
Moreover, the thermal coefficient of efficiency of the Steam Units, for units exported, reached<br />
37.19% whereas the corresponding thermal coefficient of efficiency for the Gas Turbine<br />
reached 24.37%.<br />
2. Dhekelia power station<br />
Public<br />
Lighting GWh<br />
Agriculture GWh<br />
Industrial GWh<br />
Commercial GWh<br />
Domestic GWh<br />
Dhekelia Power Station, with an installed capacity of 360 MW (6 x 60 MW Steam Units),<br />
generated in 2004, 1,967,851 MWh which corresponds to 47.12% of the total electricity<br />
generated from the Authority’s Power Stations. During the same period, Dhekelia Power<br />
Station exported, 1,870,535 MWh which corresponds to 47.35% of the total electricity<br />
exported from the Authority’s Power Stations.<br />
The thermal coefficient of efficiency of the Power Station for units generated reached 31.26%<br />
whereas the respective coefficient of efficiency for units exported reached 29.71%.<br />
159
160<br />
3. Moni power station<br />
ENERGY AND SUSTAINABLE DEVELOPMENT IN THE MEDITERRANEAN<br />
Moni Power Station, with an installed capacity of 330 MW (6 x 30 MW Steam Units and 4 x<br />
37.5 MW Gas Turbine Units), generated in 2004, 490,236 MWh which corresponds to<br />
11.74% of the total electricity generated from the EAC’s Power Stations. During the same<br />
period the Station exported 460,227 MWh, which corresponds to 11.65% of the total<br />
electricity exported from the Authority’s Power Stations.<br />
The thermal coefficient of efficiency of the Steam Units for units generated reached 24.89%<br />
whereas the corresponding thermal coefficient of efficiency for the Gas Turbines reached<br />
25.46%. Moreover, the thermal coefficient of efficiency of the Steam Units for units exported<br />
reached 23.33% whereas the corresponding thermal coefficient of efficiency for the Gas<br />
Turbines reached 24.67%.<br />
Growth rates currently evolving and current demand and production (2015-2025)<br />
The primary energy production per source in thousands kWh is illustrated in Table 2.1.
CYPRUS- III. National Study<br />
Table 2.1. Electricity production and consumption by category, 1966-2005<br />
The demand for electricity in Cyprus continues to rise. The Cyprus Energy Regulatory<br />
Authority (CERA) and the Transmission System Operator (TSO), which are both regulators,<br />
have provided data for historic demand and made estimates of future demand up to 2015.<br />
Their projections are based on an analysis of maximum demand on an hourly basis and at<br />
different times of the year. A strong correlation between actual electricity demand and gross<br />
domestic product (GDP) was identified for the period 1995 to 2005, despite the fact that GDP<br />
was not taken into account in the CERA/TSO analysis. This was then projected based on<br />
Ministry of Finance GDP projections to 2009, and beyond to 2015 assuming the same rate of<br />
increase in GDP. The projected annual electricity demand over the particular period<br />
correlated very closely with CERA/TSO projections (Figure 2.3). For the period 2015 to 2025<br />
it is expected to have the same rate of increase regarding the energy demand.<br />
161
162<br />
ENERGY AND SUSTAINABLE DEVELOPMENT IN THE MEDITERRANEAN<br />
Figure 2.3. Forecast based on TSO and GDP projections of energy demand based up to 2015<br />
GWh<br />
This correlation is based on the equation:<br />
Where<br />
8,000<br />
7,000<br />
6,000<br />
5,000<br />
4,000<br />
3,000<br />
2,000<br />
1995 1997 1999 2001 2003 2005 2007 2009 2011 2013 2015<br />
D = 1.1191 x G – 2,151.8<br />
D = Gross Annual Electricity Demand (GWh)<br />
TSO Actuals<br />
TSO Projections<br />
Projection Based on GDP<br />
G = Gross Domestic Product (GDP) in Cyprus Pounds (CYP) at 1995 prices<br />
The predicted gross electricity demand for each year of the period up to 2015 is summarised<br />
in Table 2.2 below. Gross demand is expected to increase from 4,910 MWh in 2007 to 7,004<br />
MWh in 2015, an average increase of 5.2% per annum.
CYPRUS- III. National Study<br />
Table 2.2. Projected Gross Electricity Demand<br />
Energy Demand<br />
(GWh)<br />
After Impact of 6%<br />
RES (GWh)<br />
After Impact of 5%<br />
RUE (GWh)<br />
2007 4,910.00 4,910.00 4,910.00 4,910.00<br />
2008 5,220.00 4,910.00 4,910.00 4,910.00<br />
2009 5,510.00 4906.8 4,959.00 4,645.80<br />
2010 5,850.00 5179.4 5,234.50 4,903.90<br />
2011 6,200.00 5499 5,557.50 5,206.50<br />
2012 6,600.00 5828 5,890.00 5,518.00<br />
2013 6,732.00 6204 6,270.00 5,874.00<br />
2014 6,866.60 6328.08 6,395.40 5,991.48<br />
2015 7,004.00 6454.604 6,523.27 6,111.27<br />
After Impact of 5% RUE<br />
& 6% RES (GWh)<br />
The gross demand will be reduced because as a consequence of the energy saving<br />
programmes (RUE) and renewable energy sources (RES).<br />
Notional targets for the contribution of energy efficiency measures are set for all Member<br />
States in the Energy End-Use Efficiency and Energy Services Directive (Directive<br />
2006/32/EC of 27th April 2006). Cyprus has set the indicative targets of 5% contribution of<br />
RUE to electricity demand up to 2010. It is assumed that for the period until 2015 the same<br />
increase will be achieved.<br />
The potential contributions of Renewable Energy Sources (RES) have already been defined<br />
by the Cyprus Energy Service. These figures are consistent with the report that Cyprus has<br />
submitted to the EC on the implementation of the Directive on the Promotion of Electricity<br />
from Renewable Energy Sources (2001/77/EC) up to 2010, indicates a target of 6% for the<br />
contribution of RES to electricity demand in 2010. It is assumed that for the period until 2015<br />
the same increase will be achieved.<br />
163
164<br />
ENERGY AND SUSTAINABLE DEVELOPMENT IN THE MEDITERRANEAN<br />
2.2.3 Impacts and risks of the observed and forecast evolutions<br />
Energy dependence and energy bill, reduction in export capacities<br />
Cyprus does not import or export energy.<br />
Greenhouse gas effect<br />
National Binding objectives relative to Kyoto Protocol<br />
The European Union, representing the 15 pre-May 2004 Member States, is an Annex I<br />
signatory to the United Nations Framework Convention on Climate Change (UNFCCC) and<br />
an Annex B signatory to its Kyoto Protocol. The Kyoto Protocol (KP) sets quantified targets<br />
for reducing greenhouse gas emissions for those signatories that are included in its Annex B.<br />
Cyprus ratified the UNFCCC as a non-Annex I party on 15 th October 1997, and on the same<br />
basis, subsequently ratified the Kyoto Protocol on 16 th July 1999.<br />
It follows that Cyprus has no emissions limitation commitments under the KP. Indeed, out of<br />
25 EU Member States, only Cyprus and Malta have no commitments. All the other 23<br />
Member States are individually Annex I Parties to the Convention (Annex B to the Kyoto<br />
Protocol), and so have quantified emission limitation commitments. Thus, for the time being,<br />
Cyprus and Malta have exceptional status within the EU.<br />
Although Cyprus does not have any individual reduction limitation commitments, the country<br />
fully supports the European Commission in leading all 25 Member States towards ambitious<br />
reductions in greenhouse gas emissions, together with the EU’s leading role in the<br />
international action on climate change. Also, as a Member State of the European Union,<br />
Cyprus is now bound by the obligations set out in European Union legislation.<br />
The starting point and the duration of the second commitment period have not been<br />
discussed yet, while it is obvious that there will be a new burden-sharing agreement of the<br />
EU Member-States for this period. Therefore, the formulation of policies and measures for<br />
the reduction of greenhouse gases emissions (with a time horizon that covers also the period<br />
2010-2020) is essential for Cyprus.<br />
Evolution of CO2 emissions from the energy sector<br />
The results from the calculations made for the GHG emissions by sector are presented in<br />
Table 2.3, and the sectoral contribution to the total GHG emissions for 1990 to 2004 in<br />
Figure 2.4.
CYPRUS- III. National Study<br />
Table 2.3. Total GHG emissions (in Mt CO2 eq) by sector for the years 1990-2004<br />
1990 1991 1992 1993 1994 1995<br />
Energy 4452.86 4452.86 5153.95 5502.00 5556.78 5541.75<br />
Industrial Processes 570.52 570.52 566.55 547.85 530.82 514.95<br />
Solvent and Other Product Use 2.29 2.29 2.41 2.45 2.49 2.51<br />
Agriculture 570.62 570.62 621.62 645.22 639.48 663.50<br />
Land-Use Change and Forestry -18.90 -18.90 -57.52 -52.26 -68.56 -72.33<br />
Waste 433.23 433.23 461.37 465.15 475.44 481.11<br />
Other (please specify) 0.00 0.00 0.00 0.00 0.00 0.00<br />
TOTAL 6010.62 6010.62 6748.38 7110.41 7136.45 7131.49<br />
1996 1997 1998 1999 2000 2001<br />
Energy 5865.31 6012.27 6364.20 6498.85 6762.53 6664.58<br />
Industrial Processes 513.48 458.04 604.61 1347.41 1392.49 1375.20<br />
Solvent and Other Product Use 2.54 2.56 2.59 2.59 2.59 2.59<br />
Agriculture 684.58 666.00 671.72 666.86 671.85 695.59<br />
Land-Use Change and Forestry -83.08 -99.95 -116.22 -116.22 -116.22 -116.22<br />
Waste 473.97 480.48 489.30 546.52 558.58 580.80<br />
Other (please specify) 0.00 0.00 0.00 0.00 0.00 0.00<br />
TOTAL 7456.80 7519.40 8016.21 8946.01 9271.82 9202.54<br />
165
166<br />
ENERGY AND SUSTAINABLE DEVELOPMENT IN THE MEDITERRANEAN<br />
2002 2003 2004<br />
Energy 7073.37 7338.07 7612.77<br />
Industrial Processes 1386.32 1383.52 1480.16<br />
Solvent and Other Product Use 2.59 2.59 2.59<br />
Agriculture 718.44 721.78 671.72<br />
Land-Use Change and Forestry -116.22 -116.22 -116.22<br />
Waste 590.84 615.76 630.02<br />
Other (please specify) 0.00 0.00 0.00<br />
TOTAL 9655.35 9945.51 10281.05<br />
Energy<br />
74%<br />
Industrial<br />
Processes<br />
11%<br />
Solvent and<br />
Other Product<br />
Use<br />
0.03%<br />
Agriculture<br />
8%<br />
Land-Use<br />
Change and<br />
Forestry<br />
1%<br />
Waste<br />
6%<br />
Figure 2.4. Contribution of activity sectors to total GHG emissions during 1990 and 2004<br />
Emissions caused by the sector of Energy for 2004 accounted for 74% of total GHG<br />
emissions, corresponding to an increase of 71% in comparison to 1990 levels, and 3.4% in<br />
comparison to 2003. The sector with the greatest increase of emissions since 1990 is<br />
industry, showing an increase of 159% in comparison to 1990 and 7% in comparison to<br />
2003. A large decrease however, has been achieved by the land use changes and forestry.<br />
Moreover, agricultural emissions even though have increased by 17.7% between 1990 and<br />
2004, have reduced by 7% between 2003 and 2004. Table 2.4 shows the contribution of the<br />
sectors to the total emissions produced annually.
CYPRUS- III. National Study<br />
Table 2.4. Contribution of sectors to the total emissions produced annually for 1990-2004<br />
Energy Industrial<br />
Processes<br />
Solvent and Other<br />
Product Use<br />
Agriculture Land-Use Change<br />
and Forestry<br />
1990 74.1% 9.5% 0.04% 9.5% -0.3% 7.2%<br />
1991 74.1% 9.5% 0.04% 9.5% -0.3% 7.2%<br />
1992 76.4% 8.4% 0.04% 9.2% -0.9% 6.8%<br />
1993 77.4% 7.7% 0.03% 9.1% -0.7% 6.5%<br />
1994 77.9% 7.4% 0.03% 9.0% -1.0% 6.7%<br />
1995 77.7% 7.2% 0.04% 9.3% -1.0% 6.7%<br />
1996 78.7% 6.9% 0.03% 9.2% -1.1% 6.4%<br />
1997 80.0% 6.1% 0.03% 8.9% -1.3% 6.4%<br />
1998 79.4% 7.5% 0.03% 8.4% -1.4% 6.1%<br />
1999 70.6% 14.6% 0.03% 7.2% -1.3% 5.9%<br />
2000 73.5% 15.1% 0.03% 7.3% -1.3% 6.1%<br />
2001 72.4% 14.9% 0.03% 7.6% -1.3% 6.3%<br />
2002 73.3% 14.4% 0.03% 7.4% -1.2% 6.1%<br />
2003 73.8% 13.9% 0.03% 7.3% -1.2% 6.2%<br />
2004 74.0% 14.4% 0.03% 6.5% -1.1% 6.1%<br />
Evolution of CO2 emissions from the energy sector<br />
Waste<br />
The assumptions used for the calculations and projections performed for the scenarios of<br />
“Business as Usual” are Demographic characteristics, Weather conditions and<br />
Macroeconomic rates. For the projection of emissions from the energy sector, the ENPEP<br />
(Energy and Power Evaluation Program) model was used. ENPEP was developed by the<br />
Argonne National Laboratory (ANL, USA) and comprises several distinctive models, which<br />
have as target the full analysis/simulation of the energy/electricity system, with parallel<br />
quantification of its environmental and social consequences. The emissions calculated on the<br />
basis of sector and gas. Table 2.5 summarises the results of the sectors energy, agriculture,<br />
industry, tertiary, wastes, contributing the most to the GHG emissions.<br />
167
168<br />
ENERGY AND SUSTAINABLE DEVELOPMENT IN THE MEDITERRANEAN<br />
Table 2.5. Emissions of GHG per sector in kt CO2 equivalents, based on the BaU scenario,<br />
projected for 2010, 2015 and 2020<br />
Sector 1990 2010 2015 2020<br />
Energy 4452.9 10689.8 12539.7 15175.4<br />
Industry 570.6 646.5 686.1 665.7<br />
Solvents 2.3 3.0 3.0 3.0<br />
Agriculture 570.6 739.0 741.1 741.1<br />
Wastes 433.2 632.1 657.3 638.4<br />
TOTAL 6029.6 12710.4 14627.2 17223.6<br />
Comparison to 1990 110.8% 142.6% 185.7%<br />
Other impacts on the environment<br />
Emission projections provide a tool which enables the authorities to decide the most<br />
appropriate national policies and measures to be adopted and implemented to achieve<br />
emission targets. Emission projections depend on a wide range of assumptions including<br />
future economic growth, structural changes in the economy, implementation rate of cleaner<br />
technology as well as global factors including world economic trends and fuel prices which<br />
are outside the scope of national influence. Furthermore, the implementation of the relevant<br />
EU environmental legislation plays an important role in the design of each State´s policy. For<br />
the reduction of emissions to the required level, it is necessary to implement policies to<br />
reduce emissions progressively, i.e. by building on existing measures and by implementing<br />
additional measures. In the following tables the projected emissions for the four NEC<br />
pollutants are given.
SO2<br />
CYPRUS- III. National Study<br />
Table 2.6 Projected Emissions Report for SO2, NOx and VOC<br />
1 Energy industries (Combustion in power<br />
plants & Energy Production)<br />
2 Manufacturing Industries and Construction<br />
(Combustion in industry)<br />
Reference<br />
Year<br />
(2000)<br />
Latest<br />
Historic<br />
Year<br />
(1990)<br />
2010 Projection<br />
BaU<br />
With<br />
Measures<br />
33.51 22.21 36.00 24.00 -<br />
4.04 4.80 5.00 4.50 -<br />
3 Road Transport 7.50 4.49 9.00 0.50 -<br />
4 Other Transport ΝΕ ΝΕ - - -<br />
5 Other sectors 3.67 1.86 4.00 3.00 -<br />
6 Fugitive emissions (from fuels) ΝΕ ΝΕ - - -<br />
NOx<br />
1 Energy industries (Combustion in power<br />
plants & Energy Production)<br />
2 Manufacturing Industries and Construction<br />
(Combustion in industry)<br />
5.98 3.52 8.00 5.50 -<br />
0.44 0.40 0.50 0.50 -<br />
3 Road Transport 9.92 6.50 11.00 7.00 -<br />
4 Other Transport ΝΕ ΝΕ - - -<br />
5 Other sectors 1.30 0.58 1.50 1.50 -<br />
6 Fugitive emissions (from fuels) ΝΕ ΝΕ - - -<br />
VOC<br />
1 Energy industries (Combustion in power<br />
plants & Energy Production)<br />
2 Manufacturing Industries and Construction<br />
(Combustion in industry)<br />
2.49 1.49 3.00 3.00 -<br />
2.84 2.05 3.00 2.00 -<br />
3 Road Transport 9.42 9.26 10.00 4.00 -<br />
4 Other Transport ΝΕ ΝΕ - - -<br />
With<br />
Additional<br />
Measures<br />
169
170<br />
ENERGY AND SUSTAINABLE DEVELOPMENT IN THE MEDITERRANEAN<br />
5 Other sectors 0.24 0.10 0.30 0.30 -<br />
6 Fugitive emissions (from fuels) 0.74 0.71 1.20 0.40 -<br />
2.2.4 Financing and investment needs<br />
According to the existing policies a grants scheme for the promotion of the Renewable<br />
Energy Sources was established for the period 2002 – 2010. The scheme provides financial<br />
incentives in the form of government grants for the promotion of investments in the field of<br />
energy saving and energy production from renewable energy sources. Due to the recently<br />
official announcement for the commencement of the new grants scheme for the promotion of<br />
RES and Energy Conservation, a lot of foreign investors have expressed interest in RES<br />
investments. On the other hand Cypriots wish to get financial incentives provided by the<br />
government in order to invest for energy production for their own uses. The utilisation of RES<br />
seems to develop rapidly as consequence of the formulation of the Grant Scheme.<br />
Currently, in Cyprus due to favourable climate conditions the solar energy is extensively used<br />
especially for the production of sanitary hot water. The present image of Solar Water Heating<br />
Systems is excellent in Cyprus among individual users:<br />
• In individual house – people are satisfied with their SWHS’s and would buy a<br />
new one if they had to replace their old one.<br />
• In flats – people would like to “switch to solar”.<br />
• In hotels and apartments – SWHS is a “must” for any new hotel builder.<br />
However, the solar industry managers seem to be more sceptical and the problems faced by<br />
the Cyprus industry, at present, are:<br />
• Non-expanding domestic market, so it appears as necessity to promote<br />
export sales;<br />
• To disengage from the highly saturated market of individual SWHS’s in favour<br />
of collective housing systems, tourism and health facilities, and industrial hot<br />
water processes.<br />
• New solar application should be investigated i.e. space heating and cooling.
CYPRUS- III. National Study<br />
171
172<br />
ENERGY AND SUSTAINABLE DEVELOPMENT IN THE MEDITERRANEAN<br />
3. PART II: Rational energy use (REU) – Renewable energies (RE):<br />
policies, tools, progress, resulting effects, case studies
3.1 RUE and RE Policies<br />
CYPRUS- III. National Study<br />
The <strong>Action</strong> <strong>Plan</strong> is the result of the Cyprus Government commitment towards the promotion<br />
of RES and Energy Saving. It provides the creation of a special financing mechanism to<br />
promote energy conservation and to increase the share of renewable energy sources. The<br />
<strong>Action</strong> <strong>Plan</strong> sets targets for the increase of the utilization/contribution of the country´s main<br />
renewable energy sources, to the total electricity consumption and overall to the total energy<br />
balance. It includes a financing mechanism for programmes to encourage renewable energy<br />
sources and it proposes measures to eliminate administrative obstacles. The <strong>Action</strong> <strong>Plan</strong><br />
covers the period 2002-2010.<br />
3.1.1 Expected results<br />
Increase the share of energy from renewable sources in the provision of total energy<br />
produced from 4% in 1995, to 9% in 2010. Increase of electricity generated from renewable<br />
energy sources, from the present zero level, to 6% by 2010.<br />
The above stated targets are indicative and are subject to re-evaluation every two years.<br />
Additional programs for the promotion of renewable energy sources and energy conservation<br />
may be introduced in future, so as to achieve the targets set by the <strong>Action</strong> <strong>Plan</strong>.<br />
3.1.2 Design and priorities of policy measures<br />
The energy policy must have a long term planning period. The energy system is linked to all<br />
activities and represents one of the most important key factors for the economic development<br />
of Cyprus. The satisfaction of energy needs in a safe and reliable way forms a prerequisite<br />
for a sound evolution of productive and consumer profiles. The economic competitiveness<br />
depends to a large extent on the proper relation between the cost and quality of energy<br />
inputs. Furthermore, the quality of life depends significantly on the capital-intensive and have<br />
a long life-cycle, during which their total profit is determined. The energy sector itself<br />
constitutes a basic element of the development process and an important source of income<br />
and employment.<br />
Concluding, the characteristics of the energy sector itself, together with its links to the energy<br />
sector itself, together with its links to the various economic activities, determine the long-term<br />
character of the energy policy adopted. Any change in the “energy doctrine” requires the<br />
formulation of a permanent policy framework and decision process, the impacts of which will<br />
gradually occur within a 10-20 years time.<br />
Thus, an <strong>Action</strong> <strong>Plan</strong> for the promotion of RES in Cyprus presupposes that, in the long-term,<br />
the penetration of RES will not continue to represent a marginal issue, but on the contrary it<br />
will form a constitutional element of the Cyprus energy policy. Under this condition, the most<br />
important issues related to the energy policy of the country, together with issues related<br />
directly or/and indirectly with he efficient formulation and performance of a new energy<br />
doctrine that incorporates RES to the maximum possible extent are investigated.<br />
The action plan presented below comprises 4 basic guidelines: (a) bring the state and<br />
society into action, (b) increase the reliability of RES, (c) motivate investors and investments<br />
and (d) reduce barriers for specific RES. Some of the proposed measures are presented in<br />
the following table.<br />
173
174<br />
ENERGY AND SUSTAINABLE DEVELOPMENT IN THE MEDITERRANEAN<br />
Table 3.1. Proposed measures for the Cyprus RES and RUE policy<br />
Potential barriers Policy measures<br />
Low public awareness Organisation of information campaigns.<br />
Insufficient supply of information to investors and<br />
end-users (private agents, agricultural co-operations<br />
and local authorities) concerning the available RES<br />
potential and the possible technological resources.<br />
Reluctance of local authorities and organisations to<br />
realise RES investments, due to high investment<br />
risk and/or lack of financial resources.<br />
Lack of a concise time schedule for RES<br />
development<br />
Reluctance of end-users for realising RES<br />
investments in the final demand level<br />
Difficult penetration of renewable technologies with<br />
high investment cost<br />
Mistrust of public agents concerning the reliability of<br />
renewable technologies<br />
Bureaucracy obstacles and delays in the license<br />
procedure<br />
Introduction of relevant courses to the educational programmes of all<br />
levels<br />
Creation of a central database on the RES potential and the<br />
experience gained from investments realised.<br />
Activation of the public sector in order to set the example.<br />
Development of the “energy consultants” group.<br />
Promotion of new financial scheme by means of information of finance<br />
institutions.<br />
Incentives for the development of industry involved in renewable<br />
technologies.<br />
Incentives for the development of pilot projects to be used as<br />
successful examples<br />
Formulation of a national action plan for RES<br />
Extension of the support measures to the domestic sector<br />
Promotion of investments for combined use (e.g. RES/desalination)<br />
Differentiation of subsidies from the investment cost to the price of the<br />
energy produced<br />
Gradual shifting of subsidies from the investment cost to the price of<br />
the energy produced<br />
Simplification of the approval procedure<br />
Low reliability of RES Use of certified products<br />
Submission of the supporting documents only to the Ministry of<br />
Commerce, Industry and Tourism (“one-stop-shop”)<br />
R&D promotion<br />
Technical constraints in electricity generation Optimal management of the electricity network by EAC<br />
Distortion of relevant prices Tax and price policy, tradable permits<br />
Proposed list of supportive measures by technology: Wind farms<br />
Disregard of potential environmental impacts Proper sitting of wind farms on the basis of noise and visual impact<br />
Eventual “saturation” phenomena in some areas,<br />
because of wind farms’ over-concentration<br />
Insufficient supply of information to the investors<br />
concerning the RES potential in the various sites<br />
Determination of the “carrying capacity” per area<br />
Formulation of a guide for investors containing wind velocities,<br />
topographical, land-use and technical data for the various sites<br />
Creation of a network for wind speed measurement in various regions/<br />
model simulation
Uniform buy-back price, regardless of the type of<br />
load covered<br />
Operational problems of wind turbines due to<br />
different wind conditions in Cyprus<br />
CYPRUS- III. National Study<br />
Differentiation of buy-back prices<br />
Specification of equipment quality standards<br />
High dependence on imported equipment Incentives for the development of domestic manufacturing<br />
Reservations of EAC concerning the effects of the<br />
installed wind systems to the network behaviour<br />
Proposed list of supportive measures by technology: Biomass<br />
Indifference of farmers to dispose the agricultural<br />
residues<br />
Uncertainty about the availability of biomass to<br />
supply the conversion plants<br />
Reservations of farmers to shift towards new<br />
cultivations<br />
Potential negative environmental impacts due to the<br />
irrational use of fertilisers and pesticides in energy<br />
plantations<br />
Software development in order to forecast wind velocities and<br />
consequently the energy and power contribution from wind farms<br />
Prohibition of the on-site burning of agricultural by-products<br />
Long-term contracts with farmers for raw material provision<br />
Support of farmers by specialised agronomists<br />
Incentives<br />
Atmospheric pollution during combustion Establishment of upper limits for atmospheric pollutants generated<br />
from biomass conversions<br />
Lack of biofuels’ competitiveness compared to<br />
conventional fuels<br />
Proposed list of supportive measures by technology: solar collectors<br />
Lower taxation of biofuels.<br />
Establishment of a mandatory biofuel percentage in gasoline and<br />
diesel<br />
Low level of penetration in the hotel sector Mandatory installation of solar collectors for water heating provided by<br />
the building code in the new hotels<br />
Reluctance to install solar collectors for water<br />
heating in existing buildings because of low<br />
profitability<br />
Potential visual impact in case of solar collectors’<br />
installation in traditional buildings<br />
Incentives for the hotel sector<br />
Tax compensation<br />
Mandatory use of solar collectors in public buildings (new and existing)<br />
Provision of grants<br />
License from relevant authorities according to specified rules (more<br />
flexible legislation concerning the aesthetic impact)<br />
Low competitiveness of PVs Subsidies to photovoltaic use, especially in remote systems<br />
175
176<br />
ENERGY AND SUSTAINABLE DEVELOPMENT IN THE MEDITERRANEAN
CYPRUS- III. National Study<br />
3.2 Instruments and measures to be taken in favour of RUE and<br />
RE – Law for the promotion of RES<br />
To enforce the provisions of Directive 2001/77/EC of the European Parliament, Cyprus ha<br />
introduced relevant legislation for the implementation and monitoring of the announced<br />
energy policy.<br />
An new law [33(I) 2003], provides for the creation of a Special Fund whose proceeds will<br />
come from a levy of £0.0013 per KWh (approximately 0.0074 euro cent) on all electricity<br />
consumption, donations and government grants. The Fund finances programmes for the<br />
promotion of renewable energy sources and energy conservation which are approved by the<br />
Council of Ministers. It is managed by a Committee headed by the Permanent Secretary of<br />
the Ministry of Commerce, Industry and Tourism.<br />
The Law was approved in 2003. Its implementation is monitored by the Energy Service of<br />
the Ministry of Commerce, Industry and Tourism.<br />
The Energy Service operates its own Applied Energy Centre (AEC), which in close<br />
collaboration with the Cyprus Institute of Energy (CIE), serves as the focal point for all efforts<br />
in the field of energy conservation and renewable energy sources.<br />
The Cyprus Institute of Energy was established in 2000 by the Minster of Commerce Industry<br />
and Tourism and its primary objectives are to promote Renewable Energy Sources utilisation<br />
and energy saving/conservation. It shares the facilities with the AEC and it has the flexibility<br />
to cooperate with the private sector. Both the AEC and the CIE play a significant role during<br />
the implementation phase of the national grant scheme for the promotion of RES.<br />
3.2.1 Financing Arrangements<br />
The Law provides for the financing mechanism for programs for renewable energy sources<br />
and energy conservation. The Electricity Authority of Cyprus will be purchasing all electricity<br />
generated from renewable energy sources at the price of 3.7 Cyprus cents per KWh.<br />
Provision of grants and subsidies of about £42 million CY Pounds by 2010 for the<br />
implementation of programmes for renewable energy sources and energy conservation.<br />
3.2.2 Reducing Administrative obstacles<br />
Cyprus government, with the cooperation of all competent authorities and bodies has<br />
established the legal framework and prepared the necessary infrastructure for the<br />
liberalization of the electricity market. As a result 35% of the electricity market has been<br />
opened to competition, as from the date of accession (1/5/2004), thus terminating the<br />
monopoly status that the previous law was providing to the Electricity Authority of Cyprus.<br />
Following a decision by the Council of Ministers, the Cyprus government has created the<br />
Cyprus Energy Regulatory Authority(CERA) as an independent authority, with the aim of<br />
securing competition and for the protection of all consumers, responsible for the regulation of<br />
the electricity and gas market with exclusive rights to issue licenses for all activities relating<br />
to electricity and gas, to approve tariffs, to dissolve disputes, to protect consumers and to<br />
secure a reliable electricity system.<br />
177
3.2.3 Facilitating Grid Connection<br />
178<br />
ENERGY AND SUSTAINABLE DEVELOPMENT IN THE MEDITERRANEAN<br />
Following a decision by the Council of Ministers, the Cyprus government has created the<br />
Transmission System Operator (TSO) as an independent authority, to facilitate and guaranty<br />
access to the country’s transmission and distribution system, with exclusive duties to<br />
operate, synchronize and control the transmission system with objective, non discriminatory<br />
criteria, to secure the proper maintenance and development of the electricity network and to<br />
arrange for the trading of electricity on a dally basis.
3.3 Grant Schemes<br />
CYPRUS- III. National Study<br />
Grants and/or subsidies are provided for investments by companies, households and public<br />
sector bodies in energy conservation and in renewable energy systems such as wind, solar<br />
thermal, photovoltaic, small hydro, biomass and desalination.<br />
179
Energy Conservation<br />
180<br />
ENERGY AND SUSTAINABLE DEVELOPMENT IN THE MEDITERRANEAN<br />
Table 3.2. Grant Schemes<br />
Energy conservation in existing enterprises 30%. Maximum amount of grant £50,000<br />
Thermal Insulation of Existing households 30%, Maximum amount of grant £1,000<br />
Co-generation - 30% Maximum amount of grant £100,000. Day Rate: 1.71cent Night Rate: 1.50 cent [Day=07:00-23:00<br />
Night=23:00-07:00]<br />
Renewable Energy Sources<br />
Wind Energy<br />
Systems for<br />
electricity<br />
generation<br />
Solar Thermal<br />
Systems<br />
Large commercial Systems greater that 30KW<br />
For the first five years 5,40c per KWh, subsidy 5,40-3,70=1,70c per KWh.<br />
For the next 10 years the subsidy will very from 2,80c up to 5,40c per KWh, depending on equivalent<br />
hours of operation of the wind park, (average of the first five years).<br />
Small systems of up to 30 KW capacity 40% Maximum amount of grant £10,000. 3.70c/KWh No<br />
operating support is offered<br />
Installation or/and replacement of central water heating systems. 30% of eligible costs. Maximum<br />
amount of grant £10,000.<br />
Installation or/and replacement of space heating and cooling. 40% of eligible costs. Maximum amount of<br />
grant £50,000<br />
Domestic solar systems new and / or replacement 20%. Of investment, maximum amount £100 for<br />
forced circulation systems and £200 for water heating systems.<br />
Installation and / or replacement of swimming pool water heating systems. 30% of eligible investments,<br />
maximum amount of grant £10,000<br />
Biomass Biomass, landfill and sewage waste utilization<br />
Photovoltaic<br />
Systems<br />
Desalination using<br />
RES<br />
Hydroelectric<br />
systems<br />
For Small and Medium Size (SMS) enterprises the grant will be 30% in the form of regional aid plus<br />
“deminimis” aid. In any case the total amount from both forms of aid will not exceed 40% of eligible<br />
costs. 3.7 cent per KWh. The maximum amount of grant is £400,000. No operating support is offered.<br />
Small photovoltaic systems of 5 KW capacity, connected to the grid.<br />
For households and other entities and enterprises not engaged in economic activities the grant is set to<br />
55% of eligible costs. The maximum amount of grant £9,500<br />
For enterprises the grant is 40% of eligible costs. The maximum amount of grant is £7,000. Subsidy 12<br />
c/KWh – 3.70 =8.30 C/KWh<br />
Small hybrid/stand alone PV systems (not connected to the grid), of up to 5KWp capacity.<br />
For households and other entities and enterprises not engaged in economic activities the grant is set to<br />
55% of eligible costs. The maximum amount of grant £9,500<br />
For enterprises the grant is 40% of eligible costs. The maximum amount of grant is £7,000.<br />
For Small and Medium Size (SMS) enterprises the grant will be 30% in the form of regional id plus<br />
“deminimis” aid. In any case the total amount from both forms of aid should not exceed 40% of eligible<br />
costs. The maximum amount of grant is £100,000<br />
For Small and Medium Size (SMS) enterprise the grant will be 30% in the form of regional aid plus<br />
“deminimis” aid. In any case the total amount from both forms of aid should not exceed 40% of eligible<br />
costs. The maximum amount of grant is set to £ 30,000. Price for generated KWh is 3.70 cent. No<br />
running support is offered.
CYPRUS- III. National Study<br />
181
182<br />
ENERGY AND SUSTAINABLE DEVELOPMENT IN THE MEDITERRANEAN<br />
3.4 Energy Efficiency Evolution – decoupling<br />
Oil and electricity are the major energy sources in the residential/ tertiary sector.<br />
The potential of reducing energy demand in the building sector is assessed. In the frame of<br />
the current assessment two building uses are dealt with, (a) the residential because it is the<br />
largest sector and so any small reduction at the unit level –the residence- entails a large<br />
overall reduction at the building stock level and, (b) the tourist accommodation due to the<br />
important place it has in the economy of the island and the very large energy demand in<br />
electricity.<br />
The report outlines the assessment of the potential of energy reduction. Three potential<br />
scenarios of demand reduction are formulated, associated with the level of energy demand<br />
reduction intensity.<br />
The first one is the so called business as usual scenario which, in this report is called<br />
“baseline scenario”. It estimates the reduction if no measure is applied. It is noted that a<br />
small reduction is anticipated due to the fact (a) energy equipment such as heating systems<br />
burner/boiler, light-bulbs etc. available on the market today have a better efficiency and so<br />
they can potentially save energy. Furthermore, due to the age of the building stock there will<br />
be a need for building refurbishment such as replacement of glazing etc. Similarly, double<br />
glazing will replace single glazing since the latter is gradually taken away from the market.
CYPRUS- III. National Study<br />
Taken into account this reasoning the following measures are considered for this scenario:<br />
Residential<br />
• burner/boiler system on the central heating plants and the replacement of<br />
individual oil heaters<br />
• single glazing with double (reduction of infiltration is also taken into account)<br />
• rood insulation<br />
• replacement of solar collectors<br />
Tourist accommodation<br />
• burner/boiler system on the central heating plants and the replacement of<br />
individual oil heaters<br />
• single glazing with double (reduction of infiltration is also taken into account)<br />
• rood insulation<br />
• efficient lighting<br />
• replacement of solar collectors<br />
The second is an intermediate scenario, which also includes legislative measures for energy<br />
efficiency. These measures are:<br />
• TIR (Thermal Insulation Regulation). It has been proposed but not yet<br />
enforced. Its enforcement is foreseen for the end of year 2005 or early 2006.<br />
• The new directive on energy efficiency of the commission<br />
• The current legislation on efficiency of boilers/burners<br />
The third scenario will result in a high reduction and includes both the above scenarios and<br />
specific initiatives such as financial support for the final users or for the market actors.<br />
183
184<br />
ENERGY AND SUSTAINABLE DEVELOPMENT IN THE MEDITERRANEAN
CYPRUS- III. National Study<br />
3.5 Renewable Energy Evolution<br />
The following energy contribution to the country’s energy balance is expected by year 2010,<br />
provided that all £42 million are offered in the form of grants and/or subsidies. Increase of the<br />
share of energy from renewable sources from 4% in 1995 to 9% of total energy consumed in<br />
2010. Increase of electricity generated from renewable energies, from the presently zero<br />
level, to 6% by 2010.<br />
Electrical energy from RES<br />
7%<br />
6%<br />
5%<br />
4%<br />
3%<br />
2%<br />
1%<br />
0%<br />
2002 2003 2004 2005 2006 2007 2008 2009 2010<br />
Figure 3.1. Electrical energy generated from RES as percent of total electrical energy<br />
consumption<br />
Table 3.3. Expected evolution of RES in Cyprus<br />
Hydroelectric<br />
Biomass<br />
PV SA<br />
PV GC<br />
Small wind<br />
Wind<br />
Year Wind Small wind PV GC PV SA Biomass Hydroelectric TOTAL<br />
2002 0.0000% 0.0000% 0.0000% 0.0000% 0.0000% 0.0000% 0.0000%<br />
2003 0.0000% 0.0000% 0.0000% 0.0000% 0.0000% 0.0000% 0.0000%<br />
2004 0.0000% 0.0000% 0.0010% 0.0000% 0.0000% 0.0000% 0.0010%<br />
2005 0.0000% 0.0010% 0.0310% 0.0060% 0.0720% 0.0610% 0.1710%<br />
2006 0.0000% 0.0020% 0.0470% 0.0090% 0.1720% 0.1430% 0.3730%<br />
2007 0.9670% 0.0040% 0.0620% 0.0120% 0.3090% 0.1360% 1.4900%<br />
2008 2.0690% 0.0050% 0.0750% 0.0140% 0.5040% 0.1290% 2.7960%<br />
185
186<br />
ENERGY AND SUSTAINABLE DEVELOPMENT IN THE MEDITERRANEAN<br />
2009 3.2830% 0.0070% 0.0860% 0.0160% 0.7820% 0.1230% 4.2970%<br />
2010 4.5880% 0.0080% 0.0880% 0.0170% 1.1790% 0.1170% 5.9970%
CYPRUS- III. National Study<br />
3.5.1 Monitoring the process and time frame<br />
The Programme is being implemented since February 2003 and shall expire the last day of<br />
2006. The progress is monitored by the Energy Service of the Ministry of Commerce,<br />
Industry and Tourism. The programme is a substantially improved version of a previous<br />
programme implemented in the period 1999 – 2002, covering a much wider range of sectors<br />
of economic activity and providing much more generous incentives. It is expected that a<br />
revised version of the programme will be introduced when the existing programme expires.<br />
3.6 RES potential<br />
The main renewable sources for production of electricity in the republic of Cyprus are<br />
presented by their exploitable potential: (1) wind, (2) Biomass, (3) Small Hydro and (4) Solar.<br />
3.6.1 Wind Potential (On shore)<br />
In Cyprus there are some areas with mean wind velocity of 5-6 m/s and few areas with 6,5-<br />
7m/sec. The estimated maximum exploitable potential is 150-250MW considering the<br />
following restriction.<br />
• Sub-regions dedicated to special activities are excluded.<br />
• Sub-regions of less than 5m/s are of no interest, at least for the current state of<br />
technology.<br />
• Sub-regions of very high altitudes or slope.<br />
The WIND IN Cyprus is affected by the following factors:<br />
• From anticyclones moved from west to east, from the Siberian anticyclone during the<br />
winter and from the low pressure crated in the area of India and expanded until the<br />
area of Cyprus during the summer.<br />
• See breezes generated in coastal areas as a result of the different heat capacities of<br />
see and land, which give rise to different rates of heating and cooling.<br />
• Mountain valley winds created when cool mountain air warms up in the morning and<br />
begins to rise while cool air from the valley moves to replace it. During the night the<br />
flow reverses.<br />
187
3.6.2 Wind Potential (Off shore)<br />
188<br />
ENERGY AND SUSTAINABLE DEVELOPMENT IN THE MEDITERRANEAN<br />
The prospect of installing wind turbines in the Southern coast of Cyprus (near shore<br />
applications) is currently been investigated.<br />
Initial studies showed that due to the high depth of the sea at relatively short distance from<br />
the shore, more that 30m depth at a distance of 300m from the shore, the cost of the<br />
installation of the wind turbines is expected to be very high, to the extend that the elevated<br />
wind resort which exists at those areas will not be enough to compensate with the increase in<br />
revenue so that these kinds of projects are economically fusible.<br />
3.6.3 Solar Potential<br />
The Meteorological service of Cyprus has classified the Island in 14 zones from a climatic<br />
point of view. However, from the considerations, affecting the use of solar energy, the<br />
classification may be broadened to 3 zones – coastal, central plains and mountains.<br />
The collection of sunshine duration data at a number of meteorological stations started in<br />
1959. Statistical analysis shows that all parts of Cyprus enjoy a sunny climate. The mean<br />
daily sunshine, i.e. the time interval from sunrise to sunset, for Cyprus varies from 9.8 hours<br />
in December to 14.5 hours in June.<br />
The mean Global Solar Radiation in MJ/m 2 per day and in KWh/m 2 per day is shown in Table<br />
3.4.<br />
Table 3.4. Mean hourly global solar radiation at Athalassa (horizontal surface) for 1999 - 2002<br />
Total<br />
(MJ/m 2 )<br />
Total<br />
(kWh/m 2 )<br />
JAN FEB MAR APR MAY JUN JUL AUG SEP OCT NOV DEC<br />
9.7 13.3 17.3 20.8 25.1 27.5 27.1 24.2 20.5 15.6 10.9 8.1<br />
2.7 3.7 4.8 5.8 7 7.7 7.5 6.7 5.7 4.3 3 2.3
3.6.4 Biomass Potential<br />
CYPRUS- III. National Study<br />
The theoretical potential is always estimated from data for the cultivated areas for each crop<br />
and the residue yield. Then the available potential can be evaluated with the assumption that<br />
only a portion of the theoretical potential is available for energy exploitation since there are<br />
other uses for most agricultural residues. Current biomass exploitation refers to a significant<br />
amount of agricultural residues in connection to the traditional wood stoves and the<br />
prospects of the development of energy crops, even though, further analysis and on site<br />
investigation may identify possible difficulties on harvesting of agricultural byproducts for<br />
bioelectricity production.<br />
Biomass resources in Cyprus include a wide range of biomass residues,, agricultural and<br />
forest, municipal solid waste, sewage water sludge and a considerable potential of energy<br />
crops, which include traditional herbaceous corps, or short rotation woody crops. A large<br />
energy potential exists from energy crops that can be grown on deforested or otherwise<br />
degraded lands.<br />
• Exploitation of agricultural residues. (ligrocellulocic, other vegetables, animal wastes)<br />
• Energy crops (woods maintenance, forestry exploitation)<br />
• Exploitation of landfill gas from the following waste disposal plants.<br />
Capacity<br />
Table 3.5. Exploitation of landfill gas from the following waste disposal plants<br />
Lefkosia Lemesos Larnaka TOTAL<br />
100,000 tn<br />
wastes/y<br />
1.1MWe<br />
(1.5MWth)<br />
3.6.5 Hydro Potential<br />
150,000 tn wastes/y 45,000 tn wastes/y<br />
1.75MWe<br />
(2.5MWth)<br />
0.45MWe<br />
(0.7MWth)<br />
295,000 tn<br />
wastes/y<br />
3.3 MWe<br />
(4.7MWth)<br />
7.5GWh/y 15.6GWh/y 2.7 GWh/y 25.8 GWh/y<br />
In Cyprus the potential for small hydro plants is very limited, especially with the water<br />
shortages over the last years. The suitable sites are estimated as being adequate for a<br />
maximum of about 1MW installed capacity.<br />
189
190<br />
ENERGY AND SUSTAINABLE DEVELOPMENT IN THE MEDITERRANEAN<br />
3.7 Existing or expected effects and benefits of RE and RUE<br />
3.7.1 Rationale for the formulation of scenarios<br />
The establishment of the scenarios was formulated on the basis of the analysis of energy<br />
demand, the available RES potential, the analysed technical, non-technical and legislative<br />
issues. Moreover, the investor’s interest, the maturity and cost-effectiveness of the<br />
technologies and the public attitude have been considered.<br />
The first scenario named “Baseline Scenario” is an attempt to estimate the RES penetration<br />
in the energy system of Cyprus as expected until 2010 without any special policies<br />
implemented. This means that very low implementation of RES and RUE is expected. This<br />
scenario is to be used as a point of reference in the evaluation procedure.<br />
The second scenario named “implementation of existing policies scenario”, as its name<br />
indicates, estimates the expected RES penetration if the existing policies are fully<br />
implemented. The approved funds have also been taken into consideration.<br />
The third scenario named “Advanced policies scenario”, investigates the possibility of<br />
increase the RES penetration by the implementation of new advanced policies, in order to<br />
achieve the established targets. It should be noted that this scenario has been formulated on<br />
the basis: ”which should be the RES and RUE integration in the energy system and which<br />
additional advanced policies should be established in order to achieve the established<br />
targets?”
3.7.2 RES for electricity and heat<br />
Wind Farms<br />
CYPRUS- III. National Study<br />
Wind energy is to be exploited during the next years in Cyprus, since it is the most technoeconomically<br />
viable source for electricity production. Although the wind potential can not be<br />
characterised as abundant, there is as interest for implementation of wind plants in the best<br />
sites.<br />
The electricity contribution of these units is depended on the mean wind velocity of the site.<br />
Given the wind potential, the capacity factor of the wind farms varies between 26% in the<br />
most suitable sites and 18% in the worst. In Table 3.5 the expected efficiency (capacity<br />
factor) of the wind farms is presented.<br />
Table 3.6. Capacity factor of wind farms<br />
Wind farms Capacity factors Mean wind velocity Annual electricity<br />
production (GWh/MW<br />
installed)<br />
First 50MW 26% 6.5 2.28<br />
Next 100MW 23% 6 2.01<br />
Last 100MW 18% 5.5 1.58<br />
In the “baseline scenario” the wind farms will not exceed 50MW in 2010 and 150MW in 2020.<br />
In the “implementation of existing policies scenario” about 80 MW are expected in 2010 and<br />
200MW in 2020. Finally in the “advanced policies scenario” the target is for 110MW in 2010<br />
and 250MW in 2020.<br />
Photovoltaic Cells<br />
The use of photovoltaic solar energy in Cyprus is still in its infancy. Photovoltaics have been<br />
used by the Cyprus Telecommunication Authority (CYTA) for the telephone kiosks and<br />
transmitters. The Cyprus Radio-Telephone Authority has also used photovoltaics for<br />
transmitters. The present installed capacity of photovoltaics (remote systems) is estimated at<br />
0.2MW.<br />
Given that the solar potential in Cyprus the photovoltaic solar energy plants are expected to<br />
have a capacity factor 17%. In all scenarios the installed capacity of photovoltaics is limited<br />
due to the high requires installation cost.<br />
In the “baseline scenario” the photovoltaics will not exceed 1MW in 2010 and 2.5MW in<br />
2020. In the “implementation of existing policies scenario” about 2MW are expected in 2010<br />
and 5MW in 2020. Finally in the “advanced policies scenario” the target is for 3MW in 2010<br />
and 8MW in 2020.<br />
191
Biomass-municipal solid waste<br />
192<br />
ENERGY AND SUSTAINABLE DEVELOPMENT IN THE MEDITERRANEAN<br />
The most promising perspective is the exploitation of municipal solid waste for co-generation<br />
of electricity and heat.<br />
In the “baseline scenario” the MSW plants will not exceed 3.3MW in 2010 and 4.3MW in<br />
2020. In the “implementation of existing policies scenario” about 3.3MW are expected in<br />
2010 and 5MW in 2020. Finally in the “advanced policies scenario” the target is for 5.5MW in<br />
2010 and 8.5MW in 2020.<br />
Small hydro<br />
In Cyprus the potential for small hydro plants in strictly defined. The suitable sites are<br />
adequate for about 1MW installed capacity. Although the electricity production is strongly site<br />
dependent, an estimation of an average capacity factor 68%.<br />
In the “baseline scenario” the small hydro plants will reach 1MW 2020. In the<br />
“implementation of existing policies scenario” the same capacity is expected in 2010 while in<br />
the “advanced policies scenario” in 2008.<br />
Solar hot water systems<br />
Although the degree of SHWS penetration in the domestic sector is very high (about 90% of<br />
individual houses and 80% of apartments), there are prospects for utilisation of solar thermal<br />
application in the hotel industry, the commercial-public and industrial sectors. Additionally,<br />
the utilisation of solar thermal energy for other applications (i.e. space heating and space<br />
cooling) can give further prospects after 2010.<br />
In the “baseline scenario” the rate of new installations is about 5000m 2 per year. In the<br />
“implementation of existing policies scenario” the expected rate is about 7500m 2 per year<br />
and in the “advanced policies scenario” the target is for is about 10000m 2 per year.<br />
3.7.3 RES in transport<br />
Concerning RES penetration in transport, the proposed solution is to produce and mix<br />
biofuels with diesel. In the “baseline scenario” the kick-off of the production of biofuels is<br />
expected not earlier than 2010, when this process will be more mature and cost-effective.<br />
In the “implementation of existing policies scenario” about 3200 tn biofuels will be produced<br />
in 2007, while they are needed 509000 tn in 2010 (“advanced policies scenario”) in order to<br />
achieve the target of RES supply in transport sector (5.75% in 2010).
3.7.4 Details of the scenarios<br />
CYPRUS- III. National Study<br />
Table 3.7. Baseline Scenario: Development of RES, RES supply in electricity and RES supply<br />
in electricity<br />
Development of RES<br />
2002 2005 2010 2015 2020<br />
Wind (MW) 0 10 50 100 150<br />
PV (MW) 0 0,2 1 1,6 2,5<br />
Biomass-MSW (MWe)-(MWh) 0 0.45-0.7 3.3-4.7 4.3-6 4.3-6<br />
Small-hydro (MW) 0 0,2 0,5 0,75 1<br />
SHWS (1000 m 2 ) 655 670 695 720 745<br />
Biofuels (1000 tn) 0 0 5 30 80<br />
RES supply in electricity<br />
Wind (GWh) 0 23 114 215 315<br />
PV (GWh) 0 0,3 1,5 2,4 3,8<br />
Biomass (GWh) 0 3,0 21,7 28,3 28,3<br />
Small-hydro (GWh) 0 1,2 3 4,5 6<br />
RES electricity production (GWh) 0 27 140 250 353<br />
Electricity generated before RUE (GWh) 3785 4340 4950 5440 5850<br />
Electricity generated after RUE (GWh) 3785 4297 4777 5114 5353<br />
RES supply in electricity demand 0% 1% 3% 5% 7%<br />
RES supply in heat and transport<br />
Biomass heat (ktoe) 0 0.4 2.655 3.39 3.39<br />
SHWS (ktoe) 32.6 33.3 34.54 35.78 37.03<br />
RES heat (ktoe) 32.6 33.7 37.2 39.17 40.42<br />
Heat demand (ktoe) 867 875 897.2 1015 1124<br />
Heat demand with RUE measures (ktoe) 867 867 865.8 953,9 1029<br />
RES supply in heat demand 3.8% 3.9% 4.3% 4.1% 3.9%<br />
193
194<br />
ENERGY AND SUSTAINABLE DEVELOPMENT IN THE MEDITERRANEAN<br />
Transport Demand (ktoe) 620 650 717 740 760<br />
RES in transport (ktoe) 0 0 0.405 2.43 6.48<br />
RES supply in earth transportation 0.0% 0.0% 0.1% 0.3% 0.9%
CYPRUS- III. National Study<br />
Table 3.8. Existing Policies Scenario implementation: Development of RES, RES supply in<br />
electricity and RES supply in electricity<br />
Development of RES<br />
2002 2005 2010 2015 2020<br />
Wind (MW) 0 20 80 150 200<br />
PV (MW) 0 0,2 2 3,5 5<br />
Biomass-MSW (MWe)-(MWh) 0 0.45-0.7 3.3-4.7 4.3-6 5-7<br />
Small-hydro (MW) 0 0,4 1 1 1<br />
SHWS (1000 m 2 ) 655 675 712,5 750 787,5<br />
Biofuels (1000 tn) 0 18.3 60 110 160<br />
RES supply in electricity<br />
Wind (GWh) 0 46 174 315 394<br />
PV (GWh) 0 0.3 3.0 5.3 7.6<br />
Biomass (GWh) 0 3.0 21.7 28.3 32.9<br />
Small-hydro (GWh) 0 2,4 6 6 6<br />
RES electricity production (GWh) 0 51 205 355 441<br />
Electricity generated before RUE (GWh) 3785 4340 4950 5440 5850<br />
Electricity generated after RUE (GWh) 3785 4297 4777 5114 5353<br />
RES supply in electricity demand 0% 1% 4% 7% 8%<br />
RES supply in heat and transport<br />
Biomass heat (ktoe) 0 0.4 2.655 3.39 3.954<br />
SHWS (ktoe) 32.6 33.5 35.41 37.27 39.14<br />
RES heat (ktoe) 32.6 33.9 38.07 40.66 43.09<br />
Heat demand (ktoe) 867 875 897,2 1015 1124<br />
Heat demand with RUE measures (ktoe) 867 867 865,8 953,9 1029<br />
RES supply in heat demand 3.8% 3.9% 4.4% 4.3% 4.2%<br />
Transport Demand (ktoe) 620 650 717 740 760<br />
195
196<br />
ENERGY AND SUSTAINABLE DEVELOPMENT IN THE MEDITERRANEAN<br />
RES in transport (ktoe) 0 1.48 4.86 8.91 12.96<br />
RES supply in earth transportation 0.0% 0.2% 0.7% 1.2% 1.7%
CYPRUS- III. National Study<br />
Table 3.9. Advanced Policies Scenario: Development of RES, RES supply in electricity and<br />
RES supply in electricity<br />
Development of RES<br />
2002 2005 2010 2015 2020<br />
Wind (MW) 0 20 110 200 250<br />
PV (MW) 0 0,5 3 5,5 8<br />
Biomass-MSW (MWe)-(MWh) 0 0,45-0,7 5,5-7,7 7,5-10,5 8,5-12,1<br />
Small-hydro (MW) 0 0,5 1 1 1<br />
SHWS (1000 m 2 ) 655 680 730 780 830<br />
Biofuels (1000 tn) 0 100 509 555 600<br />
RES supply in electricity<br />
Wind (GWh) 0 46 235 394 473<br />
PV (GWh) 0 0,76 4,5 8,3 12,1<br />
Biomass (GWh) 0 3,0 36,1 49,3 55,8<br />
Small-hydro (GWh) 0 3 6 6 6<br />
RES electricity production (GWh) 0 52 281 458 547<br />
Electricity generated before RUE (GWh) 3785 4340 4950 5440 5850<br />
Electricity generated after RUE (GWh) 3785 4297 4703 5005 5236<br />
RES supply in electricity demand 0% 1% 6% 9% 10%<br />
RES supply in heat and transport<br />
Biomass heat (ktoe) 0 0.4 4.35 5.932 6.836<br />
SHWS (ktoe) 32.6 33.8 36.28 38.77 41.25<br />
RES heat (ktoe) 32.6 34.2 40.63 44.7 48.09<br />
Heat demand (ktoe) 867 875 897,2 1015 1124<br />
Heat demand with RUE measures (ktoe) 867 867 852.4 933.6 1006<br />
RES supply in heat demand 3.8% 3.9% 4.8% 4.8% 4.8%<br />
Transport Demand (ktoe) 620 650 717 740 760<br />
197
198<br />
ENERGY AND SUSTAINABLE DEVELOPMENT IN THE MEDITERRANEAN<br />
RES in transport (ktoe) 0 8.1 41.23 44.96 48.6<br />
RES supply in earth transportation 0.0% 1.2% 5.8% 6.1% 6.4%
3.7.5 Indicators charactterising<br />
the scenarios<br />
In the following a comparative presentation of the three scenarios was formmulated<br />
in terms of:<br />
• deviations from targetss<br />
• financial and econommic<br />
(comparison of the required financiial<br />
resources like<br />
investment cost, subsiddies<br />
– support cost)<br />
• environmental impact ( (avoided emissions of CO2, SO2, NOx and PM<br />
• social impacts (employyment<br />
created)<br />
Deviation from targets<br />
CYPRUS- III. National Study<br />
In the following comparative cchart<br />
the RES supply in primary target for 6% % RES contribution<br />
to primary energy 2010 seemms<br />
to be very difficult to be achieved. In the<br />
current policies<br />
scenario the rate of RES suupply<br />
is about 2.5% in 2010. Even in the advanced policies<br />
scenario the rate of RES remaains<br />
less than the target.<br />
Figure 3.2 REES<br />
supply in the primary energy consumptioon<br />
The official target of 6% RES ccontribution<br />
to electricity supply in 2010 can be achieved by the<br />
advanced policies scenario. Figure 3.3 shows that the contribution of RES to electricity<br />
supply in 2010 could vary beetween<br />
2.9% (baseline scenario) and 6% (advanced policies<br />
scenario). By the full implemeentation<br />
of current policies the RES contribution<br />
will reach 4.3%<br />
in 2010.<br />
M10)<br />
199
200<br />
ENERGGY<br />
AND SUSTAINABLE DEVELOPMENT IN THE MEDITERRANEAN<br />
Figure 3.33<br />
RES supply in the electricity consumption<br />
In the heating sector, the RESS<br />
contribution is already near 4% thanks to thhe<br />
high penetration<br />
of solar hot water systems in the domestic sector. For the new apartmentts<br />
a solar hot water<br />
system is considered as stanndard<br />
equipment, as well as the replacement<br />
of the existing<br />
systems with similar after the end of their lifetime. Some small ups and downs<br />
in the rate of<br />
RES supply in heat are justiffied<br />
by the introduction of medium scale CHHP<br />
municipal solid<br />
waste plants.<br />
Figure 3.4 RES supply in heat
Finally, the most difficult targeet<br />
of introduction of RES in the transport secttor<br />
(5.75% in 2010)<br />
seems to be unattainable, sincce<br />
by the current policies the expected rate iss<br />
less than 1%.<br />
Financial and economic anaalysis<br />
Figgure<br />
3.5 RES supply in transportation<br />
The required investment cossts<br />
for the implementation of the scenarioss<br />
are presented in<br />
Figure 3.5. By terms of presennt<br />
value the investment cost is presented in TTable<br />
3.9.<br />
Advanced policies<br />
Table 3.10. Present Value of the investment cost (1000€) )<br />
Full implementation of current policies<br />
1022899 1977022<br />
Baseline scenario<br />
CYPRUS- III. National Study<br />
2003-2010 2003-20020<br />
229916 3448644<br />
58383 1294166<br />
According to the existing legisslation<br />
(subsidies approved and support in the<br />
electricity market<br />
price), the required for the suupport<br />
of RES is present in Figure 3.6, whilee<br />
in Table 3.10 the<br />
present value of the required rresources<br />
is shown.<br />
201
202<br />
ENERGGY<br />
AND SUSTAINABLE DEVELOPMENT IN THE MEDITERRANEAN<br />
Figure 3.6 Annual Required ssubsidy<br />
and support cost for the alternatives scenarios (1000€)<br />
2003 – 2010<br />
Table 3.11. Present VValue<br />
of the required subsidy and support cossts<br />
(1000€)<br />
Advanced policies<br />
Full implementation of current policies<br />
21433 70994<br />
Baseline scenario<br />
Environmental impacts<br />
2003-2010 2003-20020<br />
63924 1252477<br />
10835 44904<br />
The avoided CO2 emissions due<br />
to the alternative scenarios are presentedd<br />
in Figure 3.7.<br />
Figure 3.77<br />
Yearly avoided CO2 emissions (2003-2020)
Social impacts<br />
CYPRUS- III. National Study<br />
The created employment is presented in Tables 3.12 and 3.13 in man-years.<br />
2003-2010<br />
(man-years)<br />
Table 3.12. Created employment due to the alternatives scenarios (2003-2010)<br />
During construction During O&M Total<br />
employment<br />
Advanced policies 272 917 1189<br />
Full implementation of current policies 193 634 826<br />
Baseline scenario 124 396 520<br />
2003-2010<br />
(man-years)<br />
Table 3.13. Created employment due to the alternatives scenarios (2003-2010)<br />
During construction During O&M Total<br />
employment<br />
Advanced policies 602 5322 5924<br />
Full implementation of current policies 455 3793 4248<br />
Baseline scenario 331 2575 2906<br />
203
204<br />
ENERGY AND SUSTAINABLE DEVELOPMENT IN THE MEDITERRANEAN
CYPRUS- III. National Study<br />
4. PART III: Examples of good practice, case studies<br />
4.1 The photovoltaic system at electricity authority of Cyprus’<br />
new head offices<br />
4.1.1 Introduction<br />
In the last years the electric grid tied systems have became the most extended application in<br />
the photovoltaic (PV) activity sector. This has lead to the development of a specific<br />
engineering that optimizes the layout and increases the performance of the systems,<br />
minimizing the environmental impact, the possible effects over the electric grid and looking<br />
forward in the architectural integration in buildings and landscapes. The PV plants require a<br />
simple installation and a minimal maintenance. Besides, the modular characteristic of this<br />
kind of systems enables future enlargements and allows obtaining a high performance in<br />
partial running.<br />
Photovoltaic power plants represent a real contribution to the diversification in the production<br />
of electricity. They are non-contaminant producers that use local resources of energy as<br />
alternative to external fuel dependency.<br />
4.1.2 Systems description<br />
A grid-connected photovoltaic system comprises three clearly differentiated elements: the<br />
photovoltaic generator, the DC/AC power conditioning unit, and the monitoring and metering<br />
devices. The photovoltaic modules generate a current proportional to the incident solar<br />
radiation. The photovoltaic generator comprises several interconnected modules. The<br />
number of modules in series is the necessary to obtain the optimal operating voltage for the<br />
inverter. They conform one array. The number of arrays in parallel will be limited by the<br />
power of the inverter.<br />
The DC/AC power conditioning unit transforms the direct current supplied by the generator<br />
into alternating current given to the grid. This unit also monitors the “maximum power point”<br />
of the generator. Protection mechanisms are also included, ensuring the safety of the<br />
personal and equipment of the installation and the quality of the power supplied to the<br />
conventional electric grid.<br />
4.1.3 Site information<br />
The photovoltaic generator for the New Head Offices for the Electricity Authority of Cyprus<br />
has been divided into different PV systems. Every system works independently and has been<br />
design to optimize the available surface and the production of electricity. The PV installation<br />
proposed for the New Head Offices for the Electricity Authority of Cyprus comprises the<br />
following PV systems:<br />
• 19 PV Systems of 20 modules l-106 in series connected each one to a Sunny Boy<br />
2000 DC/AC inverter.<br />
• 24 PV Systems of 19 modules I-106 in series connected each one to a Sunny Boy<br />
2000 DC/AC inverter.<br />
205
206<br />
ENERGY AND SUSTAINABLE DEVELOPMENT IN THE MEDITERRANEAN<br />
Therefore, the total number of I-106 unframed modules is 836 for a total peak power of the<br />
photovoltaic systems offered of 88.616 Wp. Only one type of module and inverter will be<br />
used in the whole installation, thus logistic and maintenance operations will be reduced and<br />
the installation simplifies.<br />
4.1.4 System characteristics<br />
• P.V. Panels – Isofoton SA Spain<br />
• Inverters – SMA Sunny Boy<br />
• System Peak Power – 88.616 WP<br />
• No. of PV Panels – 836<br />
• No. of Invertes – 43<br />
• Rating of inverters – 2000W<br />
• PV Module – I-106 12V, 106Wp<br />
• Guaranteed Energy Production 110,655 kWh per year<br />
Modules: Isofoton I0106/12<br />
The PV cells are laminated with EVA (Ethylene Vinyl Acetate) and encapsulated with a<br />
tempered glass front cover and a plastic polymer (TEDLAR) on the rear face.<br />
PV Systems<br />
19 – PV systems of 20 modules in series connected to a Sunny Boy 2000 Inverter. 24 Nos.<br />
PV systems of 19 modules in series, connected to a Sunny Boy 2000 Inverter. Every system<br />
works independently and has been designed to optimise the available surface and the<br />
production of electricity.<br />
4.1.5 Individual system characteristics<br />
- The PV System replaced the sun-shades we had on the building. So they serve two<br />
purposes:<br />
• production of electricity<br />
• sun – shading<br />
With this arrangement, we saved the cost of the sun shades, around £70,000 (Euro 100,000)<br />
and made the use of the PV system financially more bearable.<br />
- In order to increase the performance of the system without sacrificing the aesthetic of<br />
the building, it was decided to tilt the PV panels’ arrangement by 15 degrees to the<br />
horizontal.<br />
- In order to minimise the effects of the shading of the top panels to the lower panels, it<br />
was decided to install the long side of the panel parallel with the building. This way,<br />
every module of each series has the same irradiation at each time and the<br />
performance of the whole series is similar. The hot-spot effect is reduced.
4.1.6 Energy production<br />
CYPRUS- III. National Study<br />
To estimate the energy produced from the PV system, a deep shadow analysis was<br />
performed. The system was divided into four groups as shown in the Tables 4.1 and 4.2.<br />
Table 4.1. Estimated Energy production in PV systems<br />
No Yearly energy produced<br />
per PV System<br />
1 PV Systems with no shadows over the whole year<br />
10 PV Systems with 20 modules in series<br />
12 PV Systems with 19 modules in series<br />
2 PV Systems with partial shadows from May 5 th till<br />
August 10 th<br />
3 PV Systems with 20 modules in series<br />
4 PV Systems with 19 modules in series<br />
3 PV Systems with partial shadows from April 8 th till<br />
September 6 th<br />
3 PV Systems with 20 modules in series<br />
4 PV Systems with 19 modules in series<br />
4 PV Systems with partial shadows from March 16 th<br />
till September 29 th<br />
3 PV Systems with 20 modules in series<br />
4 PV Systems with 19 modules in series<br />
(kWh/year)<br />
2,947<br />
2,794<br />
2,722<br />
2,581<br />
2,333<br />
2,212<br />
1,961<br />
1,860<br />
Total energy produced<br />
(kWh/year)<br />
29,471<br />
33,525<br />
8.167<br />
10,323<br />
7,000<br />
8,847<br />
5,884<br />
7,438<br />
TOTAL ESTIMATED YEARLY ENERGY PRODUCED 110,655 kWh/year<br />
TOTAL PEAK POWER OF THE PV SYSTEMS 88,616 Wp<br />
207
208<br />
ENERGY AND SUSTAINABLE DEVELOPMENT IN THE MEDITERRANEAN<br />
Table 4.2. Estimated energy production of the plant<br />
Total daily average energy<br />
production (kWh/day)<br />
Total energy production<br />
per month (kWh/month)<br />
JANUARY 192 5,959 81.1<br />
FEBRUARY 247 6,928 81.3<br />
MARCH 310 9,617 80.0<br />
APRIL 332 9,963 72.7<br />
MAY 349 10,829 65.5<br />
JUNE 354 10,623 60.0<br />
JULY 353 10,954 58.9<br />
AUGUST 365 11,305 63.5<br />
SEPTEMBER 369 11,066 71.3<br />
OCTOBER 338 10,479 78.8<br />
NOVEMBER 223 6,680 79.7<br />
DECEMBER 202 6,250 81.7<br />
AVERAGE DAILY 303 72.9<br />
ANNUAL TOTAL (kWh) 110,655 70.4<br />
4.1.7 Financial information<br />
Monthly performance<br />
ratio (%)<br />
The total cost of the system is about 500,000 Euros. Even if this value represents a serious<br />
investment effort in the first stage, the economically viability of using this renewable systems<br />
is acceptable especially if the system will be used for domestic building blocks applications<br />
and or for medium and large size industrialise buildings.
4.1.8 Photos<br />
CYPRUS- III. National Study<br />
Figure 4.1. EAC building<br />
209
4.2 Mari Wind Farm Project<br />
4.2.1 Description<br />
210<br />
ENERGY AND SUSTAINABLE DEVELOPMENT IN THE MEDITERRANEAN<br />
The purpose of the Mari Wind Farm Project is to install and operate a wind farm, which will<br />
be producing renewable electricity from wind. The produced electricity will be fed into the<br />
National Grid of the Electricity Authority of Cyprus and sold on the basis of a Power<br />
Purchase Agreement to be concluded with the Transmission System Operator and the<br />
Electricity Authority of Cyprus. The project activity will generate greenhouse gas (GHG)<br />
emission reductions by avoiding CO2 emissions from electricity generation by thermal power<br />
plants that supply the national Grid.<br />
The site of the Mari Wind Farm Project is located at the Southern coast in the Larnaca<br />
District of the Republic of Cyprus. The project earmarks the installation of 8 turbines with a<br />
capacity of 1.5 MW each, resulting in a total capacity of 12 MW. Grid connection shall be at<br />
the nearby substation “Mari” at a distance of some 2 km at the medium voltage level (22 kV<br />
to be operated at 11 kV for the time being until planned changes of the system are carried<br />
out). Wind measurement has been carried out for one year from November 2003 onwards<br />
showing an average wind speed of 4.9 m/s at a height of 50 m which is a rather low wind<br />
speed in terms of good wind farm site quality. According to the energy yield expertise from<br />
Windtest Kaiser-Wilhelm-Koog, Germany, the annual electricity production is expected to be<br />
some 21 GWh. The project will represent the first wind farm ever realized in the Republic of<br />
Cyprus and will assist the country in establishing and promoting the use of grid connected<br />
renewable energy technologies. Hence it will contribute to a reduction of GHG emissions in<br />
conjunction with the current oil-fired power plants. With regard to sustainable development<br />
the project contributes in several ways:<br />
- reduction of CO2 and other air pollutants through development of renewable<br />
technology<br />
- contribution towards achieving the targets and objectives of the country’s policy<br />
regarding the promotion and the use of renewable energies in order to increase the<br />
contribution of electricity consumption from renewable energy sources from 0% to 6%<br />
by 2010<br />
- infrastructure development in the environs of the project also with regard to attract<br />
visitors for environmental and teaching purposes<br />
- creation of local employment during construction and for the later maintenance and<br />
operation, thus creating and strengthening local knowledge and experience in the<br />
field of these new this new technology.<br />
Owner of the wind farm will be the project company Mariwind Farm Ltd.. Wincono Cyprus<br />
Ltd. will be responsible for technical and commercial management.
4.2.2 Site Location and Description<br />
CYPRUS- III. National Study<br />
The project is located in the environs of the village Mari, Larnaca District, Republic of Cyprus<br />
between the towns of Larnaca and Limassol as indicated in the following map.<br />
Figure 4.2. Map of the Republic of Cyprus; location of the Mari Wind Farm Project<br />
The site is located directly between the Vasilikos Power Station (to the West) and the<br />
Vasilikos Cement Works (to the East) on top of a ridge with an altitude of 80 m at the coast<br />
line (South) ascending to 112 m towards inland (North). At wind turbine no. 3, which is<br />
located at the UTM WGS84 coordinates of 527654 E and 3843425 N, the wind farms main<br />
substation (coupling point building) shall be installed for the connection to the national grid<br />
via an overhead line.<br />
211
4.2.3 Technology of the project<br />
Type and category<br />
212<br />
ENERGY AND SUSTAINABLE DEVELOPMENT IN THE MEDITERRANEAN<br />
The project is specified as “Grid connected renewable electricity generation” (from wind<br />
energy) and belongs to category I.D.. The installed capacity will be 12 MW, thus being below<br />
15 MW and eligible as small-scale project.<br />
Technology<br />
The project envisages the installation of the turbine type VENSYS 77, which is a gearless<br />
wind turbine equipped with a three-blade rotor, pitch control with a rated output of 1,500 kW.<br />
This converter generates electric current that is fed directly into the public grid. Optimum<br />
aerodynamic rotor efficiency, at every wind speed, is achieved by using variable speed<br />
technology. The 77 m rotor diameter and 85 m hub height result in an overall height of 123.5<br />
m.
CYPRUS- III. National Study<br />
Figure 4.3. Site layout of the Mari Wind Farm Project<br />
213
214<br />
ENERGY AND SUSTAINABLE DEVELOPMENT IN THE MEDITERRANEAN<br />
The wind farm will be connected via a medium voltage overhead line, on 22 kV level –but for<br />
the time being operated at 11 kV- to the Mari substation (11/66 kV) at a distance of some<br />
2km where the electricity will be fed into the National Grid. The turbines - of which the<br />
technology development is from Vensys Energiesysteme GmbH&Co.KG are to be<br />
manufactured by VENSYS-CKD, Czech Republic. Most likely, other components such as<br />
transformers and switchgears will be imported from Germany. Infrastructure work such as<br />
preparation of roads, building of foundations and cabling will be carried out by local<br />
companies.<br />
Wind availability and electricity production<br />
Wind measurement has been carried out by German Windtest Kaiser-Wilhelm-Koog,<br />
Germany, as of November 2003 for a one year period. Subsequently a yield expertise has<br />
been elaborated by the same institute. Whilst the measured wind speeds were not very high<br />
(4.9 m/s at a height of 50 m), the extrapolation to hub height and the analysis of the<br />
anticipated production shows reasonable results due to the anticipated high efficiency of the<br />
chosen wind turbine type. The annual electricity production is estimated at 21,219.9 MWh.<br />
4.2.4 Reduction of GHG emissions<br />
The implementation of Mari Wind Farm Project will generate an estimated reduction of<br />
118,948 tCO2 over the first crediting period of 7 years. This reduction results from the<br />
displacement of the generation of electrical energy from the fossil fuel fired plants that would<br />
otherwise have fed electricity into the National Grid. The proposed project faces several<br />
barriers, especially technological barriers, barriers due to prevailing practice and investment<br />
barriers.
CYPRUS- III. National Study<br />
Table 4.3. Estimated emission reductions<br />
Years Annual estimation of emission reductions [tCO2e]<br />
2007 (May – December) 11,329<br />
2008 16,993<br />
2009 16,993<br />
2010 16,993<br />
2011 16,993<br />
2012 16,993<br />
2013 16,993<br />
2014 (January – April) 5,664<br />
Total estimated reductions 118,948<br />
Total number of crediting years 7<br />
Annual average over the crediting period of<br />
estimated reductions<br />
16,993<br />
215
216<br />
ENERGY AND SUSTAINABLE DEVELOPMENT IN THE MEDITERRANEAN<br />
4.3 Alexigros Wind Farm Project<br />
4.3.1 Description<br />
The purpose of the Alexigros Wind Farm Project is to install and operate a wind farm, which<br />
will be producing renewable electricity from wind. The produced electricity will be fed into the<br />
National Grid of the Electricity Authority of Cyprus and sold on the basis of a Power<br />
Purchase Agreement to be concluded with the Transmission System Operator and the<br />
Electricity Authority of Cyprus. The project activity will generate greenhouse gas (GHG)<br />
emission reductions by avoiding CO2 emissions from electricity generation by fossil fuel<br />
power plants that supply the National Grid. Commissioning is planned for 01/05/2008.<br />
The site of the Alexigros Wind Farm Project is located at the Southern coast in the Larnaca<br />
District of the Republic of Cyprus. The project development comprises the installation of 21<br />
turbines with a capacity of 1.5 MW each, resulting in a total capacity of 31.5 MW. The<br />
technical terms for the grid connection at the high voltage system are currently being<br />
investigated by the Transmission System Operator. Wind measurement is being carried out<br />
since March 2006 for a period of minimum half a year up to one year. According to a<br />
preliminary energy yield expertise based on wind data from the nearby station at Larnaca<br />
Airport, the annual electricity production is expected to be 69 GWh per year.<br />
The project will represent one of the first wind farms ever realized in the Republic of Cyprus<br />
and the first large scale wind farm. It will assist the country in establishing and promoting the<br />
use of grid connected renewable energy technologies. Hence it will contribute to a reduction<br />
of GHG emissions in conjunction with the predominant oil-fired power plants. With regard to<br />
sustainable development the project contributes in several ways:<br />
- Reduction of CO2 and other air pollutants through development of renewable<br />
technology<br />
- Contribution towards achieving the targets and objectives of the country’s policy<br />
regarding the promotion and the use of renewable energies in order to increase the<br />
contribution of electricity consumption from renewable energy sources from 0% to 6%<br />
by 2010<br />
- Infrastructure development in the environs of the project also with regard to attract<br />
visitors for environmental and teaching purposes<br />
- Creation of local employment during construction and for the later maintenance and<br />
operation, thus creating and strengthening local knowledge and experience in this<br />
new technology.<br />
Owner of the wind farm will be a project-company which has yet to be set up. Wincono<br />
Cyprus Ltd. will be responsible for technical and commercial management.
4.3.2 Site Location and Description<br />
CYPRUS- III. National Study<br />
The project is located between the villages of Klavdhia, Tersephanou and Alethriko in the<br />
Larnaca District, Republic of Cyprus. The town of Larnaca is at a distance of some 8 km in<br />
north-easterly direction as indicated in the following map.<br />
Figure 4.4. Map of the Republic of Cyprus; location of the Alexigros Wind Farm Project<br />
217
218<br />
ENERGY AND SUSTAINABLE DEVELOPMENT IN THE MEDITERRANEAN<br />
The wind farm’s terrain is mildly hilly and forms a kind of a ribbed plateau in the area. The<br />
highest point of the area is the “Mouti tou Alexikou” (next to wind turbine no. 14) with an<br />
altitude of 209.1 m and the UTM WGS84 coordinates of 547645 E and 3859628 N. As also<br />
indicated in the map, the highway south of the village Klavdhia passes along the<br />
northwestern ridge of the wind farm area under consideration.<br />
Figure 4.5. Site layout of the Alexigros Wind Farm Project
4.3.3 Technology of the project<br />
CYPRUS- III. National Study<br />
The project envisages the installation of the turbine type VENSYS 77, which is a gearless<br />
wind turbine equipped with a three-blade rotor, pitch control with a rated output of 1,500 kW.<br />
This converter generates electric current that is fed directly into the public grid. Optimum<br />
aerodynamic rotor efficiency, at every wind speed, is achieved by using variable speed<br />
technology. The 77 m rotor diameter and 85 m hub height result in an overall height of 123.5<br />
m.<br />
Most likely, the wind farm will be connected to the transmission system (high tension at 66 or<br />
132 kV) from where the electricity will be fed into the National Grid. The exact location for the<br />
grid connection and the technical terms are under elaboration by the Transmission System<br />
Operator.<br />
The turbines - of which the technology development is from Vensys Energiesysteme<br />
GmbH&Co.KG ¬are to be manufactured by VENSYS-CKD, Czech Republic. Most likely,<br />
other components such as transformers and switchgears will be imported from Germany.<br />
Infrastructure work such as preparation of roads, building of foundations and cabling will be<br />
carried out by local companies.<br />
Wind availability and electricity production<br />
Wind measurement is being carried out by German Windtest Kaiser-Wilhelm-Koog,<br />
Germany, since March 2006 for a period of 6 to 12 months. Subsequently a yield expertise<br />
will be elaborated by the same institute. For the purpose of the assessment of the wind<br />
conditions and the energy prediction for the wind farm site, a preliminary yield expertise had<br />
been carried out by Wincono Cyprus Ltd. in cooperation with the Meteorological Service of<br />
Cyprus in April 2005. Wind data of the Meteorological Service from Larnaca Airport, which is<br />
at a distance of some 10km to the East, have been analyzed. The wind speed extrapolated<br />
to the hub height of the wind turbine and other factors such as the topography of the area<br />
and the siting of the turbines were used for the prediction of the energy yield.<br />
219
220<br />
ENERGY AND SUSTAINABLE DEVELOPMENT IN THE MEDITERRANEAN<br />
The summarized result of the study is as follows:<br />
Table 4.4. Wind data and energy production assuming a turbine of the type VENSYS 77<br />
(including 20% reduction because of wake effects and safety reduction)<br />
Type Value<br />
wind speed at 10m (measured at Larnaca Airport) 4.15 m/s<br />
wind speed at 85m (calculated) 6.7 m/s<br />
energy production wind farm (21 x VENSYS 77) 69,380 MWh/a<br />
Whilst the measured wind speeds at Larnaca Airport were not very high (4.15 m/s at a height<br />
of 10m), the extrapolation to hub height and the analysis of the anticipated production shows<br />
reasonable results due to the anticipated high efficiency of the chosen wind turbine type.<br />
The expected energy production of 69,380 MWh/a includes a 20% safety reduction, as onsite<br />
wind measurements have not been carried out yet.<br />
4.3.4 Reduction of GHG emissions<br />
The implementation of Alexigros Wind Farm Project will generate an estimated reduction of<br />
388,910 tCO2 over the first crediting period of 7 years. This reduction results from the<br />
displacement of the generation of electrical energy from the fossil fuel fired plants that would<br />
otherwise have fed electricity into the national grid. The proposed project faces several<br />
barriers, especially technological barriers, barriers due to prevailing practice and investment<br />
barriers.
CYPRUS- III. National Study<br />
Table 4.5. Estimated amount of emission reductions over the chosen crediting period<br />
Years Annual estimation of emission reductions [tCO2e]<br />
2008 (May – December) 37,039<br />
2009 55,559<br />
2010 55,559<br />
2011 55,559<br />
2012 55,559<br />
2013 55,559<br />
2014 55,559<br />
2015 (January – April) 18,520<br />
Total estimated reductions [tCO2e] 388,910<br />
Total number of crediting years 7<br />
Annual average over the crediting period of<br />
estimated reductions [tCO2e]<br />
55,559<br />
4.4 Solar Hot water systems success story<br />
Cyprus is one of the leading countries in the use and construction of solar heating systems,<br />
93% of households are equipped with solar water heaters and 53% of hotels have installed<br />
large solar water heating systems. The EU study “Sun in action” ranks Cyprus first with<br />
0.86m 2 of installed solar collector per capita.<br />
Increased efficiency and cost effectiveness of solar hot water systems contributed to their<br />
wide penetration in urban, rural and isolated communities in Cyprus. Local industry is<br />
characterised by high quality of standards in the construction and know how in this field. In<br />
Cyprus manufacturers provide their products directly to the end users. The average market<br />
price of a typical water heater system of 150 litre hot water capacity, with 3m 2 of solar<br />
collectors is about 1000 euro plus 15% VAT. This price includes the installation cost and the<br />
hot and cold water storage tank.<br />
221
222<br />
ENERGY AND SUSTAINABLE DEVELOPMENT IN THE MEDITERRANEAN
CYPRUS- III. National Study<br />
5. PART IV: Proposals for more sustainable energy development<br />
5.1 Summary of under exploited RE and RUE<br />
One of the most important key issues related to the energy sector is the need for<br />
diversification of the energy supply sources. At the moment, Cyprus is almost entirely<br />
dependent on oil imports for its energy mix (94%), with a small but growing contribution from<br />
renewable energy sources. Electricity generation, is based exclusively on oil, and is<br />
exhibiting a significant increase in recent years, due to the increasing electricity demand.<br />
Any type of Renewable Energy Source can be considered under exploited in Cyprus apart<br />
from solar-thermal. Thus, any development that can take place based on the policies and<br />
measures described in previous sections, could be described as more sustainable energy<br />
development.<br />
The <strong>Action</strong> <strong>Plan</strong> for the promotion of RES as set in Cyprus determines that the contribution of<br />
RES to the total energy consumption of Cyprus should rise from 4.5% in 1995 to 9% in 2010.<br />
5.2 Proposal for a sustainable energy development<br />
5.2.1 Objectives<br />
For help the strengthening of country’s sustainable development policies diversification of the<br />
energy supply sources is the primary concern. This corresponds to construction of a<br />
receiving / regasification terminal for Liquefied Natural Gas (LNG), which would make<br />
possible the importation of natural gas. This project is planned to begin in 2007 and be<br />
completed by 2009.<br />
The overall environmental situation in Cyprus is characterized by deficiencies in<br />
environmental infrastructure, particularly in the area of urban waste water treatment, solid<br />
and hazardous waste management. Moreover, a continuous degradation of the natural<br />
environment particularly in the coastal areas was observed, due mainly to tourist<br />
development, whereas in the area of the energy intensity of the economy and the green<br />
house gases emissions, the relevant indicators for Cyprus are at relatively higher levels as<br />
compared to the EU average. This is to be explained by the following factors:<br />
- The technology used in the generation of electricity (use of heavy fuel oil);<br />
- The operation of energy intensive industries such as cement production;<br />
- The absence of public transport systems such as railways, simultaneously with the<br />
fact that the bus system is not well developed.<br />
Energy consumption is steadily increasing, whereas the transport sector accounts for a<br />
significant percentage of the total energy consumption.<br />
5.2.2 Main Tools<br />
The main policy priorities pursued by Cyprus in the area of the environment are the following:<br />
- The creation / expansion of the environmental infrastructure for a sustainable<br />
management of resources and waste;<br />
- The protection, preservation and management of coastal areas;<br />
223
224<br />
ENERGY AND SUSTAINABLE DEVELOPMENT IN THE MEDITERRANEAN<br />
- The promotion of energy saving and renewable energy sources;<br />
- The reduction of greenhouse gases emissions;<br />
- The internalization of external environmental costs.<br />
Measures underway / planned<br />
Renewable Energy: A programme, became operational as from February 2004, with a view<br />
to promote energy saving and renewable energy sources utilization; hence contributing<br />
positively to environmental sustainability. The targets of the programme are to increase the<br />
contribution of renewable energy sources from currently 4% to 9% by 2010 and for electricity<br />
production from zero to 6% by 2010. The programme provides financial incentives in the<br />
form of grants for the encouragement of investments and/or tariff subsidisation in the fields of<br />
energy conservation and the promotion of Renewable Energy Sources (RES) utilisation. It is<br />
financed through a special Fund; its revenue accruing from a levy of 0,13 cent (CYP) / Kwh<br />
on the consumption of electricity.<br />
Transport sector: The following measures were adopted in November 2004 for the<br />
encouragement of the sustainable use of energy:<br />
- A significant reduction of the excise duty for small and middle class volume engine<br />
vehicles;<br />
- A 15% discount for the purpose of the excise duty for cars with CO2 emissions of<br />
150gr/km or less and, at the same time, a 10% penalty on cars with CO2 emissions<br />
of 275gr/km or more;<br />
- Excise duty and registration fees on electric cars were abolished, whereas dual<br />
propulsion cars (hybrids) are now subject to half the registration and circulation fee;<br />
- An incentive for scrapping of vehicles older than 15 years, was introduced;<br />
- The discount in the form of a lower circulation licence that benefited older cars was<br />
abolished;<br />
- Finally, a provision was introduced for a small fee, paid for each saloon and light<br />
commercial vehicle before being cleared by the Customs (one cent per cc of engine –<br />
e.g. for a 1600cc car EURO 27 is paid). The total amount so collected is earmarked<br />
for the development and enhancement of public transport, and is considered as an<br />
innovative measure to Cyprus budgetary practice.<br />
Elaboration of a five year programme for the promotion of energy saving, which will be<br />
implemented as from 2006. The programme will be mainly financed from the special fund for<br />
energy conservation and the promotion of renewable resources. It includes a number of<br />
measures:<br />
- The undertaking of an intensive campaign on energy saving;<br />
- The provision of a subsidy on the excise duty of hybrid cars;<br />
- Promotion of the use of biofuels through the imposition of a zero excise duty on<br />
biofuels;
CYPRUS- III. National Study<br />
- Expansion of the use of the school bus;<br />
- Energy saving through relevant investment expenditure in public buildings;<br />
- By the construction of new buildings of the broader public sector, the relevant<br />
provisions on energy saving should be complied with;<br />
- Public procurement – The energy performance will be introduced as a criterion in the<br />
purchases of electrical equipment and motor vehicles by the Government.<br />
Reduction of Greenhouse Gases Emissions<br />
A Strategic <strong>Plan</strong> for a reduction on greenhouse gases emissions has been prepared, in order<br />
for the country to contribute to the global efforts to address climate change. <strong>Action</strong>s to<br />
promote the use of RES, such as installation of wind farms, of high efficiency air conditioning<br />
systems and electric appliances, energy-efficient lighting bulbs and automations, solar<br />
collectors, photovoltaic systems, promotion of co-generation and energy conservation and<br />
the campaign on public awareness on climate change, commenced since 2004. These<br />
actions are mainly financed from the special fund on renewable resources.<br />
5.2.3 Economic and financial costs<br />
See previous sections<br />
5.2.4 Benefits<br />
See previous sections<br />
5.2.5 Indicators<br />
See previous sections<br />
225
226<br />
ENERGY AND SUSTAINABLE DEVELOPMENT IN THE MEDITERRANEAN
Bibliography<br />
CYPRUS- III. National Study<br />
NTUA, EREC, Cyprus Institute of Energy, Applied Energy Centre MCI&T – Cyprus, Isula-IC, “Towards a White<br />
Paper for RES and RUE Strategy and <strong>Action</strong> <strong>Plan</strong> for the Republic of Cyprus”, 2004<br />
A. Emissions Inventory<br />
EMEP/CORINAIR, “Atmospheric Emission Inventory Guidebook”, Prepared by the EMEP Task Force on<br />
Emission Inventories, September 1999<br />
EU-DG XVII-A2, “NOx, SO2, CH4 and N2O emissions on the basis of the four long term energy scenarios of DG<br />
XVII”, 1996<br />
IPCC, “Good Practice Guidance and Uncertainty Management in National Greenhouse Gas Inventories”, 2000<br />
UNEP/WMO/OECD/IEA, “Revised 1996 Guidelines for National Greenhouse Gas Inventories: Reference<br />
Manual”, 1997<br />
U.S. Environmental Protection Agency [EPA], “Compilation of Air Pollutant Emission Factors AP-42”, 5th Edition,<br />
Volume I: Stationary Point and Area Sources”, 1995<br />
World Health Organization [WHO], “Assessment of Sources of Air, Water and Land Pollution – Part One: Rapid<br />
Inventory Techniques in Environmental Pollution”, Environmental Technology Series, Geneva, 1993<br />
227
B. Projections – Policies and Measures<br />
228<br />
ENERGY AND SUSTAINABLE DEVELOPMENT IN THE MEDITERRANEAN<br />
Argonne National Laboratory, “Description of ENPEP/BALANCE Model”, Technical Report, 2000<br />
CIA/HED – Republic of Cyprus, “Recycling of Municipal Solid Waste in the Main Urban and Tourist Centres of<br />
Cyprus”, Supplementary Report, May 1999<br />
Electricity Authority of Cyprus, “Development <strong>Plan</strong> 1999 – 2008”, March 1999<br />
EXERGIA – Ministry of Commerce, Industry and Tourism, “Preparation of an <strong>Action</strong> <strong>Plan</strong> for Improving Energy<br />
Efficiency of the Energy Sector of the Island of Cyprus”, 1st Technical Report within the framework of Synergy<br />
Programme, 1997<br />
Office for <strong>Plan</strong>ning, “Strategic Development <strong>Plan</strong> 1999 – 2003”, 1999<br />
U.S. Environmental Protection Agency [EPA], “Emissions Projection”, Report prepared for Projections Committee,<br />
Emissions Inventory Improvement Programme, 1999<br />
C. Statistical Publications<br />
Ministry of Finance, Department of Statistics and Research, “Transport Statistics”, “Agricultural Statistics”,<br />
“Industrial Statistics”, “Statistical Abstract”<br />
Electricity Authority of Cyprus, Operational Characteristics of the electricity generation system
EGYPT<br />
Mr Rafik Youssef GEORGY, New and Renewable Energy Authority (NREA)<br />
& Mr Adel Tawfik SOLIMAN, Power Transmission<br />
TABLE OF CONTENTS<br />
I. Summary ........................................................................................................................ 231<br />
1. Egypt's energy situation, related challenges, and energy sustainability indicators ...................... 231<br />
2. RUE and RE policies and progress achieved ........................................................................................ 232<br />
3. Barriers ....................................................................................................................................................... 233<br />
4. Success stories ......................................................................................................................................... 233<br />
5. Proposals for more sustainable energy development ........................................................................ 234<br />
II. Résumé ......................................................................................................................... 235<br />
1. L’énergie en Égypte, enjeux et indicateurs de durabilité énergétique ............................................. 235<br />
2. Les politiques URE et ERs et progrès réalisés ..................................................................................... 236<br />
3. Obstacles ................................................................................................................................................... 237<br />
4. Les “Success stories” ............................................................................................................................... 237<br />
5. Propositions en faveur d’un développement énergétique durable .................................................. 238<br />
III. National study .............................................................................................................. 239<br />
1. Egypt Energy Situation: Indicators and Basic Data ............................................................................. 239<br />
2. Rational Use of Energy (RUE) & Renewable Energy (RE) – policies, tools, progress and<br />
resulting effects ............................................................................................................................................ 259<br />
3. Examples of Good Practice (case studies) ........................................................................................... 280<br />
4. Proposals for more sustainable energy development ........................................................................ 287<br />
5. Table of illustrations ................................................................................................................................ 292<br />
Annex I: Details of Potential for RE ............................................................................................................ 293<br />
Annex II: Evolution of final consumer energy price per fuel and per sector ........................................ 298<br />
Annex III: Brief explanation of the difficulties encountered during data gathering ........................... 301<br />
Annex IV: List of main references ............................................................................................................... 302
I. SUMMARY<br />
EGYPT - Summary<br />
1. Egypt's energy situation, related challenges, and energy sustainability<br />
indicators<br />
The energy sector in Egypt is managed through two different ministries, the Ministry of<br />
Electricity and Energy (MOEE) and the Ministry of Petroleum (MOP). The energy<br />
infrastructures for oil, gas, and electricity in Egypt are adequate and covering most of the<br />
populated areas in the country. It also includes facilities to assist the exports of these energy<br />
carriers to other countries. These exports represent now a matter of debate as the balance<br />
between Egypt's local demand and its production capacity based on declared proven<br />
reserves became questionable.<br />
Energy activities are one of the major sources of pollution which might represent a threat to<br />
the ecosystem; land, water and air. Oil spells off-shore oil exploration and half of Europe‟s oil<br />
export passing the Red Sea, Suez Canal and the <strong>Mediterranean</strong> can all cause a threat to the<br />
environment. However, an environmental law was issued in 1994 aiming at environment<br />
protection and regulating measures and precautions. The total GHG emissions were<br />
estimated at 137.11 Million ton of CO2 equivalent in 2004/2005, out of which more than 70%<br />
was emitted by the energy sector including about 35% attributed to the electricity sector.<br />
Several project proposals have been made to mitigate this effect. Many of these proposals<br />
are being considered by the Egyptian Designated National Authority (DNA), who has<br />
announced in January 2007 that CDM projects portfolio included more than 40 projects of<br />
which 29 have been accepted and/or approved by the DNA.<br />
Securing energy resources and production to meet the national demand both on the short<br />
and long terms, along with adequate attention to environmental concerns, are considered<br />
vital elements for sustainable development. Hence, to face these challenges Egypt adopted<br />
different measures to increase the role of RUE and RE in the energy supply and use matrix.<br />
This orientation was supported by the very high potential of RUE and RE which are not<br />
completely exploited. Egypt is also still in the development phase of legislation supporting the<br />
use of RE & RUE. A proposed electricity act is currently under development. It would include<br />
some legislation favorable to RUE and RE in terms of obligations or commitments on both<br />
energy producers and consumers to assign a part of their production capacity and/or<br />
consumption to be from RUE and/or RE. In the same time a renewable energy fund has<br />
been established between MOEE and MOP funded from the difference between the<br />
international and local price of fuel saved by using RE. This difference will be split equally<br />
between the two ministries. The share of MOEE will be directed to support RE. Another<br />
incentive tool is that the Egyptian Electricity Transmission Company (EETC) bears the cost<br />
of wind farms connection to the 220 kV transmission lines until and including 22 kV in<br />
addition to paying a tariff per kWh about 10% higher than that paid to conventional<br />
generation companies.<br />
The New and Renewable Energy Authority (NREA) was established in 1986 to implement<br />
the RE strategy and update it in view of evolving RE trends. NREA mandate included the<br />
development of RE resources as well as conducting information dissemination and training<br />
programs to raise the public awareness on RE. However, RUE activities are scattered<br />
among several entities which hinders its evolution and decreases it impact in the total energy<br />
scene.<br />
Egypt depends currently to a great extent on fossil fuel, oil and natural gas, to meet the<br />
increasing demand on primary energy, where fossil fuel satisfied about 94% of primary<br />
demand in 2004/2005 including 50.4% as oil share and 43.6% as natural gas (NG) share.<br />
The rest is mainly met through hydropower at 4.75% and coal at 1.25% for the same year.<br />
The primary energy demand has grown at an average annual rate of 4.64% during the last<br />
25 years 1981/1982 – 2004/2005. During the same period, the oil demand has grown at an<br />
average annual rate of 3.34% while the increase in NG demand was much faster at 13%<br />
annual rate. Renewable Energy (RE) has only contributed to primary energy demand by<br />
231
232<br />
ENERGY AND SUSTAINABLE DEVELOPMENT IN THE MEDITERRANEAN<br />
about 0.2% at 2004/2005. Energy (RUE) accumulating effect is estimated to avoid a demand<br />
on primary energy evaluated at 0.5% to 1% during the same year.<br />
The electric energy demand has increased during the period 1981/1982 – 2005/2006 at an<br />
average annual rate of 6.64% causing a consequent increasing demand on primary energy<br />
mainly fossil fuel where hydropower contributed only by 4.72% from primary energy demand.<br />
However, the contribution of hydropower in meeting primary energy demand has decrease<br />
from 13.18% in 1981/1982 to 4.72% in 2004/2005. During the last 10 years (1995/96 to<br />
2004/05) the average annual growth rate of final energy demand reached 4.2%. During<br />
2004/05 the shares of different sectors demand in final energy consumption were: 40.7% for<br />
industrial, 31.2% for transport and 22% for residential and commercial.<br />
As for primary energy production, it has grown at average annual rate of 2.26% (almost one<br />
half of the primary energy demand growth rate), during 1981/1982 – 2004/2005. Oil<br />
production has increased during this period at only 0.13% annual average while natural gas<br />
has increased rapidly at an annual average of 11.4% reflecting the new discoveries of NG<br />
resources. The notice that primary energy consumption average annual growth rates<br />
exceeded that of primary production reflecting the challenge Egypt is facing in the next years.<br />
Oil resources has not changed in the last 10 years and become almost constant at 3.7 Billion<br />
Barrel of oil (bbl) without any significant increase. However, this issue is somewhat balanced<br />
by the coming on line of natural gas for meeting increasing demand with reserves estimated<br />
at 67 trillion cubic feet on January 2006.<br />
2. RUE and RE policies and progress achieved<br />
Egypt is on the way to develop its own "National Sustainable Development Strategy". Efforts<br />
are being coordinated through the Ministry of State for Environmental Affairs with all<br />
concerned stakeholders to draft the strategy. A ministerial committee has been established<br />
for this purpose headed by the Minister of State for Environmental Affaires and assisted by a<br />
technical group constituted of representatives of all concerned ministries. Energy is a major<br />
component of this national sustainable development strategy. The sustainability of energy<br />
calls for a sustainable long term vision for the energy supply/demand balance scenarios<br />
including maximizing the use of all available renewable resources, as well as setting<br />
quantitative targets and necessary mechanisms to insure the rational use of available<br />
resources. Also, minimizing the negative impact on the environment represents an integral<br />
part of energy sustainability.<br />
The creation in late 2006 of the Supreme Council of Energy as well as the undergoing<br />
formulation of the National Sustainable Development Strategy which in energy represents<br />
one of its major components, will facilitate the coordination of all existing policies and<br />
orientations into a well defined integrated energy strategy that defines quantitative<br />
measurable targets for the enhancement of the wide spread use of both RE and RUE. As a<br />
matter of fact, RE has received more attention and growth due to the existence of a national<br />
organization (NREA) taking the responsibility of developing its activities. However, RUE is<br />
not adopted by one entity, is very much less developed.<br />
The RE potential in Egypt is very high. In the Western Bank of Gulf of Suez the estimated<br />
potential is 20000 MW, which is almost equal to the overall installed capacity in 2004/2005.<br />
The present grid connected wind power plants installed capacity reached 230 MW, while the<br />
short term plan targets to reach 850 MW by year 2010 or about 3% of electricity demand;<br />
the long term target is to reach 3000 MW by 2021/2022 or about 7% of electric demand all<br />
on the Gulf of Suez, saving about 3 Mtoe annually. For the Integrated Solar – Combined<br />
Cycle System Power <strong>Plan</strong>ts, a 150 MW installed capacity power plant including 30 MW solar<br />
thermal part is planned for 2010 and long term plans target two similar plants each 300 MW<br />
installed capacity by 2020. There are also about 200 thousand Domestic Solar Water<br />
Heating units now installed in Egypt where the typical unit contains 2 meters squared of flat<br />
plate collector's area and 150 liters storage saving about 0.085 mtoe annually. Photovoltaic<br />
systems capacity for different applications has reached about 5.2 MW peak in 2005/2006<br />
with largest share for telecommunication applications and small remote isolated roads far<br />
from the national grid.
EGYPT - Summary<br />
To assess RUE and RE development status and based on the availability of data, different<br />
indicators have been presented and analyzed in the study report. Also, the report discusses<br />
the decoupling between energy efficiency evolution and economy. This analysis is based on<br />
the ratio between the primary energy consumption and GDP based on PPP annual growth<br />
rates. This ratio which fluctuates by about ±10% around the value of one reflects that energy<br />
and economy are still strongly coupled together.<br />
The evolution of total energy intensity since 1981/82 till 2004/05 reveals that its value is<br />
quasi-constant at 0.19 Kgoe/ $ PPP 2000 with a variation of ±10% with a minimum of 0.17 in<br />
1981/82 and a maximum of 0.21 in 1990/91 and 2004/05. There is no clear trend of<br />
improvement in Energy intensity on the national level.<br />
3. Barriers<br />
Many barriers are hindering the development of RUE and RE such as economic and financial<br />
barriers due to subsidized conventional energy prices and the absence of well defined<br />
legislation supporting RUE or RE, institutional barriers of having two ministries responsible<br />
for energy issues which make integrated energy planning more difficult, and market barriers.<br />
To overcome the present barriers, this report proposes a package of interdependent and<br />
integrated set of actions and measures to be adopted by the parliament, the government<br />
represented in the cabinet and concerned ministries, energy users associations, and energy<br />
service companies.<br />
4. Success stories<br />
Three success stories were presented:<br />
One case study on: Energy Efficiency Labeling (EEL) for household appliances<br />
Energy efficiency label is what consumers actually see when they go to purchase an<br />
appliance. It provides consumers with information to make informed choices, encourages<br />
manufacturers to improve the energy performance of their models, and encourages<br />
distributors & retailers to display efficient products. Egypt has already developed and issued<br />
three standards (together with its corresponding labels) for three electric appliances, namely<br />
refrigerators, air conditioners, and washing machines.<br />
The Government of Egypt had succeeded in obtaining a fund for the establishment of an<br />
accredited energy efficiency testing laboratory to support the national energy efficiency<br />
standards and labeling program. The energy efficiency testing laboratories for the washing<br />
machines and the refrigerators have been accomplished and ready for testing since 2005.<br />
However, the one for air conditioners was already operational during late 2006.<br />
Two case studies on wind energy resource assessment and development<br />
With its 230 MW wind farms installed capacity, Egypt is on top of all African and Middle East<br />
countries in grid-connected wind power generation. Since the late 1970s, Egypt started<br />
considering the use of RE where several bilateral and multilateral agreements were signed<br />
and implemented to explore potential horizons of RE use.<br />
RE resources assessments studies were conducted where the wind resource study pointed<br />
out to the great wind potential the Gulf of Suez is endowed with. This result stimulated world<br />
wide interest in developing such studies along with implementing pilot and field testing<br />
projects. The success of those projects coupled with the elaboration of Wind Atlas for Egypt,<br />
allowed the country to cross thus stage to large scale commercial utilization.<br />
Of equal importance, was the willingness of developed countries that already have an<br />
advanced record in wind resource utilization and its equipment manufacture, to cooperate<br />
with Egypt and offer adequate financing facilities from the beginning, particularly to<br />
compensate for the higher cost of RE compared to conventional and enable wind power<br />
projects development. Such countries included Germany, Denmark and at the beginning,<br />
then currently include Spain and Japan.<br />
233
234<br />
ENERGY AND SUSTAINABLE DEVELOPMENT IN THE MEDITERRANEAN<br />
The development of large scale grid-connected wind farms have had several benefit to the<br />
country either direct or indirect among which are: saving natural gas and oil, contributing to<br />
capacity building and know-how transfer, protecting the environment through the use of clean<br />
energy, contributing to develop remote desert areas, and finally stimulating local manufacture<br />
of about 25% of wind project material.<br />
5. Proposals for more sustainable energy development<br />
The energy sector is still playing a vital role in Egypt's economy. However, the Egyptian<br />
government currently faces a real challenge to make a strategic choice between satisfying<br />
the ever increasing national primary energy demand (depending by more than 94% on oil<br />
and gas) that is being offered to end-users with subsidized prices, and maintaining a certain<br />
level of hard currency revenues from oil and gas exports at world prices, even with a growing<br />
risk of accelerated depletion rates of national proven reserves. As it has been discussed<br />
earlier, different scenarios expect that if current practices in the energy sector will continue<br />
as it is, Egypt will become a net oil importer during the near future which would increase the<br />
share of NG in the energy supply local matrix in addition to binding existing commitments of<br />
long term export contracts that would rather increase and accelerate its depletion rate. This<br />
tendency if continues should certainly lead to a non sustainable energy future that<br />
government and citizens should work hand in hand from now to avoid its occurrence.<br />
Being aware of this fact, Egypt's energy strategic framework has adopted RE and RUE as<br />
policy options within the strategies of main organizations of the energy sector. RE received<br />
more attention and reached a reasonable level of exploitation as a specific ministry (MOEE)<br />
has abided by its responsibility and created a dedicated organization (NREA) for the<br />
development of RE national strategy and bearing the duty of its implementation. However,<br />
RUE has not yet got its sponsor "god father" who would develop a national strategy, set<br />
quantifiable objectives, propose or develop tools and legislations, monitor and follow up<br />
achievements, and assesses impacts and accumulated experiences and lessons learned to<br />
modify and improve future plans.<br />
Lastly, there is another important part affecting the success of any proposed sustainable<br />
energy development approach, which is the energy end-user. All proposed policies are often<br />
drafted, revised, approved, and adopted by technocrats and professionals representing only<br />
the supply side of the energy chain. This scheme had functioned well for the conventional<br />
forms of energy (being commodities) like electricity, NG, and oil products. However, the<br />
same scheme has failed to succeed in the case of RUE and non bulk RE utilization as in<br />
most of the cases the end-user find him self requested to get involved in a process much<br />
different from just buying a "commodity". To be successful, RUE and RE strategies together<br />
with accompanying tools and measures have to be developed through deep negotiations and<br />
intimate involvement of end-users associations.
II. RESUME<br />
EGYPT - Résumé<br />
1. L’énergie en Égypte, enjeux et indicateurs de durabilité énergétique<br />
En Égypte, deux Ministères sont chargés de la gestion du secteur de l‟énergie : le Ministère<br />
de l‟Electricité et de l‟Energie (MOEE) et le Ministère du Pétrole (MOP). L‟Égypte est dotée<br />
d‟infrastructures pétrolières, gazières et électriques couvrant la plupart des zones habitées,<br />
ainsi que d‟infrastructures permettant l‟export de sa production d‟énergie. Ces exportations<br />
sont sujettes à débat, depuis la remise en question de l‟équilibre entre la demande locale et<br />
la capacité de production sur la base de réserves avérées.<br />
Dans ce secteur, les activités peuvent être sources de pollution potentiellement dangereuse<br />
pour l‟environnement (sol, eau, air). Le pétrole requiert une exploration off-shore et 50% des<br />
hydrocarbures exportés transitent par la Mer Rouge, le Canal de Suez et la Méditerranée,<br />
représentant un fort risque environnemental, et ce, malgré une loi de 1994 en faveur de la<br />
protection de l‟environnement et réglementant les mesures et précautions requises. En<br />
2004/05, le total des émissions de gaz à effets de serre était estimé à 137,11 millions de<br />
tonnes d‟équivalent CO2, dont plus de 70% provenant des activités énergétiques incluant<br />
35% émanant de la production d‟électricité. En conséquence, plusieurs initiatives ont été<br />
proposées pour contrecarrer ces effets dont certaines sont à l‟étude au sein de la Egyptian<br />
Designated National Authority (DNA), qui a annoncé en janvier 2007 que 29 des quelques 40<br />
initiatives MDP proposées ont été acceptées et/ou validées.<br />
Garantir les ressources énergétiques ainsi que leur production pour répondre à la demande<br />
nationale sur le court et long terme ainsi que la protection de l‟environnement sont<br />
considérés comme des composantes essentielles du développement durable. Ainsi, pour<br />
couvrir les enjeux, l‟Égypte a adopté plusieurs mesures permettant d‟accroître le rôle de<br />
l‟URE et des ERs dans l‟équation offre et utilisation. Cette orientation est soutenue par le très<br />
fort potentiel d‟URE et des ERs, toujours largement inexploité. La législation favorable à<br />
l„exploitation de l‟URE et des ERs est toujours en cours d‟élaboration. Elle devrait inclure une<br />
législation favorable aux URE et ERs en termes d‟obligations ou d‟engagements applicables<br />
à la fois aux producteurs d‟énergie et aux consommateurs afin qu‟ils allouent une part de leur<br />
capacité de production et/ou de consommation à l‟URE et aux ERs. En parallèle, MOEE et<br />
MOP ont crée un fond pour les énergies renouvelables à partir de la différence entre le prix<br />
mondial et local des quantités de gaz naturel économisées. Cette différence sera partagée<br />
équitablement entre les 2 Ministères, la part du MOEE étant attribuée à la promotion des<br />
ERs. Un autre outil incitatif vise à faire supporter au producteur national, l‟EETC (Egyptian<br />
Electricity Transmission Company), les coûts de raccordement des éoliennes au réseau de<br />
220 kV à hauteur de 22 kV, en plus du règlement d‟un prix au kWh de 10% supérieur au prix<br />
versé par kWh produit aux producteurs conventionnels.<br />
La NREA, Institution pour les énergies nouvelles et renouvelables (The New and Renewable<br />
Energy Authority), fut créée en 1986, pour la mise en oeuvre de la stratégie ER et de sa<br />
réactualisation face aux évolutions. Le mandat de la NREA couvrait également le<br />
développement des ERs et la conduite de programmes de dissémination d‟information et de<br />
formation pour sensibiliser la population. Cependant, ces initiatives sont disséminées entre<br />
plusieurs entités, ce qui a pour effet de retarder les avancées et de minimiser l‟impact de<br />
ERs sur la scène nationale.<br />
Actuellement, l‟Égypte est toujours fortement dépendante des énergies fossiles, tels que le<br />
pétrole et le gaz naturel, pour répondre à la demande croissante en énergie primaire, qui<br />
couvrent environ 94% de la demande en énergie primaire en 2004/05, dont 50,4% par le<br />
pétrole et 43,6% par le gaz naturel. Pour la même période, les besoins restants étaient<br />
couverts à 4,75% par l‟énergie d‟origine hydraulique et à 1,25% par le charbon. Sur les<br />
derniers 25 ans, de 1981/1982 à 2004/2005, la demande en énergie primaire a connu une<br />
croissance annuelle moyenne de 4,64% contre une augmentation annuelle moyenne de<br />
3,34% de la demande en pétrole, alors que l‟augmentation de la demande en gaz naturel a<br />
été beaucoup plus rapide, affichant un taux annuel de 13%. La part de la demande en<br />
énergie primaire couverte par les énergies renouvelables (ERs) en 2004/05 ne représentait<br />
235
236<br />
ENERGY AND SUSTAINABLE DEVELOPMENT IN THE MEDITERRANEAN<br />
que 0,2%. Les effets cumulés de l‟URE devraient permettre d‟éviter une augmentation de la<br />
demande primaire en énergie estimée entre 0,5% et 1% sur la même période.<br />
Entre 1981/1982 et 2005/2006, la demande en électricité a connu une augmentation<br />
annuelle moyenne de 6,64%, déclenchant ainsi une plus forte pression de la demande en<br />
énergie primaire, essentiellement en énergies fossiles, la part de l‟électricité d‟origine<br />
hydraulique ne représentant que 4,72% des besoins en énergie primaire. En outre, cette part<br />
a subi une baisse entre 1981/82 et 2004/05, passant de 13,81% à 4,72%. Au cours de la<br />
dernière décennie (1995/96 à 2004/05), le taux de croissance annuelle moyenne de la<br />
demande finale en énergie a atteint 4,2%. En 2004/05, la part des différents secteurs dans la<br />
consommation totale était : 40,7% pour l‟industriel, 31,2% pour les transports et 22% pour<br />
les secteurs résidentiels et tertiaires.<br />
Entre 1981/1982 et 2004/2005, le taux de croissance annuelle moyen de la production<br />
d‟énergie primaire s‟établit à 2,26% (presque 50% du taux de croissance de la demande en<br />
énergie primaire). Sur la même période, la production pétrolière a affiché un taux de<br />
croissance annuel moyen de seulement 0,13% alors que la croissance annuelle moyenne du<br />
secteur du gaz naturel atteint rapidement les 11,4%, suite à la découverte des ressources en<br />
gaz naturel. Ce taux de croissance annuel moyen est plus élevé pour la consommation que<br />
pour la production d‟énergie primaire et reflète les enjeux auxquels l‟Égypte devra faire face<br />
à l‟avenir. Il n‟y a eu aucune évolution des ressources pétrolières depuis dix ans, les niveaux<br />
se stabilisant à 3,7 milliards de barils, sans augmentation notable. Cependant, ce problème<br />
est en partie compensé par l‟arrivée du gaz naturel, permettant de répondre à la demande<br />
croissante par l‟exploitation de réserves estimées à 67 mille milliards de m 3 en février 2006.<br />
2. Les politiques URE et ERs et progrès réalisés<br />
L‟Égypte est en cours d‟élaboration de la Stratégie Nationale du Développement Durable.<br />
Les parties prenantes impliquées dans la rédaction du document sont coordonnées par le<br />
Ministère d‟Etat pour l‟Environnement, au sein d‟un comité ministériel crée à cet effet, assisté<br />
par un groupe de travail technique composé des représentants des différents ministères<br />
concernés. L‟énergie est la composante principale de la stratégie nationale ; sa pérennité<br />
requiert une vision à long terme des scénarios d‟équilibre entre l‟offre et la demande, pour<br />
promouvoir l‟utilisation des ressources en énergies renouvelables disponibles et pour définir<br />
les objectifs quantitatifs ainsi que les dispositifs nécessaires pour garantir l‟URE. La<br />
durabilité des ressources énergétiques passe également par la maîtrise des impacts<br />
environnementaux.<br />
La création du Conseil Supérieur de l‟Energie fin 2006, ainsi que l‟élaboration de la Stratégie<br />
Nationale pour le Développement Durable, dont l‟énergie est une des problématiques<br />
principales, devraient faciliter la coordination des politiques et des orientations actuelles afin<br />
de définir une stratégie énergétique intégrée et fixer des objectifs quantitatifs mesurables<br />
pour la valorisation des ERs et de l‟URE. La promotion et la croissance des ERs ont<br />
bénéficié de l‟existence de la NREA, chargée de développer les activités afférentes à ce<br />
secteur, bien plus que l‟URE, qui n‟a pas pour l‟instant bénéficié d‟un tel soutien.<br />
Le potentiel des ERs en Égypte est considérable : sur la rive occidentale du Golfe de Suez,<br />
ce potentiel est estimé à 20 000 MW, soit un niveau presque équivalent à la capacité totale<br />
installée en 2004/05. La capacité installée des éoliennes actuellement raccordées au réseau<br />
atteint 230 MW, alors que les objectifs visés à court terme avoisinent les 850 MW d‟ici à<br />
2010, soit environ 3% de la demande en électricité. Les objectifs à long terme visent 3000<br />
MW/an d‟ici à 2021/22, soit 7% de la demande totale autour du Golfe de Suez, représentant<br />
des économies annuelles de 3 Mtep. Pour le solaire intégré (Integrated Solar – Combined<br />
Cycle System Power <strong>Plan</strong>ts), l‟installation d‟une centrale de 150 MW est prévue en 2010,<br />
dont 30 MW d‟énergie solaire, tandis que les projets à long terme prévoient 2 autres<br />
centrales similaires d‟une capacité de 300 MW chacune d‟ici 2020. Il existe aujourd‟hui en<br />
Égypte environ 200,000 unités de production d‟eau chaude par énergie solaire, équipées de<br />
collecteurs d‟eau de 2 m 2 d‟une capacité de stockage de 150 litres, représentant une<br />
économie annuelle de 0,085 Mtep. En 2005/06, la capacité photovoltaïque s‟approche des
EGYPT - Résumé<br />
5,2 MW, couvrant la forte demande du secteur des télécommunications et des petites routes<br />
isolées et éloignées du réseau national.<br />
L‟étude visant à évaluer les progrès du développement de ERs et de l‟URE sur la base des<br />
données disponibles présente et analyse différents indicateurs. Le rapport traite également<br />
du découplage entre l‟efficacité énergétique et l‟activité économique, se basant sur le ratio<br />
consommation d‟énergie primaire / PIB en PPA. Ce ratio qui fluctue de plus ou moins 10%<br />
autour de la valeur 1 démontre que le découplage énergie/économie n‟est pas réalisé.<br />
L‟évolution de l‟intensité énergétique totale entre 1981/82 et 2004/05 démontre que la valeur<br />
reste quasi-constante à 0,19 Kgep/ $ PPP 2000 à plus ou moins 10%, le niveau le plus bas<br />
de 0,17 atteint en 1981/82 et le niveau maximal de 0,21 en 1990/91 et en 2004/05. Cette<br />
analyse ne révèle pas d‟amélioration nette de l‟intensité énergétique au niveau national.<br />
3. Obstacles<br />
Le développement des ERs et de l‟URE est toujours confronté à de nombreux obstacles, tels<br />
que les barrières économiques et financières résultant des tarifs appliqués aux énergies<br />
conventionnelles, l‟absence de législation favorable aux ERs et à l‟URE, les barrières<br />
institutionnelles découlant de l‟implication de 2 Ministères responsables de l‟énergie, ce qui<br />
complique encore la planification intégrée, et enfin les barrières du marché.<br />
Pour circonvenir ces obstacles, ce rapport propose un ensemble intégré d‟actions et de<br />
mesures, devant être adoptées par le Parlement, le Gouvernement, les Ministères<br />
concernés, les associations de consommateurs et les producteurs.<br />
4. Les “Success stories”<br />
Trois cas sont présentés :<br />
Une étude de cas sur le Label d‟Efficacité Energétique (LEE) pour les appareils ménagers<br />
Le Label d‟Efficacité Energétique est appliqué sur tous les appareils ménagers et fournit<br />
aux consommateurs des informations leur permettant de faire leur choix en toute<br />
connaissance de cause. Ce label encourage les fabricants à améliorer l‟efficacité<br />
énergétique de leurs appareils et les distributeurs et détaillants à préférer des produits les<br />
plus efficaces. L‟Égypte dispose aujourd‟hui de normes et de labels pour les<br />
réfrigérateurs, les systèmes de ventilation (air conditionné) et les lave-linges.<br />
Le Gouvernement Egyptien a pu obtenir le financement nécessaire à l‟installation d‟un<br />
laboratoire d‟essais agréé pour soutenir le programme national de développement de<br />
normes et de labels d‟efficacité énergétique. Dans le cas des lave-linges et des<br />
réfrigérateurs, les laboratoires d‟essais ont été construits et mis en service depuis 2005 et<br />
le laboratoire spécifique aux systèmes de ventilation était opérationnel dès fin 2006.<br />
Deux études de cas sur l‟évaluation et le développement de l‟énergie éolienne<br />
Avec une capacité d‟énergie éolienne installée de 230 MW, l‟Égypte est le premier pays<br />
d‟Afrique et du Moyen-Orient à bénéficier d‟une production d‟énergie éolienne. Depuis la<br />
fin des années 70, l‟Égypte avait commencé à étudier l‟utilisation des Ers ; plusieurs<br />
accords bilatéraux et multilatéraux ont été signés et mis en œuvre pour explorer leur<br />
potentiel.<br />
Les études d‟évaluation des ERs ont démontré le fort potentiel en énergie éolienne dont<br />
bénéficie le Golfe de Suez et ont stimulé l‟intérêt mondial pour de telles études ainsi que<br />
pour la mise en œuvre de projets pilotes et de tests sur le terrain. Le succès remporté par<br />
ces initiatives, ainsi que l‟élaboration du Wind Atlas a permis à l‟Égypte de passer à<br />
l‟utilisation commerciale à grande échelle.<br />
Il faut également mentionner ici la volonté des pays industrialisés, déjà expérimentés<br />
dans l‟utilisation de l‟énergie éolienne et dans la fabrication des infrastructures<br />
nécessaires, de collaborer avec l‟Égypte en proposant des financements au démarrage<br />
des projets pour compenser le coût plus élevé des ERs par rapport aux énergies<br />
237
238<br />
ENERGY AND SUSTAINABLE DEVELOPMENT IN THE MEDITERRANEAN<br />
traditionnelles et ainsi permettre le développement des infrastructures d‟énergie éolienne.<br />
Ces pays incluaient l‟Allemagne, le Danemark, suivis par l‟Espagne et le Japon.<br />
Au niveau national, les bénéfices directs ou indirects du développement à grande échelle<br />
des éoliennes raccordées au réseau ont été nombreux, tels que les économies de gaz<br />
naturel et d‟hydrocarbures, le renforcement des capacités et le partage de savoir-faire, la<br />
protection de l‟environnement par la production d‟énergie propre, contribuant ainsi au<br />
développement de zones désertiques isolées, et enfin en stimulant la fabrication locale<br />
des infrastructures nécessaires à hauteur de 25%.<br />
5. Propositions en faveur d’un développement énergétique durable<br />
Le rôle du secteur énergétique reste prédominant dans l‟économie égyptienne. Cependant,<br />
le gouvernement doit aujourd‟hui faire un choix stratégique entre la satisfaction de la<br />
demande nationale toujours croissante en énergie primaire (dépendante du pétrole et du gaz<br />
à plus de 94%) proposés à tarifs spéciaux au consommateur final, et le maintien des revenus<br />
générés en devises provenant des exportations de pétrole et de gaz au tarif mondial, même<br />
au risque de plus en plus important d‟épuiser les ressources nationales avérées. Comme<br />
cela a été démontré plus haut, les différents scénarios prévoient, si les tendances de la<br />
consommation actuelles se maintiennent, que l‟Égypte devienne un importateur net de<br />
pétrole dans un avenir proche, ce qui augmenterait encore la part du gaz naturel dans<br />
l‟approvisionnement énergétique local et s‟ajouterait aux engagements contraignants liés aux<br />
contrats d‟exportation existants impactant encore plus fortement et plus rapidement les<br />
réserves nationales. Si cette tendance se maintenait, elle augurerait d‟un avenir énergétique<br />
non durable que le gouvernement et les citoyens doivent ensemble absolument empêcher.<br />
Face à ces risques potentiels, les ERs et l‟URE font partie des politiques de la Stratégie<br />
Nationale en matière d‟énergie applicables aux acteurs principaux du secteur. Les ERs ont<br />
fait l‟objet d‟une grande attention, et bénéficient d‟un niveau d‟exploitation raisonnable grâce<br />
à l‟implication et à l‟engagement du MOEE qui a créé un organisme (NREA) dédié à<br />
l‟élaboration d‟une stratégie nationale des ERs et chargé de sa mise en œuvre. Cependant,<br />
l‟URE n‟a pas bénéficié d‟un tel soutien, propice à l‟élaboration d‟une stratégie nationale, à la<br />
définition d‟objectifs quantifiables, aux propositions ou au développement d‟outils et<br />
législations correspondants, permettant le suivi des progrès effectués, l‟évaluation des<br />
impacts et de l‟expérience acquise ainsi que des enseignements pour modifier et améliorer<br />
les projets futurs.<br />
Il ne faut pas oublier l‟impact du consommateur final, dont le rôle est considérable dans la<br />
réussite de tout projet de développement durable. Les politiques proposées sont élaborées,<br />
révisées, validées et adoptées par les technocrates et les professionnels représentant<br />
uniquement le côté « offre » de la chaîne énergétique. Cette approche a bien fonctionné<br />
pour les énergies conventionnelles telles que l‟électricité, le gaz naturel, les hydrocarbures,<br />
mais n‟a pas connu le même succès dans le cas des ERs et de l‟URE, car dans la plupart<br />
des cas, le consommateur final se retrouve impliqué dans un processus bien différent du<br />
simple achat d‟un bien de consommation courant. Pour réussir, les stratégies applicables<br />
aux ERs et à l‟URE, ainsi que les outils et les mesures nécessaires, doivent être élaborées<br />
en partenariat avec les associations de consommateurs.
III. NATIONAL STUDY<br />
EGYPT - National study<br />
1. Egypt Energy Situation: Indicators and Basic Data<br />
1.1 Energy G ene ric Context<br />
The rapid growth of energy production and consumption is strongly affecting and being<br />
affected by the Egyptian economy in many aspects. It is evident that energy will continue to<br />
play an important role in the development of Egypt's economy in coming years. The fossil<br />
energy resources are from one side a source for foreign currency from exports, and are from<br />
the other side a prime mover for the present and future development plans of the country.<br />
Though Egypt‟s net exports of crude oil and petroleum products have declined in recent<br />
years, higher prices in the world markets have pushed Egypt's oil revenues upward. Another<br />
aspect of enhancing hydrocarbon revenues is the start of the exports of liquefied natural gas<br />
(LNG) in 2005. Concerns about maintaining adequate future reserves for domestic demand<br />
has led the government to further limit gas reserves available for export to 25 percent, down<br />
from a third under previous regulations.<br />
The year 2005/06 witnessed the highest production achieved in the history of petroleum<br />
sector. Total production of crude oil, condensates, liquefied gas and natural gas reached<br />
about 73.67 million ton oil equivalent (mtoe) including about 36.67 mtoe from crude oil,<br />
condensates and LPG, and about 37 mtoe from natural gas. The rapid increase in natural<br />
gas production that exceeds now 50% of the hydrocarbons production in Egypt has masked<br />
the direct or "apparent" effect of the declining crude oil production.<br />
The ever increasing domestic demand on petroleum products and natural gas is considered<br />
the most important challenge that faces oil and gas industry in Egypt. Consumption volume<br />
increased from about 30 million tons in 1999 to 52 million tons in 2005/06. It is expected to<br />
reach 53 million tons in 2006/07. The present primary energy needs of the country are mainly<br />
covered from oil and gas (94% on the year 2005/2006) and the rest is secured from<br />
hydroelectricity, coal, and wind power.<br />
To monitor the high rate of depletion of oil resources in Egypt, it is important to notice that in<br />
2005 the estimated proven oil reserves stood at 3.7 billon barrels, or 0.3 percent of world<br />
reserves, while crude oil production averaged 579,000 bl/d, or less than 1 percent of world<br />
production. To slow down recent annual declines in production, Egypt is hoping to discover<br />
sufficient oil throughout exploration activities in new areas together with an enhanced oil<br />
recovery (EOR) program in existing oil wells<br />
The total installed electricity generating capacity in 2005/2006 reached 20.31 GW with a total<br />
generated electric energy of 107.5 TWh (Terra Watt hour) out of which 87.8 % (94.4 TWh)<br />
are generated from thermal power plants, 11.7 % (12.6 TWh) from hydropower plants, and<br />
0.5 % (0.5 TWh) from wind energy farms. Egypt's power network is now interconnected to<br />
the east with Jordan and Syria and to the west with Libya that will be expanded shortly to the<br />
Maghreb countries (Tunisia, Algeria, Morocco) and then to Europe through the Spain-<br />
Morocco interconnection.<br />
Being aware of the challenge that would face the country for the availability of crude oil and<br />
natural gas in the future, Egypt has already established a long term strategy as well as an<br />
ongoing program for the use of new renewable energies particularly for electricity generation;<br />
mainly wind resources and with a less intensive efforts for solar energy. An ambitious<br />
program for the generation of electricity from wind energy has already started since several<br />
years in the Gulf of Suez region north of the Red Sea coast with an installed capacity of 230<br />
MW (2006) planned to reach a capacity of 850 MW by 2010 in the same region. From<br />
another side, a less ambitious program is already under way for the implementation of<br />
Integrated Solar/Combined Cycle Power Stations. It is still in its early stages starting with a<br />
pilot project of 150 MW installed capacity out of which 30 MW are "fueled" through solar line<br />
concentrators. Other less important contributions could be considered from domestic solar<br />
water heating, photovoltaic, and biomass.<br />
239
240<br />
ENERGY AND SUSTAINABLE DEVELOPMENT IN THE MEDITERRANEAN<br />
In the same direction, Egypt has declared, during 2006, its intention to consider a program<br />
for nuclear power plants which is still under discussion on the national and international<br />
levels.<br />
It would be worth to mention that the driving forces of the ever increasing demand for primary<br />
energy resources are: meeting the needs of development plans in rural and urban areas, in<br />
addition to existing subsidies for energy prices, the continuous relatively high population<br />
growth, and the growing implementation of new intensive energy consuming industries.<br />
1.2 Share in the Energy s ecto r and Ins ti t utional Spe cificities<br />
1.2.1 The Sector's Economic Weight<br />
Energy share in GDP<br />
The energy sector plays a substantial role in the economic development of Egypt, fulfilling<br />
domestic energy demands for petroleum products, natural gas, and electricity. The sector<br />
contributes indirectly to macroeconomic variables such as Gross Domestic Product (GDP),<br />
commodity exports, investments, the state budget, and employment. Egypt's share of GDP<br />
based on PPP in the world total GDP has increased slowly from 0.41% in 1980/81 to 0.51%<br />
in 2005/2006 with different periods of ups and downs.<br />
Egypt's economy is recovering gradually from the declining growth rates it experienced in the<br />
period 1991/92 till 2001/02, but with a growth rate still far below what was achieved during<br />
the 1980s of about 7%. The country's real Gross Domestic Product (GDP) grew by 4.7<br />
percent in 2005, after achieving real growth of 3.6 percent in 2004. Real GDP growth is<br />
forecasted at 5.7 percent for 2006.<br />
Energy is expected to continue to play its important role in Egypt's economy in coming years.<br />
Though Egypt‟s net exports of crude oil and petroleum products have declined in recent<br />
years, higher prices on world markets have pushed Egypt's oil revenues upward. The country<br />
also began exports of liquefied natural gas (LNG) in January 2005, adding to its hydrocarbon<br />
revenues<br />
The combination of all petroleum activities, including domestic refining, pipelining, distribution<br />
and marketing, pushed up the Petroleum Sector share of GDP to nearly 14% during the first<br />
half of the 1980s. This percentage has declined and ranged around 9% during the period<br />
1990/91 – 1996/97, and continued to decrease gradually to reach less than 5% by the year<br />
2001/02. However, this share started to increase and stabilize at around 8% since 2002/03<br />
till 2004/05.<br />
Although the quantity of exported crude oil and oil products has continued to decrease,<br />
exports are increasingly shifting to natural gas as production at mature oil fields decreases.<br />
The recent years increasing prices of oil together with the start of the exports of liquefied<br />
natural gas (LNG) has moved up the share of the oil sector in the GDP again up to 10% by<br />
the year 2005/2006.<br />
One example to monitor how the oil export revenues are vulnerable due to international oil<br />
prices variations, this can be shown by the value of exports of petroleum and related<br />
products that fell to USD 1.2 billion in 1997/98, down from USD 2.4 billion for the previous<br />
year.<br />
The electricity sector share in the GDP is almost constant with time, during the last 10 years<br />
(1995/96 – 2004/05) it has an average value of 1.8%, while the oil and gas sector average<br />
share was 7.1%, that are added up together to give an average share of the energy sector in<br />
the GDP reaching 8.9% during the same period.<br />
Energy share in exports and imports<br />
During the period 1975-1985, the rapid growth of oil and gas production has influenced the<br />
Egyptian economy in many aspects, but two major issues are worth mentioning.<br />
First, the availability of sufficient domestic sources of energy, mainly oil and gas, have<br />
encouraged and actually sustained ever rapidly increasing energy consumption.
EGYPT - National study<br />
Second, a growing surplus of oil and gas has made it easier to turn Egypt from an oil<br />
importing country during the first half of the 1970s to an oil exporting country since 1976.<br />
In 1980 oil exports was 340,000 barrels per day (bl/d), reaching 500,000 bl/d in 1985 and<br />
peaking to 560,000 bl/d in 1995. Since 1995 net exports of oil has sharply decreased to<br />
reach 110,000 bl/d by the year 2004.<br />
This oil exports steep decline can be explained by a rate of growth of oil consumption<br />
steadily exceeding that of oil production and even accentuated by a continuous declining<br />
production capacity. This can be clearly seen from figure (I.1) below.<br />
Figure 1 Egypt's Oil Production (Broken down into Exports and Domestic Consumption)<br />
By the start of 2006, Egypt's proven oil reserves have been maintained officially at 3.7 billion<br />
barrels with no substantial increase in the past decade. One has to remember that one third<br />
of this reserve is the property of the foreign partner, that Egypt will be obliged to buy totally<br />
(rather than partially in current practice) to meet future local demand.<br />
It is clear that export of oil is rapidly declining and Egypt is faced with a trade-off between<br />
exporting crude oil and exporting refined oil products. If Egypt wants to maintain being a<br />
crude oil exporter then it would have to decrease the throughput to refineries and hence<br />
decrease its refined oil export revenues. However, recent trends pointed out that Egypt<br />
would rather prefer to export oil products as having higher added value in revenues.<br />
Different studies expected Egypt to be a net importer of oil in the near future, however<br />
natural gas, on the other hand, is abundant with an official proven reserves estimated at 67<br />
trillion cubic feet in January 2006. Only about 60% of this reserve is the property of Egypt as<br />
the rest belongs to the foreign partners.<br />
Net oil export revenues continued to grow since 1976 to peak around a plateau of US$ 2.5<br />
billion during the period 1980-1985. In 1985, net oil export revenues accounted for 65 % of<br />
total merchandise exports. The 1986 crash of oil prices in world markets pulled down the<br />
Egyptian oil revenues, reducing its share of total merchandise exports from 65 % to 30 % by<br />
the year 1989/90. During the period 1995/96 to 2004/05 net oil export revenues averaged<br />
nearly 39 % of merchandise exports that has increased to about 44 % by the year 2005/06<br />
with the launch of the exports of LNG. It is worth mentioning here that the revenues from the<br />
exports of foreign partners share from crude oil and NG, which is not purchased locally by<br />
the Egyptian authorities, is included in the revenues of the oil sector exports.<br />
Prospects for development of additional new gas discoveries and the recent expansion of the<br />
gas industry have encouraged an increasing shift from oil to gas, thereby mitigating the loss<br />
of export earnings. Doubling of gas production and an increase in its consumption would<br />
release additional oil exports. In addition, the increased domestic use of gas would entail<br />
radical changes in the output profile of the refineries and thereby affect the export profiles of<br />
petroleum products including natural gas.<br />
241
242<br />
ENERGY AND SUSTAINABLE DEVELOPMENT IN THE MEDITERRANEAN<br />
From the point of view of oil imports, it is rather complicated. Only imported oil products from<br />
outside the borders are being considered. However, Egypt is obliged to buy (with world<br />
market prices) a good deal of the foreign partners share from crude oil produced from the<br />
different wells to meet increasing local consumption.<br />
Liquefied Natural Gas (LNG) exports for the year 2005 reached 251 bcf. The importing<br />
countries were Spain (125 bcf), USA (73 bcf), France (37 bcf), South Korea (10 bcf), and<br />
Japan (6 bcf).<br />
The following table (I.1) gives the ratio of oil products imports (from outside Egypt)<br />
expenditure to the revenue from exports of oil (crude and products including share of foreign<br />
partners) for the period 1998 to 2005. During this period, this value has an average of about<br />
35% with a maximum value of 57% for the year 2000 and a minimum value of about 20% for<br />
the year 2003 and then climbed to 35% by 2005. This means that cost of oil products imports<br />
is consuming about one third of the revenues of oil sector exports. From another side, oil<br />
products imports share in merchandise imports increased from 3% in 1990 to 8% in 2004<br />
reflecting a continuous increasing trend. One has to notice that these imports are from<br />
outside the country and do not include in land purchases from the share of the foreign<br />
partners and also oil products from private companies at world prices paid in local currency.<br />
Table 1 Ratio of oil sector imports to oil sector exports money wise<br />
Item 1998 1999 2000 2001 2002 2003 2004 2005<br />
Oil sector exports BLE 3.11 4.339 6.67 6.22 6.79 15.38 20.01 31.76<br />
Oil products imports BLE 0.926 1.652 3.788 2.577 2.071 3.063 6.398 11.131<br />
Imports/exports % 29.77 38.07 56.79 41.43 30.50 19.92 31.97 35.05<br />
Source: www.idsc.gov.eg<br />
BLE: Billion Egyptian Pounds<br />
Coal<br />
Coal resources are limited in Egypt. It has a low quality and is mainly used as a raw material.<br />
Egypt began mining coal in 1996. Before 1996, production was at zero and thus, Egypt<br />
depended totally on importing coal from various countries including USA and Canada. Coal<br />
produced in Egypt is ranging from .025 to 0.6 mtoe a year and mainly for exports. However,<br />
coal is being imported now as feedstock for the steel industry and ranges from 1 to 1.2 mtoe<br />
a year.<br />
Electricity<br />
The electric network interconnection with Libya started functioning since May 1998 and with<br />
Jordan since October 1998. The interconnection with Syria through Jordan has been<br />
operational since March 2000. As shown in table (I.3), except for the two years 1998 and<br />
1999, Egypt is a net exporter of electricity to its neighbors (Libya, Jordan and Syria).<br />
Table 2 Electricity exports and imports to neighboring countries<br />
Item 1998 1999 2000 2001 2002 2003 2004 2005 2006<br />
Exports GWh 53.8 140.8 196.9 461.6 489.4 1175.6 1004.4 900.4 747.8<br />
mtoe 0.012 0.031 0.043 0.101 0.107 0.256 0.219 0.196 0.163<br />
Imports GWh 66.4 157.6 159.8 217.4 210.4 136.9 148.7 167.4 192.6<br />
mtoe 0.014 0.034 0.035 0.047 0.046 0.030 0.032 0.036 0.042<br />
Net Export mtoe (0.003) (0.004) 0.008 0.053 0.061 0.226 0.187 0.160 0.121<br />
Source: Egyptian Electricity Transmission Company (EETC)<br />
The share of electricity exports as a part of commodity exports is recent and very modest. It<br />
has reached a peak of about 1% during the year 2002/03 and then starts to decline reaching<br />
0.45% by the year 2004/05. This declining trend is mainly due to the reduction in the<br />
electricity exports to Jordan compared to previous years, as Jordan started to receive the<br />
Egyptian NG through the pipeline "Arish-Aqaba" which fueled its own power generating<br />
facilities. Future plans to expand the network interconnection to Lebanon, Iraq and Turkey<br />
are expected to increase electricity exports. Total value of net electricity exports during<br />
2005/2006 is estimated to reach US Dollars 57.5 million.
Number of jobs in the energy sector<br />
EGYPT - National study<br />
In general, the energy sector of Egypt should be considered one of the major economic<br />
development pillars in the Egyptian economy mainly due to its high investment share and<br />
revenues generation, and not particularly because of employment generation, as energy is a<br />
capital intensive industry rather than a labor intensive one.<br />
The total share of employees in the energy sector grew from 1.17% in 1991/1992 to 1.36% in<br />
2004/2005. In 2004/05 the total number of jobs in Egypt was 19.22 millions out of which the<br />
energy sector participated by 261 thousand jobs.<br />
Relative importance of the energy sector within the state budget<br />
The oil sector surplus income represented a significant contribution to the total revenues of<br />
the state budget. However, this surplus has gradually declined from 9% in 1991/92 to 3% in<br />
2003/04. This continuous decline is due to the decreasing balance between revenues from<br />
crude and products exports verses expenditures of the oil sector including purchase of crude<br />
oil and gas from foreign partners, purchase of oil products from private companies in Egypt<br />
with world prices, and also imports of oil products from outside the country.<br />
Natural gas exports to Jordan and Syria that mainly started during 2004 and LNG exports to<br />
Europe that took place in 2005 have driven this ratio up again to reach 5.43% during the<br />
fiscal year 2004/2005.<br />
Share of energy sector investments in total investments in Egypt<br />
Egypt is increasingly reliant on private and foreign capital to finance the energy sector<br />
expansion necessary to support the country‟s demographic and economic development.<br />
From one hand, the ratio of the total investments in Egypt compared to the GDP was<br />
declining. This ratio reached 31% during the year 96/97 and then decreased to 17.53% by<br />
the year 2002/2003. The declining trend of the ratio of investments to GDP has stopped, and<br />
then reversed to climb up word reaching 23.1% for the year 2004/2005.<br />
From another hand, the contribution of the energy sector to total investment was 20% in<br />
1991/1992 and 17% in 95/96 and then down to its minimum which is less than 10% by the<br />
year 1999/2000.<br />
After this period of decline, investments share in the energy sector started to climb up again<br />
from 12% in 2000/2001 up to 20.76% by the year 20004/05. This jump in investments ratio is<br />
driven by the high escalated investments in the natural gas exploration and liquefaction<br />
activities in the recent years. The Egyptian government intends to continue expanding<br />
investments in the natural gas activities as it could be seen from the investment plan for the<br />
year 2006/07.<br />
The amount of targeted investments of petroleum, gas and petroleum products in 2006/07<br />
reached about US$ 2.9 billion representing about 12.3% of total investments where US$ 0.65<br />
billion for crude oil, US$ 1.78 billion for natural gases and US$ 0.47 billion for petroleum<br />
products.<br />
Energy sector infrastructures<br />
NG Infrastructure<br />
The natural gas network extended from 2200 km in the year 1991/92 to reach 4200 km by<br />
the year 2004/05. The gas network capacity is also increasing with a high pace; it has been<br />
tripled since 1997 to 2002 from 37 to 110 MCMD (million cubic meter day).<br />
A 36 inches pipeline has been established Between Egypt and Jordan (Arish - Taba – Aqaba<br />
– Rehab) with a total length of 620 km having a capacity of 10 BCMY (billion cubic meters<br />
per year). The first phase reaching Aqaba is operational since 2003 and the second phase<br />
from Aqaba to Rehab since January 2005.<br />
Egypt also has two liquefied natural gas (LNG) export terminals on the <strong>Mediterranean</strong>:<br />
243
244<br />
ENERGY AND SUSTAINABLE DEVELOPMENT IN THE MEDITERRANEAN<br />
SEGAS LNG complex in Damietta of an ability to export 7.5 billion of cubic meters<br />
annually that came on-stream during the last quarter of 2004. This complex enables the<br />
export of LNG to the Spanish market via one of the largest-capacity single train facilities<br />
in the world.<br />
Edkos' Gas liquefaction compound project, including two units for gas liquefaction with<br />
production capacity of 10 billion cubic meters annually which has been already<br />
operational since 2005.<br />
An “Egyptian Joint Stock Company”The United Company for Natural Gas Derivatives" was<br />
established in Port Said on the <strong>Mediterranean</strong> coast and started exports since 2004. The<br />
annual production rate of the factory reached about 280,000 tons of propane, 330,000 tons<br />
of butane gas and a million barrels of condensates.<br />
Oil refining infrastructure<br />
Beside a crude transmission networks reaching 4600 km, Egypt owns nine refineries that are<br />
able to process 726,250 bl/d of crude (37 mtoe per year), with the largest refinery being the<br />
146,300 bl/d El-Nasr refinery at Suez. The newest 100,000 bl/d MIDOR (Middle East Oil<br />
Refinery) in Alexandria commenced operation in April 2001. While it had originally been<br />
planned as a primarily export-oriented project, most of its products are now sold locally.<br />
The government has plans to increase production of lighter products and higher octane<br />
gasoline by expanding and upgrading existing facilities.<br />
Expansion plans include the construction of a 40,000 bl/d hydro-cracker at El Nasr Petroleum<br />
Refining Company in Suez. In addition, Egypt‟s Ministry of Petroleum plans to build five new<br />
refineries valued at U.S $ 2.5 billion.<br />
SUMED crude oil pipeline<br />
Egypt has strategic importance because of its operation of The Sumed pipeline as an<br />
alternative to the Suez Canal for transporting oil from the Persian Gulf region to the<br />
<strong>Mediterranean</strong>. The 200-mile pipeline runs from Ain Sukhna on the Gulf of Suez to Sidi Kerir<br />
on the <strong>Mediterranean</strong>. The SUMED's original capacity was 1.6 million bl/d, but with<br />
completion of additional pumping stations, capacity has increased to 3.1 million bl/d. The<br />
pipeline is owned by the Arab Petroleum Pipeline Company (APP), a joint venture between<br />
Egypt (50 percent), Saudi Arabia (15 percent), Kuwait (15 percent), the U.A.E. (15 percent),<br />
and Qatar (5 percent). The APP also has been increasing storage capacity at the Ain Sukhna<br />
and Sidi Kerir terminals.<br />
Electricity infrastructure<br />
The electricity sector infrastructure is continuously expanding in terms of generating power<br />
plants and transmission and distribution system. Figure (I.3) shows Egypt's unified power<br />
network with its backbone ring having 220 KV transmission lines and transformers substations.<br />
The Hydropower plants in Aswan are linked to the unified power system through<br />
500 KV transmission line. Major load centers all over the country are served through<br />
transmission lines and cables having other voltage levels ranging from 132 to 11 KV.<br />
The developments in the electricity sector infrastructure during the last twenty years can be<br />
presented as follows:<br />
On the year 1984/85 the total installed capacity in Egypt was 8308 MW, with 22 main<br />
power stations (having capacities between 90 and 2100 MW). These figures reached<br />
12978 MW and 28 power stations consequently for the year 1994/95 with a further<br />
increase to 18544 MW and 38 power stations consequently for the year 20004/05.<br />
Within the same period lengths of transmission lines have increased in a similar pattern.<br />
On the year 1984/85 lengths of transmission lines at different levels were 1576 km for<br />
500 KV, 3638 km for 220 KV, 2224 km for 132 KV, and finally 3838 km for 66 KV. By the<br />
year 1994/95 these lengths increased to 1736 km, 7279 km, 2536 km, and 7942 km<br />
consequently, then for the year 2004/05 the lengths of the transmission lines have<br />
become 2262 km, 13920 km, 2467 km, and 16248 km respectively.
EGYPT - National study<br />
Figure 2 Egypt map with a representation of the unified power system<br />
1.2.2 National Energy Resources and Potential Savings<br />
Oil reserves<br />
In January 2006, Egypt‟s estimated reserves of crude oil and condensate are valued at 3.7<br />
billon barrels, or 0.3 percent of world reserves.<br />
Natural Gas reserves<br />
Due to major recent discoveries, natural gas is likely to be the primary growth engine of<br />
Egypt's energy sector for the foreseeable future. Egypt‟s confirmed natural gas reserves on<br />
January 2006 are put at 67 trillion cubic feet, or a little bit more than 1% of world reserves.<br />
Coal reserves<br />
Coal resources are limited in Egypt. Coal reserves are estimated at about 27 million tons. It<br />
is mainly used as a raw material.<br />
Hydropower potential<br />
Most of the available hydropower energy resources in Egypt are mainly located on the River<br />
Nile. They were largely exploited with the construction of the Aswan Reservoir, the High<br />
Dam, and the Esna Barrage Hydropower Station, with installed capacity of 592 MW, 2100<br />
MW, and 91 MW respectively and representing a total installed capacities of 2783 MW.<br />
There are 109 MW hydropower projects at Nagah Hamady and Assiut Barrages under<br />
construction on the main river. Small capacities of another 60 MW in total are also available<br />
at main canals and branches of the river. These capacities which sum up to a grand total of<br />
2952 MW represent most of the available potential.<br />
Potential for Renewable Energy<br />
New and renewable energy resources in Egypt include solar, wind and biomass. These<br />
resources are generally not yet exploited on commercial scale except for wind energy.<br />
245
246<br />
ENERGY AND SUSTAINABLE DEVELOPMENT IN THE MEDITERRANEAN<br />
Solar and wind resources can be summarized as follows:<br />
Solar resources potential:<br />
Egypt lies among the Sun Belt countries with annual global solar insulation ranging from<br />
1750 to 2680 kwh/m2/year from North to South and annual direct normal solar irradiance<br />
ranging from 1970 to 3200 kwh/m2/year also from North to South with relatively steady<br />
daily profile and small variations making it very favourable for utilization. Such conditions<br />
of favourable solar resource utilization are supported by other conditions of sunshine<br />
duration ranging from 9 – 11 hours with few cloudy days over the year.<br />
Wind resources potential:<br />
Wind resource measurements analysis and assessment have shown that the Gulf of<br />
Suez region enjoys considerable wind potential where wind speeds are ranging between<br />
8.5 – 10.8 m/s with average yearly capacity factors ranging from 38% up to 60% or more<br />
than 5000 equivalent hours, making that region among the best world areas for wind<br />
power generation projects. The Gulf of Suez is an arid desert area with no human activity<br />
except some tourist villages and oil fields along the coast. The estimated potential is in<br />
the order of 20000 MW installed capacities of grid-connected wind farms.<br />
Other locations in the Eastern and Western Desert of Egypt as well as Sinai Peninsula<br />
having considerable wind potential, even though less than that of Gulf of Suez, with wind<br />
speeds between 6 – 7.5 m/s, in addition to some locations around the Nile Valley with<br />
speed 7 – 8 m/s. The overall wind potential in such areas could reach 60000 MW<br />
installed capacity.<br />
Annex I gives more details on RE potential in Egypt.<br />
Potential for Energy Saving<br />
Few previous studies have discussed and estimated a total economic potential of energy<br />
savings from RUE in the Egyptian supply and demand sides of the energy chain ranging<br />
from 20% to 40% of the annual oil and gas primary energy consumption which if compared to<br />
the energy consumption of 2004/05 would build an annual savings of 11 mtoe to 22 mtoe,<br />
provided that an aggressive energy saving strategy could be applied. Although, those studies<br />
are old ones since the 1980s and 90s and having only generic estimates based on the state<br />
of technology at those periods for energy conversion, transmission/distribution, and end use;<br />
they give a strong indication for the high potential of energy saving opportunities in the<br />
country.<br />
In the same time, from one hand, the primary energy supply matrix in Egypt has substantially<br />
changed as natural gas consumption is replacing oil products in industrial, residential, and<br />
commercial sectors as well as for electricity generation. The ratio of natural gas consumption<br />
to the total sum of oil products and gas consumption has dramatically increased from 12% in<br />
1981/82 to reach 47% by 2004/05.<br />
From another hand, energy efficiency measures and related applications, equipment, and<br />
techniques have become well developed and commercially available which would broaden<br />
the opportunities and the potential for savings. This new situation entails the necessity of<br />
updating available information.<br />
As there is no specific organization responsible for setting and/or implementing energy<br />
saving plans and objectives in Egypt, contrary to the case of RE, Egypt does not have a<br />
declared "official" target for energy savings from RUE. In addition to that, a well elaborated<br />
and documented study for updated energy saving potentials is needed to create a realistic<br />
strategy having quantifiable goals and targets.<br />
A compilation of available information related to energy saving potentials at the major sectors<br />
of end-use is presented in the following table (I.4).
EGYPT - National study<br />
Table 3 Summary of energy saving potential in different end-use sectors<br />
Energy Source Industrial Sector Commercial Sector Residential Sector Transportation Sector<br />
(%)<br />
(%)<br />
(%)<br />
(%)<br />
Electricity 10 - 40 5 - 15 5 - 15 NA<br />
Oil products and NG 10 - 30 NA NA 5 - 10<br />
Combined Heat and<br />
Power<br />
10 - 30 5 - 10 NA NA<br />
1.2.3 Institutional Specificit ies and Energy Policies<br />
One of the institutional specificities in Egypt is that energy affairs are managed by two<br />
independent ministries. One for oil and gas issues named “Ministry of Petroleum” (MOP),<br />
and the other one for electricity issues named “Ministry of Electricity and Energy” (MOEE).<br />
The Cabinet of Ministers is the main venue of coordination for energy strategies and policies.<br />
It operates through specific Ministerial committees and is responsible for pricing the<br />
petroleum products in the local market and setting electricity tariffs at different voltage levels<br />
for end-users.<br />
Oil sector institutional specificities<br />
The first independent Ministry of Petroleum (MOP) was established in 1972 due to the<br />
increasing relative importance of petroleum sector for Egyptian economy. The ministry<br />
contributed effectively in developing the Egyptian petroleum resources. Furthermore, in order<br />
to provide developed and flexible mechanisms, the petroleum sector was restructured in the<br />
advent of the new natural gas escalating discoveries. The petroleum sector includes under<br />
the umbrella of the MOP other specialized bodies represented in the Egyptian General<br />
Petroleum Corporation (EGPC), Egyptian Natural Gases Holding Company (EGAS),<br />
Egyptian Petrochemicals Holding Company (ECHEM) and South Valley Petroleum Holding<br />
Company (GANOPE).<br />
EGPC is responsible for exploration, production, refining, transportation and marketing of<br />
oil in Egypt. EGPC performs its mandate through several public sector affiliated<br />
companies along with various Egyptian and foreign joint venture companies and purely<br />
privately owned companies.<br />
EGAS is a new state-owned entity formed in August 2001 to manage the natural gas<br />
sector, separating those assets out from EGPC. EGAS mandate is to promote investment<br />
in natural gas activities, participate in LNG facilities, gas transmission networks, and the<br />
natural gas processing projects as well as to explore and produce gas for the local market<br />
and for exports.<br />
Oil sector strategy and policies<br />
The announced main strategic goals of the MOP can be summarized as follows:<br />
Develop Egypt's oil and gas reserves;<br />
Satisfy local demand of petroleum products and gas;<br />
Contribute to economic growth;<br />
Adopt new technologies, and<br />
Maintain environment protection.<br />
The sector‟s policies objectives include but are not limited to:<br />
Increasing exploration activities to enlarge proven reserves, and enhance production<br />
rates.<br />
Comprehensive development of Egypt's refining industry to cover the shortage in some oil<br />
products, and reduce operational costs to international standards.<br />
Maximizing value-added from natural gas by utilizing it in petrochemical and fertilizers<br />
industries, and gas to liquids (GTL) projects.<br />
Optimizing exports mix, including natural gas.<br />
Encouraging the use of cleaner fuels like natural gas in different sectors.<br />
247
Oil market Profile<br />
248<br />
ENERGY AND SUSTAINABLE DEVELOPMENT IN THE MEDITERRANEAN<br />
The oil and gas market in Egypt is managed by the MOP under which the EGPC functions as<br />
a government agency involved in all aspects of the industry. EGPC plays an important role in<br />
the regulation of the industry and has the sole right to import and export crude oil and other<br />
petroleum products. EGPC has a stake in all joint ventures as well as investment companies<br />
operating in the sector. Fuel prices at the local market are set by the cabinet in coordination<br />
with MOP.<br />
Electricity sector institutional specificities<br />
The power sector in Egypt represented mainly by Ministry of Electricity and Energy (MOEE)<br />
is operated by seven executing authorities, namely Egyptian Electricity Holding Company<br />
(EEHC), Rural Electrification Authority (REA), Hydro Power <strong>Plan</strong>ts Authority (HPPA), Atomic<br />
Energy Authority (AEA), Nuclear Power <strong>Plan</strong>ts Authority (NPPA), Nuclear Materials Authority<br />
(NMA) and New and Renewable Energy Authority (NREA). The power sector structure has<br />
undergone a major transitional stage in which the government – owned electricity sector has<br />
been transformed into a more liberal form.<br />
EEHC was established by law in 2000 as a joint stock company that, up to now, is fully<br />
owned by the state. EEHC replaced the previous state – owned, vertically integrated power<br />
utility; the Egyptian Electricity Authority (EEA). Besides its responsibility for the planning of<br />
the whole electricity sector, EEHC along with its affiliate companies is responsible for<br />
generation, transmission and distribution as follows:<br />
The Egyptian Electricity Transmission Company (EETC), solely responsible for ultra high<br />
and high voltage (UHV & HV) transmission system. EETC controls and manages the<br />
Egyptian power system through the national dispatching center as well as the regional<br />
control centers. EETC also performs electricity sales at extra high and high voltages and<br />
manages export – import of electricity through network interconnections with neighboring<br />
countries.<br />
Five generation companies, four responsible for thermal power generation plants and one<br />
for hydro power plants.<br />
Eight Regional Distribution Companies responsible for medium and low voltage<br />
distribution and corresponding electricity sales for different end-users.<br />
Electricity sector strategy and policies<br />
The main strategic goals of the electricity sector are supplying electricity according to<br />
international standards, and meeting demand in all consuming sectors, with due<br />
consideration for environmental concerns.<br />
The sector‟s policies' objectives include but are not limited to:<br />
Maximizing the utilization of hydropower resources through electrification of suitable<br />
barrages on the Nile River and its branches.<br />
Maximizing the use of natural gas in thermal power plants.<br />
Promotion of new and renewable energy to increase its share in the power generation<br />
mix.<br />
Interconnecting the Egyptian electricity grid with neighboring countries both east and west.<br />
Improving efficiency of energy generation, transmission, distribution, and use.<br />
Adopting measures to enhance environmental protection.<br />
Egypt has permitted private sector investors to share in large electricity generation power<br />
plants, where three BOOT (Build, Own, Operate, and Transfer) power plants were built until<br />
2003. Private investments in small power plants are also practiced in the country.<br />
The Electric Utilities and Consumer Protection Regulatory Agency was established by<br />
Presidential Decree No. 339/2000 under the supervision of the Minister of electricity and<br />
energy. The Agency mandate is to regulate and revise all techno-economic feasibility of all<br />
electricity generation, transmission, distribution and consuming aspects. Its mandate also
EGYPT - National study<br />
includes ensuring availability of supply to different end-users at fair prices. The role of the<br />
agency is still limited.<br />
Electricity market profile<br />
The present electricity market in Egypt is composed of two submarkets:<br />
1) The unified power system of Egypt in which EETC acts as a single buyer of bulk power,<br />
purchasing electricity from the generating companies through Power Purchase<br />
Agreements (PPAs) and selling it to the distribution companies and UHV and HV<br />
customers. The vision of the Egyptian Regulatory Agency is to gradually transform the<br />
market structure from a single buyer – based structure to a free market based on<br />
bilateral contracts or similar. In addition to the generation companies owned by EEHC,<br />
the power sector includes few Independent Power Producers (IPPs) selling electricity to<br />
EETC through long term PPAs. They are mainly NREA‟s wind power plants and three<br />
private thermal power plants under BOOT financing schemes.<br />
2) Isolated limited sub-market comprising mostly tourist villages and resorts at the Red Sea<br />
and the Sinai Peninsula that are mainly served by IPPs.<br />
1.3 Energy S u pply, Dema n d and Produc ti o n: Evo luti o n and<br />
S tr uc t ure<br />
1.3.1 Electricity Access<br />
Rural electrification has been a major government initiative in the last 35 years. The Rural<br />
Electrification Authority (REA) was established in 1971 with a mandate to electrify all rural<br />
areas across Egypt. Its progress in the residential sector can be seen in Table (I.5), which<br />
shows that most of the effort was done between 1975 and 1995 to decrease the share of<br />
rural population without electricity from 45% to only 5%. This ratio has further decreased to<br />
reach to 2.2% by 2005 and is expected to go down to 1.2% by the year 2015.<br />
This high rate of access to electricity enabled the Egyptian government for expanding its<br />
efforts to support new land reclamation projects that have already increased new reclaimed<br />
areas' agricultural productivity, provided new job opportunities, maximized the output of agroindustrial<br />
projects, and stemmed migration to large cities. Egypt is highly exceeding the<br />
objective of the MSSD to cut by half the percentage of the population without access to<br />
electricity by 2015 compared to that of the year 1990.<br />
Table 4 Percentage share of total, urban, and rural population without access to electricity<br />
Item 1975 1980 1985 1990 1995 2000 2005 2010 2015<br />
ENE_C10 Share of<br />
total population<br />
(%) 33 24.4 13.5 7.3 3.8 2.8 1.7 1.2 0.9<br />
Share of urban<br />
Population<br />
(%) 17 10.5 7.5 3.8 2.2 1.6 0.9 0.8 0.64<br />
Share of rural<br />
Population<br />
(%) 45 35 18 10 5 3.7 2.3 1.5 1.1<br />
Note: Average ratio of rural population= 57% of total population<br />
1.3.2 Evolution and Structure of the Energy Demand<br />
Evolution of primary energy demand<br />
Oil and gas demand<br />
Table (I.6) shows the evolution of primary energy demand since 1981/82 till 2004/05 that has<br />
annually increased by 4.64% in average. During the last 25 years natural gas demand has<br />
grown rapidly by an average growth rate of 13% compared to other sources, mainly driven by<br />
increased demand from thermal power plants. Demand for oil has grown in average by<br />
3.34% annually and started to rise after being relatively flat since 1997/98 till 2003/04. The<br />
rise for the year 2004/05 was mainly due to the decrease in the supply of NG for power<br />
stations. Other resources from hydropower and coal have a modest growth rate which<br />
means that they are more or less flat. However, RE is being considered only from wind as<br />
solar water heaters output is not well documented. If we consider the last 15 years from<br />
249
250<br />
ENERGY AND SUSTAINABLE DEVELOPMENT IN THE MEDITERRANEAN<br />
1991/92 to 2004/05 the total primary energy demand annual growth rate becomes 4.5% but<br />
the oil demand increase by a rate of 2.7% during the same period.<br />
Hydroelectricity after being 13.2% of total primary energy demand in 1981/82 is now<br />
contributing a meager share of no more than 4.7%. Consequently the share of oil and gas<br />
increased from 82.1% to 93.5% with a decline of oil share from 72% to only 50% of total<br />
demand and an enhancement of the share of NG from 10.2% to 43.4 by the year 2004/05.<br />
Energy source 81/8<br />
2<br />
Table 5 Evolution of primary energy demand by source of energy (mtoe)<br />
91/9<br />
2<br />
95/9<br />
6<br />
96/9<br />
7<br />
97/9<br />
8<br />
98/9<br />
9<br />
Oil++ 13.6 19.7 21.1 21.8 24.5 25.1 24.5 23.2 22.9 23.5 22.2 29.4<br />
5 9<br />
3 9 2 3 9<br />
% of total 71.9 64.9 58.8 59.3 61.2 59.4 55.6 49.8 47.5 46.5 43.1 50.1<br />
6 7 4 4 7 8 4 6 8 0 6 1<br />
NG 1.93 7.07 11.2 11.4 11.6 12.8 15.7 19.7 21.0 23.3 25.3 25.5 13<br />
7 8<br />
7 6 2 9 2<br />
% of total 10.1 23.2 31.2 31.2 29.2 30.3 35.6 42.4 43.5 46.1 49.3 43.3<br />
7 1 3 2 1 3 5 3 9 1 0 7<br />
Hydro-power 2.5 2.65 2.55 2.63 2.68 3.37 3.24 3 3.28 2.82 2.86 2.78 0.4<br />
% of total 13.1<br />
8 8.70 7.11 7.16 6.70 7.99 7.36 6.44 6.79 5.58 5.55 4.72<br />
RE 0 0 0 0 0 0 0.00 0.03 0.04 0.04 0.08 0.11<br />
5 1 9 5 2 7<br />
% of total 0.0 0.0 0.0 0.0 0.0 0.0 0.0 0.0 0.1 0.0 0.1 0.2<br />
0 0 0 0 0 0 1 7 0 9 6 0<br />
Coal 0.89 0.95 1.01 0.84 1.13 0.93 0.59 0.56 0.94 0.87 0.94 0.94 0.2<br />
% of total 4.69 3.12 2.82 2.29 2.83 2.20 1.34 1.20 1.95 1.72 1.83 1.60<br />
Total<br />
18.9 30.4 35.8 36.7 39.9 42.2 44.0 46.5 48.3 50.5 51.5 58.8 4.64<br />
7 6 6 4 9 0 4 9 2 8 0 5<br />
G. R.: Growth Rate; Oil++: crude oil + condensate + LPG; RE includes wind energy resource only<br />
Source: Organization for energy planning, reports for different years.<br />
Table 6 presents the evolution of final energy consumption among the different sectors<br />
during the last 10 years from 1995/6 till 2004/05. During this period, the final energy<br />
consumption increased from 25.64 mtoe to 38.65 mtoe by an annual average growth rate of<br />
4.2% compared to 5.1% for primary energy consumption during the same period.<br />
Concerning the analysis of sectors shares during the same period, one can see that the<br />
transport sector which represents almost a flat share of about 30% of the total consumption<br />
has a high annual growth at 5.1%. However, the industry share in final energy consumption<br />
decreased from 50% to 40.7% while its absolute consumption in mtoe has increased by only<br />
2.1% (half of the annual G.R. of final energy). The residential and commercial sector share<br />
has increased from 17.82% to 22.02% with an average annual growth of 6.5%. Although<br />
government buildings and utilities (mainly water, drainage, and street lighting) are having the<br />
highest annual growth rate of 7.9%, they have a modest share in final energy consumption<br />
together with agriculture minor share.<br />
For the most probable scenario of GDP annual growth rate of 5%, the demand for oil<br />
products and natural gas by the year 2021/22 is estimated to be 117 mtoe (40 mtoe from<br />
crude oil, and 77 mtoe from NG) compared to 55 mtoe (29.5 from oil and 25.5 from NG) for<br />
the year 2004/05 having a total average annual growth rate of 4.5%. By the year 2021/22 the<br />
total accumulated demand from 2005/06 is estimated to reach 1361 mtoe (534 from oil and<br />
827 from NG).<br />
99/0<br />
0<br />
00/0<br />
1<br />
01/0<br />
2<br />
02/0<br />
3<br />
Table 6 Evolution of final energy sectoral consumption (mtoe), share and growth rate<br />
Sector 95/96 96/97 97/98 98/99 99/00 00/01 01/02 02/03 03/04 04/05 GR %<br />
Industry 12.83 12.75 13.78 13.7 14.02 14.91 16.14 17.07 17.35 15.74 2.1<br />
% of total 50.04 48.89 48.78 46.38 45.45 45.95 47.70 48.02 46.94 40.72<br />
Transport 7.35 7.58 8.24 9.11 9.65 9.9 9.63 9.94 10.78 12.06 5.1<br />
% of total 28.67 29.06 29.17 30.84 31.28 30.51 28.46 27.96 29.17 31.20<br />
Resd. &<br />
Com.<br />
03/0<br />
4<br />
4.57 4.83 5.2 5.65 6.02 6.23 6.72 7.08 7.28 8.51 6.5<br />
04/0<br />
5<br />
Av.<br />
G.<br />
R.<br />
(%)<br />
3.34
EGYPT - National study<br />
Sector 95/96 96/97 97/98 98/99 99/00 00/01 01/02 02/03 03/04 04/05 GR %<br />
% of total 17.82 18.52 18.41 19.13 19.51 19.20 19.86 19.92 19.70 22.02<br />
Agriculture 0.3 0.31 .0.32 0.32 0.33 0.34 0.35 0.37 0.39 0.45 4.1<br />
% of total 1.17 1.19 1.08 1.08 1.07 1.05 1.03 1.04 1.06 2.82<br />
Gov.<br />
buildings &<br />
utilities<br />
0.59 0.61 0.71 0.71 0.83 1.07 1.0 1.09 1.16 1.26 7.9<br />
% of total 2.30 2.34 2.51 2.40 2.69 3.30 2.96 3.07 3.14 3.26<br />
Total 25.64 26.08 28.25 29.54 30.85 32.45 33.84 35.55 36.96 38.65 4.2<br />
Source: Organization for energy planning, reports for different years.<br />
Evolution of electricity demand<br />
Electricity expansion is another factor causing growth of primary energy consumption. As<br />
mentioned before, the limited share of RE and hydropower puts the whole burden on thermal<br />
power stations mainly using natural gas.<br />
Based on data presented on Table 7 the analysis of the historical electric power consumption<br />
of the different classes of customers during the period 1981/82 to 2005/06 indicates that the<br />
industrial sector consumption share of the total consumption has decreased from 55.4% in<br />
fiscal year 1981/82 to 35.52% in fiscal year 2005/06, also the agricultural sector consumption<br />
share has decreased from 5.1% in fiscal year 1981/82 to 4.03% in fiscal year 2005/06. While<br />
the residential sector consumption share has increased from 22.7% in fiscal year 1981/82 to<br />
36.8% in fiscal year 2005/06. For other consumption sectors (commercial, government,<br />
public utilities, sales for resellers, street lighting) their consumption share has increased from<br />
16.8% in fiscal year 1981/82 to 23.7% in fiscal year 2005/06.<br />
Table 8 also shows the forecast for peak load, electricity generation, sales, and sectors<br />
demand for the period 2006/07 to 2021/22. The estimated Peak load, the total generation,<br />
and the total sales for the year 2021/22 will reach 4302 MW, 273.1 TWh, and 241.8 TWh<br />
respectively, compared to 17300 MW, 108.4 TWh, and 92.9 TWh respectively for the year<br />
205/06.<br />
251
252<br />
Fiscal<br />
Year<br />
ENERGY AND SUSTAINABLE DEVELOPMENT IN THE MEDITERRANEAN<br />
Table 7 Historical electricity peak load (MW), generation, sales and consumption by sector (GWh)<br />
Av.<br />
Annual<br />
G. R.<br />
Fiscal<br />
Year<br />
Av.<br />
Annual<br />
G. R.<br />
Fiscal<br />
Year<br />
Av.<br />
Annual<br />
G. R.<br />
Fiscal<br />
Year<br />
Av.<br />
Annual<br />
G. R.<br />
Fiscal<br />
Year<br />
Av.<br />
Annual<br />
G. R.<br />
Fiscal<br />
Year<br />
2005/06<br />
Sales by Sector<br />
(GWh)<br />
1981/82 1982-87 1986/87 1987-92 1991/92 1992-97 1996/97 1997-02 2001/02 1982-06<br />
PEAK LOAD (MW)<br />
TOTAL<br />
3694 9.45% 5803 4.45% 7215 5.06% 9235 7.61% 13326 6.64% 17300<br />
GENERATION 21895 9.96% 35202 5.26% 45481 4.87% 57675 7.62% 83259 6.89% 108357<br />
TOTAL SALES 17332 10.44% 28471 5.75% 37648 5.47% 49137 7.08% 69166 7.25% 92055<br />
TOTAL INDUSTRY 9603 7.63% 13872 4.33% 17145 4.23% 21092 3.79% 25402 5.24% 32701<br />
AGRICULTURE 882 5.41% 1148 2.96% 1328 7.87% 1940 7.10% 2733 6.18% 3719<br />
RESIDENTIAL 3938 16.99% 8630 7.60% 12444 6.57% 17108 8.46% 25673 9.37% 33900<br />
OTHERS 2909 10.63% 4821 6.90% 6730 5.98% 8997 11.29% 15358 8.78% 21735<br />
Sector‟s consumption share to total sales (%)<br />
TOTAL INDUSTRY 55.4 48.7 45.5 42.9 36.7 35.5<br />
AGRICULTURE 5.1 4.0 3.5 3.9 4.0 4.0<br />
RESIDENTIAL 22.7 30.3 33.1 34.8 37.1 36.8<br />
OTHERS 16.8 16.9 17.9 18.3 22.2 23.7<br />
Source: Egyptian Electricity Holding Company (EEHC)<br />
Table 8 Forecasted sales by sector in (GWh), total electricity generation (GWh), and peak load (MW) until 2021/22<br />
Sectors (GWh) 06/2007 07/2008 08/2009 09/2010 10/2011 11/2012 12/2013 13/2014 14/2015 15/2016 16/2017 17/2018 18/2019 19/2020 20/2021 21/2022<br />
Total Industry 34596 36916 39368 41954 44552 47295 50185 53218 56394 59713 63194 66816 70578 74484 78529 82711<br />
Agriculture 4040 4326 4624 4933 5249 5576 5916 6267 6631 7007 7394 7793 8204 8627 9063 9510<br />
Public utilities+<br />
lighting<br />
11403 12246 13124 14034 14936 15869 16835 17831 18858 19913 20977 22069 23187 24325 25488 26674<br />
Commercial &<br />
6542 7152 7792 8462 9095 9759 10452 11175 11929 12715 13527 14371 15247 16154 17094 18066<br />
Others<br />
Residential 36080 38341 40751 43314 46628 50068 53633 57315 61111 65014 69001 73084 77258 81509 85837 90234<br />
Government 5396 5763 6150 6557 7043 7548 8074 8621 9189 9779 10390 11024 11682 12364 13071 13803<br />
Total 98057 104745 111809 119254 127503 136116 145094 154428 164112 174141 184483 195158 206156 217464 229082 240998<br />
Net sales for<br />
interconnection<br />
775 775 775 775 775 775 775 775 775 775 775 775 775 775 775 775<br />
Total energy<br />
98832 105520 112584 120029 128278 136891 145869 155203 164887 174916 185258 195933 206931 218239 229857 241773<br />
sales<br />
Total<br />
generated<br />
energy<br />
115581 123065 131214 139591 148538 157750 167496 177539 188087 198960 210317 222018 234189 246720 259708 273068<br />
Peak load<br />
(MW)<br />
18430 19640 20920 22250 23650 25110 26640 28220 29860 31560 33320 35140 37020 38960 40960 43020<br />
Source: Egyptian Electricity Holding Company (EEHC)
EGYPT - National study<br />
1.3.3 Evolution and Structure of the Energy Production<br />
Evolution of primary energy production<br />
Table 9 shows the evolution of primary energy production during the last 25 years from<br />
1981/82 to 2004/05. Total production increased from 36.99 mtoe to 64.98 mtoe with an<br />
average annual growth rate of 2.26%. Oil production only increased by a very small average<br />
annual growth rate of 0.13%, while natural gas increased by a high growth rate of 11.4%.<br />
These figures are less than the same annual growth rates of primary energy consumption<br />
table (1.5) which are 4.64%, 3.34%, and 13% for total primary energy consumption, oil<br />
consumption, and NG consumption consequently. Furthermore, the share of crude oil in total<br />
primary energy production decreased from 88.02% to 51.85% and that for NG increased<br />
from 5.22% to 43.65%.<br />
This structure of primary energy production will completely change if one would make the<br />
previous analysis for the last 15 years from 1991/92 to 2004/05. The most important<br />
parameter during this period is the declining trend of crude oil production with an average<br />
annual rate of 2%, while the total primary energy production has increased by an average<br />
annual rate of 1.1%. If these figures are compared to primary energy demand during the<br />
same period crude oil demand has increased by 2.7% and total primary energy demand has<br />
increased by 4.5%. This particular situation of declining oil production compared to the<br />
growing demand for oil products will be discussed later in item 1.3 of this report.<br />
Energy<br />
source<br />
Table 9 Evolution of primary energy production by source of energy (mtoe)<br />
81/82 91/92 95/96 96/97 97/98 98/99 99/00 00/01 01/02 02/03 03/04 04/05 Av.<br />
G. R.<br />
(%)<br />
Oil++ 32.56 45.43 46.27 44.36 43.05 42.29 40.24 37.07 36.36 35.79 35.31 33.69 0.13<br />
% of<br />
total 88.02 82.24 76.93 75.76 74.77 71.79 67.40 61.24 55.21 57.38 54.73 51.85<br />
NG 1.93 7.16 11.30 11.50 11.78 13.19 16.19 20.39 26.15 23.69 26.24 28.36 11.4<br />
% of<br />
total 5.22 12.96 18.78 19.64 20.46 22.39 27.12 33.69 39.70 37.99 40.67 43.65<br />
Hydro- 2.50 2.65<br />
0.4<br />
power<br />
% of<br />
2.55 2.63 2.68 3.37 3.24 3.00 3.28 2.82 2.86 2.78<br />
total 6.76 4.80 4.25 4.49 4.66 5.71 5.43 4.95 4.98 4.52 4.44 4.28<br />
RE<br />
% of<br />
0.00 0.00 0.00 0.00 0.00 0.00 0.01 0.03 0.05 0.05 0.08 0.12 NA<br />
total 0.00 0.00 0.00 0.00 0.00 0.00 0.01 0.05 0.07 0.07 0.13 0.18<br />
Coal 0.00 0.00 0.02 0.06 0.07 0.07 0.03 0.04 0.03 0.03 0.03 0.03 NA<br />
% of<br />
0.00<br />
total 0.00<br />
0.04 0.11 0.12 0.11 0.04 0.06 0.04 0.04 0.04 0.04<br />
Total 36.99 55.24 60.14 58.56 57.58 58.91 59.70 60.53 65.86 62.38 64.52 64.98 2.26<br />
G. R.: Growth Rate; Oil++: crude oil + condensate + LPG; RE includes wind energy resource only<br />
Source: Organization for energy planning, reports for different years.<br />
RE has only a modest share in primary energy production of 0.18% in the year 2004/05.<br />
Wind energy electricity production is the sole measurable and/or documented output of<br />
renewable energy resources that could be taken into consideration. The other important<br />
resource is solar water heaters energy production which is neither monitored nor well<br />
documented.<br />
Two reviewed available studies have elaborated the trends and the forecast for primary<br />
energy production, particularly crude oil and natural gas. In fact, this is a delicate and<br />
complicated issue depending on accuracy of historical data and relevance of future scenarios<br />
assumptions. The results are quite indicative concerning the growth (or decline) rates of<br />
proven reserves and related possible production capacities.<br />
The following forecasted reserves and production estimates are based on the work<br />
presented in a study prepared by the Organization for Energy <strong>Plan</strong>ning (OEP) and other<br />
institutions of which we have selected the most probable scenario of GDP annual growth rate<br />
of 5%. Egypt will consume the crude oil forecasted total production including the share of<br />
foreign partners as per the two following cases:<br />
253
254<br />
ENERGY AND SUSTAINABLE DEVELOPMENT IN THE MEDITERRANEAN<br />
If current proven reserves will increase annually by 5%, and based on 10% reserves<br />
depletion rate, Egypt will start to have a deficit between production and consumption of oil<br />
starting from 2013/14; and in order to satisfy local consumption by 2021/22, Egypt will<br />
need to import about 20 mtoe.<br />
If there is no more addition to proven reserves, and based on 10% reserves depletion<br />
rate, Egypt will start to have a deficit between production and consumption of oil starting<br />
from 2010/11; and in order to satisfy local consumption by 2021/22, Egypt will need to<br />
import about 31 mtoe.<br />
In what concerns natural gas, a lot of debate is currently taking place. The official authorities<br />
are declaring that the total production figures including the share of foreign partner will be<br />
exceeding the local consumption until the year 2021/22.<br />
For RE future production, it is estimated to meet 3% of electricity demand by the year 2010,<br />
which is valued at about 0.95 mtoe. While it should meet 7% of electricity demand by the<br />
year 2021/22 amounting to 2.9 mtoe.<br />
Hydropower and coal has no significant potential increase.<br />
During the period 1981/82- 2004/05 electricity generation has increased by 500% from nearly<br />
22 TWh for the year 1981/82 to 108.4 TWh in the year 2004/05 at an average annual growth<br />
rate of 6.9%. Consequently, oil and gas consumed by the electricity sector has jumped<br />
during the same period from around 3.7 mtoe to nearly 21 mtoe. The planned installed<br />
capacity for the year 2011/12 is 28813 MW and the required fuel (oil and gas) for the<br />
electricity sector is estimated to reach about 29 mtoe by the same year (EEHC).<br />
Table 10 presents the forecast for electricity generation till 2021/22 by which the generated<br />
electric energy is expected to reach 243 TWH and the peak load is estimated to be 43020<br />
MW with a planned installed capacity of 51570 MW.<br />
Table 10 Electricity production structure according to type of generation from 1995/96 to 2004/05 (in<br />
TWh)<br />
Type of<br />
generation<br />
95/96 96/97 97/98 98/99 99/00 00/01 01/02 02/03 03/04 04/05<br />
Thermal 42.91 45.70 50.11 52.70 58.63 64.12 67.65 76.12 81.80 87.83<br />
Percentage of<br />
total (%) 78.78 79.20 80.39 77.50 79.97 82.25 81.51 85.35 85.94 86.99<br />
Hydropower 11.56 12.00 12.22 15.30 14.66 13.70 15.13 12.86 13.02 12.64<br />
Percentage of<br />
total (%) 21.22 20.80 19.61 22.50 20.00 17.57 18.23 14.42 13.68 12.52<br />
Wind 0.00 0.00 0.00 0.00 0.02 0.14 0.22 0.20 0.37 0.52<br />
Percentage of<br />
total (%) 0.00 0.00 0.00 0.00 0.03 0.18 0.27 0.23 0.39 0.52<br />
Total 54.47 57.70 62.34 68.00 73.31 77.96 83.00 89.18 95.18 100.97<br />
Source: the Organization for Energy <strong>Plan</strong>ning (OEP), different annual reports<br />
Table 10 presents the electricity production structure according to type of generation from<br />
1995/96 to 2004/05. During this period the share of thermal electricity generation increased<br />
from 78.78% to 86.99% and that of hydropower decreased from 21.22% to 12.52%, while the<br />
share of the new wind electricity generation facilities reached 0.52% by 2004/2005.<br />
1.4 Impa cts and Risks of th e Observe d and F orecast<br />
E vo l u tions<br />
1.4.1 Energy dependency and Energy Bill, Reduction in Export Capacities<br />
Different resources give different data for Egypt‟s crude oil and oil products exports and<br />
imports. However, there is an agreement between all reviewed reports and studies on the<br />
steep declining in the amounts of oil exports. This is due to mismatch between the current oil<br />
production decreasing rate and the current consumption increasing one, which has a<br />
negative impact on Egypt's oil export capacity. According to, Egypt‟s 1980 oil exports were
EGYPT - National study<br />
17 mtoe, reaching 25 mtoe in 1985 and peaking to 28 mtoe in 1995. Since 1995 net exports<br />
of oil had sharply decreased to reach 5.5 mtoe by the year 2004.<br />
Due to lack of information, the estimated breakeven point, when oil production equals oil<br />
consumption and Egypt will start to be a net importer of oil, is also a matter of disagreement<br />
between different studies. The same is happening for NG.<br />
We present here the results of the same study which has been issued in April 2005 and<br />
developed by the Organization for Energy <strong>Plan</strong>ning (OEP) with other institutions. (OEP) does<br />
not exist any more in 2007. The outcome of this study can be presented as follows:<br />
1) Based on 3.6 billion barrels of oil proven reserves on 2002/03 and with a 5% annual<br />
increase in proven reserves, Egypt will have a deficit starting from 2009/10 between oil<br />
consumption and production (including the share of foreign partner). After buying the<br />
whole share of foreign partner, the country will be obliged to complement the<br />
consumption by net imports from outside the borders. The accumulated oil imports<br />
energy bill is estimated to be between billion US$ 38 to 82 until 2021/22 (according to<br />
different scenarios) based on 35 $/barrel to cover external imports and the purchase of<br />
foreign partner share.<br />
2) Based on 59.5 TCF NG proven reserves on 2002/03 and with an annual increase of 1<br />
TCF in proven reserves, Egypt will have a deficit starting from 2014/15 between NG<br />
consumption and production (including the share of foreign partner). After buying the<br />
whole share of foreign partner, the country will be obliged to complement the<br />
consumption by net imports for outside the borders. To cover external imports and to pay<br />
for the purchase of foreign partner share, the accumulated NG imports energy bill is<br />
estimated to be 41 to 95 billion US$ until 2021/22.<br />
3) According to different electricity generation scenarios, the estimated electric energy<br />
demand is 154 to 422 TWh by the year 2021/22 with an accumulated additional installed<br />
capacity of 16 to 76 GW. The accumulated total investment is estimated at biliion US$ 12<br />
to 57 based on 750 US$/KW including generation, transmission, and distribution. NG<br />
requirement is estimated at 20 to 40 TCF to generate from 81 to 85% of required electric<br />
energy in addition to 3 to 7% of hydroelectricity, 7% from RE, and 5% from nuclear<br />
energy. One has to notice that the forecast scenario of the Egyptian electricity holding<br />
company (EEHC) until 2021/22 which had previously been mentioned in table (1.8) differ<br />
from these figures but lies inside the estimated range.<br />
Due to lack of information, the external energy dependency indicator (ENE_C01) cannot be<br />
accurately evaluated. However, we introduce in the following Table 11 values of this<br />
parameter as a matter of indication and not necessarily as information.<br />
Table 11 Oil and NG exports, imports, and consumption in mtoe and associated dependency indicator<br />
(%) for the period 1996/97 to 2004/05<br />
Exports<br />
Imports<br />
96/97 97/98 98/99 99/00 00/01 01/02 02/03 03/04 04/05 05/06<br />
Crude 6.61 3.95 4.01 6.70 7.39 8.91 7.12 7.95 8.48<br />
Oil<br />
products 5.42 5.44 4.81 4.61 4.09 7.35 7.05 6.93 6.11<br />
NG 0.00 0.67 1.74<br />
Total 12.03 9.38 8.82 11.30 11.48 16.25 14.17 15.55 16.33<br />
Crude 4.08 4.35<br />
Products 1.38 1.96 2.84 3.49 3.82 2.00 2.01 2.20 2.96<br />
Total 1.38 1.96 2.84 3.49 3.82 6.08 6.36 2.20 2.96<br />
Consumption 36.69 39.95 42.19 44.06 46.56 48.27 50.53 51.42 58.52<br />
Dependency<br />
indicator (%) -29.04 -18.59 -14.17 -17.72 -16.44 -21.07 -15.46 -25.96 -22.86<br />
Source: the Organization for Energy <strong>Plan</strong>ning (OEP), different annual reports<br />
1.4.2 Greenhouse Gas Effect<br />
The first GHG inventory of Egypt was developed for the year 1990/91 based on the 1995<br />
IPCC guidelines and default emission factors. The inventory was estimated for the main<br />
three GHGs, namely CO2, CH4 and N2O. CO2 is the main Greenhouse Gas in Egypt. It<br />
255
256<br />
ENERGY AND SUSTAINABLE DEVELOPMENT IN THE MEDITERRANEAN<br />
represents about 72% of the total GHG emissions in 1990/91. The second important<br />
Greenhouse Gas is CH4, which recorded 19% of the total GHG emissions and lastly N2O<br />
with 9%.<br />
In 1990/91, the total net GHG emissions were about 117000 Gg of CO2 equivalent while the<br />
total GHG sinks in the land–use and forestry sector recorded 9900 Gg of CO2 equivalent.<br />
With 92% dependence on fossil fuels, the energy sector is the major source of GHG<br />
emissions, contributing about 71% of the national total. Figure 3 shows the GHG inventory by<br />
sector for the same year.<br />
Figure 3 Percentage share for different sectors in GHG for the year 1990/91<br />
Table 12 presents CO2 emissions from the consumption of fossil fuels for energy purposes in<br />
different sectors. It has increased from 83070 Gg of CO2 for the year 1995/96 to 137110 Gg<br />
of CO2 equivalent by the year 2004/05 with an annual average growth rate of 5.7%. During<br />
the year 2004/05, the contribution of the main sectors in GHG emissions was the electricity<br />
sector share of 35.35% followed by the transport with the share of 26%, the industry with<br />
20.45%, and the residential and commercial sector with 10.42%.<br />
Being the major sector for GHG emissions, the electricity sector contribution to the GHG<br />
emissions has increased from 25830 Gg CO2 in1995/96, to 48470 Gg CO2 by 2004/05 with<br />
an average annual growth rate of 7.5%. Table 12 presents the "ENE_P03" indicator<br />
expressed in Gg of CO2 equivalent total emissions from energy consumption and distribution<br />
on end-use sectors with relative percentage share of each sector.<br />
Table 12 ENE_P03 indicator expressed in Gg of CO2 equivalent total emissions from energy<br />
consumption and distribution on end-use sectors with relative percentage share of each sector<br />
Sector 95/96 96/97 97/98 98/99 99/00 00/01 01/02 02/03 03/04 04/05<br />
Industry 22840 23190 25020 23710 24680 26820 28360 30740 30310 28040<br />
Percentage<br />
share (%) 27.49 27.19 26.72 24.38 24.08 24.38 25.62 25.99 24.60 20.45<br />
Transport 21950 22240 24210 26800 28390 29140 28170 29040 31590 35660<br />
Percentage<br />
share (%) 26.42 26.09 25.84 27.57 27.70 26.50 25.45 24.55 25.63 26.00<br />
Agriculture 360 350 340 330 310 320 280 270 260 2370<br />
Percentage<br />
share (%) 0.43 0.41 0.36 0.33 0.30 0.29 0.25 0.23 0.21 1.73<br />
Resid &<br />
commercial 8440 8840 9420 9940 10370 10990 11250 11610 11470 14290<br />
Percentage<br />
share (%) 10.16 10.37 10.05 10.22 10.12 9.99 10.16 9.82 9.31 10.42<br />
Electricity<br />
sector 25830 26900 30430 31910 33710 35320 35000 38220 42010 48470<br />
Percentage<br />
share (%) 31.09 31.55 32.49 32.82 32.89 32.12 31.63 32.32 34.09 35.35
EGYPT - National study<br />
Petroleum<br />
Percentage<br />
3650 3750 4250 4540 5020 7400 7620 8390 7590 8280<br />
share (%) 4.39 4.40 4.54 4.67 4.90 6.72 6.89 7.09 6.16 6.04<br />
10247 10998 11068<br />
Total 83070 85260 93660 97220 0 0 0<br />
Source: the Organization for Energy <strong>Plan</strong>ning (OEP), different annual reports<br />
11826<br />
0<br />
12322<br />
0<br />
13711<br />
0<br />
Over the next fifty years, total commercial energy consumed in Egypt is projected to continue<br />
to increase. There is however some debate as to the rate of increase in demand. Some<br />
believe that the rate of increase will be high, leading to greater concerns about the<br />
sustainable supply of hydrocarbon-based energy and the impact on the global environment.<br />
Others believe that the rate of increase will generally stabilize or decline, either because of<br />
proactive decisions to be more efficient in use of energy or because we find ourselves in an<br />
energy-constrained situation which forces us to modify our demand for, and use of, energy.<br />
Egypt national strategy study on the clean development mechanism (2003) has estimated a<br />
GHG emissions annual growth rate of 4.9%from energy related activities. This would lead to<br />
a contribution from energy in total GHG emissions in Egypt by 392000 Gg CO2 equivalent by<br />
the year 2021/22.<br />
Egypt has signed and ratified UNFCCC and Kyoto protocol, where both the convention and<br />
the protocol have interred into force in 5/3/1995 and 12/4/2005 respectively. Egypt's official<br />
position on current discussions and future negotiations concerning post 2012 is favorable to<br />
the extension of Kyoto protocol beyond 2012.<br />
1.4.3 Other Impacts on the Environment<br />
The issues of greenhouse gases, global warming, climate change, and <strong>Mediterranean</strong> Sea<br />
pollution are of great concern for Egypt. Global warming and climate change can affect the<br />
low-lying levels of coastal zones, as well as affect agriculture crop pattern in the Nile delta.<br />
ENE_CO4: Number of energy infrastructure on <strong>Mediterranean</strong> costal areas:<br />
The following energy infrastructures currently exist in 2005/2006:<br />
8 power stations (including 2 north of the Suez Gulf).<br />
3 refineries<br />
The plan for 2021/22 includes the following additional infrastructures:<br />
4 power stations<br />
2 refineries<br />
In addition to the above-mentioned infrastructure, other impacts can be discussed as<br />
follows:<br />
Water Pollution<br />
Oil spills are energy-related source of water pollution due to their devastating after effects.<br />
About half of Europe‟s oil imports pass through the Red Sea, the Suez Canal and the<br />
<strong>Mediterranean</strong>. In addition, substantial offshore oil explorations and drilling activities are<br />
underway in Egypt‟s territorial waters. Similarly, water is an important component in thermal<br />
electricity generation. Large electric power plants require large amounts of water for cooling.<br />
Some plants are often built with “once through” cooling systems in which waste heat is<br />
discharged directly into water bodies and could cause harm to the aquatic and marine life.<br />
Effects on Ecosystems<br />
This is an area of major concern in Egypt due to land use conflicts between development<br />
projects, protected areas and oil and gas exploration, production and transmission,<br />
specifically in the <strong>Mediterranean</strong> and the Red Sea coastlines. In addition, most of the oil<br />
refineries and power stations exist in urban heavily populated centers such as Cairo,<br />
Alexandria and Suez, causing adverse impacts on urban environment.<br />
257
258<br />
ENERGY AND SUSTAINABLE DEVELOPMENT IN THE MEDITERRANEAN<br />
1.5 Financ ing and Inve s t ment Needs<br />
Electricity sector investment needs:<br />
The current investments in the electricity sector (2006/07) are about 1 billion US$, 40% is<br />
financed from the National Investment Bank and other government loans in local currency;<br />
and the rest is provided in hard currency from international fund raisers and development<br />
banks through long term loans.<br />
The added installed capacity planned for 2007/2012 from conventional and RE is 7800 MW.<br />
The estimated needed investments for the generating facilities and related transmission and<br />
distribution networks are US$ 7.3 billions.<br />
Oil and gas sector investment needs:<br />
The foreign investment in petroleum sector reached about 67.6% from the total direct foreign<br />
investments in 2005/06. The implemented investments in the first six months of the year<br />
2005/06 reached about US Dollar 1854.1 million.<br />
The amount of targeted investments of petroleum, gas, and petroleum products in 2006/07 is<br />
expected to US$ 2.9 billion representing 12.3% of total investments, out of which US$ 0.65<br />
billion for crude oil, US$ 1.8 billion for natural gases and about US$ 0.45 billion for petroleum<br />
products.<br />
Rational use of energy (RUE) investment needs:<br />
During the last two decades about US$ 100 millions had been invested in different programs<br />
for RUE. Most of the funds invested were provided through grants from different donors<br />
(mainly USAID).<br />
Current investments for 2006/07 are very limited and represented in the budget allocated for<br />
a technical assistance program with a cost sharing between the Egyptian Electricity Holding<br />
Company (EEHC) and UNDP/GEF.<br />
Data about private sector investments are not available as well as estimates for future<br />
investment needs on the national level.<br />
Renewable energy (RE) investment needs.<br />
Three wind power plant projects have been recently contracted and currently underway in<br />
Zafarana, those are in different stages of implementation as follows:<br />
1) 80 MW installed capacity wind power plant projects in cooperation between NREA and<br />
KFW of Germany representing phase (4) of the joint cooperation expected to start<br />
operation in April 2008, with the following financing scheme:<br />
A loan from KFW to NREA amounting 75.937 million Euro divided to:<br />
50% soft loan having 0.75% interest rate and 40 years repayment period including 10<br />
years grace period.<br />
50% commercial loan having 5.32% interest rate 10 years repayment period including<br />
5 years grace period.<br />
A loan from National Investment Bank of Egypt (NIB) to NREA amounting 201.089<br />
million Egyptian pounds (L.E.) having:<br />
13% interest rate<br />
10 years repayment period including 2 years grace period.<br />
2) A 120 MW installed capacity wind power plant in cooperation between NREA and JBIC of<br />
Japan expected to start operation in Feb. 2009 with the following financing scheme:<br />
A soft loan from JBIC to NREA amounting 85.329 million Euro (equivalent to 13.141<br />
billion Japanese Yen) having 0.75% interest rate 40 years repayment period including<br />
10 years grace period.<br />
A loan from NIB of Egypt to NREA including 16.5 million Euro and 391.49 million L.E.<br />
with the same conditions as the project in 1.
EGYPT - National study<br />
3) A 120 MW installed capacity wind power plant in cooperation between NREA and<br />
DANIDA of Denmark representing phase (3) of the joint cooperation expected to start<br />
operation in 2010, with the following financing scheme:<br />
A mixed credit loan from DANIDA to NREA amounting 111 million Euro (equivalent to<br />
825.3 million Danish Krone) having Zero interest rate 10 years repayment period<br />
including 0.5 years grace period.<br />
A loan from NIB of Egypt to NREA including 91.99 million L.E. (equivalent to 12.713<br />
million Euro)<br />
4) An Integrated Solar – Thermal Combined Cycle System –ISCCS- Power <strong>Plan</strong>t is in the<br />
tendering phase for its (2) major components; the combined cycle component of 120 MW<br />
installed capacity and the solar component of 30 MW installed capacity. The Expected<br />
project operation start date is 2010 with a financing scheme as follows:<br />
A soft loan from JBIC to NREA to finance the combined cycle component amounting<br />
about 93 M US$ having 0.75%interest rate and 40 years repayment period including<br />
10 years grace period.<br />
A grant from GEF (Global Environmental Facility) to NREA to cover the incremental<br />
cost of the ISCCS plant, including the solar component, compared to the cost of the<br />
optimum conventional alternative that will produce the same amount of electric<br />
energy equal to that of the ISCCS.<br />
There are another (3) wind power plant projects planned to be operational during 2010 –<br />
2011 which are located in Gulf of El-Zayt, south of Zafarana as follows:<br />
1) 80 MW representing phase (5) of joint cooperation between NREA and KFW where the<br />
feasibility study will be completed in October 2007.<br />
2) 220 MW representing phase (2) of joint cooperation between NREA and JBIC where the<br />
feasibility study has been completed and funding allocation is under way.<br />
3) 100 MW representing phase (2) of joint cooperation between NREA and Spain.<br />
It is worth to mention that the cost per MW of wind power plants had dropped below 1M Euro<br />
in the last few years, however during 2006 the cost of renewable energy equipment in<br />
general and wind in particular has experienced fast increase. Consequently, the investment<br />
estimate is around 1.3 – 1.5 Million Euro/MW resulting of a total investment for the (3) wind<br />
power plants of 520 – 600 Million Euro anticipated to be made available through soft loans<br />
and funding facilities. However, RE experts forecast that this price increase trend will<br />
continue till 2010 and then it will reverse resulting in a price decreasing trend similar to that<br />
noticed during 1995- 2005.<br />
The long-term plan for wind power plants in Gulf of El-Zayt targets to install about 3000 MW<br />
by year 2022. An increasing role for the private sector investment as well as deepening of<br />
the local manufacture of an increasing ratio of wind systems components are all planned and<br />
forecasted. It would be rather difficult to indicate estimates of the needed investments for the<br />
time being due to price wide fluctuations.<br />
The long-term plan for integrated solar combined cycle thermal power plants targets the<br />
installation of (2) such stations each 300 MW by year 2020.<br />
2. Rational Use of Energy (RUE) & Renewable Energy (RE) – policies,<br />
tools, progress and resulting effects<br />
2.1 RUE and RE policies<br />
2.1.1 Rational energy use policies<br />
Overview on the national sustainable development strategy framework and RUE<br />
Egypt is on the way to develop its own "National Sustainable Development Strategy". Efforts<br />
are being coordinated through the Ministry of State for Environmental Affairs with all<br />
concerned stakeholders to draft the strategy. A ministerial committee has been established<br />
259
260<br />
ENERGY AND SUSTAINABLE DEVELOPMENT IN THE MEDITERRANEAN<br />
for this purpose headed by the Minister of State for Environmental Affaires and assisted by a<br />
technical group constituted of representatives of all concerned ministries.<br />
Energy is a major component of any national sustainable development strategy. The<br />
sustainability of energy calls for a sustainable long term vision for the energy supply/demand<br />
balance scenarios including maximizing the use of all available renewable resources, as well<br />
as setting quantitative targets and necessary mechanisms to insure the rational use of all<br />
energy resources. An integral part of the energy sustainability is to minimize its negative<br />
impact on the environment.<br />
In general all these features of energy sustainability are presently being addressed in Egypt,<br />
although are not always set and performed through a well defined and declared strategy. So<br />
far, this situation is expected to change with the declaration of the National Sustainable<br />
Development Strategy, as well as the formulation of the Supreme Council of Energy late<br />
2006.<br />
Conventional energy planning approaches in Egypt were mainly looking into the<br />
augmentation of supply to meet increasing lump sum aggregated demand for each<br />
commercial energy form in the energy supply matrix. The used quantitative planning tools<br />
aiming at increasing the supply resources to meet the growing aggregated demand give<br />
minimal or even no consideration in order to avoid energy degradation through the<br />
appropriateness of the provided energy form to each specific "energy service". This "energy<br />
service" is the ultimate targeted need to be satisfied optimally through the whole energy<br />
chain of primary energy production, conversion, transmission/distribution, and end-use. One<br />
clear example of this issue is the current practice of forecast for the electricity demand in<br />
residential and commercial sectors which can not differentiate between deferent portions of<br />
the electric load being used for lighting (for example) and that used to meet the hot water<br />
demand through electric water heating. For the first use electricity is the most appropriate<br />
form, however for the later use natural gas and solar energy or a combination of both of them<br />
are much more appropriate to avoid energy degradation.<br />
The integrity of a detailed vision for the energy services demand matrix in the country that<br />
should be tied and matched to the available energy resources matrix, will lead to the<br />
avoidance of energy degradation, the encouragement of the wide spread use of renewable<br />
energy applications, and a higher rational use of all available energy resources. This kind of<br />
strategy framework notion would need a new planning approach that can consider the<br />
energy sector in Egypt through an integral context.<br />
It is believed that the environmental challenges facing Egypt and the increasing debate on<br />
how far the country is on a sustainable energy appropriate path, will lead sooner or later to<br />
accelerate the implementation of a long term integrated national energy vision and strategy,<br />
along with relevant plans of actions.<br />
The momentum of tackling the environmental concerns in Egypt is gradually increasing<br />
through legislations and regulations, government programs and policies, adoption of<br />
international conventions and protocols, technical and financial support from international<br />
organizations, and recently the involvement of Egyptian civil society and non-governmental<br />
organizations. This momentum draws the attention of the developers of the anticipated<br />
"National Sustainable Development Strategy" to set national quantifiable targets based on<br />
realistic specialized studies in all related sectors and to formulate these targets in a way that<br />
permits its easy monitoring and assessment during the implementation of this strategy.<br />
The measures encouraging the rational use of energy (RUE) should be one of the principal<br />
components of the "Egyptian sustainable development strategy". Improving energy efficiency<br />
both by reducing quantities of energy consumed and by changing processes, offers a<br />
powerful tool for achieving sustainable development by reducing the need for investment in<br />
energy infrastructure, by cutting fuel costs, by increasing competitiveness for businesses and<br />
thus seeking welfare for consumers and the whole community. RUE can further create<br />
environmental benefits through reduced emissions of greenhouse gases and local air<br />
pollutants. It can offer social benefits in the form of enhanced energy security for current and<br />
future generations as well as enhanced energy services.
EGYPT - National study<br />
To satisfy this need, the Egyptian government is giving high priority to a policy that promotes<br />
the development of new and renewable energy and in a lesser weight to a trend that<br />
introduces energy conservation measures. This can be clearly seen from over viewing the<br />
relevant authorities' planning for the rolling five-year plans and longer-term plans.<br />
The Egyptian electricity sector could be considered as the major player of the current RUE<br />
efforts in Egypt for both the supply side and the demand side. The fuel specific consumption<br />
has decreased from 346 for the year 1981 to only 226 gram oil equivalent/KWh in 2006. The<br />
value of transmission and distribution losses has also decreased during the same period<br />
from 18% to only 12% for the year 2005/06. Less achievement had been realized in the<br />
demand side management at the end-users level.<br />
Other efforts were taken by the "Organization for Energy <strong>Plan</strong>ning – OEP" that does not exist<br />
any more since late 2006, but was working (most of its life since 1983) under the umbrella of<br />
the "Ministry of Petroleum – MOP", beside some other efforts by other organizations that will<br />
be described later.<br />
RUE general objective and main given orientations<br />
Egypt's National Strategy study on the Clean Development Mechanism (Cairo 2003) stated<br />
that "the national energy strategy (with no reference) aims at saving up to 10% by the year<br />
2010 in both supply (oil and gas, electricity sub-sectors), and demand sides (industrial,<br />
commercial, domestic, and transport sub-sectors)".<br />
As mentioned in part one, different studies had treated both technical and economical<br />
potentials of energy saving in Egypt particularly in the demand side of the energy chain.<br />
However, RUE targets being a matter of national goal or objective were not documented.<br />
All concerned ministries and organizations confirm the necessity of RUE in their policies,<br />
conferences, reports, studies, and declarations. They are also announcing different activities<br />
to involve and invite end-users to participate in different projects to rationalize their energy<br />
use. But due to the diversity and scatterings of these efforts its reflection on the national level<br />
is hard to assess.<br />
Expected driving forces for different end-use sectors<br />
Due to energy subsidies and its expected burden on the overall energy economy, energy<br />
pricing in Egypt is being seriously revised and increased to approach a balanced price that<br />
would cover real coast and a reasonable profit or even in some cases would approach world<br />
price levels. This is taking place for Fuels (oil products and natural gas) and electricity but in<br />
a selective pace for each type of energy and each targeted group of end-users.<br />
Driving forces for RUE in Egypt are as simple as increasing fuel and electricity prices, and as<br />
complex as creating a market and environment that would make RUE products and services<br />
a bankable investment. In fact, this is a topic that needs to be more elaborated and<br />
developed for each energy end-use sector.<br />
Based on the current practice and context in this early stage of introducing RUE measures in<br />
Egypt, incentives mechanisms would be the most effective driving force. However, the price<br />
signals are also effective ones but current constraints will limit their immediate effect. And<br />
this is applicable for all end-use sectors.<br />
Another important driving force particularly for industrial and commercial end-users that<br />
would create a market potential for RUE products and services could be realized through the<br />
following package of interdependent measures:<br />
Awareness of benefits of RUE.<br />
Availability of high quality RUE products and services.<br />
Availability of Energy Service Companies (ESCOs) with adequate technical, financial, and<br />
management skills.<br />
Availability and ease of access to available funds.<br />
261
262<br />
ENERGY AND SUSTAINABLE DEVELOPMENT IN THE MEDITERRANEAN<br />
Institutional set up to define and monitor RUE policies<br />
As it has been mentioned before, Egypt does not have a dedicated national institute to set,<br />
implement, monitor, and assess RUE‟s achievements.<br />
Current RUE activities are mostly being done through the Egyptian electricity sector. Large<br />
efforts are being taken in the electricity supply side concerning fuel switching to natural gas<br />
in the thermal power stations, improving conversion efficiency, and decreasing transmission<br />
and distribution losses. Other minor efforts are being taken in the electricity demand side as<br />
it will be developed later.<br />
One other current important venue for the implementation of RUE projects is the CDM option<br />
that has already been included in Egypt's CDM projects portfolio and activated under the<br />
umbrella of the "Designated National Authority – DNA" being headed by the Minister of State<br />
for Environmental Affairs. This topic will be elaborated later in this study.<br />
Few poorly documented other activities are being implemented directly by the end-users<br />
without any involvement of governmental agencies.<br />
2.1.2 Renewable Energy (RE) Development Policies<br />
In 1982 the first renewable energy strategy was formulated by the Ministry of Electricity and<br />
Energy as an integral part of national energy planning, targeting to meet 5% of primary<br />
energy demand through the use of renewable energy sources by year 2000. This objective<br />
was modified several times later to become less ambitious in view of the overall trend of<br />
decrease in the oil prices to 12 – 15 US$/barrel during the late 1980s contrary to previous<br />
estimations of reaching 40 US$/barrel by the 1990s. However, it should be noted that the RE<br />
strategy is a dynamic one, and thus, it is being continuously revised and updated in view of<br />
various RE technology development projections and both economic and commercial<br />
maturity. The availability of adequate funding resources particularly through soft loans and<br />
other financing facilities has been the most important governing factor in view of the relatively<br />
higher cost of Re compared to conventional.<br />
In July 1986, the New and Renewable Energy Authority (NREA) was established to be<br />
affiliated to the Egyptian Ministry of Electricity and Energy, to provide the institutional<br />
framework for implementing the RE strategy and to act as the focal point for expanding<br />
efforts to develop and introduce RE to Egypt on a commercial scale.<br />
In the late 1980s the renewable energy target was modified to be 5% of primary demand by<br />
the year 2005 instead of by year 2000, then during the mid 1990s to be 3% of the primary<br />
energy demand by 2005.<br />
In year 2000, the present RE target has been declared of satisfying 3% of the electric energy<br />
demand by year 2010 mainly from utilizing the considerable wind resource potential along<br />
the western bank of Gulf of Suez North of the Red Sea, and partly from solar energy<br />
electricity generation. Further contributions of other RE applications, mainly domestic solar<br />
water heaters and photovoltaic used for telecommunication purposes, are all over and above<br />
the planned 3%. The strategy long term objective is to cover 7% of electric demand from RE<br />
by the year 2021/22 not including another 7% from hydropower plants.<br />
Wind energy strategy<br />
Wind energy strategy in Egypt was developed gradually in an ordered manner where<br />
success in each phase led to the following one. Elaborate wind resource assessment started<br />
in 1985 has shown that Egypt is endowed with a considerable wind potential along the Gulf<br />
of Suez. Consequently, projects implementation started with pilot projects followed by field<br />
testing and demonstration projects then small commercial grid connected wind power<br />
generation projects (5 MW at Hurgada). Egypt has crossed this phase to large commercial<br />
grid connected wind farms since 2000. The strategy present target is to reach 850 MW<br />
installed capacity by 2010 out of which 230 MW are already in place and operational in<br />
Zafarana site. The long term target of the strategy is to reach at least 3000 MW by 2021/22.
EGYPT - National study<br />
More than 90% of the additional capacity will be installed in Gabal El Zeit area. Both sites are<br />
along Gulf of Suez.<br />
Presently, EEHC takes into consideration both existing and planned wind power plants<br />
capacities in its generation expansion plans. However, there is still an issue under<br />
consideration between EEHC and NREA of what is the wind "Capacity Credit" to be used in<br />
the said planning process which will be addressed later in 2.4.<br />
Figure 4 shows the installed wind power plants capacity present and planned until 2010<br />
distributed according to cooperating countries.<br />
Figure 4 Installed wind power plants capacity present and planned until 2010 distributed according to<br />
cooperating countries<br />
Solar thermal electricity generation strategy<br />
The strategy targets to install 750 MW Integrated Solar/Combined Cycle System (ISCCS)<br />
power plants by the year 2020.<br />
Kuraymat site located 90 km South East of Cairo has been selected for installing the 1 st<br />
Egyptian ISCCS Power <strong>Plan</strong>t of 150 MW installed capacity including a solar portion of 30<br />
MW installed capacity.<br />
The station is planned to start operation during year 2010. GEF - Global Environmental<br />
Facility contributes to project financing through a grant of 50 Million US$ to cover the<br />
incremental cost of the plant compared to the conventional alternative which generates the<br />
same amount of annual electric energy. JBIC contributes to financing the conventional part<br />
through a soft loan of about US$ 93 million at 0.75% interest rate and 40years repayment<br />
period including 10 years grace period.<br />
Another two similar plants each 300 MW are planned to be installed during the period 201 0<br />
– 2020.<br />
Solar Water Heating Strategy<br />
Solar water heating for domestic purposes received a very early start in Egypt since late<br />
1979 where 1000 solar water heaters were imported and distributed allover the country<br />
for demonstration purposes and to spread awareness of their feasibility and advantages.<br />
Shortly thereafter local industry for manufacturing several components of the solar water<br />
heating systems has evolved and continued expanding to reach nine factories in year<br />
1987 with production capacities ranging from 3000 – 5000 typical units per year where<br />
the typical unit is of 150 liters/day of hot water and having 2 m 2 of flat plate collectors'<br />
area.<br />
In 1987 the Egyptian Minister of Housing, Reconstruction and New Communities issued<br />
Ministerial Decree No. 401 for year 1987 enforcing that new buildings in new<br />
263
264<br />
ENERGY AND SUSTAINABLE DEVELOPMENT IN THE MEDITERRANEAN<br />
communities should be equipped with solar water heating systems and indicating that<br />
licenses for such buildings as well as design and tender documents should include solar<br />
water heaters systems relevant documents specifications where the cost of solar systems<br />
will be part and parcel of buildings and apartments costs. The period from year 1988 to<br />
1993 enjoyed flourishing of the solar water heaters systems utilization and active local<br />
manufacturing of such systems where the production capacities of factories ranged<br />
between 1000 – 2500 typical units per year. Due to poor quality, lack of maintenance and<br />
after sales service, and non existence of enforced standards and codes, solar systems<br />
installed suffered many problems that led to unsatisfactory performance lower than what<br />
planned which brought bad reputation to solar water heating systems. The result was not<br />
abiding by the ministerial decree enforcing use of solar water heaters in new building and<br />
new communities where the decree has become practically abandoned.<br />
Solar Photovoltaic Strategy<br />
In the photovoltaic (PV) field, different PV applications have been addressed under<br />
Ministry of Electricity and Energy activities since year 1979 and NREA continued that<br />
interest later. Most of PV applications including water pumping, desalination, refrigeration,<br />
village electrification, lighting, telecommunication, cathodic protection and other PV<br />
applications were demonstrated and field tested. Some applications including<br />
telecommunications and both remote desert roads lighting and billboards lighting on<br />
those roads as well as applications for use in remote desert small loads, are all already<br />
commercialized. It is estimated that the PV systems installed capacity is presently more<br />
than 5.2 MW peak with around 32% of that capacity is in telecommunications sector due<br />
to the rapid expansion of mobile telephones repeater stations where the desert<br />
represents more than 90% of Egypt‟s area. Figure 5 represents PV applications share in<br />
Egypt.<br />
Figure 5 PV applications share<br />
PV CAPACITY IN EGYPT (4000 - 4500 kWp)<br />
Communication<br />
Systems<br />
32%<br />
Cell Phone Netw orks<br />
Systems<br />
12%<br />
Cathodic Protection<br />
Systems<br />
2% Desalination Systems<br />
1%<br />
Lighting Systems<br />
20%<br />
Water Pumping<br />
Systems<br />
9%<br />
Advertising Lighting<br />
Systems<br />
24%<br />
Lighting Systems Advertising Lighting Systems<br />
Water Pumping Systems Desalination Systems<br />
Cathodic Protection Systems Communication Systems<br />
Cell Phone Networks Systems<br />
Institutional Measures to Manage and Monitor Energy Issues including RE<br />
In 1982 both a Supreme Council for Energy and an affiliated Supreme Council for<br />
Renewable Energy were established to formulate general energy and renewable energy<br />
policies and strategies, and follow up their implementation. These councils had in their<br />
membership representatives of energy producing and consuming ministries and even<br />
main sectors as well as main relevant research and development centers.<br />
Further, the Organization for Energy <strong>Plan</strong>ning (OEP) was established in 1983, and<br />
affiliated to Ministry of Petroleum to support energy policies and strategies formulation<br />
and follow up. OEP was also supposed to support coordination between the two main<br />
energy ministries, Ministry of Petroleum and Ministry of Electricity and Energy. However,<br />
the overall trend of decrease in oil prices in the late 1980s and during early 1990s has a
EGYPT - National study<br />
negative impact on the said two supreme councils that shortly there after turned to be<br />
inactive. Moreover, OEP ceased to exist lately in 2006.<br />
In view of the lately rapid increase in oil prices and expectations of persistence of that<br />
trend, as well as the doubt about Egyptian oil reserves, the Supreme Council of Energy<br />
has been re – established and headed by the Egyptian Prime Minister to formulate an<br />
overall national energy strategy frame work including the nuclear option.<br />
Presently, an Electricity and Energy Act is under development. Its proposed articles<br />
include obligations on both energy suppliers and energy end-users. For suppliers of<br />
capacities larger than 50 MW, they will be committed to establish a percentage (to be<br />
specified) of their units capacity based on renewable energy, waste heat recovery, and/or<br />
cogeneration> While for consumers particularly in energy intensive industries, they will be<br />
committed to allocate a percentage (to be specified) of their consumption to be supplied<br />
from renewable energy and/or saved by applying RUE measures. Energy efficiency and<br />
rational use of energy goals will be established and should be applied for both energy<br />
producers and consumers.<br />
As indicated in 1.3.2, Egypt has signed and ratified both UNFCCC and Kyoto protocol. In<br />
April 2005 the Egyptian Designated National Authority (DNA) has been formatted and<br />
headed by the Minister of State for Environmental Affairs and having in its membership<br />
representatives of key ministries involved in environmental issues as well as<br />
representatives of the private sector and NGOs. Since its inception and in cooperation<br />
with other CDM promotion programs mainly CD4CDM managed by both UNEP – RISO<br />
and Energy and Environment Research Center – E2RC – affiliated to Tebbin Institute for<br />
Metallurgical studies, different seminars, training programs and awareness campaigns<br />
have been conducted. In January 2007 the DNA has approved 29 projects for<br />
implementation within CDM, out of which 19 were energy projects, mainly RE and fuel<br />
switching.<br />
The Egyptian Electric Utility and Consumer Protection and Regulatory Agency (Regulator<br />
or EEUCPRA) has been established by a presidential Decree in year 2000, and has<br />
become in effect in late 2001. Objectives of the Agency are to regulate, supervise, and<br />
control all matters related to the electric power activities, whether in generation,<br />
transmission, distribution, or consumption, in a way that ensures:<br />
Availability and continuity of electricity supply<br />
Satisfying considerations for environmental protection<br />
Satisfying interests of the electric power consumers as well as the interests of the<br />
producers, transmitters and distributors.<br />
The agency aims also at preparing for lawful competition in the field of electricity generation,<br />
transmission and distribution and avoiding any monopolization within the electricity market in<br />
Egypt. However, the agency is still in its way to implement its mandate which is not fully<br />
implemented.<br />
2.2 Ins tr ume n ts and measure in fa vo r of RUE and RE<br />
2.2.1 Tools and measures in favor of rational energy use (RUE)<br />
Overview<br />
Egypt has, until recently, been in a position where the utility supplying electrical energy to<br />
different consumer sectors, had always been able to extend its generation and network<br />
capacities to be adequate to supply requested planned demand of all customers during the<br />
following 10 years. This situation is rapidly changing due to various factors. One of the most<br />
important factors is the so-called energy intensive industries drive, particularly heavy<br />
industries emigrating from the industrialized world like those for cement factories. This<br />
industrial product is mainly for export as the local market is almost saturated and it benefits<br />
from subsidized energy tariffs. This entails a future demand for electric power highly<br />
exceeding the forecasted and consequently planned additional installed capacity through the<br />
implementation of a set of power stations in the future and hence would impose a financial<br />
265
266<br />
ENERGY AND SUSTAINABLE DEVELOPMENT IN THE MEDITERRANEAN<br />
burden on the electricity utility. Current discussions between concerned organizations are<br />
under way to find a compromise that would be agreed upon by all stakeholders. This new<br />
situation of the possibility of being unable to meat future demand is a new issue for electric<br />
power planners and policy makers. The previous concerns were mainly financial and<br />
economical and the solution was always (till now) possible through arrangements (involving<br />
the government) with international funding agencies with feasibility studies showing a limited<br />
deficit to repay the loans. It is obvious that the higher the demand on electric power, the<br />
higher the difficulties to get required investments. One strategic option is to adopt a rigorous<br />
policy on the level of pricing and also on the level of rational use of energy (RUE).<br />
As previously mentioned from the point of view of supply side, the electricity sector has taken<br />
the following measures for:<br />
Switching all existing and new thermal power plants to be fueled by natural gas.<br />
Improving the conversion efficiency through upgrading old power stations.<br />
Using mainly combined cycle power stations and raising the standard size of its modules<br />
in order to reach higher efficiencies.<br />
Improving transmission and distribution losses.<br />
Some other measures were taken by the electricity sector in the demand side level such as:<br />
Penalty on consumers having their power factor less than 90% and incentives for<br />
consumers having their power factor more than 92%.<br />
Additional demand charges on customers demand exceeding their contractual demand<br />
during the system evening peak load period, are applied.<br />
Based on our bibliographic research and contacts, we did not find any documents reflecting<br />
what is going on within the supply side of the oil and gas sector on the level of RUE<br />
measures or tools.<br />
Some measures under the legislation topic have to be mentioned:<br />
New buildings' energy standards have been developed to be adopted within new<br />
buildings specifications but no enforcement has taken place.<br />
Energy labeling and standards have been developed and issued for four appliances:<br />
washing machines, refrigerators, air conditioners, and electric water heaters. It is<br />
compulsory (with limited enforcement) to put the energy efficiency label (reflecting the<br />
level of the appliance electricity consumption) on all locally manufactured and imported<br />
appliances. Accredited performance test laboratories (Energy Efficiency Testing<br />
Facilities) have been implemented within the Egyptian Renewable Energy Testing &<br />
Certification Center – RETCC and hosted inside the premises of the New and Renewable<br />
Energy Authority – NREA.<br />
There were limited scattered efforts on:<br />
Awareness campaigns<br />
Research programs in universities and research centers.<br />
Training programs for energy managers, in industrial and commercial sectors.<br />
Involvement of NGOs under the concept of environment protection through RUE.<br />
Involvement of some local governorates in pilot projects concerning public lighting.<br />
In general concerning the supply side, Egypt currently does not apply any other incentive<br />
methods, fiscal measures, quotas, or procedures to encourage local or foreign investment in<br />
RUE projects.
Previous and current RUE programs<br />
Previous RUE programs<br />
EGYPT - National study<br />
The organization for energy planning (OEP) programs<br />
OEP, established in 1983, was entrusted to undertake energy planning and policy analysis.<br />
Since the late 80s OEP has conducted several surveys and field studies with the objective of<br />
assessing the potential for upgrading RUE in the Egyptian industrial sector. It has also<br />
conducted 35 audits in large industrial companies.<br />
In cooperation with the European Union, OEP has completed a project in energy efficiency<br />
improvement called: "Urban Energy <strong>Plan</strong>ning in the Alexandria Governorate". The project<br />
was executed during the period 1993-1997 and focused on the residential and commercial<br />
sectors. The project succeeded in creating a revolving fund within the Alexandria Electricity<br />
Distribution Company – AEDC for the financing of compact fluorescent lamps (CFLs) in<br />
Alexandria. The scheme is still in use at present and allows consumers to lease energy<br />
efficient light bulbs and pay for them over time through their electricity bills to AEDC. The<br />
same approach has been very recently adopted within Cairo two electricity distribution<br />
companies (North and South)<br />
The energy conservation and environment project (ECEP)<br />
The ECEP project was a US$ 67.5 million grant financed by USAID to the government of<br />
Egypt and executed during the period from 1988 to 1998. Its purpose was to encourage<br />
energy efficiency and increase the Egyptian institutional capability to implement energy<br />
conservation activities and projects. Three Egyptian partners have coordinated for the project<br />
implementation. TIMS (Tebbin Institute for Metallurgical Studies affiliated to Ministry of<br />
Industry) for public sectors activities; DRTPC (Development Research and Technological<br />
<strong>Plan</strong>ning Centre affiliated to Cairo university) for private sector activities; and FEI (Federation<br />
of Egyptian Industries) for training and promotional activities.<br />
The project was actually not defined based on components to be achieved right from the<br />
start. It started based on a study on energy efficiency for the industrial sector financed by<br />
USAID, and was developed incrementally after that based on the various pilot projects tried.<br />
The core objectives of the project were as follows:<br />
Develop and train DSM operating units at AEDC and EEHC.<br />
Test potential impacts of industrial DSM.<br />
Evaluate DSM impacts on gas emissions for Egypt climate change plan.<br />
Integrate data toward the development of national DSM program in Egypt.<br />
Conduct training programs to support the transfer of know-how capabilities to local<br />
counterparts.<br />
The core achievements of the project were:<br />
The development of energy audits for 12 industrial plants and hotels.<br />
The selection of DSM demonstration projects for implementation.<br />
The procurement (primarily USAID funded) and installation of related equipment.<br />
The monitoring of results and the performance of training to transfer know-how and<br />
capabilities to local counterparts.<br />
The main results were:<br />
Stimulating a market demand for DSM products and services as the project has procured<br />
energy efficiency equipment amounted to US$ 27 million over 7 years (1991 - 1998) and<br />
generated annual energy savings amounted at US$ 15.6 million.<br />
Accelerating the development of local market through creating Egyptian partner<br />
companies to The US companies to be involved RUE projects. These local companies<br />
267
268<br />
ENERGY AND SUSTAINABLE DEVELOPMENT IN THE MEDITERRANEAN<br />
have formed an NGO named the "Egyptian energy services and businesses association –<br />
EESBA". ECEP also organized an international study tour and training program to<br />
encourage the Egyptian energy sector professionals to meet and develop alliances with<br />
international counterparts and RUE providers (ESCOs) and regulators.<br />
A data base on results from implemented projects including cost information and<br />
performance evaluation.<br />
Current RUE programs:<br />
Energy Efficiency Improvement and greenhouse gas reduction project (EEIGGR)<br />
The EEIGGR project started in February 1999 as a US$ 5.9 million joint effort between GEF,<br />
UNDP, EEHC and OEP. The EEIGGR is supposed to have its last extension by the end of<br />
2007. No other planned programs are under way.<br />
The EEIGGR project was designed to remove technical and institutional barriers and to<br />
establish a growing sensitivity to energy efficiency and the global environment concerns. The<br />
project worked on demand and supply sides management, building consumer awareness of<br />
energy efficiency issues, encouraging the use of energy-efficient appliances and proving<br />
viability of alternative measures to the tendency of increasing generating capacity to meet<br />
demand for power. The project consists of three main components:<br />
Network Loss Reduction.<br />
Energy Efficiency Market Support.<br />
Cogeneration Promotion.<br />
Selected project activities/results:<br />
The project's efforts to reduce network transmission losses, load management and load<br />
shifting have resulted in a reduction of transmission losses from 6.7 per cent in 1999 to<br />
3.68 per cent at the end of 2005.<br />
NGOs have become involved in energy efficiency activities and awareness campaigns<br />
targeting households, industrial premises, commercial sector - particularly office<br />
buildings, hotels, hospitals and schools - with information on energy saving and the use<br />
of energy efficient appliances and efficient lighting.<br />
Field surveys were conducted at five industrial companies to investigate the potential for<br />
load shifting and a new Time of Use tariff option was developed. A cogeneration<br />
guidebook was prepared and a cogeneration tariff developed.<br />
Several demonstration projects on efficient lighting systems have been conducted. A<br />
techno-economic study on the feasibility of replacing incandescent streetlights with<br />
efficient compact fluorescent lamps was prepared for the Ministry of Electricity and<br />
Energy.<br />
Energy audit program included 200 audits made for government buildings, commercial<br />
and industrial establishments between 1999 and 2003.<br />
Training sessions on energy efficiency have been held for manufacturers of home<br />
appliances.<br />
The project has trained engineers in calibration and in measurement. Engineers have<br />
also been trained in cogeneration, digital meters and in demand side management.<br />
EEIGGR has established eight energy service companies (ESCOs) to provide advice in<br />
energy efficiency and financing. The ESCOs have different expertise - one in utilities, two<br />
in equipment supply, two in electro-mechanical contracting and three in consulting.<br />
Capacity building has been provided to the ESCOs through training on energy auditing,<br />
energy efficient technologies, economic and feasibility project evaluation, risk evaluation<br />
and financing.
EGYPT - National study<br />
Developing simplified contracts which include measures for performance guarantee and<br />
savings verification; and concentrates on those energy efficiency technologies which<br />
have low technical risks and attractive payback periods, such as power factor<br />
improvement, high efficiency lighting.<br />
The project promoted the sales of more than 10,000 CFL (Compact Fluorescent Lamps).<br />
The project prepared a feasibility study for a cogeneration pilot project.<br />
The project provided technical advice to a manufacture of compact fluorescent lamps in<br />
Egypt.<br />
The project organized a workshop on 'Consumer education and social marketing of<br />
appliance standards' in cooperation with the Collaborative Labeling and Appliance<br />
Standards Program (CLASP) in December 2003.<br />
The project cooperated with other parties to develop energy efficiency building codes for<br />
new buildings and energy-efficiency standard specifications have been set for home<br />
appliances - fridges, washing machines, air conditioners, and electric water heaters. A<br />
ministerial decree now makes it compulsory for local manufacturers and importers to<br />
abide by the specifications and label their products with their energy consumption<br />
information.<br />
EEIGGR has issued an Egyptian Measurements and Verification Protocol to verify energy<br />
savings in performance contracting.<br />
RUE indicators:<br />
ENE_C08: Share of RUE in energy investments and R&D expenses<br />
Not available<br />
ENE_C05: Final consumer energy price<br />
Electricity prices starting from 01/10/2006 (one US$=5.7 LE)<br />
Extra high voltage (220 KV): 1.95 US cents/KWh<br />
High voltage (66 KV): 2.35 US cents/KWh<br />
High voltage for construction companies: 2.36 US cents/KWh<br />
Medium and low voltage<br />
Consumers having a demand more than 500 KW (large consumers)<br />
o Demand charge based on the peak demand during the month: 1.51 US$/KW<br />
o Energy price: 3.21 US cents/KWh<br />
Consumers having a demand less than 500 KW<br />
o Agricultural consumers: 1.7 US cents/KWh<br />
o Other consumers: 3.77 US cents/KWh<br />
Residential consumers<br />
First 50KWh/month: 0.88 US cents/KWh<br />
The following 51 to 200 KWh/month: 1.75 US cents/KWh<br />
The following 201 to 350 KWh/month: 2.39 US cents/KWh<br />
The following 351 to 650 KWh/month: 3.44 US cents/KWh<br />
The following 651 to 1000 KWh/month: 4.91 US cents/KWh<br />
The following consumption more than 1000 KWh/month: 6 US cents/KWh<br />
Commercial buildings consumers<br />
First 100 KWh/month: 3.74 US cents/KWh<br />
The following 101 to 250 KWh/month: 5.42 US cents/KWh<br />
The following 251 to 600 KWh/month: 6.89 US cents/KWh<br />
The following 601 to 1000 KWh/month: 8.54 US cents/KWh<br />
269
270<br />
ENERGY AND SUSTAINABLE DEVELOPMENT IN THE MEDITERRANEAN<br />
The following consumption more than 1000 KWh/month: 9.04 US cents/KWh<br />
Public lighting: 6.25 US cents/KWh<br />
Current fuel prices (one US$=5.7 LE)<br />
Gasoline 80: 0.18 US cents/liter<br />
Gasoline 90: 0.23 US cents/liter<br />
Gasoline 92: 0.25 US cents/liter<br />
Natural gas (residential average price): 3.5 US cents/cubic<br />
meter<br />
Natural gas (industrial): 1.25 US$/million<br />
BTU<br />
Natural gas (electricity sector): 1 US$/million BTU<br />
Solar (fuel oil no. 2): 105 US$/ton<br />
Mazout (fuel oil no. 6): 52.6 US$/ton<br />
Annex I, gives the details on fuel prices and electricity prices evolution by type of end-use<br />
sectors.<br />
ENE_C11: Share of fuel and electricity expenditures in household budget<br />
For the average income household: 7% (estimated based on average income of an average<br />
family of 5 persons)<br />
For the 20% of the population with the lowest income: 10% (compiled from old OEP studies)<br />
ENE_C06: Existing incentive measures and policies for RUE development at national<br />
level<br />
None of the list of measures is already in place in Egypt<br />
ENE_C07: Cities/regions/provinces with objectives in terms of RUE<br />
None of the cities, provinces, regions, or department is committed to carbon or energy<br />
auditing, nor having quantitative objectives for CO2 emission abatement.<br />
ENE_P04: Total sum of investments made with Kyoto Protocol’s Flexibility Mechanism<br />
Until May 2006 the approved and/or accepted projects were 15 with a total investment of<br />
US$ 862 million (97% for RE projects including hydropower with a share of 40% of CERs)<br />
2.2.2 Tools and Measures in Favor of Renewa ble Energy (RE)<br />
Existing incentive measures and policies for RE development at national level<br />
(ENE_C06)<br />
The formulation during 2005 of the Egyptian Designated National Authority (DNA) that<br />
regulates CDM activities in Egypt can also be viewed as a tool in that direction.<br />
We can view the ministerial decree No. 104 for year 1987 of the Egyptian Minister of<br />
Housing, Reconstruction and New Communities mentioned in 2.1.2 as one of the<br />
effective tools to promote and foster the use of solar water heaters in buildings, though<br />
later has become abandoned starting of year 1993 due to reasons mentioned in 2.1.2.<br />
In June 2004 an agreement was signed between the Ministry of Petroleum and the<br />
Ministry of Electricity and Energy to establish the “Renewable Energy Fund” financed<br />
from the difference between the international prices of the natural gas saved (hence<br />
exported) due to use of wind plants for grid – connected electricity generation, and the<br />
local subsidized price of natural gas. This difference will be splitted equally between the<br />
two ministries where the Ministry of Electricity and Energy share will have a maximum of<br />
2 Egyptian Piasters (0.35 US cents) and will be allocated to support electricity generation<br />
by the electricity sector from RE. In view of the vast current increase in oil and natural gas<br />
prices a revision of this limit might be discussed. However, such issue shows that
EGYPT - National study<br />
Egyptian authorities concerned conceive renewable energy sustainable development<br />
advantages.<br />
Power Purchase Agreements (PPAs) between NREA and EETC can also be seen as an<br />
incentive tool as follows:<br />
PPAs are signed separately for each wind power plant project after acquiring approval of<br />
Regulatory Agency for connection to the grid. As a support for renewable energy, EETC<br />
bears all expenses of overhead transmission lines and substations extensions above and<br />
including 22KV, needed to connect wind power plants to the grid of 220 KV.<br />
Tariffs concluded in the PPAs between NREA and EETC were affected by various wind<br />
power plants financing schemes and commissioning date.<br />
By examining Table 13 which shows the development of wind energy projects for grid –<br />
connected electricity generation and financing conditions for each project, we can notice the<br />
following issues:<br />
The PPA tariff was 7 piaster/kWh (1.22 US cents) for Zafarana (1) being fully financed<br />
through a grant and 10 piaster/kWh (1.8 US cents) for the rest of wind power plants until<br />
1/7/2005 when the tariff has become 12 piaster/kWh (2.11 US cents) for all wind plants<br />
except Zafarana (1) until 1/7/2006 when it has become also 12 piaster/kWh that turned to<br />
be the common tariff for all wind plants till now.<br />
In the context of heavily subsidized energy prices particularly for the natural gas used to<br />
produce more than 90% of total electricity generation from thermal plants, where the<br />
average purchase price or tariff paid by EETC to the generation companies for thermalgenerated<br />
kWh is in the order of 10 piaster/kWh, 12 piaster is considered as an implied<br />
incentive for renewable energy.<br />
Training, Information Dissemination and Awareness Raising Programs<br />
A Renewable Energy Testing and Certification Center has been established within NREA<br />
premises mainly in Cairo while the Wind Technology and Testing Center (RETCC) is located<br />
in Hurghada. The RETCC was originally started through support of a grant from the EU and<br />
the Italian government to establish a set of specialized RE and energy efficiency testing and<br />
certification laboratories in addition to supporting general purpose laboratories that were<br />
completed in 1994. The wind center in Hurghada was supported through a grant by DANIDA.<br />
Later some of these laboratories were updated in phases. The RETCC facilities are being<br />
used to support various general and specialized training and information dissemination<br />
programs to different levels of interested audience and professionals not only on the national<br />
level but also the regional one.<br />
Training curricula includes summer training programs for university students, from Egypt as<br />
well as other training programs for engineers and technicians from the Arab Countries mainly<br />
and sometimes from Africa.<br />
The RETCC facilities are being used to organize seminars and workshops aiming at<br />
awareness raising and information dissemination about the feasibility of RE and RUE also.<br />
Investments and expenditures in RE (ENE- C08)<br />
The following Table 13 shows the development of existing grid-connected wind power plants<br />
projects installed capacity from 2000 to 2006 along with corresponding investment. It should<br />
be noted that foreign financing facilities play a key role in implementing the wind power<br />
projects plan in view of the so far higher cost of produced wind KWh compared to the one<br />
produced from thermal power stations. Consequently, Egypt maintains close cooperation<br />
links with developed countries willing to support wind power projects' development through<br />
soft financial loans conditions.<br />
Three European countries have been very much interested to support Egypt wind energy<br />
program; Germany, Denmark, and Spain.<br />
271
Financing Support through CDM<br />
272<br />
ENERGY AND SUSTAINABLE DEVELOPMENT IN THE MEDITERRANEAN<br />
In January 2007 the CDM projects portfolio included more than 40 projects of which 29 have<br />
been already accepted and/or approved by the Egyptian DNA expected to produce more<br />
than 6 million CERs annually. The approved and/or accepted 29 projects include 19 projects<br />
in the energy sector out of them 4 are in wind electricity generation contributing to produce<br />
about 0.82 M CERs (Certified Emission Reductions). Energy projects also include 3<br />
hydropower projects and the rest are mainly fuel switching projects. Note that accepted<br />
projects are those acquired the letter of no objection only from the Egyptian DNA to proceed<br />
with projects CDM qualification process while approved projects have acquired letter of<br />
approval of the DNA to present the project for registration (either registered or not). It should<br />
be noted that CDM revenues from selling CERs in RE and wind projects contributed to a<br />
limited extent in narrowing the gap between wind generated kWh cost and the conventionally<br />
generated kWh unlike, e.g. N2O abatement projects. In the general practice in Egypt, CERs<br />
revenues cannot solely close the gap between the cost of wind-generated kWh and that of<br />
conventional.
Order and<br />
Name of<br />
<strong>Plan</strong>t<br />
Zafarana<br />
(1)<br />
Zafarana<br />
(2)<br />
Zafarana<br />
(3)<br />
Wind Power <strong>Plan</strong>t<br />
Capacity and<br />
Cooperating Entity<br />
30 MW phase (1) of<br />
cooperation with<br />
DANIDA<br />
33 MW phase (1) of<br />
cooperation with kfw<br />
30 MW phase (2) of<br />
cooperation with<br />
DANIDA<br />
47 MW phase (2 & 3) of<br />
EGYPT - National study<br />
Table 13 Evolution of Wind Power <strong>Plan</strong>ts Projects together with its investment schemes at Zafarana<br />
Investment cost and its Currency Foreign Financing<br />
and Currency<br />
Local<br />
Works in<br />
LE<br />
Imported Equipment<br />
and its Currency<br />
9 Million 203 Danish Krone 203<br />
DK<br />
22 Million 50 Million D. Mark 15 M<br />
DM<br />
10.6<br />
183.6 DK 31.6<br />
Million<br />
DK<br />
Grant Loan Interest<br />
Rate %<br />
35<br />
DM<br />
152<br />
DK<br />
Conditions of Loan Commissioning Date<br />
Repayment Period<br />
Total Period Grace<br />
Period<br />
- - Dec. 2000<br />
0.75 40 years 10 years March 2001<br />
0 10 years 0.5 years Dec. 2003<br />
Zafarana<br />
33.8 36.6 Million Euro 10M 26.6 M 0.75 40 years 10 years June 2004<br />
(4) cooperation with kfw Million<br />
Euro Euro<br />
Zafarana 85 MW in cooperation 107 Million 58 M Euro including - 58 M<br />
Dec. 2006<br />
(5)<br />
with Spain<br />
- soft loan 35 M Euro –<br />
Euro<br />
60%<br />
- Commercial loan 23 M<br />
0.3 31 years 10 years<br />
Euro– 40%<br />
4.11 9 years 0.5 year<br />
Note that for the local investment it is always supported by NREA through loans from the Egyptian National Investment Bank (NIB) with common financing conditions for loans in<br />
Egyptian Pounds (L.E) of 13% annual interest rate and 10 years repayment period including 2 years of grace period<br />
1 US$= 5.7 LE and 1 euro = 7.5 LE<br />
273
274<br />
ENERGY AND SUSTAINABLE DEVELOPMENT IN THE MEDITERRANEAN<br />
2.3 Energy E f fi ciency E vo l u ti on – decoupling<br />
2.3.1 Overview<br />
Energy is one of the most fundamental drivers of social and economic development in<br />
developing countries like Egypt. Each radical innovation, incremental improvement or new<br />
deployment of any technology has a strong impact on both energy supply and demand<br />
planning approaches. One recent and clear example of such an impact could be seen in<br />
Egypt by the suddenly striking increase in electricity demand due to the large penetration of<br />
air conditioning units particularly during the summer months for the last few years Peak<br />
electricity demand during summer started to be a seasonal "headache" for the electricity<br />
sector in Egypt that needs a lot of preparedness and readiness.<br />
The ratio between the primary energy consumption growth rate and the GDP growth rate in<br />
Egypt for the last 25 years is ranging from 0.9 to 1.1. This ratio means that both energy<br />
consumption and economy growth in Egypt are strongly coupled together. It also means that<br />
in Egypt, the energy intensity measured in terms of energy use per dollar of GDP (which is a<br />
measure for the economic effectiveness of the energy) is quasi-constant with a fluctuation of<br />
±10%. This specific characteristic of the energy intensity in Egypt is elaborated in more<br />
details in 2.3.2.<br />
The decoupling of energy growth and economic growth is an important factor for the future to<br />
put Egypt on a sustainable energy path. The whole nation has to work hard on improving<br />
energy efficiency and increasing economic productivity. This should be translated in higher<br />
annual GDP growth rate than the related annual energy growth rate. At that time we may<br />
expect a decupling between RUE and economic growth.<br />
2.3.2 Total energy intensity (Indicator: ENE_P01)<br />
Table 14 shows the evolution of the energy intensity since 1981/82 till 2004/05. It is quite<br />
clear as it has been mentioned in 2.3.1 that energy intensity is quasi-constant at 0.19 Kgoe/<br />
$ PPP 2000 with a variation of ±10% with a minimum of 0.17 in 1981/82 and a maximum of<br />
0.21 in 1990/91 and 2004/05. There is no clear trend of improvement in Energy intensity on<br />
the national level.<br />
The sectoral energy intensity is not possible to be evaluated as the added value of each<br />
sector in the GDP calculated with PPPs is not available.<br />
Table 14 Evolution of the energy intensity (1981 – 2005)<br />
81/82 90/91 95/96 96/97 97/98 98/99 99/00 00/01 01/02 02/03 03/04 04/05<br />
GDP 1 (billion<br />
US$ PPP<br />
2000) 102.99 161.33 185.14 193.47 203.27 215.50 229.23 242.17 250.08 260.66 269.56 280.96<br />
Energy<br />
consumption 2<br />
(mtoe)<br />
Energy<br />
intensity<br />
(Kgoe/$ppp20<br />
17.51 33.88 35.84 36.69 39.95 42.19 44.06 46.56 48.27 50.53 51.42 58.52<br />
00) 0.17 0.21 0.19 0.19 0.20 0.20 0.19 0.19 0.19 0.19 0.19 0.21<br />
1: Source World Bank data<br />
2: Source Organization for energy planning (OEP)<br />
The analysis of this situation of the energy intensity in Egypt is rather complicated; however,<br />
we are giving some possible reasons for it as follows:<br />
Generic reasons:<br />
Energy subsidies do not give the right signal to consumers.<br />
The absence of a national integrated energy strategy with quantitative objectives for<br />
RUE.<br />
The non existence of a dedicated national agency or institution for RUE, RUE policy,<br />
objectives and quantitative targets, regulations, legislations, incentives, R&D programs,<br />
and allocated budget.
EGYPT - National study<br />
Announcing the adoption of RUE practices without translating it into concrete monitored<br />
plans of actions on the national level.<br />
Information on GDP is not accurate and very different from a source to the other.<br />
Information on primary energy consumption is also variable between sources and there is<br />
no mean to double-check it, our national source is the annual reports of OEP.<br />
Particular reasons:<br />
The minimal effect of the previous scattered non-sustainable efforts in the field of RUE.<br />
Those efforts only led to implement pilot projects without actual replication or impacts on<br />
energy consumption patterns related to produced services or goods.<br />
The high implementation rate of additional new energy intensive heavy industries (mainly<br />
cement, iron and steal, and fertilizers) with their high-energy intensity masked any<br />
improvement in other less energy intensive industries due to the modernization of the old<br />
manufacturing facilities.<br />
The decrease during the last 10 years of the share of the final energy consumed in the<br />
industrial sector which generates income (from 50% in 95/96 to 47% in 04/05) to the<br />
benefit of the residential sector which normally generates much less or even no income<br />
(from 7.35% in 95/96 to 10.78% in 04/05). This shift of consumption works against<br />
improving the energy intensity.<br />
2.3.3 Efficiency of electric energy conversion and distrib ution (Indicator:<br />
ENE_C03)<br />
Efficiency of electricity production from fossil fuels:<br />
The fuel specific consumption has decreased from 346 goe/KWh (gram oil equivalent per<br />
KWh) for the year 1981/82 to only 226 goe/KWh in 2005/06 with an average annual<br />
decrease of 1.7%. This energy conversion efficiency improvement is due to:<br />
Rehabilitation of old power stations<br />
Adding 35% of the existing installed capacity during the last 10 years with modern power<br />
stations having large modular capacity.<br />
Most of new power stations are combined cycle gas turbines with high conversion<br />
efficiency.<br />
Switching all existing steam power plants to have dual firing (natural gas/heavy fuel oil)<br />
Efficiency of electricity transport and distribution<br />
The ratio of transmission and distribution losses has decreased from 18% in 1981/82 to only<br />
12% for the year 2005/06. This improvement was reached through the rehabilitation of<br />
transmission and distribution networks.<br />
2.4 Renew able Ene rgy E vo l u ti on<br />
Wind Electricity Generation Evolution<br />
275
276<br />
ENERGY AND SUSTAINABLE DEVELOPMENT IN THE MEDITERRANEAN<br />
Table 15 shows wind power plants installed capacity evolution since 2000 until 2006 along<br />
with electricity generated; and planned installed capacity until 2010 along with forecasted<br />
electric energy generation and the percentage of RE to the overall electricity generation in<br />
the national grid.<br />
Such wind power plants have been achieved / are planned by year 2010, in cooperation with<br />
DANIDA of Denmark (180 MW), KFW of Germany (240MW), Spain (85MW) and JBIC of<br />
Japan (340MW).
EGYPT - National study<br />
Table 15 Evolution of Wind Power <strong>Plan</strong>ts Installed Capacity from 2000 Till 2010 (Historic, Present &<br />
<strong>Plan</strong>ned) and Corresponding Electricity Generation (Past, Present & Forecasted)<br />
Year<br />
2000 2001 2002 2003 2004 2005 2006 2 2007 2008 2009 2010<br />
Yearly Installed Wind<br />
Capacity<br />
30 33 - 30 47 - 85 80 120 200 220<br />
Wind total Installed<br />
Capacity (MW)<br />
35 68 68 98 145 145 230 425 550 630 850<br />
Population (millions) 67.3 68.6 69.9 71.3 72.6 73.9 75.3 76.5 77.7 78.9 80.2<br />
Installed wind capacity<br />
per Capita (ENE_C02)<br />
in Watt/capita<br />
0.52 0.99 0.97 1.37 2.00 1.96 3.05 5.56 7.08 7.98 10.60<br />
Corresponding<br />
Electricity Generation<br />
(GWh)<br />
32.2 1 233 213.2 324.1 520.1 510.2 681.3 1600 2050 2350 3200<br />
Total Grid Generation<br />
(TWh)<br />
75.9 80.8 85.7 91.5 94.9 101 108.4 115.6 123.1 131.2 139.6<br />
Percentage of Wind<br />
Generation to Grid<br />
Electricity Generation<br />
(ENE_P02)<br />
0.04 0.29 0.25 0.35 0.55 0.51 0.63 1.38 1.67 1.79 2.29<br />
1: It should be noted that the wind power plant enters the service gradually in phases during the year where<br />
capacity additions are made.<br />
2: Data for 2006 and onward are estimated.<br />
Domestic Solar Water Heating Systems Market Evolution<br />
Presently, some new cities and camping sites are using Domestic Solar Water Heating<br />
systems (DSWH). Our estimate is that 200.000 “DSWH” systems at least are operative in<br />
Egypt in 2005, which may differ with announced figures.<br />
NREA is mandated to provide technical expertise and services for the design, testing,<br />
development, applications and supervision of Solar Water Heating System. Nine companies<br />
are currently active in the field of production, design, manufacture and installation of DSWH.<br />
Solar water heating systems market evolution since their introduction to the Egyptian market<br />
in 1980 is characterized by the following periods:<br />
1980 to 1987<br />
This was the period when the activity started and the slow rate of market penetration was<br />
remarked. Average annual production rate varied from 2000 to 5000 units on the national<br />
level.<br />
1988 to 1993<br />
A quantum leap took place in production rates. This was mainly because of the<br />
implementation of the ministerial decree for mandatory use of DSWH systems in new cities.<br />
Average annual production rates ranged from 5000 to 12000 units on the national level.<br />
1994 to 1997<br />
Noticeable reduction in production rates had taken place because of some technical and<br />
administrative problems led to loss of trust in DSWH where the ministerial decree for<br />
mandatory use of DSWH in new cities was no longer applied. Average annual production<br />
capacities shrink to be in the range of 2000 to 4000 units allover the country.<br />
1998 to 2000<br />
Relative increase in the production rates due to the technical problems being partially solved<br />
along with system guarantee and the expansion of new tourist villages in Egypt. Annual<br />
production rates from were evaluated to be 3000 to 6000 units on the national level.<br />
2000 to 2005<br />
This period reflected a stable market size with relative decrease in the production rates.<br />
Annual production rates were ranging from 2500 to 5000 units.<br />
277
Photovoltaic Utilization Evolution<br />
278<br />
ENERGY AND SUSTAINABLE DEVELOPMENT IN THE MEDITERRANEAN<br />
The present PV installed capacity of for various applications is estimated to be about 5 MW<br />
peak or even more.<br />
Though a very reliable energy source, PV produced kWh is one of the most expensive<br />
among different RE sources. Nevertheless, it should be quite feasible for specific loads,<br />
mainly small, isolated and remote loads far from the electric grid. The west desert area of<br />
Egypt, about 95% or more, have offered an opportunity for PV implementation in such loads,<br />
including telecommunication systems representing, 32% of total installed capacity,<br />
advertising lighting of 24% and cell phone networks of 12%, where such loads represent<br />
around 70% of total installed capacity. As the PV market is dominated by few private sector<br />
companies, it is difficult to indicate a historical track of PV utilization at a reasonable degree<br />
of accuracy.<br />
Analysis of the Impact of Policy on Progress Achieved<br />
The declared policy of meeting 3% electric demand by 2010 has a clear positive impact<br />
on the remarkable progress achieved in Egypt of grid – connected wind electricity<br />
generation.<br />
Another very important factor for the fast progress of wind energy is the worldwide vast<br />
and rapid increase in wind power systems installed capacity which had a two fold positive<br />
impact:<br />
1) Price reductions trend – until 2006 – of equipment cost bringing it close to conventional<br />
energy cost, through benefiting from economy of scale and development efforts.<br />
2) The great willingness of both main wind systems manufacturers, and leading countries in<br />
wind wide spread use and manufacture, to cooperate with Egypt, namely Germany,<br />
Denmark and Spain, followed by Japan.<br />
The elaborate wind resource assessment conducted in Egypt since mid 1980s hence<br />
the 1990s indicated the availability of one of the best wind potentials worldwide<br />
entailing high potential for successful implementation and better economics of use.<br />
Willingness of cooperating developed countries to offer soft loans and other financing<br />
facilities for the benefit of both sides.<br />
However, it should be noted that subsidized conventional energy prices have had,<br />
nevertheless, a negative impact on wind utilization in Egypt, though to a lesser extent<br />
than PV and domestic solar water heating as will be elaborated later.<br />
Main obstacles Identified and Encountered<br />
Barriers confronting RE wide spread utilization and hindering large scale implementation are:<br />
1) Economic and Financial Barriers<br />
This is the most significant barrier. A key element in such barrier is the subsidized<br />
conventional energy prices including oil products, natural gas and electricity.<br />
To illustrate such effect even on the most promising RE resource, wind, we would point<br />
out that the price or tariff EETC and EEHC are willing to pay for the wind kWh is<br />
equivalent to the avoided or saved cost of thermal power generation due to the use of<br />
wind energy. The saved or avoided cost of thermal power generation will be translated<br />
briefly in the avoided cost of fuel, mainly natural gas used to produce more than 90% of<br />
annual electric generation, and the avoided cost of installed thermal power plants<br />
capacity taken out of generation expansion plans due to the use of wind power<br />
generation. We should indicate that the wind capacity credit or the equivalent<br />
conventional thermal installed capacity to wind one is between 25 – 40% of wind<br />
installed capacity due to the intermittent and stochastic nature of wind one. Accordingly,<br />
most of the avoided cost will be attributed to fuel saving rather than capacity credit.<br />
Natural gas tariff for power stations is in the order of 1 US $/million BTU while the<br />
international price is in the order of 4 to 5.5 US$ / million BTU. The implication of that<br />
issue is that subsidized NG price will have a major negative impact on the tariff EETC is<br />
willing to pay for the wind generated KWh. The present tariff paid by EETC is 12 piasters<br />
per KWh in addition 2 piasters paid by the RE fund and also 2 to 4 piasters per KWh
EGYPT - National study<br />
from CERs revenues (CERs revenues estimated at 5 – 10 €/ton CO2) adding up to 16 to<br />
18 piasters, which is still lower than the leveled cost of wind generated KWh reaching at<br />
least 20 piasters/KWh even with favorable financing facilities.<br />
For domestic solar water heating, also subsidized natural gas prices have a direct<br />
negative impact, as most of the residential buildings in Cairo as well as in many others of<br />
the major cities in Egypt are supplied with NG through a rapidly expanding network.<br />
Further more, the investment cost of RE systems and project in general is considerably<br />
higher than that of conventional systems which would be compensated by much lower<br />
running cost due to absence of fuel consumption. Lower conventional energy prices will<br />
reduce such favorable advantage of solar water heaters. On the other hand, lower<br />
income consumers would rather prefer to pay lower upfront investment cost for<br />
conventional water heaters even with more running cost except it there are long term<br />
soft loan available for them to purchase higher upfront or equipment cost solar water<br />
heaters, which is still in the development phase in Egypt.<br />
As a matter of fact the issue of energy subsidies are complicated and politically sensitive<br />
as any energy price raise and repercussion on almost all other commodities and hence<br />
the whole national economy. However, at present, the government has a policy to<br />
removing subsidies energy albeit cautiously and slowly.<br />
2) Legal Context and Legislative Barriers<br />
Up till now there is no clear well defined legislation supporting neither RUE nor RE<br />
utilization. However, what mentioned in 2.1.2 about the electricity and energy act<br />
currently under consideration would offer a step forward in the direction of supporting<br />
RUE/RE utilization.<br />
3) Technical Barriers<br />
The absence or weak enforcement of standards and codes represent an obstacle to RE<br />
wide spread use. The use of lower quality RE systems will bring bad reputation to RE<br />
equipment as the case of domestic solar water as mentioned in 2.2.2. Lack of after sales<br />
service particularly adequate maintenance will have the same negative effect as the<br />
case of domestic solar water heaters.<br />
4) Institutional Barriers<br />
Energy issues are being taken care of by the two main energy ministries, MOEE and<br />
MOP. Necessary and even indispensable coordination were handled to a limited extent<br />
either directly or by the OEP affiliated to MOP particularly when both the Supreme<br />
Councils for Energy and Renewable Energy became inactive in the late 1980s. Late<br />
2006 the OEP ceased to exist. This situation may explain, among other things, reasons<br />
for the non existence of a national strategy for RUE with quantifiable targets. It is hoped<br />
that this situation will improve with the advent of the newly formed Supreme Council of<br />
Energy headed by the prime minister.<br />
5) Market Barriers<br />
Market barriers have become a major issue very recently during year 2006. Before that<br />
date, there was a continuous and even persistent trend of market price reductions for RE<br />
equipment and systems, e.g., price per MW of wind or per watt peak of PV, etc, leading<br />
to decline in cost of investment in RE systems. That trend, coupled with continued<br />
increase of productivity, yielded a decreasing trend in the leveled cost of kWh or unit of<br />
energy produced from RE systems over their expected life time.<br />
During 2006, particularly in the 2 nd half, market prices of RE equipment started to rise<br />
quite significantly and revealed currently in March 2006 an increase reaching 60%<br />
sometimes. As an example, the price of (1) MW installed of wind power systems reached<br />
as low as 900 thousand Euros during 2005, while now it reached 1.4 Million Euros or<br />
even more. Solar thermal power generation systems as well as photovoltaic systems<br />
experienced more or less the same market price increase. Reasons are not completely<br />
known, however, the recurrent steep increases of cost of barrel of oil and cost of natural<br />
gas which have in turn further stimulated RE systems utilization, would be one logical<br />
explanation. The increasing demand on RE equipment made most manufacturers unable<br />
279
280<br />
ENERGY AND SUSTAINABLE DEVELOPMENT IN THE MEDITERRANEAN<br />
to meet the demand except within extended time schedules that would tend to<br />
exacerbate the problem and increase the prices even more. This situation has led some<br />
financing institutions to adapt the attitude of “wait and see”.<br />
Some RE experts and economists expect this situation to continue until 2010 then<br />
reverse back to the old trend of market decrease. However, the implications of such<br />
situation is that many RE development plans and their objectives are uncertain where<br />
planners may have to review their earlier set ambitions targets; Egypt would be one of<br />
those planners.<br />
6) Awareness and Information Dissemination Barrier<br />
The information dissemination programs, awareness raising campaigns, different training<br />
programs as well as seminars and workshops conducted by NREA to spread the<br />
knowledge of advantages and feasibility of using RE systems, have contributed<br />
positively to create a fair base of interested personnel at different levels starting from<br />
expert to end users and even the general public. Nevertheless, there is still a lot to be<br />
done as the awareness of RE importance is still lower than what needed to foster ever<br />
growing interest in RE utilization.<br />
2.5 Existing or expecte d effects and bene f its of R UE and RE<br />
2.5.1 Existing or expected effects and benefits of RUE<br />
As it has been mentioned before, existing effects of RUE are very limited and it would be<br />
difficult to evaluate its impacts on the national level. Through different personal meetings with<br />
concerned persons on the demand side of the energy chain in Egypt, different expert<br />
judgments are estimating that accumulated existing scattered RUE measures have a saving<br />
effect of between 0.5% to 1% of annual primary energy consumption which would be<br />
amounted to about 300,000 to 600,000 (toe) for the year 2005/06 with CO2 equivalent<br />
avoidance between 0.8 to 1.6 million tons of CO2 equivalent for the same year.<br />
Other effects on job creation, international trade, technology transfer, R&D, business<br />
competitiveness, and reduction of poverty are very modest and difficult to evaluate or even to<br />
estimate within the scope of this limited study.<br />
Expected effects and benefits are, of course, tremendous as technical, economical, and<br />
market potentials for RUE equipment and services are very high in Egypt as it was<br />
mentioned before. However, the evaluation of these effects is directly related to the national<br />
plan that should be set with quantitative measurable targets together with the implementation<br />
of the enabling mechanisms that would put such plan into realization. This will be elaborated<br />
in more details in part 4.<br />
2.5.2 Existing or expected effects and benefits of RE<br />
The existing 230 Mw wind power plants are saving about 0.18 (mtoe) annually and avoiding<br />
CO2 emissions by about 0.49 million tons annually. The short term plan aims at having an<br />
accumulated installed capacity of 850 MW of wind power plants by 2010 which would save<br />
almost 0.75 mtoe annually and avoiding CO2 emission by about 2 million tons.<br />
The long term wind power plan targets a cumulative installed capacity of 3000 MW by the<br />
year 2021/22 which would save near 3 mtoe annually and avoiding CO2 emission estimated<br />
at about 8 million tons. One has to notice that about 25% of the wind plant is locally<br />
manufactured, while plans target reaching at least 50% by 2017.<br />
The saved fuel is mainly NG presently fueling 90% of existing thermal power plants at 1<br />
US$/million BTU paid by the electricity sector. This saved amount is expected to be exported<br />
at international prices of 4 to 5.5 US$/million BTU.<br />
The 150 MW integrated solar combined cycle power plant which is planned to be operational<br />
by 2010 is expected to have a solar fraction of only 6.6% which will represent a fuel saving of<br />
.01 mtoe annually, and avoiding emissions of 0.027 mtCO2 annually. It is planned to install<br />
two other similar plant of 300 MW each with a higher solar fraction.
EGYPT - National study<br />
The existing solar water heaters estimated at 200,000 systems are estimated to save about<br />
0.085 mtoe annually corresponding to CO2 emission avoidance of 0.29 million tons.<br />
PV applications of about 5.2 MW peak are saving about 0.005 mtoe annually avoiding 0.014<br />
million tCO2 emissions each year.<br />
The wind activities in Egypt contributed positively to technology transfer, R&D, job creation,<br />
business competitiveness, and creation of new technological field with related capacity<br />
building of experts. It should be also noted that solar water heaters activities stimulated the<br />
inception of 9 new manufacturing companies. O&M of the exiting 230 MW wind are almost<br />
fully handled by Egyptian staff.<br />
Table 13 shows cumulative investment (ENE_C08) in the existing 230 Mw wind plants until<br />
2006.<br />
3. Examples of Good Practice (case studies)<br />
3.1 Case stud y o n: Energy E f ficienc y L abe ling (E EL) fo r<br />
h o usehol d appliances<br />
Overview on EEL for household appliances<br />
Conceptually, energy-efficiency labels and standards can be applied to any product that<br />
consumes energy, directly or indirectly, as it provides its services. The national benefits of<br />
labels and standards applied to the most prevalent and energy-intensive appliances, such as<br />
household refrigerators, air conditioners, water heaters and electronic equipment, are,<br />
initially, generally substantially higher than the cost of implementing the labels and standards<br />
programs and producing the efficient products. The stringency of initial standards is typically<br />
ratcheted up over time to accelerate the adoption of new technology in the marketplace, and<br />
the threshold criteria for endorsement labels are similarly raised over time. Likewise, the<br />
bandwidth or definition of categories for comparison labels is updated over the years. The<br />
need for periodic ratcheting and the cost effectiveness of any increases in standards levels<br />
will be uniquely determined for any product by the rate at which new technology is developed<br />
and the rate at which manufacturers voluntarily invest to incorporate this new technology into<br />
their product lines. The benefits from labels or standards for less common or less energyintensive<br />
products, such as toasters, are often too small to justify the costs.<br />
Development of EEL within the activities of the energy efficiency improvement in<br />
Egypt<br />
EEL was one of the objectives of the Energy Efficiency Improvement and Gas Reduction<br />
(EEIGGR) project in cooperation with the Organization for Energy <strong>Plan</strong>ning (OEP).<br />
To start the project effectively, OEP organized and hosted a series of hearing sessions with<br />
the manufacturers and some other concerned stakeholders including the Egyptian<br />
Organizations for Standards (EOS). The main objectives of these sessions were to<br />
demonstrate the concept of energy efficiency standards, to provide information on technical<br />
and logistical requirements for energy efficiency standards, and to activate the interaction<br />
between the participating stakeholders. The sessions also included a fully interactive<br />
discussion, where the participants exchanged views and priorities regarding the product<br />
coverage, efficiency levels, testing methods, and labeling of the target appliances.<br />
1) Selection of targeted equipment<br />
As it can be seen from tables (1.7 and 1.8), the residential sector in Egypt has the<br />
highest share in electric energy consumption (37%). It also has the highest average<br />
annual growth rate during the last 25 years (9.4%). Based on residential energy<br />
consumption pattern surveys, electricity consumption of household appliances<br />
represents about 70-80% of the residential electricity consumption, i.e. these appliances<br />
consume about 25-30 % of the total electricity consumption in Egypt.<br />
To identify the targeted appliances, a group of selection criteria was set to determine the<br />
targeted appliances. Some of these criteria are; degree of saturation, energy<br />
consumption, replacement & growth rates and potential saving for each appliance.<br />
281
282<br />
ENERGY AND SUSTAINABLE DEVELOPMENT IN THE MEDITERRANEAN<br />
Based on these criteria the most promising appliances were room air conditioners,<br />
refrigerators, and automatic cloth washing machines.<br />
2) Assessment of the local manufacturing capacity<br />
A local manufacturer‟s survey was performed to get more information about the local<br />
products models, quantities and specifications. It also assessed the local manufacturer's<br />
capabilities regarding the proposed standards, exporting opportunities, applied tests, and<br />
testing facility capabilities. In parallel, the international energy efficiency standards and<br />
programs were reviewed, where many lessons were learned. .<br />
Concerning refrigerators, it was found that the energy consumption levels in (KWh) of<br />
the locally produced refrigerators were found nearly doubled the value of the same<br />
capacities that are internationally produced. The annual electricity consumption per one<br />
liter of the adjusted volume for the Egyptian produced refrigerators came in the order of<br />
about 2.69, 2.13, and 2.84 kWh for manual defrost, automatic defrost, and no frost<br />
refrigerators respectively.<br />
Regarding washing machines, the energy consumption levels of the locally produced<br />
washing machines were found quite competitive with those internationally produced. The<br />
horizontal-axis (front-loading) features of the locally produced refrigerators were one of<br />
the effective factors that create that good competing capability. Not only this, but<br />
fortunately the manufactured units in Egypt were found leading those internationally<br />
produced, especially for the new configuration that are characterized by the jet pumping<br />
system that accounts for about 20% reduction in the consumption levels compared with<br />
the traditional automatic washing machines. The cycle electricity consumption of the<br />
local machines for one Kilogram cloth loading came in the order of about 0.2, and 0.24<br />
KWh for Jet-type, and traditional automatic washing machines respectively.<br />
Concerning Room Air-Conditioners, it was found that two main types exist in the local<br />
market; the window and the split configuration. The energy consumption levels of the<br />
local air-conditioners were found close enough compared with the same levels of the<br />
internationally produced conditioners. This positive situation resulted due to different<br />
effects; out of them came the challenging competitiveness and the exportation ambition<br />
of the private sector manufacturers as well as the international license acquired by the<br />
local manufacturers. For the vast capacity range of the locally produced conditioners, the<br />
energy efficiency ratios EER (that reflect electric consumption levels) ranges around the<br />
values of 9 for either the Window or Split units respectively.<br />
3) Developing energy efficiency standards<br />
The Canadian and European efficiency standards of the selected appliances were<br />
reviewed. Based on them an Egyptian standards draft had been developed and with<br />
concerned stakeholders including representatives from universities, manufacturers, as<br />
well as the local consultants.<br />
The first mandatory energy efficiency standards in Egypt were approved for refrigerators<br />
and room air conditioners in 2002, and followed by the automatic clothes washers‟<br />
standard in 2003. The standard energy consumption limits are justified based on<br />
technical and economical analysis for the improvement technologies. In addition, these<br />
limits will be subjected to a periodical review and update every two years to keep pace<br />
with technological improvements and to meet the energy sector needs.<br />
The main features of the Egyptian energy efficiency standards are summarized as follows:<br />
Energy Efficiency Standards for Refrigerators<br />
The standard is applied for all electrical refrigerators, refrigerator-freezer, and freezers up<br />
to 28 ft3 adjusted volume.<br />
Energy performance requirements, includes the test procedures, test conditions, and<br />
standard limits. These limits that were estimated through a linear relation between the<br />
consumed energy against refrigerator-adjusted volume (AV) are published as the<br />
maximum energy consumption in (kWh). The consumption limits for each refrigerator type<br />
are classified according to the following equations;
EGYPT - National study<br />
For Manual refrigerators 0.48*AV + 784<br />
For De-frost refrigerators 0.37*AV + 721<br />
For No-frost refrigerators 0.57*AV + 1130<br />
Energy Efficiency Standards for Air-Conditioners<br />
The standard is applied for non-ducted room air conditioners (window – split) units. It is<br />
valid for (both local manufactured and imported units) the window units up to 36000<br />
Btu/hr cooling capacity, and up to 65000 Btu/hr for split units.<br />
Energy performance requirements, includes the test procedures, test conditions, and<br />
minimum limits for energy efficiency ratio (EER) which is measured in Btu/Wh. These<br />
limits are 8.5 EER for the window units, 9 EER for the split unit.<br />
Energy Efficiency Standards for Washing Machines<br />
The standard is applied for automatic and semi-automatic cloth washing machines that<br />
have capacities up to 10 kg of the dry washing load.<br />
Energy performance requirements, includes the test procedures, test conditions, and the<br />
minimum energy consumption levels. These consumption levels that represent the<br />
maximum energy consumption per cycle are measured in kWh/cycle/kg. The energy<br />
consumption level has a maximum value of 0.26 kWh/cycle/kg, where this value is<br />
intended to be modified to have a value of 0.2 kWh/cycle/kg in few years.<br />
4) Assessing technology improvement options<br />
To up grade the local manufacturers' capabilities to transfer into high-efficient appliances<br />
complying with the new standards, the following procedure had been adopted benefiting<br />
of technical support from international experts:<br />
Review of international experiences<br />
This has taken place through literature review and some visits to foreign countries to get<br />
acquainted with national experience in this field.<br />
Review of national capabilities<br />
Different test and measurements has been performed in different factories of the targeted<br />
appliances. These conducted tests and procedures that relied-upon international<br />
experiences assigned for each appliance, considered the specific conditions that<br />
characterize the Egyptian context and production capabilities, aiming to demonstrate the<br />
impact each improvement option will affect. For refrigerators for example, testing results<br />
revealed achieving an accumulated electricity savings of not less than 30% compared with<br />
the base case unit with an incremental cost of about 15%.<br />
5) Developing a standards' impact assessment survey<br />
During the year 2002, a survey was elaborated with the objective of assessing the<br />
techno-economical impacts of applying the EE standards of the selected residential<br />
appliances. The entire expected electricity savings due to applying the energy efficiency<br />
standards of the three selected appliances were found accounting for about 129 million<br />
kWh by the year 2005, which is a quite remarkable figure that deserves to be<br />
considered. Consequently, a strategy and recommendation plan must be set and<br />
enforced to ensure that local manufacturers will be able in the future to produce and (or)<br />
assemble appliances that comply with the released Egyptian efficiency standards.<br />
283
284<br />
ENERGY AND SUSTAINABLE DEVELOPMENT IN THE MEDITERRANEAN<br />
Figure 6 Expected annual electric energy savings in million KWh<br />
6) Designing and issuing the EEL<br />
Energy efficiency label is what consumers actually see when they go to purchase an<br />
appliance. It provides consumers with information to make informed choices,<br />
encourages manufacturers to improve the energy performance of their models, and<br />
encourages distributors & retailers to display efficient products. The selected label format<br />
was of a horizontal graduated bar design starting from letter (A) and ending by letter (E).<br />
The grade (A) of the green color represent the highest efficient product in the local<br />
market, while the red grade (E) presents lowest efficient product, in addition to identifying<br />
the monthly energy consumption of the model.<br />
Figure 7 EEL (from the left for washing machines, window air conditioners, and refrigerators)<br />
7) Installing accreted testing facilities<br />
A survey on existing local testing facilities revealed that there is no one complete testing<br />
facility that has capabilities for testing the three target appliances for the energyefficiency<br />
concern, whereas few of the local manufacturers has testing capabilities,<br />
which were of quality level enables to perform the necessary tests. The manufacturers<br />
that mainly carry out performance tests have fairly good capabilities to achieve the<br />
targeted energy efficiency tests. In addition, all stakeholders assured the necessity for<br />
existing neutral testing labs that must be more qualified than those owned by the local<br />
manufacturers so as to be able to actually judge and manage testing results in an<br />
integral authorized manner.
EGYPT - National study<br />
The Government of Egypt had succeeded in obtaining a fund from the UNDP Thematic<br />
Trust Fund for the establishment of an accredited energy efficiency testing laboratory to<br />
support the national energy efficiency standards and labeling program. This fund has<br />
been utilized to upgrade the existing testing facility at the New and Renewable Energy<br />
Authority (NREA) in order to be capable of performing necessary energy efficiency tests.<br />
The energy efficiency testing laboratories for the washing machines and the refrigerators<br />
have been accomplished and ready for testing since 2005. However, the one for air<br />
conditioners was already operational during late 2006.<br />
8) Assessment of the young Egyptian experience in the field of EEL<br />
Based on the short experience acquired in the Egyptian market, we can mention the<br />
following remarks:<br />
Low market understanding of label objectives<br />
Low consumer awareness of label<br />
Low supplier trust of compliance with announced labels and standards<br />
Low retailer understanding and promotion of labels and high efficient products<br />
Lack of base line data on consumers' preferences<br />
Lack of base line data on suppliers' compliance<br />
3.2 The case study on "E g yp t ' s Wind Resource As sessment"<br />
Meteorological parameters have been addressed by the Egyptian Meteorological Authority<br />
since 1930s at different details. Variables such as pressure distribution and general<br />
circulation, solar radiation, sunshine duration hours, cloud cover, temperature, precipitation<br />
and rainfall, snow, hail, thunder storms, evaporation, relative humidity and surface wind were<br />
fairly addressed.<br />
Oil crisis and price sharp increase in during the 1970s have fostered the growing Egyptian<br />
interest in the late 1970s of exploring renewable energies opportunities and potential<br />
utilization at larger scale than ever, that in turn resulted in including a major component for<br />
wind resource assessment within Egypt / USAID cooperation grant agreement started in<br />
1984 and named “Renewable Energy Field Testing Project”. The wind resource assessment<br />
activity started by reanalyzing and verifying the Egyptian Meteorological wind data, hence<br />
indicating the need for more elaborate and relatively thorough wind resource estimates that<br />
was achieved through the erection of a number of wind monitoring stations at key locations<br />
mainly at the Red Sea and <strong>Mediterranean</strong> Coastline. Wind measurements were carried out<br />
where collected data were analyzed along with analyzing climatological data on winds aloft<br />
and maps of pressure patterns as well as topographical maps for estimating the wind<br />
resource. Figure (1.5) shows the result of such work for wind speeds and corresponding<br />
power density distributions at 10 m height above sea level and indicating the high wind<br />
resource at the Gulf of Suez of 6.4 – 7 m/s and corresponding power density of 300 – 400<br />
w/m 2 . NREA counter part for such wind resource assessment was Batelle Northwest<br />
Laboratories of USA.<br />
Consequently, the Egypt – USAID Field Testing Project realized the first significant project;<br />
the wind farm pilot project at Ras Ghareb at the Western Bank of Gulf of Suez of 400 KW<br />
installed capacity consisting of 4 x 100 KW wind turbine units, started in February 1988, and<br />
was connected to the local electric grid of the Egyptian General Petroleum Company.<br />
In 1990, the available wind resource data deduced by the corresponding activity within NREA<br />
– USAID Renewable Energy Field Testing Project, were re-evaluated by NREA and RISO<br />
National Laboratory of Denmark, along with evaluating wind resource data made available by<br />
the Egyptian Meteorological Authority in its Climate Atlas of Egypt. The main reason for such<br />
work is the apparently promising potential of wind power generation indicated by NREA /<br />
USAID wind resource assessment concluded in 1987.<br />
NREA – Riso wind resource data survey and analysis concluded that the wind conditions in<br />
the Gulf of Suez indeed seemed very favorable but recommended to erect three more new<br />
wind monitoring stations, particularly in the most promising locations, to improve, refine and<br />
285
286<br />
ENERGY AND SUSTAINABLE DEVELOPMENT IN THE MEDITERRANEAN<br />
develop the wind resource assessment for future possible feasible utilization to establish<br />
wind farms.<br />
A grant agreement was concluded by NREA and DANIDA to develop a wind Atlas for Egypt<br />
having three main components:<br />
Component A: Wind Atlas for Gulf of Suez<br />
Component B: Preliminary Wind Atlas for Egypt<br />
Component C: Wind Atlas for Egypt<br />
“A Wind Atlas for the Gulf of Suez – Measurements and Modeling 1991 – 2001” was<br />
published by NREA and Riso in 2003, and a Preliminary Wind Atlas for Egypt was published<br />
internally by the Egyptian Meteorological Authority and Riso in 2004 where main results were<br />
contained in the third report published by NREA, Meteorological Authority and Riso in<br />
January 2006. Measurements were carried out at 24.5 meter height and wind climate in<br />
Egypt has been investigated by two different and complementary methodologies; mesoscale<br />
modeling based on long – term data reanalysis and micro scale modeling based on<br />
measurements from 30 meteorological stations. The first method would yield data on<br />
regional scale or somewhat larger areas with slightly less accuracy, and the second method<br />
would yield accurate data for smaller areas.<br />
Parameters such as terrain characteristics and topography, roughness factors and other<br />
methodological parameters were considered in the modeling to extrapolate the Wind Atlas<br />
and estimated wind speeds at 50 meters height expected to be close to wind turbines<br />
foreseen height. Figure 8 shows a map of wind resource where it indicated even<br />
considerably larger wind potential in the Gulf Suez, somewhat less potential in the<br />
<strong>Mediterranean</strong> Coast and East Oweinat in the southern part of the Egyptian Western Desert,<br />
and considerable potential in huge parts of in the Western Desert on both sides of the Nile<br />
Valley.<br />
Figure 8 shows a curve indicating wind speeds and corresponding power density at 50<br />
meters height for several wind measuring stations.
EGYPT - National study<br />
Figure 8 Wind speeds and corresponding power density at 50 meters height for several wind measuring<br />
stations.<br />
Such wind resource activities were the main motive for developing the Egyptian wind<br />
electricity generation action plan and corresponding positive response and cooperation of<br />
different European Countries as well as Japan in developing wind power plants as will be<br />
indicated in case study 3.3.<br />
3.3 The Ca se Study o n "W ind Pow er <strong>Plan</strong>ts De ve lopme n t in<br />
E g yp t "<br />
As indicated in the last case study (1), NREA wind activities have started by conducting wind<br />
resource assessments in cooperation with USAID which revealed the considerable potential<br />
Gulf of Suez in two reports published in 1986 & 1987, that in turn resulted in the realization of<br />
the first significant project in Egypt at that time in 1988; Ras Ghareb wind farm pilot project of<br />
400 kW connected to a local grid their.<br />
Published output results of promising wind resource in different locations in Egypt stimulated<br />
the following wind resource elaborate assessment started in 1990 with RISO laboratories of<br />
Denmark that has been one of leading countries in wind resource assessments and wind<br />
farms implementation.<br />
Along with the progress of such wind resource activity and consequently proven wind<br />
considerable potential in the Gulf of Suez, NREA adopted a comprehensive plan including a<br />
phased approach to implement and develop wind power plant projects.<br />
This approach started by implementing pilot and field testing projects represented by Ras<br />
Ghareb earlier mentioned wind farm of 400 kW capacity composing of 4 units each 100 kW<br />
287
288<br />
ENERGY AND SUSTAINABLE DEVELOPMENT IN THE MEDITERRANEAN<br />
capacity and an isolated 55 kW wind turbine project for ice making south of the Red Sea<br />
where such projects main objective was to test the applicability of wind projects in Egypt<br />
along with another very important objective which is to train NREA engineers and technician<br />
in wind technology. It worthwhile stressing that know-how and technology transfer along with<br />
training and capacity building have been always key elements permeating all phases of wind<br />
projects development activities.<br />
In the early 1990s a demonstration and semi commercial wind power plant project was<br />
concluded between NREA and UNIDO to support wind technology transfer which started by<br />
establishing a 400 kW wind farm in Hurghada consisting of 4 units each 100 kW partially<br />
locally manufactured in Egypt at about 50%, where the farm started operation in February<br />
1992.<br />
Along with the progress of wind resource assessment and the successful operation of wind<br />
farms, the first commercial wind power generation project started in Hurghada to support the<br />
local grid in 3 phases including:<br />
1) Establishing a 1 MW wind farm utilizing new technology of variable pitch wind turbines of<br />
100 kW with financial support of Germany.<br />
2) Establishing a 2 MW wind farm utilizing 3 blades wind turbines of 100 kW partially locally<br />
manufactured for about 50%, which started operation in August 1994.<br />
3) Establishing a 1.8 MW wind farm consisting of 6 units each 300 kW also partially locally<br />
manufactured with the financial support of Denmark through a grand, where the project<br />
started operation in June 1995.<br />
The overall installed capacity of Hurghada commercial wind farm reached 5 MW including 38<br />
wind turbine units of different technologies and support by a Wind Technology Center<br />
established in Hurghada through the financial support of Denmark to act as research, testing<br />
and training center contributing to technology transfer.<br />
The considerable success of such activities has resulted in Egypt crossing the stage of<br />
demonstration and small scale wind power projects to large scale commercial wind power<br />
project connected to the national grid which started by installing Zafarana (1) wind power<br />
plant of 30 MW in cooperation with Denmark and also elaborating the present wind power<br />
plan as indicated in part 2.<br />
4. Proposals for more sustainable energy development<br />
4.1 Sum mary o f unde r expl oi ted RUE and RE<br />
Generic overview<br />
The energy sector is still playing a vital role in Egypt's economy. However, the Egyptian<br />
government currently faces a real challenge to make a strategic choice between satisfying<br />
the ever increasing national primary energy demand (depending by more than 94% on oil<br />
and gas) that is being offered to end-users with subsidized prices, and maintaining a certain<br />
level of hard currency revenues from oil and gas exports at world prices, even with a growing<br />
risk of accelerated depletion rates of national proven reserves. As it has been discussed<br />
earlier, different scenarios expect that if current practices in the energy sector will continue<br />
as it is, Egypt will become a net oil importer during the near future which would increase the<br />
share of NG in the energy supply local matrix in addition to binding existing commitments of<br />
long term export contracts that would rather increase and accelerate reserves depletion rate.<br />
This tendency if continues should certainly lead to a non sustainable energy future that the<br />
government and citizens should work hand in hand from now to avoid its occurrence.<br />
Being aware of this fact, Egypt's energy strategic framework has adopted RE and RUE as<br />
policy options within the strategies of main organizations of the energy sector. RE received<br />
more attention and reached a reasonable level of exploitation as a specific ministry (MOEE)<br />
has abided by its responsibility and created a dedicated organization (NREA) for the<br />
development of RE national strategy and bearing the duty of its implementation. However,<br />
RUE has not yet got its sponsor "godfather" who would develop a relevant national strategy,<br />
set quantifiable objectives, propos or develop tools and legislations, monitor and follow up
EGYPT - National study<br />
achievements, and assesses impacts and accumulated experiences and lessons learned to<br />
modify and improve future plans.<br />
Furthermore, there is also an important part affecting the success of any proposed<br />
sustainable energy development approach, which is the energy end-user. All proposed<br />
policies are often drafted, revised, approved, and adopted by technocrats and professionals<br />
representing the government who are concerned mainly with the supply side of the energy.<br />
This scheme had functioned well for the conventional commercial forms of energy (being<br />
commodities) like electricity, NG, and oil products. However, the same scheme has failed to<br />
succeed in the case of RUE and non bulk RE electricity generation as in most of the cases<br />
the end-user find him self requested to get involved in a process much different from just<br />
buying a "commodity".<br />
To be successful, RUE and RE strategies together with accompanying tools and measures<br />
have to be developed through deep negotiations and intimate involvement of end-users<br />
associations.<br />
4.1.1 Under exploited RUE<br />
It could be seen from what has been presented in the previous parts of this report that the<br />
potential for RUE in Egypt is tremendous and amounted in the range of 20% to 40% of<br />
primary energy consumption. According to experts judgment appeared in this study, actual<br />
level of achievement is estimated at only from 0.5% to 1% of the annual primary energy<br />
consumption. This accomplished level is extremely low and falls below all acceptable<br />
expectations. However, different energy stakeholders claim that they include RUE measures<br />
into their plans and activities without declaring or setting quantitative measurable targets,<br />
developing appropriate measures and tools, or allocate relevant necessary funds.<br />
Previous RUE activities are presented in 2.2.1. In spite of their limited effect on the creation<br />
of local market for energy efficiency equipment and services, they have already drawn the<br />
attention of both policy makers and energy professionals to the importance of RUE for<br />
Egypt‟s energy sustainability.<br />
Those efforts were funded mainly through grant agreements with different donors and<br />
international organizations (mainly USAID, EU, and UNDP/GEF) and were carried out during<br />
different periods since 1985 till now. They were neither coordinated nor integrated under a<br />
preset RUE vision or guideline framework and were even performed as separate<br />
independent activities and executed by different national institutions. This kind of practice<br />
had minimized their impact which did not sum up into an accumulated achievements and<br />
results on the national level. All investments in the previous projects had a total of about US$<br />
100 millions and were mainly raised from grants with limited local participation.<br />
It has been proved that RUE measures technologies and processes have a high economical<br />
competitiveness compared to most relevant RE technologies and processes and in many<br />
cases more economic than adding new equivalent conventional production capacities to the<br />
supply side. However this notion is still absent in any planning practices for the expansion of<br />
the supply side capacities to meat the forecasted demand which is based on historical data.<br />
This simple straightforward supply/demand balance planning concept does not give any role<br />
for RUE to play in Egypt.<br />
Applying an integrated resource planning (IRP) approach on the national and sectoral energy<br />
levels would give an equal footing comparison between investing on adding additional supply<br />
side capacity, or investing to save the same capacity throughout applying RUE measures<br />
particularly in the energy demand side without affecting neither productivity nor level of<br />
service quality.<br />
4.1.2 Under exploited RE<br />
As mentioned above, both RUE and RE are under exploited in Egypt, however, RE is in a<br />
considerably better situation due to the existence of a declared RE strategy with quantitative<br />
targets. Also an organization (NREA) is entrusted by implementing the said RE strategy<br />
along with developing, revising and updating its objectives to adapt it to nowadays dynamic<br />
289
290<br />
ENERGY AND SUSTAINABLE DEVELOPMENT IN THE MEDITERRANEAN<br />
and rapidly changing environment, both technically and economically through action and<br />
monitoring plans.<br />
Almost all available RE resources in Egypt are under exploited at various degrees. Even for<br />
the relatively more developed, mainly wind electricity generation in view of their abundant<br />
resources and high potential of utilization. This is true and even more apparent for the other<br />
very promising resources; solar energy with its two forms or technologies of utilization; solar<br />
thermal for heating purposes as well as electricity generation; and solar photovoltaic for<br />
direct conversion to electricity.<br />
Even if this present study does not consider biomass in detail, none the less it is worthwhile<br />
pointing out its considerable potential Egypt is endowed with and amounting to 50 million ton<br />
of dry matter per year having total energy potential of 17 mtoe per year of which less than<br />
30% (i.e. about 5 mtoe/year) are currently utilized. Optimum use of biomass needs<br />
elaborated and integrated studies to avoid negative impacts on the environment. In spite of<br />
its high energy and economic value, agricultural residues in most cases are dealt with as<br />
undesirable matters and thus are being get red of by open direct burning which causes<br />
serious pollution problems like the one created from rice straw burning in the fall of each year<br />
causing black clouds over Cairo.<br />
The estimated installed domestic solar water heaters (DSWH) are 200,000 typical units (2<br />
sq. meters collector area and 150 liters storage capacity). This specific application<br />
represents a clear example of a significantly under exploited RE technology in Egypt (74<br />
million inhabitants) which have a market potential of almost 10 million typical units. This<br />
situation could be attributed to the general barrier of subsidized energy prices, in addition to<br />
other two main barriers, namely lack of manufacturing standards leading to poor<br />
performance and lack of after sales services.<br />
4.2 Proposals for a sus tainable energ y d e velopme nt<br />
4.2.1 Proposals for enhancing RUE within a national sustainable energy<br />
strategy<br />
Based on the worldwide, regional, and national increasing environmental concerns and<br />
growing gained momentum towards a global sustainable development, the need for creating<br />
regional and national ambitious but "achievable" Renewable Energy and Energy Efficiency<br />
Strategies (REEES) become of utmost importance. In the same time these strategies would<br />
have a greater chance than ever to take place because of the escalating international drive<br />
to support their development, implementation, and monitoring in order to achieve their preset<br />
quantifiable objectives. In order to benefit of this situation, each country is advised to adapt<br />
its own rational criteria in view of its local and regional context.<br />
In what concerns the proposals for enhancing RUE in both supply and demand sides within a<br />
national sustainable energy strategy and based on the past experience and lessons learned<br />
in Egypt, we are almost certain that any proposed separate future program will fail to have a<br />
landmark in the Egyptian energy scene and particularly in mobilizing the RUE market, unless<br />
it constitutes a given portion of a well defined National Energy Efficiency Strategy (NEES)<br />
that should be also a part of a more general REEES, which in turn should be an integral<br />
interactive segment or component of an Integrated National Sustainable Energy Strategy<br />
(INSES). This means that as a first step, required proposals should be directed towards the<br />
"macro" level like strategies, policies, and plans of action which should be followed by<br />
concrete actions on the "micro" level such as: energy prices, market mechanisms, availability<br />
of technologies, transfer of knowledge and skills to local ESCOs, awareness and information,<br />
financial structuring, institutional capacity building, and regulatory interventions.<br />
To start the whole process we suggest that a specialized detailed study based on a well<br />
elaborated terms of references (TOR) should be developed by an independent consulting<br />
team composed of Egyptian and international experts. The ultimate objective of this study is<br />
to develop a complete "roadmap" that draws an integral framework of necessary measures to<br />
place RUE (and possibly RE) as a cross-cutting aspect among the facets of Egypt's<br />
Sustainable Development Strategy "ESDS". This should lead to outlining the scope of work
EGYPT - National study<br />
and the development procedure of a proposed INSES out of which a detailed NEES frame<br />
work should be also elaborated together with a proposal for the creation of a relevant<br />
legislation and institutional frameworks that would enable and activate a coordinated effort<br />
for the development of the NEES as well as the responsibility of its implementation duty.<br />
Once such study would be developed, it has to be discussed in a public open debate<br />
involving all concerned stakeholders including engineering associations, consulting offices,<br />
research centers, universities and energy-end users' groups and associations. As the NEES<br />
will concern all the civil society and all the categories of end-users; their participation hand in<br />
hand with energy professionals and planners will assure the development of a well perceived<br />
strategy that every partner will feel and bear his own role into its successful realization.<br />
Another advantage from the public discussion will be the awareness and the information<br />
dissemination that will automatically accompany the debate in different media.<br />
Many of the proposed activities could probably be realized through the cooperation programs<br />
under the recently signed Egyptian European partnership agreement and particularly through<br />
the EU Energy Partnership Initiative.<br />
Lastly, RUE which has a tremendous potential in Egypt will only have its real contribution into<br />
the Egyptian and regional energy scene when a NEES will be adopted and applied in both<br />
energy demand and supply sides.<br />
4.2.2 Proposals for enhancing RE implementation as an integral part of a<br />
national sustainable energy development strategy<br />
Objectives<br />
The wind energy strategy present target is to reach 850 MW installed capacity by 2010 out of<br />
which 230 MW are already in place and operational in Zafarana site. The long term target of<br />
the strategy is to reach at least 3000 MW by 2021/22. More than 90% of the additional<br />
capacity will be installed in Gabal El Zeit area. Both sites are along Gulf of Suez.<br />
The 850 MW of wind power plants would save almost 0.75 mtoe annually and avoiding CO2<br />
emission by about 2 million tons. The cumulative installed capacity of 3000 MW by the year<br />
2021/22 would save near 3 mtoe annually (valued at US$ one billion yearly with current<br />
prices) and avoid CO2 emission estimated at about 8 million tons.<br />
If the private sector companies (both Egyptian and foreign) will get fully involved in wind<br />
energy project development through adequate incentives and market supportive<br />
mechanisms, along with subsidies removal; this would increase the 2021/22 target to 5000<br />
MW, out of which 2000 would be carried out by the private sector.<br />
For solar thermal combined cycle power plants, the strategy has an objective of 750 MW<br />
installed by 2020. And the target for solar water heating is to install 1.25 million typical<br />
DSWH by 2020, provided that a guarantee of performance would be offered.<br />
Main tools to overcome obstacles<br />
The main barrier that conventional subsidized prices adversely affecting the whole<br />
spectrum of RUE and RE applications. This barrier was addressed in 2.4. Policies for<br />
price reform and restructuring are being considered by the government. They are<br />
indispensable if wide spread use of RUE and Re is to be achieved.<br />
Creating free markets which would stimulate private sector investment in wind energy<br />
would take some time as subsidy removal is a sensitive issue that would take few years<br />
to get its actual impact. Accordingly, foreign financing assistance will continue to be<br />
needed during these years to keep the momentum for wind energy utilization and enable<br />
market liberalization smoothly.<br />
The electricity act presently under consideration should seriously consider the support of<br />
promising RE technologies mainly wind through preferential tariff and/or mandated<br />
market share.<br />
Additional legislation of custom duties exemption and reduced taxation on RE systems<br />
would prove economic feasibility and sustainability on the long run, in view of the long<br />
291
292<br />
ENERGY AND SUSTAINABLE DEVELOPMENT IN THE MEDITERRANEAN<br />
term advantages of RE (fuel saving and preserving strategic fossil fuel reserves for future<br />
generation and preserving the environment).<br />
Maximizing the use of CDM and green certificate revenues to improve the economics of<br />
RE systems.<br />
Economic and financial cost<br />
In view of the considerable recent increase in RE prices, it would be rather difficult to<br />
estimate investments needs for the planned RE capacities. However, if we consider early<br />
2006 prices that would take place starting 2010 the wind power plant strategic objective of<br />
3000 MW would need an investment of € 3 billion.<br />
Benefits<br />
Saving more fossil fuel resources that are presently threatened by rapid depletion, to be a<br />
strategic reserve for future generations and to improve energy sustainability,<br />
Contributing to the enhancement of institutional capacity building and technology transfer<br />
that deepening local manufacturing of RE, which would entail the flourishing of local<br />
industries in new areas,<br />
Increasing RE contribution to environment protection and GHG abatement in the national,<br />
regional, and global levels,<br />
Creating additional revenues from selling CERs through CDM qualification of RE projects<br />
within Kyoto protocol,<br />
Exporting RE electricity to Europe through electricity networks interconnection that are<br />
underway and getting benefit of Green Certificates scheme,<br />
Enabling the development of remote desert areas representing 95% of the country<br />
surface area, and thus alleviating over population along the River Nile and the Delta,<br />
Increasing RE contribution into job creation and added social value benefit,
5. Table of illustrations<br />
EGYPT - National study<br />
Figure 1 Egypt's Oil Production (Broken down into Exports and Domestic Consumption) ............................................................. 241<br />
Figure 2 Egypt map with a representation of the unified power system ........................................................................................ 245<br />
Figure 3 Percentage share for different sectors in GHG for the year 1990/91 .............................................................................. 256<br />
Figure 4 Installed wind power plants capacity present and planned until 2010 distributed according to cooperating<br />
countries ......................................................................................................................................................................... 263<br />
Figure 5 PV applications share .................................................................................................................................................. 264<br />
Figure 6 Expected annual electric energy savings in million KWh ................................................................................................ 283<br />
Figure 7 EEL (from the left for washing machines, window air conditioners, and refrigerators) ...................................................... 283<br />
Figure 8 Wind speeds and corresponding power density at 50 meters height for several wind measuring stations. ....................... 286<br />
Figure 9 Solar Atlas of Egypt (Global) ......................................................................................................................................... 294<br />
Figure 10 Solar Atlas of Egypt (Direct) ........................................................................................................................................ 295<br />
Figure 11 Wind power estimates ............................................................................................................................................... 296<br />
Figure 12 Wind atlas of Egypt .................................................................................................................................................... 297<br />
Table 1 Ratio of oil sector imports to oil sector exports money wise ............................................................................................ 242<br />
Table 2 Electricity exports and imports to neighboring countries ................................................................................................. 242<br />
Table 3 Summary of energy saving potential in different end-use sectors .................................................................................... 247<br />
Table 4 Percentage share of total, urban, and rural population without access to electricity ........................................................ 249<br />
Table 5 Evolution of primary energy demand by source of energy (mtoe) ..................................................................................... 250<br />
Table 6 Evolution of final energy sectoral consumption (mtoe), share and growth rate ................................................................. 250<br />
Table 7 Historical electricity peak load (MW), generation, sales and consumption by sector (GWh) .............................................. 252<br />
Table 8 Forecasted sales by sector in (GWh), total electricity generation (GWh), and peak load (MW) until 2021/22 .................... 252<br />
Table 9 Evolution of primary energy production by source of energy (mtoe) ................................................................................. 253<br />
Table 10 Electricity production structure according to type of generation from 1995/96 to 2004/05 (in TWh) ............................ 254<br />
Table 11 Oil and NG exports, imports, and consumption in mtoe and associated dependency indicator (%) for the period<br />
1996/97 to 2004/05 ..................................................................................................................................................... 255<br />
Table 12 ENE_P03 indicator expressed in Gg of CO2 equivalent total emissions from energy consumption and<br />
distribution on end-use sectors with relative percentage share of each sector ................................................................... 256<br />
Table 13 Evolution of Wind Power <strong>Plan</strong>ts Projects together with its investment schemes at Zafarana ........................................... 273<br />
Table 14 Evolution of the energy intensity (1981 – 2005) .......................................................................................................... 274<br />
Table 15 Evolution of Wind Power <strong>Plan</strong>ts Installed Capacity from 2000 Till 2010 (Historic, Present & <strong>Plan</strong>ned) and<br />
Corresponding Electricity Generation (Past, Present & Forecasted) ................................................................................... 276<br />
Table 16 Evolution current and Actual Prices Annual Rate of Increase / Decrease (-) for Natural Gas ........................................... 298<br />
Table 17 Evolution of Current and Actual Prices Annual Rate of Increase / Decrease (-) for Different Types of Petroleum<br />
Products and Their Weighted Average 1981/1982 – 2004/2005 .................................................................................... 299<br />
Table 18 Evolution of the Annual Rate of Increase / Decrease (-) of Sectoral Current Price of Electricity during<br />
1981/1982 – 2004/2005 ............................................................................................................................................. 299<br />
293
Annex I: Details of Potential for RE<br />
294<br />
ENERGY AND SUSTAINABLE DEVELOPMENT IN THE MEDITERRANEAN<br />
Solar resources potential<br />
Solar resources assessment activities have started since more than 60 years ago by the<br />
Egyptian Meteorological Authority of Egypt, hence supported by the Ministry of Electricity<br />
and Energy since 1980 and continued by NREA since its inception in 1986 in cooperation<br />
with the Meteorological Authority. In 1991 a solar Atlas for Egypt was issued, indicating<br />
that Egypt lies among the sun belt countries with annual global solar insulation ranging<br />
from 1750 to 2680 kwh/m2/year from North to South and annual direct normal solar<br />
irradiance ranging from 1970 to 3200 kwh/m2/year also from North to South with<br />
relatively steady daily profile and small variations making it very favourable for utilization.<br />
Such conditions of favourite solar resource utilization are supported by other conditions of<br />
sunshine duration ranging from 9 – 11 hours with few cloudy days over the year.<br />
Desert Areas with almost no inhabitants in Egypt exceed 90% of the country‟s area of 1<br />
million km2. Theoretically speaking, more than 900000 km2 are available for solar<br />
collectors installation. Even if we consider only 50% of the available desert land, the<br />
available potential would be very high reaching more than 3 x 10⁵ TWh yearly. One<br />
should note that such huge figure is the theoretical available solar resource but usable<br />
potential is very much dependant on many practical factors such as both economic<br />
competitiveness and technological development at least, and thus, it would be very<br />
difficult to specify an exact usable potential, however, the Egyptian solar resources is one<br />
of the best worldwide.<br />
Figure 9 and Figure 10show the Solar Atlas of Egypt depicting contours of both global<br />
and direct normal solar radiation.<br />
Wind resource Potential<br />
Wind resource measurements have started in Egypt more than 60 years ago within the<br />
Egyptian Meteorological Authority. However, wind resource assessment activities have<br />
started in the late 1970s within Ministry of Electricity and Energy and received a new<br />
momentum in the mid 1980s within cooperation agreement between NREA and USAID,<br />
which provided information indicating that the wind resources available at the Western Bank<br />
of Gulf of Suez would be very high. Figure (IV.1) shows wind speed classes.<br />
Later and starting from 1990 – 1991 a more thorough wind resource assessment was carried<br />
out in cooperation between NREA and RISO National Laboratories supported by a grant<br />
from DANIDA of Denmark where the objective was to develop a Wind Atlas for Egypt to be<br />
utilized in assessing wind electricity generation potential. The Atlas had three components as<br />
follows:<br />
1) The first component or phase is a Wind Atlas for the Gulf of Suez which was finalized<br />
and issued in March 2003. Based on measurements and data analysis carried out in the<br />
period 1991 – 2001, wind speeds were between 9 – 10.8 m/s making that region among<br />
the best world areas for wind farm projects. The Gulf of Suez is an arid desert area with<br />
no human activity except some tourist villages and oil fields along the coast. Locations<br />
considered for the potential wind power plants are in the inland west side of the coastal<br />
desert road, while tourist villages are in the Eastern side located by the coast. The<br />
estimated potential is in the order of 20000 MW installed capacities.<br />
2) The second component or phase is a preliminary wind atlas for Egypt issued in 2004, for<br />
internal use.<br />
3) The third component or phase is a wind Atlas for Egypt that was finalized and issued in<br />
January 2006. It pointed out to other locations in the Eastern and Western Desert of<br />
Egypt as well as Sinai Peninsula having considerable wind potential, even though less<br />
than that of Gulf of Suez, with wind speeds between 6 – 7.5 m/s, in addition to some<br />
locations around the Nile Valley with speed 7 – 8 m/s. The overall wind potential in such<br />
areas could reach and even exceeds 60000 MW installed capacity. Figure (A1.4) shows<br />
the developed Wind Atlas of Egypt.
EGYPT - National study<br />
Figure 9 Solar Atlas of Egypt (Global)<br />
295
296<br />
ENERGY AND SUSTAINABLE DEVELOPMENT IN THE MEDITERRANEAN<br />
Figure 10 Solar Atlas of Egypt (Direct)
EGYPT - National study<br />
Figure 11 Wind power estimates<br />
297
298<br />
ENERGY AND SUSTAINABLE DEVELOPMENT IN THE MEDITERRANEAN<br />
Figure 12 Wind atlas of Egypt
EGYPT - National study<br />
Annex II: Evolution of final consumer energy price per fuel and per<br />
sector<br />
For natural gas, reviewing Table 16 we can figure out the following remarks:<br />
The current prices were constant during 1981/1982 – 1985/1986 that resulted in an<br />
annual rate of decrease for actual prices of about – 13%, but during 1986/1987 –<br />
1993/1994 current prices increased rapidly at annual rate of increase of 50% reflected in<br />
an increase of actual prices at an annual rate of 27% on the average, a trend that<br />
continued during 1993/1994 – 2004/2005 with an annual rate of increase in current prices<br />
of 37.3% reflected in an annual rate of increase of 37.3% reflected in an annual rate of<br />
increase of actual prices of about 1%.<br />
Table 16 Evolution current and Actual Prices Annual Rate of Increase / Decrease (-) for Natural Gas<br />
Period Rate of Price Increase / Decrease (-)<br />
Current Actual<br />
1981/1982 – 1985/1986 0% - 13.3%<br />
1986/1987 – 1993/1994 50% 27.6%<br />
1993/1994 – 2004/2005 6% 0.8%<br />
Reviewing Table 17, we can figure out the following remarks:<br />
For LPG, current prices were constant during 1981/1982 – 1985/1986 which resulted in<br />
an annual rate of decrease for actual prices of – 13%, while current prices increased<br />
rapidly at an annual rate of 21% during 1986/1987 – 1993/1994 reflected in an actual<br />
annual rate of price increase of 3%, but with constant current prices during 1993/1994 –<br />
2004/2005, the annual actual prices decreased at a rate of – 5%.<br />
For gasoline, current prices increased at an annual average rate of 12% during<br />
1981/1982 – 1985/1986, but in spite of that the actual prices decreased at an annual rate<br />
of -3%, while current prices increased rapidly during 1986/1987 – 1993/1994 at annual<br />
rate of 20% which reflected in an annual actual price increase of 2.5%, but during<br />
1993/1994 – 2004/2005 the current prices were constant resulting in annual actual price<br />
decrease of – 5%.<br />
For light fuel oil No. 2, current prices were constant during 1981/1982 – 1985/1986<br />
resulting in annual actual price decrease of – 13%, while current prices increased rapidly<br />
during 1986/1987 – 1993/1994 at an annual rate of 46% reflected an annual rate of<br />
increase of actual prices of 24%, but during 1993/1994 – 2004/2005 current prices<br />
become constant reflected in actual price increase at an annual rate of – 2.2% but an<br />
increase in current price for oil sold to the transportation sector during the same period<br />
limited annual rate of decrease of actual prices to – 1%.<br />
For heavy fuel oil No. 6, current prices were constant during 1981/1982 – 1985/1986<br />
reflected in an annual rate of decrease of actual prices of – 13%, while for the oil sold to<br />
the electricity sector current prices increased at an annual rate of 19% resulting in annual<br />
increase rate of 3% on the average for actual prices of that oil sold to the electricity<br />
sector, but during 1986/1987 – 1993/1994 current prices increased rapidly at an annual<br />
rate of 50% for normal oil and 36% for that sold to the electricity sector reflected in annual<br />
rate of the electricity sector reflected in annual rate of increase of actual prices of 28% for<br />
normal oil and 16% for oil sold to the electricity, but the slower rate of annual increase of<br />
current prices during 1993/1994 – 2004/2005 resulted in similar slower rate of annual<br />
increase in actual prices to 2.5%.<br />
299
300<br />
ENERGY AND SUSTAINABLE DEVELOPMENT IN THE MEDITERRANEAN<br />
Table 17 Evolution of Current and Actual Prices Annual Rate of Increase / Decrease (-) for Different Types of Petroleum Products and Their Weighted Average<br />
1981/1982 – 2004/2005<br />
Period LPG Prices Rate of<br />
Increase/Decrease (-)<br />
Current<br />
Gasoline Prices Rate of<br />
Increase/Decrease (-)<br />
Light Fuel Oil No.2 Prices<br />
Rate of Increase/Decrease<br />
(-)<br />
Heavy Fuel Oil Prices<br />
Rate of Increase/Decrease<br />
(-)<br />
Average Weighted Price<br />
for Main Petroleum<br />
Products Rate of<br />
Increase/Decrease (-)<br />
Actual Current Actual Current Actual Current Actual Current Actual<br />
1981/1982 – 1985/1986 0% - 13% 12% -3% 0% -13% 0%<br />
8-19% (3)<br />
1986/1987 – 1993/1994 21% 3% 20% 2.5% 46% 24% 50%<br />
1993/1994 – 2004/2005 0% - 5% 0% -5% 0% 2.2%<br />
1% (2)<br />
1. Period considered until 1985/1986<br />
2. If we include also price oil to the electricity sector which increased slightly<br />
3. Oil sold to the electricity sector<br />
36% (3)<br />
-13% (1)<br />
3% (3)<br />
28%<br />
16% (3)<br />
2.5% Not<br />
available<br />
Table 18 Evolution of the Annual Rate of Increase / Decrease (-) of Sectoral Current Price of Electricity during 1981/1982 – 2004/2005<br />
9% (1) -5.8%<br />
28% 8.8%<br />
Industrial Sector Agricultural Sector Residential Sector Commercial Government Weighted<br />
Period<br />
Sector<br />
Sector Average<br />
1981/1982 – 1985/1986 25.1% 16.5% 9% 15.8% 21.2% 19.1%<br />
1986/1987 – 1993/1994 29.6% 26.2% 18.5% 26.4% 31.3% 26.6%<br />
1993/1994 – 2004/2005 -0.7% -0.8% 0.4% 0.8% -0.3% 0.1%<br />
Evolution of the Annual Rate of Increase / Decrease (-) of Sectoral Actual Price of Electricity During 1981/1982 – 2004/2005<br />
Industrial Sector Agricultural Sector Residential Sector Commercial Government Weighted<br />
Period<br />
Sector<br />
Sector Average<br />
1981/1982 – 1985/1986 8.5% 1.1% -5.5% 0.48% 5.12% 3.2%<br />
1986/1987 – 1993/1994 10.3% 7.4% 0.8% 7.5% 11.7% 7.7%<br />
1993/1994 – 2004/2005 -5.6% -5.8% -4.6% -4.3% -5.3% -4.9.1%<br />
-3%
EGYPT - National study<br />
Reviewing Table 18, we can figure out the following remarks:<br />
For the industry sector, remarkable current prices increase were noticed during<br />
1981/1982 – 1993/1998 at annual rate of 25% during the first period of 1981/1987 -<br />
1993/1994 which reflected in an annual actual price increase of 9% then 10%<br />
respectively, then we notice a decrease of both current and actual prices at an annual<br />
rate of – 1% and – 5.6% respectively.<br />
For the agricultural sector current prices witnessed considerable increase during<br />
1981/1982 – 1993/1994 at an annual rate of increase of 16.5% during 1981/1982 –<br />
1993/1994 which reflected on the actual prices as an annual rate of increase of 1% then<br />
7.4% respectively, while both current and actual prices want down at -1% & 8-4.8%<br />
respectively during 1993/1994 – 2004/2005.<br />
For the residential sector, the current prices witnessed a relatively large increase during<br />
19981/1982 – 1993/1994 at an annual average rate of 9% during 1981/1982 – 1985/1986<br />
then to 18.5 during 1985/1986 – 1993/1994 reflected in an annual actual price of 0.8%<br />
respectively, while during 1993/1994 – 2004/2005 both current and actual prices<br />
witnessed a decrease in annual price rates of about 0.4% increase and -4.6% decrease<br />
respectively.<br />
For the commercial sector, the period 19881/1982 – 1993/1994 witnessed a large<br />
increase in current prices of 10% annual rate during 1981/1982 – 1985/1986 then to<br />
26.4% during 1985/1986 – 1993/1994 resulting in actual prices annual increase of 0.4%<br />
then to 7.5% respectively, while the period of 1993/1994 – 2004/2005 both current and<br />
actual prices witnessed a decrease in both current and actual prices rates of about 0.8%<br />
increase and -4.3% annually respectively.<br />
For the government sector current prices witnessed a large increase during 1981/1982 –<br />
1993/1994 at an annual average rate of 21% during 1981/1982 – 1985/1986 then to 31%<br />
during 1986/1987 – 1993/1994 which reflected on the actual prices in terms of an annual<br />
increase of about 5%, then 12% respectively while both current and actual prices<br />
decreased at an average annual rate of -0.3% and -5.3% respectively during 1993/1994 –<br />
2004/2005.<br />
For the over weighted average price of electric energy the current such price witnessed a<br />
significant annual rate of increase of 9.1% during 1981/1988 – 1985/1986 and then up to<br />
about 26.6% during 1985/1986 – 1993/1994 which reflected in an annual average actual<br />
price increase of 3.2% then 7.7% respectively, while current prices remained constant<br />
during 1993/1994 – 2004/2005 and actual prices decreased by -4.9% annually on the<br />
average.<br />
301
302<br />
ENERGY AND SUSTAINABLE DEVELOPMENT IN THE MEDITERRANEAN<br />
Annex III: Brief explanation of the difficulties encountered during data<br />
gathering<br />
We can summarize these difficulties as follows:<br />
The lack of the availability of current and historical data is one of the major difficulties<br />
encountered during the development of the national study. Accurate and timely data<br />
are vital for such study. In developed countries, most data needed are readily<br />
available, thus making the establishment of such a national study relatively easy.<br />
However, data are not so readily available in developing countries including Egypt.<br />
It is not only the availability of data which may represent a problem but also their<br />
completeness, quality, consistency, harmony, and integrity.<br />
Data when available is mainly available on the national level. However, the broken<br />
down data on the lower or sectoral levels are more difficult to be acquired.<br />
The data exchange and sharing culture among different sectors needs more<br />
intensification.<br />
The GDP data that we have collected from annual or periodical publications or from<br />
the different national and international web sites were inconsistent.<br />
There is evidence of large investments having been made to acquire computerized<br />
information systems, but there is less evidence that these systems are functioning<br />
satisfactorily and contributing to provide relevant information for the benefit of the<br />
national development and monitoring efforts. Moreover, problems often arise in the<br />
transfer of expertise among successive managers and operators of these systems.<br />
The currency or need for recent data is very important in sustainable development<br />
progress plans as well as in monitoring process and there is a need to enhance the<br />
institutional arrangements to determine, coordinate the frequency of data updating,<br />
and verifying the quality of the data collected.<br />
The centrality of data to the development and monitoring of sustainable development<br />
indicators together with the high costs and lead time to acquire reliable data, make it<br />
highly desirable to consider data as a national asset serving multiple purposes.<br />
It would be useful if measures would be taken to establish a national register of<br />
available data, in order to forestall repeated and duplicated acquisition. It might also<br />
be possible to encourage different projects to extend their activities to acquire, at low<br />
incremental cost, additional data which is highly likely to be useful to other projects.<br />
The adoption of standards for the content and representation of data is of vital<br />
importance to guarantee that the data will be applicable to other projects.<br />
Substantial programs of training and awareness raising on data needed for the evaluation of<br />
sustainable development indicators should be intensified and continued at all levels together<br />
with the establishment of sharing networks for planners, decision makers, and non<br />
governmental organizations working in the area of sustainable development.
Annex IV: List of main references<br />
EGYPT - National study<br />
"A Study on the Effect of Increasing Energy Prices on the Prices of Products and Services in Egypt", Organization<br />
for Energy <strong>Plan</strong>ning and National <strong>Plan</strong>ning Institute, Cairo, June 2005.<br />
"A Study on the National Energy Strategy in Egypt until 2021/22", Organization for Energy <strong>Plan</strong>ning and Ministry<br />
of <strong>Plan</strong>ning, Cairo, June 2006.<br />
"Arab Republic of Egypt Energy Sector Assessment", The Joint UNDP/World Bank Energy Sector Management<br />
Assistance Program (ESMAP), report no. 189/96, New York 1996.<br />
"Assessment & survey of prior energy efficiency market studies in Egypt", Adel T. Soliman, Interim report,<br />
Electrical Energy Efficiency Centre (E3C) of the EEIGGR project, December 2000.<br />
"Detailed Wind Atlas of Gulf of Suez", NREA/DANIDA/RISO, 2003.<br />
"Development Of a Commercial Market for Wind Farms in Egypt, economic analysis and regulatory options",<br />
NREA/WB/GEF/DANIDA, Wolfgang MOSTERT, 2003.<br />
"Economic and Environmental Feasibility for Utilizing Domestic Solar Water Heaters to Replace Electric, LPG,<br />
and NG Water Heaters in Greater Cairo Area", NREA/OEP, 2004.<br />
"Efficient use of energy in the industrial sector: an analysis of options for selected ESCWA member states",<br />
United Nations, Economic and Social Commission for Western Asia, 2001.<br />
"Egypt in 2020, Energy Resources and Their Development Potentials in Egypt", Third World Forum, M. Megahed<br />
and Rafik Y. Georgy, Cairo 2002.<br />
"Egypt National Environmental <strong>Action</strong> <strong>Plan</strong>", Egyptian Environmental Affaires Agency, WEC Egypt Energy Day,<br />
October 2002.<br />
"Egyptian Natural Gas Exploration and Development", Egyptian National Gas Holding Company (EGAS), WEC<br />
Egypt Energy Day, October 2002.<br />
"Egypt's National Strategy Study on the Clean Development Mechanism, TIMS, E2RC, and Egyptian<br />
Environmental Affaires Agency (EEAA), Cairo, 2003.<br />
"Energy and Environment Review", EEAA/OEP/ERM/WB, 2002.<br />
"Energy challenge in developing countries: Egypt case", S. Ezz El-Arab, S. Aboulnasr, and Adel Soliman, 19 th<br />
World Energy Congress, Sydney, Australia September 5-9, 2004<br />
"Energy Situation in Egypt, Efficiency Perspectives", Ibrahim Abdel Gelil, Organization for Energy <strong>Plan</strong>ning<br />
(OEP), WEC Egypt Energy Day, October 2002.<br />
"Implementation of RE technologies, Opportunities and Barriers", Summary of Country Studies on Egypt, Ghana,<br />
and Zimbabwe, UNEP Collaborating Center on Energy and Environment- Riso National Laboratory, Denmark<br />
2002.<br />
"Innovations for the promotion of renewable energies" Working paper including case study on Egypt by Adel T.<br />
Soliman, European Parliament, ENER 103 EN, April 1998.<br />
"On efficient utilization of Egypt's energy resources: oil and gas", Tarek H. Seliem, working paper no. 117, The<br />
Egyptian Centre for Economic Studies, December 2006.<br />
"Preliminary Wind Atlas of Egypt", NREA/USAID/Battelle, 1986.<br />
"Recommendations on the implementation of the EU-Egypt <strong>Action</strong> <strong>Plan</strong>", Commission of the European<br />
Communities, Brussels, 7.6.2006, COM (2006) 282 final.<br />
"Renewable energy strategy in Egypt, long and short term objectives", NREA, 2006.<br />
"Solar Atlas of Egypt", NREA/USAID/IDEA, M. Shaltout, Cairo 1991<br />
"Strategic Perspective of the Egyptian Electricity Sector for CDM Projects", El-Sharkawi et Al, 19 th World Energy<br />
Congress, Sydney, Australia September 5-9, 2004<br />
"The petroleum industry in Egypt: investment and prospects" American Chamber of Commerce in Egypt<br />
(AmCham), Business Studies and Analysis Center, 2003.<br />
"The promotion of demand side management and energy efficiency in Egypt, currently applied mechanisms and<br />
recommendation for the short to medium term", World Bank, December 2005.<br />
"Wind Atlas for Egypt", NREA/DANIDA/RISO, 2006.<br />
Central Agency for Public Mobilization and Statistics (CAPMAS), Annual Report, Cairo, 2005.<br />
Different Feasibility Studies Conducted Prior To Implementing Existing and Near Term <strong>Plan</strong>ned Wind Farms.<br />
Economic Review Bulletin, Central Bank of Egypt, Cairo, different issues.<br />
303
304<br />
ENERGY AND SUSTAINABLE DEVELOPMENT IN THE MEDITERRANEAN<br />
EconStats: Global Econ Data, IMF International Financial Statistics (IFS), World Bank Web Site.<br />
Egyptian General Petroleum Corporation (EGPC), Annual report, 2003.<br />
Egyptian National Gas Holding Company (EGAS), annual report, Cairo, 2004<br />
Egypt's CDM – DNA internal reports.<br />
Energy Conservation and Environment Project (ECEP), different publications.<br />
Energy Information Administration (EIA), Country analysis, Egypt, 2006, www.eia.org<br />
Information and Decision Support Center (IDSC), Cabinet of Egypt, Available at www.idsc.gov.eg<br />
Organization for Energy <strong>Plan</strong>ning (OEP), Annual report, different years.<br />
Sustainable Development Indicators Workshop with Stakeholders from Different Ministries in Egypt, Workshop<br />
Proceeding, Cairo, May 2005.<br />
The Egyptian Electricity Holding Company (EEHC), Annual report, different years.<br />
The New and Renewable Energy Authority (NREA), Annual report, different years.<br />
The web site of the Ministry of <strong>Plan</strong>ning in Egypt, www.mop.gov.eg<br />
Utilizing Integrated Approach to Develop Remote Communities in Egypt Using Different RE Technologies, Rafik<br />
Y. Georgy, Tunis, 2003.<br />
World Energy Outlook, 2006, US Department of Energy (DOE), Available at www.eia.org
ISRAEL<br />
Dr. Amit Mor, Dr. Shimon Seroussi, Eco-Energy M.S. (2001) Ltd.<br />
Financial & Strategic Consulting<br />
TABLE OF CONTENTS<br />
I. Summary ........................................................................................................................ 307<br />
1. Challenges and energy sustainability.................................................................................................... 307<br />
2. Indicators ................................................................................................................................................... 307<br />
3. The currently established policies in terms of RE and RUE ............................................................... 308<br />
4. Difficulties, possible solutions, needed reforms ................................................................................. 308<br />
5. Success story............................................................................................................................................. 308<br />
II. Résumé ......................................................................................................................... 311<br />
1. Défis et durabilité énergétique............................................................................................................... 311<br />
2. Indicateurs ................................................................................................................................................. 311<br />
3. Les politiques actuellement mises en place en termes d’ER et d’URE ........................................... 312<br />
4. Difficultés, solutions possibles, réformes nécessaires....................................................................... 312<br />
5. Success story............................................................................................................................................. 313<br />
III. National study .............................................................................................................. 315<br />
1. Israel’s energy situation and challenges .............................................................................................. 315<br />
2. Rational Energy Use (RUE) - Renewable Energies (RE): policies, tools, progress, resulting<br />
effects, case studies ..................................................................................................................................... 324<br />
3. Examples of good practice, case studies ............................................................................................. 336<br />
4. Glossary...................................................................................................................................................... 337<br />
5. Table of figures ......................................................................................................................................... 339
I. SUMMARY<br />
ISRAEL - Summary<br />
1. Challenges and energy sustainability<br />
Israel‟s energy sector faces a number of challenges. It is both a developed, industrialized<br />
country with living standards similar to those of many Western European countries, and a<br />
rapidly developing, resource-poor, with significant geopolitical risks, dependency on imported<br />
fossil fuels, and vulnerability to climate change. Israel is also an “electrical island” isolated<br />
from neighboring countries‟ national transmission systems, thereby requiring significant<br />
reserve capacity to avoid electrical blackouts.<br />
Israel‟s energy demand continues to rise, albeit not at the rates seen during the mid to late<br />
1990s. By far the largest cause of Israel‟s energy demand growth has been population<br />
growth, which, at approximately 2% annually, significantly exceeds that of Western Europe.<br />
In fact, per-capita demand has been relatively constant since 2002. However, compared to<br />
the current and forecasted demand growth in much of Europe, both on an overall and a percapita<br />
basis, Israel‟s demand growth is significantly higher, rising 44% since 1990 compared<br />
to 15% for the European Union member nations. Moreover, Europe‟s energy intensity has<br />
declined steadily during that period, while Israel‟s have remained constant or declined slowly.<br />
Although energy demand growth has been mitigated somewhat by stricter government<br />
standards for energy efficiency and the growth of energy service companies, energy<br />
efficiency measures‟ influence on energy demand continues to remain marginal.<br />
Israel‟s energy supply continues to be highly dependent on imported fossil fuels, particularly<br />
coal and oil, with imported natural gas likely becoming a major component of Israel‟s future<br />
fuel mix. Although Israel‟s dependence on foreign oil for electricity generation is expected to<br />
decline, the Ministry of National Infrastructures (“MNI”) and the Israel Electric Corporation<br />
(“IEC”) have expressed strong interest in expanding Israel‟s coal-fired generating capacity,<br />
which currently produces approximately 75% of the country‟s electricity in two major power<br />
plants. The other power plants are gradually shifting from oil to natural gas, which by 2010<br />
would produce about 35% of the electricity and comprise some 60% of the installed capacity.<br />
Public‟s awareness of the link between energy and climate change has increased recently,<br />
due to significant media exposure and increased environmental emphasis within Israel‟s<br />
educational system. Such awareness is critical for Israel to develop a sustainable energy<br />
future.<br />
2. Indicators<br />
Renewables constitute less than one-tenth of one percent of Israel‟s primary energy supply.<br />
Although Israel continues to be among the world leaders in the use of solar water heating,<br />
producing the equivalent of over 4% of Israel‟s electricity consumption, it has not kept pace<br />
with other developed countries in integrating solar resources into its energy mix, let alone<br />
other renewables. Currently, Israel‟s electricity generation mix is comprised of coal (75%)<br />
and natural gas (11%), with the remainder consisting of heavy fuel oil and gasoil. In 2003,<br />
the Government of Israel set rather modest goals for renewables‟ share of electricity<br />
generation over time: 2 percent (200 MW) in 2007, increasing to 5 percent (approximately<br />
750 MW) by 2016. Although the 2007 goal is clearly unattainable, the 2016 target may be<br />
achievable if the planned central-station solar thermal facilities and the current renewable<br />
license holders enter the market. Nevertheless, Israel‟s renewables potential significantly<br />
exceeds these targets, since potential solar generation capacity alone (solar thermal and<br />
photovoltaic) may exceed 2,500 MW by 2025.<br />
Energy efficiency has been an insignificant part of Israel‟s overall energy planning. The Israel<br />
Energy Master <strong>Plan</strong> and subsequent work indicate that energy conservation could comprise<br />
up to 20% of current consumption. Subsequent work by the Ministry of National<br />
Infrastructures suggests potential energy savings of 35%. Lately the MNI has begun<br />
licensing energy service companies (ESCOs) to develop this potential. Moreover, the<br />
decision by the Public Utilities Authority (PUA) requiring time-of-use tariffs for all customers<br />
307
308<br />
ENERGY AND SUSTAINABLE DEVELOPMENT IN THE MEDITERRANEAN<br />
with annual electricity consumption exceeding 60 thousand kWh has reduced peak-hour<br />
consumption, especially by industrial customers. Although the MNI and PUA have attempted<br />
to quantify the effects of ESCOs and time-of-use rate implementation on energy efficiency,<br />
there are no consensus studies of the overall impact of all energy efficiency initiatives on the<br />
energy sector.<br />
3. The currently established policies in terms of RE and RUE<br />
As mentioned above, the Government of Israel set a target of at least 2% of all electricity to<br />
be supplied by renewable energy by 2007, rising to 5% by 2016. To implement this policy,<br />
the MNI published a set of policies and procedures to promote renewables development in<br />
2004, and the PUA has since developed renewables tariffs, licensing procedures, and codes<br />
of conduct for renewable electricity generators. The renewables tariff is calculated as a<br />
premium above IEC‟s normative production costs; the premium is based on the prices of the<br />
emissions avoided by substituting renewables for fossil units. IEC, as the single purchaser of<br />
this generation, pays this tariff for energy produced by these renewable generators. To date,<br />
renewable developers‟ response to these government initiatives has been slow, and less<br />
than 100 MW of renewable generators have received conditional licenses.<br />
There is no Government policy for RUE similar to that for RE. Nevertheless, the Government<br />
has been setting standards for energy efficiency since 1989 when the Energy Resources<br />
Law was passed by the Knesset (Israel‟s Parliament). These standards include energy<br />
labeling for domestic products and inspections for larger commercial and industrial facilities.<br />
These standards have not produced measurable energy efficiencies, however, because of<br />
lax enforcement attributable largely to a lack of resources. The economic incentives for RUE<br />
have consisted mainly of Time-of-Use tariffs and the newly established, limited scope<br />
ESCOs‟ performance contract mechanisms, which reduce the effective cost of implementing<br />
energy efficiency.<br />
4. Difficulties, possible solutions, needed reforms<br />
There are a number of difficulties that have impeded the growth of RE and RUE. These<br />
include: (a) inaction and lack of policy coordination by Government authorities; (b) IEC‟s lack<br />
of cooperation; (c) weak economic incentives for RE and RUE; and (d) lack of public<br />
awareness of the links between climate change and energy consumption.<br />
Some recommendations for accelerating RE and RUE in Israel include:<br />
Improved tariffs for renewables and mechanisms for net metering.<br />
Enforceable emissions performance standards as a condition for receiving and keeping<br />
electricity generation licenses.<br />
Non-bypassable public benefits charges on electricity and gas tariffs to support RE and<br />
RUE development.<br />
Improved energy efficiency labeling and information for consumers.<br />
Adaptation and enforcement of "Green Building" standards.<br />
Mandatory demand-side management programs for all fuels, with cost-effectiveness<br />
determined on a total societal net benefit basis.<br />
5. Success story<br />
Israel is among the recognized leaders in developing solar thermal and integrated<br />
solar/desalination technologies. It is also becoming recognized for innovative biomass<br />
technologies. These capabilities are direct results of Israel‟s energy resource mix; it has<br />
abundant sunshine, limited freshwater resources, and a history of innovative agricultural<br />
resource utilization. Solar and desalination technologies have benefited greatly from worldrenowned<br />
university research facilities and some private investment by Israeli companies<br />
such as Solel and IDE. Eco Energy‟s estimates of the annual net benefits from solar-
ISRAEL - Summary<br />
generated electricity alone range from $1.4 billion to $2.7 billion through 2025, assuming<br />
2,000 MW of solar thermal and 500 MW of photovoltaics are phased in through that period.<br />
The benefits include avoided environmental costs, employment, avoided transmission and<br />
distribution infrastructure (for photovoltaics) and balance of payment improvements.<br />
Although Israel has not become a major player for RUE development, the benefits from<br />
importing energy efficiency technologies are significant as well. Consensus estimates of the<br />
potential energy consumption savings through improved insulation, more efficient heating<br />
and air-conditioning systems, and passive solar energy could reduce electricity bills by $1.0<br />
to $1.6 billion annually. These energy savings would provide secondary benefits as well, by<br />
freeing up funds for customers‟ investment, and enabling IEC to avoid or defer capital<br />
expenditures, thereby improving its financial condition in advance of its restructuring and<br />
privatization.<br />
309
II. RÉSUMÉ<br />
1. Défis et durabilité énergétique<br />
ISRAEL - Résumé<br />
Le secteur de l‟énergie en Israël est confronté à plusieurs défis. Israël est à la fois un pays<br />
développé et industrialisé où le niveau de vie est similaire à celui de nombreux pays de<br />
l‟Europe de l‟Ouest. C‟est aussi un pays en développement rapide, pauvre en ressources,<br />
avec des risques géo-politiques significatifs, dépendant de l‟importation de combustibles<br />
fossiles et vulnérable au changement climatique. Israël est également une “île électrique”<br />
isolé des systèmes de transmissions nationaux des pays voisins, nécessitant du coup une<br />
capacité de réserve importante pour éviter les pannes d‟électricité de grande ampleur<br />
(« blackouts »).<br />
La demande énergétique d‟Israël est en continuelle croissance, bien qu‟à des taux moins<br />
élevés que ceux observés durant le milieu des années 90. La croissance de la population est<br />
de loin le premier facteur explicatif de la croissance de la demande en énergie. La population<br />
croît d‟environ 2% par an, ce qui dépasse de manière significative les taux enregistrés dans<br />
les pays de l‟Europe de l‟Ouest. En réalité, la demande par habitant est relativement<br />
constante depuis 2002.<br />
Toutefois, comparé à la croissance de la demande actuelle et prévue en Europe, tant en<br />
valeur absolue que par tête, on constate que la croissance de la demande en Israélienne est<br />
significativement plus élevée ; elle a augmenté de 44% depuis 1990 contre 15% dans les<br />
pays membres de l‟Union européenne. De plus, l‟intensité énergétique en Europe a diminué<br />
de manière constante alors que sur la même période, elle est restée constante ou a diminué<br />
lentement en Israël.<br />
Bien que la croissance de la demande en énergie ait été quelque peu atténuée par des<br />
normes gouvernementales plus strictes en ce qui concerne l‟efficacité énergétique et la<br />
croissance des sociétés de services énergétiques, l‟influence des dispositifs d‟efficacité<br />
énergétique sur la demande en énergie continue d‟être marginale.<br />
L‟approvisionnement en énergie en Israël demeure extrêmement tributaire des combustibles<br />
fossiles importés, particulièrement le charbon et le pétrole ; le gaz naturel importé<br />
probablement voué à devenir un composant essentiel du « fuel-mix » israélien futur. Bien<br />
que la dépendance israélienne vis-à-vis du pétrole importé pour la production d‟électricité<br />
devrait diminuer, le Ministère des Infrastructures Nationales (the Ministry of National<br />
Infrastructures “MNI”) et la société « Israel Electric Corporation » (“IEC”) ont manifesté un<br />
fort intérêt en faveur de l‟extension de la capacité de production à partir de charbon qui<br />
produit actuellement 75% de l‟électricité du pays grâce aux deux principales centrales. Les<br />
autres centrales de production passent progressivement de l‟utilisation du pétrole à<br />
l‟utilisation du gaz naturel, lesquelles produiraient à partir de 2010 environ 35% de<br />
l‟électricité et représenteront 60% de la capacité installée.<br />
La prise de conscience du public quant à l‟existence d‟une corrélation entre l‟énergie et le<br />
changement climatique s‟est récemment accrue, en raison de la forte couverture médiatique<br />
et de l‟accentuation mise par le système éducatif israélien sur les aspects<br />
environnementaux. Une telle prise de conscience est essentielle pour qu‟Israël puisse<br />
développer une énergie durable pour l‟avenir.<br />
2. Indicateurs<br />
Les énergies renouvelables représentent moins de un dixième de l‟approvisionnement en<br />
énergie primaire en Israël. Bien qu‟Israël continue d‟occuper une des premières places en<br />
termes d‟utilisation de chauffe-eau solaire - qui produisent l‟équivalent de plus de 4% de la<br />
consommation électrique en Israël - le pays n‟a pas suivi le rythme des autres pays<br />
développés dans l‟intégration des ressources solaires dans son mix énergétique, laissant les<br />
autres énergies renouvelables de côté. A l‟heure actuelle, la production d‟électricité en Israël<br />
est composée à 75% de charbon et 11% de gaz naturel, le reste étant représenté par le<br />
mazout lourd et le gazole. En 2003, le Gouvernement israélien a établi des objectifs plutôt<br />
311
312<br />
ENERGY AND SUSTAINABLE DEVELOPMENT IN THE MEDITERRANEAN<br />
modestes pour la progression de la part des énergies renouvelables dans la production<br />
d‟électricité : 2% (200 MW) en 2007, accroissement à 5% (approximativement 750 MW) à<br />
l‟horizon 2016. Bien que l‟objectif 2007 soit clairement irréalisable, la cible 2016 pourrait être<br />
atteinte si le projet prévu d‟installation de centrale solaire thermique était réalisé et si les<br />
détenteurs actuels de licences entrent sur le marché. Néanmoins, le potentiel en énergies<br />
renouvelables d‟Israël dépasse largement ses objectifs, puisque le potentiel de capacité de<br />
production à lui seul (thermique solaire et photovoltaïque) pourrait dépasser les 2 500 MW<br />
en 2025.<br />
L‟efficacité énergétique a représenté une part négligeable dans la planification énergétique<br />
générale. Le <strong>Plan</strong> directeur de l‟énergie d‟Israël (Israeli Energy Master <strong>Plan</strong>) et le travail qui<br />
s‟en est suivi indique que la conservation de l‟énergie pourrait comprendre jusqu‟à 20% de la<br />
consommation courante. Le travail consécutif du Ministère des Infrastructures Nationales<br />
(MNI) suggère un potentiel d‟économies d‟énergie de 35%. Récemment le MNI a commencé<br />
à accorder des licences aux sociétés de services énergétiques (ESCOs) pour développer ce<br />
potentiel. De plus, la décision du “Public Utilities Authority” (service des collectivités<br />
publiques) (PUA) exigeant des prix tenant compte de la durée d‟utilisation pour tous les<br />
clients ayant une consommation électrique annuelle dépassant 60 000 kWh a réduit le pic de<br />
consommation horaire, notamment de la part des industriels. Bien que le MNI et le PUA aient<br />
tenté de quantifier les effets des ESCOs et de la mise en oeuvre de la tarification en fonction<br />
du temps d‟utilisation sur l‟efficacité énergétique, il n‟existe pas d‟études consensuelles de<br />
l‟impact global de toutes les initiatives d‟efficacité énergétique sur le secteur énergétique.<br />
3. Les politiques actuellement mises en place en termes d’ER et d’URE<br />
Comme mentionné plus haut, le gouvernement israélien a établi comme objectif d‟atteindre<br />
au moins 2% de l‟électricité en provenance des énergies renouvelables en 2007, et jusqu‟à<br />
5% en 2016. Pour mettre en œuvre cette politique, le MNI a publié en 2004 un ensemble de<br />
politiques et de procédures pour promouvoir le développement des énergies renouvelables<br />
et le PUA a depuis développé des tarifs pour les énergies renouvelables, des procédures de<br />
délivrance des licences et des codes de conduite pour les producteurs d‟électricité<br />
renouvelables. Le tarif des énergies renouvelables est calculé en tant que prime au-dessus<br />
des coûts de production IEC normative ; la prime est basée sur les prix des émissions<br />
évitées en remplaçant les unités fossiles par des énergies renouvelables. IEC, en tant<br />
qu‟unique acheteur de cette production, paie ce tarif pour l‟énergie produite par les<br />
producteurs d‟énergies renouvelables. A ce jour, la réaction des développeurs<br />
(investisseurs) dans les énergies renouvelables aux initiatives du gouvernement a été lente,<br />
et moins de 100 MW de générateurs d‟énergies renouvelables ont reçu les autorisations<br />
conditionnelles.<br />
Il n‟existe pas de politique gouvernementale pour l„URE qui soit similaire à celle mise en<br />
place pour les ER. Toutefois, le Gouvernement a fixé des normes d‟efficacité énergétique<br />
depuis 1989 date à laquelle la Loi sur les Ressources Energétiques a été votée à la Knesset<br />
(Parlement d‟Israël). Ces normes comprennent un étiquetage énergétique pour les produits<br />
nationaux et des inspections pour les plus importantes installations commerciales et<br />
industrielles. Ces normes n‟ont cependant pas produit des progrès d‟efficacités énergétiques<br />
mesurables en raison d‟une application laxiste largement attribuable au manque de<br />
ressources. Les incitations économiques pour l‟URE ont été principalement les tarifs Temps-<br />
Utilisation et les mécanismes du contrat de rendement du système ESCO récemment établi ;<br />
ce dernier réduit le coût effectif de mise en œuvre de l‟efficacité énergétique.<br />
4. Difficultés, solutions possibles, réformes nécessaires<br />
Il existe plusieurs difficultés qui ont entravé la croissance des ER et des URE. Il s‟agit<br />
notamment de : (a) l‟inaction et l‟absence de coordination politique de la part des autorités<br />
gouvernementales ; (b) le manque de coopération de la part de l‟IEC ; (c) la faiblesse des<br />
incitations économiques pour les ER et URE ; et (d) le manque de sensibilisation du public<br />
aux liens existant entre le changement climatique et la consommation d‟énergie.
ISRAEL - Résumé<br />
Quelques recommandations pour accélérer la mise en place des ER et URE en Israël :<br />
Des tarifs plus élevés pour les énergies renouvelables et les mécanismes de comptage<br />
net.<br />
Des standards de performance obligatoires en termes d'émissions comme condition pour<br />
obtenir et garder les autorisations de produire l‟électricité.<br />
Des taxes obligatoires sur la consommation d'électricité et de gaz appliquées à tous les<br />
consommateurs et permettant d‟alimenter des fonds pour soutenir le développement des<br />
énergies renouvelables et de l'utilisation rationnelle d'énergie.<br />
Améliorer l‟étiquetage et l‟information sur l‟efficacité énergétique pour les consommateurs.<br />
Adaptation et application des normes "Green Building".<br />
Programme de gestion de la demande obligatoire pour tous les carburants, déterminés en<br />
fonction de critères coût-efficacité sur la base du bénéfice sociétal net.<br />
5. Success story<br />
Israël figure parmi les pays reconnus comme leaders dans le développement de<br />
technologies solaires thermiques et les technologies de dessalement utilisant un système<br />
solaire intégré. Il est également reconnu pour ses technologies innovantes pour la biomasse.<br />
Ses capacités sont le résultat direct des parts relatives des différentes sources d'énergie<br />
d‟Israël ; il dispose d‟un ensoleillement abondant, de ressources en eau douce limitées, et<br />
d‟expérience en termes d‟utilisation innovante des ressources agricoles. Les technologies<br />
solaires et de dessalement ont largement profité des installations de recherche<br />
universitaires de renommée mondiale et de quelques investisseurs privés tels que Solel et<br />
IDE.<br />
Eco Energy estime que les bénéfices annuels nets de l‟électricité générés à partir d‟énergie<br />
solaire se situent entre $1.4 et $2.7 milliards à l‟horizon 2025, en supposant que 2,000 MW<br />
de solaire thermique et 500 MW de photovoltaïques sont introduits progressivement durant<br />
cette période. Les bénéfices incluent les coûts environnementaux évités, l‟emploi, les<br />
infrastructures (pour photovoltaïques) de transmission et de distribution évitées et<br />
l‟amélioration de la balance des paiements.<br />
Bien qu‟Israël ne soit pas devenu un acteur majeur dans le développement de l‟URE, les<br />
bénéfices tirés de l‟importation de technologies d‟efficacité énergétique sont malgré tout<br />
significatifs. Les estimations au sujet des économies potentielles de la consommation<br />
d‟énergie à travers une isolation améliorée, des systèmes de chauffage et d‟air conditionné<br />
plus efficaces et l‟énergie solaire passive pourraient réduire la facture d‟électricité d‟un<br />
montant compris de $1.0 à $1.6 milliards par an.<br />
Ces économies d‟énergie pourraient fournir des bénéfices supplémentaires, en libérant des<br />
fonds pour les investissements individuels et en permettant à l‟IEC d‟éviter ou reporter les<br />
frais d'infrastructure, améliorant ainsi à l‟avance la situation financière de sa restructuration<br />
et de sa privatisation.<br />
313
III. NATIONAL STUDY<br />
ISRAEL - National study<br />
1. Israel’s energy situation and challenges<br />
1.1 Intr oduc ti on<br />
Israel‟s current energy situation reflects its unique combination of European living standards<br />
with the rapid growth in fossil-based energy demand typical of developing countries. The<br />
State of Israel has undergone rapid economic development during the past 10-15 years, and<br />
has attained the standard of living typical of many countries in western and southern Europe.<br />
Israel‟s overall gross domestic product (GDP) is approximately $120 billion, and its GDP percapita<br />
is approximately $18 thousand, similar to that of Spain and Greece. 1 Israel‟s<br />
population density and its location at the edge of the desert make it especially vulnerable to<br />
climate change; 60% of the population of 7 million resides along the narrow coastal strip<br />
along the <strong>Mediterranean</strong>. In contrast to many European counties, Israel has become more<br />
dependent on imported fossil fuels over time, and its energy intensity has not decreased.<br />
Moreover, although Israel‟s electricity demand has been steadily increasing, Israel has no<br />
electrical interconnections with neighboring countries, and must depend on its extremely low<br />
reserves to meet demand during peak hours.<br />
Given this combination of rapid energy demand growth and energy dependency, Israel<br />
should be at the forefront of renewable energy (RE) and rationale use of energy (RUE)<br />
development. Nevertheless, while Israel continues to be a leader in RE and RUE technology<br />
development, it lags significantly behind most developed European countries in adopting<br />
these technologies for domestic usage. This report will demonstrate the historical and<br />
projected policies and strategies in these fields.<br />
1.2 Curre n t and forecaste d energy d emand<br />
While experiencing relatively high economic growth rates, Israel has not followed the trend<br />
toward declining energy intensity and greater energy efficiency characterizing most of<br />
Europe. For example, Israel‟s per-capita energy usage increased by 44% since 1990, while<br />
the EU average increased by only 15%. Israel‟s final energy consumption in 2005 was 13.2<br />
Mtoe, of which 8.6 was petroleum products and 3.8 Mtoe was electricity; the remainder was<br />
largely natural gas and heat & steam2.<br />
However, three recent trends in energy demand may be encouraging: (a) the stabilizing of<br />
fuel consumption for electricity generation, which rose only 0.1 Mtoe in 2005 to 11.6 Mtoe;<br />
(b) the decline in fuel oil sales from 3.6 to 3.26 Mtoe, due mainly to the increase in natural<br />
gas consumption by electricity generators;3 and (c) the consistent decline in the energy ratio<br />
since 2002, reaching 50.5 in 2005, the lowest level in 10 years. Overall, final energy<br />
consumption rose in 2005 by only 0.85%, from 13.04 to 13.15 Mtoe. Table 1 indicates the<br />
final consumption composition for 2004 and 2005.<br />
1 World Bank data on Israel,<br />
http://devdata.worldbank.org/external/CPProfile.asp?SelectedCountry=ISR&CCODE=ISR&CNAME=Israel&PTYPE=CP<br />
2 Israel Central Bureau of Statistics www.cbs.gov.il, Table 21.1.<br />
3 Israel Ministry of National Infrastructures. http://www.mni.gov.il/NR/rdonlyres/35F88D05-58BB-43FF-A22E-<br />
A62C2A9B43C7/0/ .xls.<br />
315
316<br />
ENERGY AND SUSTAINABLE DEVELOPMENT IN THE MEDITERRANEAN<br />
Table 1 Final Consumption of Energy Products for 2004 and 2005<br />
Source: Israel Central Bureau of Statistics Energy in Israel 2005<br />
Currently, Israel‟s total electricity cost is about $4 billion annually, constituting over 1% of<br />
Israel‟s GDP. With the current generation supply mix consisting exclusively of fossil<br />
generation, residential and commercial customers, who consume about 55% of all electricity<br />
produced, are responsible for approximately 30% of all CO2 emissions. Industrial customers,<br />
who consume about 29% of all electricity, are responsible for only 15% of all CO2 emissions.<br />
The slightly higher share of emissions attributable to non-industrial customers reflects their<br />
higher contribution to electricity system peaks, requiring peaking diesel and oil-fired<br />
generators. Israel‟s electricity consumption was nearly 3.8 Mtoe in 2005, an increase of 2.7%<br />
over 2004.<br />
The diagram below illustrates Israel‟s historical and projected demands for electricity:<br />
Figure 1 Historical and projected demands for electricity<br />
As the above diagram indicates, Israel‟s electricity consumption has doubled during the past<br />
10 years, and is expected to nearly double by 2023 – even in the low-demand scenario.<br />
Given the long lead times required for constructing new electricity generation in<br />
Israel, it is very possible that there will be frequent supply shortages unless RE and<br />
RUE receive significant attention. Moreover, demand growth by residential and<br />
commercial customers is expected to outpace that of industrial customers, thereby<br />
accelerating peak demand growth and increasing the probability of outages during critical<br />
peak hours. 4<br />
1.3 Curre n t and forecaste d energy s uppl y<br />
Israel‟s energy ratio (primary energy supply per dollar of GDP including taxes) increased by<br />
24% from 1990 to 2004, while the EU average declined by 10%. Despite the relative<br />
slowdown in Israel‟s economy since the mid-1990s and the projected moderate rate of longterm<br />
economic growth, primary energy supply is expected to reach 48 Mtoe by 2025 (from<br />
today‟s 21). Table 2 indicates Israel‟s primary energy supply vs. its GDP from 1990 to 2005.<br />
4 Israel Energy Master <strong>Plan</strong> and discussions with PUA staff.
ISRAEL - National study<br />
Table 2 Energy intensity: 1990 - 2005<br />
Year Base: Intensity Base NIS Base:<br />
Mtoe<br />
1995=100<br />
1995 =100 (billion) 1995=100<br />
1990 95.4 55.3 74.4 199.6 70.9 11,036.0<br />
1991 90.9 52.7 78.9 211.8 71.7 11,159.6<br />
1992 96.4 55.9 84.5 226.9 81.5 12,689.6<br />
1993 98.8 57.3 87.7 235.5 86.7 13,490.8<br />
1994 98.6 57.2 93.9 252.0 92.7 14,423.3<br />
1995 100.0 52.2 100.0 298.3 100.0 15,564.3<br />
1996 99.4 51.9 105.6 315.0 105.0 16,342.2<br />
1997 98.9 51.6 108.6 323.9 107.4 16,713.6<br />
1998 102.5 53.5 113.1 337.4 115.9 18,038.4<br />
1999 102.8 53.6 116.4 347.3 119.7 18,626.6<br />
2000 99.0 51.7 126.6 377.5 125.3 19,499.2<br />
2001 99.3 51.8 125.7 375.1 124.9 19,435.2<br />
2002 103.4 53.9 124.6 371.6 128.8 20,039.8<br />
2003 101.7 53.1 126.4 377.2 128.6 20,015.2<br />
2004 100.5 52.4 132.5 395.3 133.2 20,728.2<br />
2005 96.8 50.5 139.5 416.0 135.0 21,004.9<br />
Source: Israel Central Bureau of Statistics 2005<br />
Israel‟s energy sector is based on imported fuels, especially oil. Israel‟s primary energy<br />
consumption in 2005 was 21.0 million tons of oil equivalents (Mtoe), approximately 93% of<br />
which was supplied by imported fuels: 56% (11.8 Mtoe) of which was petroleum products,<br />
and 37% (7.6 Mtoe) coal used primarily for power generation. In fact, Israel‟s energy<br />
dependency is among the highest in the world, with energy production totaling only about 1.7<br />
Mtoe annually while its net imports exceed 19 Mtoe5.The remaining 7% (1.5 Mtoe) of primary<br />
energy consumption was natural gas, using Israel‟s recently discovered offshore natural gas<br />
reserves.6 Israel is utilizing its own offshore natural gas reserves (~35 billion cubic meters –<br />
BCM), the vast majority of which is under contract with the Israel Electric Corporation (IEC)<br />
for its natural gas-fired generating stations. To meet the demand for natural gas of the power<br />
and industrial sectors it will be necessary to import natural import gas from other sources,<br />
primarily from Egypt, thereby increasing Israel‟s energy dependence again.<br />
Electricity generation is primarily coal-fired, with approximately 4,800 MW producing<br />
approximately 35 million MWh annually, or approximately 75% of Israel‟s electricity<br />
generation. Overall, 10.9 Mtoe of primary energy was used to produce 48 billion KWh of<br />
electricity in 2005, mainly in three steam turbines power stations located on the<br />
<strong>Mediterranean</strong> coast (2 coal power plants and one dual-fuel capable - heavy fuel oil and<br />
natural gas). Israel Electric Corporation has been actively retrofitting its oil-fired generators to<br />
use natural gas, and most of its new electricity generation for the next several years will use<br />
natural gas as its primary fuel.<br />
The following table summarizes the fuels used for electricity generation since 1995.<br />
5 Israel Central Bureau of Statistics and International Energy Agency.<br />
6 Israel Central Bureau of Statistics,<br />
http://www1.cbs.gov.il/reader/new_energy/new_enr_bhar_sidrot_e.html?opzii_sidrot=2&nachalo=nach1<br />
317
318<br />
ENERGY AND SUSTAINABLE DEVELOPMENT IN THE MEDITERRANEAN<br />
Table 3 Type of primary fuel consumed by power plants*(Thousand tons)<br />
Source: Israel Electric Corporation 2005 Statistical Report<br />
Table 4 and Figure 2 indicate historical trends for Israel‟s total primary energy supply from<br />
1980 to 2005 and from 1971 to 2005, respectively.<br />
Table 4 Historical trends for Israel’s total primary energy supply: 1980-2005<br />
Period Total Primary Transformation to Secondary Primary Energy Supply<br />
Energy<br />
Energy<br />
Grand Total<br />
1980 5,427.3 2,478.6 7,905.9<br />
1985 5,619.2 2,875.2 8,494.3<br />
1990 7,236.0 3,800.0 11,036.0<br />
1995 10,608.6 4,955.4 15,564.3<br />
2000 12,808.2 6,690.8 19,499.2<br />
2002 13,039.0 7,000.7 20,039.8<br />
2003 13,217.6 6,797.8 20,015.2<br />
2004 13,039.7 7,688.5 20,728.2<br />
2005 13,151.1 7,853.6 21,004.9<br />
Source: Israel Central Bureau of Statistics 2005 Energy Report<br />
Source: International Energy Agency<br />
Figure 2 Evolution of Total Primary Energy Supply 1971 – 2004<br />
Figure 3 shows the electricity consumption per GDP ratio in Israel compared to a selection of<br />
European countries.
ISRAEL - National study<br />
Figure 3 Israel electricity consumption per US$1000 of GDP<br />
Table 5 shows the trends of electricity usage by customer class since 2001. (Note that all<br />
customer classes are eligible for the Time-of-Use (T.O.U.) tariff, and all customers<br />
consuming more than 60,000 kWh annually are required to be billed according to that tariff).<br />
Table 5 Annual Electricity Consumption by Sector: 2001-2005<br />
Source: Israel Electric Corporation 2005 Statistical Report<br />
Table 6 indicates the annual average price per kWh expressed in US cents per kWh (at yearend<br />
US dollar-shekel exchange rates). When combined with the consumption data above, it<br />
is apparent that overall electricity demand is not very responsive to price. In fact, the only<br />
clear evidence of price elasticity is displayed by customers recently switched to Time-of-Use<br />
tariffs; these customers have shifted portions of their consumption to non-peak hours.<br />
Year Residential<br />
Table 6 Annual average electricity price (in US cents per kWh)<br />
Public &<br />
Commercial Agricultural Industrial<br />
Water<br />
Pumping Bulk<br />
Total<br />
Consumption<br />
1995 8.5 8.2 7.0 6.8 6.1 6.5 7.6<br />
1996 8.4 8.0 6.9 6.8 5.9 6.4 7.5<br />
1997 8.3 8.1 7.1 6.8 6.1 6.5 7.5<br />
1998 7.1 6.9 6.1 5.8 5.6 5.6 6.4<br />
1999 7.6 7.3 6.4 6.2 5.9 5.9 6.9<br />
2000 8.0 7.8 6.9 6.5 6.3 6.3 7.3<br />
2001 7.3 7.0 6.1 5.9 5.7 5.7 6.6<br />
2002 7.8 7.5 6.5 6.2 5.9 5.9 7.1<br />
2003 9.1 8.6 7.4 6.9 6.7 6.7 8.1<br />
2004 9.8 9.3 7.9 7.5 7.3 7.3 8.7<br />
2005 9.8 9.3 8.1 7.7 7.4 7.4 8.8<br />
319
320<br />
ENERGY AND SUSTAINABLE DEVELOPMENT IN THE MEDITERRANEAN<br />
Figure 4 presents the trend of per-capita energy supply since 1970. Note that per-capita<br />
supply has stabilized since 1998. However, energy supply requirements are growing due to<br />
rapid demographic growth.<br />
Source: Israel Ministry for Environmental Protection<br />
Indigenous<br />
production<br />
Figure 4 Energy supply per capita (in tons oil equivalent)<br />
Table 7 Israel's Primary Energy Supply 2005 Thousands of t.o.e.<br />
Coal Oil<br />
shale<br />
Crude oil Refinery<br />
feedstock<br />
Petroleu<br />
m<br />
products<br />
Natural<br />
gas<br />
Hydro &<br />
solar<br />
energy<br />
Electrici<br />
ty<br />
Total<br />
30.2 1.6 1,496.5 741.2 2,269.5<br />
Imports<br />
Thereof:<br />
7,718.0 10,420.8 5,307.8 23,446.6<br />
refinery feed<br />
stocks<br />
1,614.5 -1,614.5 0.0<br />
Exports -3,822.3 -143.2 -3,965.5<br />
Marine<br />
bunkers<br />
-273.1 -273.1<br />
Stock<br />
changes<br />
93.4 -173.8 -59.0 -139.4<br />
Statistical<br />
differences<br />
Primary<br />
-178.2 0.0 -113.8 -87.4 59.3 0.0 0.0 -13.7 -333.8<br />
energy<br />
supply<br />
7,633.2 30.2 10,134.8 1,548,4 -423.1 1,496.5 741.2 -156.9 21,004.9<br />
Coal<br />
Table 8 Israel's Primary Energy Supply 2004 Thousands of t.o.e.<br />
Oil<br />
shales<br />
Crude<br />
oil<br />
Refinery<br />
feedstock<br />
Petroleum<br />
products<br />
Natural<br />
gas<br />
Hydro &<br />
solar<br />
energy<br />
Electric<br />
ity<br />
Indigenous<br />
production<br />
30.8 1.9 1,087.6 741.7 1,862.0<br />
Imports<br />
Thereof:<br />
7,788.5 9,497.3 5,419.6 22,705.4<br />
refinery feed<br />
stocks<br />
1,200.5 -1,200.5 0.0<br />
Exports -3,684.0 -125.6 -3,809.6<br />
Marine<br />
bunkers<br />
-223.5 -223.5<br />
Stock<br />
changes<br />
-48.2 -341.6 187.3 -202.5<br />
Statistical<br />
differences<br />
Primary<br />
70.3 0.0 81.1 101.5 158.4 -0.3 0.0 -14.8 396.2<br />
energy<br />
supply<br />
7,810.6 30.8 9,238.7 1,302.0 641.7 1,087.3 741.7 -140.4 20,728.2<br />
Total
ISRAEL - National study<br />
Table 9 Primary Energy Supply and Final Energy Consumption - forecast through 2025<br />
Year Primary Energy<br />
Supply per<br />
capita (toe)<br />
Final Energy<br />
Consumption<br />
per capita (toe)<br />
Primary Energy<br />
Supply<br />
(Mtoe)<br />
Final Energy<br />
Consumption<br />
(Mtoe)<br />
1970 1.7 1.2 5,033 3,495<br />
1975 1.9 1.3 6,635 4,579<br />
1980 2.0 1.4 7,906 5,427<br />
1985 2.0 1.3 8,494 5,619<br />
1990 2.4 1.6 11,036 7,236<br />
1995 2.8 1.9 15,564 10,609<br />
2000 3.1 2.0 19,499 12,808<br />
2005 3.0 1.9 21,005 13,151<br />
Projections through 2025<br />
2010 3.0 1.8 22,445 13,723<br />
2015 3.0 1.8 23,983 14,319<br />
2020 2.9 1.7 25,627 14,941<br />
2025 2.9 1.7 27,384 15,590<br />
Source: Israel Central Bureau of Statistics<br />
1.4 Greenhous e gas (GHG ) emissions: cur rent and fo recaste d<br />
Israel‟s overall CO2 emissions are approximately 67 million tons annually, amounting to 9.7<br />
tons per person 7 . Although this figure has declined by about 1% per year, Israel‟s population<br />
continues to increase by about 2% annually (higher than nearly any other developed<br />
country), and its total greenhouse gas emissions level has been increasing by about 1%<br />
annually since 1990. At current trends, annual CO2 emissions will reach nearly 83 million tons<br />
by 2025. Therefore Israel faces significant challenges in lowering its CO2 emissions, while<br />
meeting the energy needs of a growing population in a rapidly developing country.<br />
Year<br />
Table 10 Total Emissions: 2000-2005 with projections through 2025<br />
Total emissions<br />
(1000 ton)<br />
2025 82,724 10,209 8.10<br />
Source: Israel Central Bureau of Statistics Energy in Israel 2005<br />
1.5 The scope of RE in Israel<br />
Since its pioneering efforts to develop rooftop solar water heating, Israel has done little to<br />
develop a renewable energy industry that can substantially reduce that energy dependency.<br />
Like most of its eastern <strong>Mediterranean</strong> neighbors, Israel has among the highest solar<br />
radiation rates in the world, yet its solar industry has largely consisted of developing<br />
technologies, rather than manufactured goods, for export. While Israel has over 1.3 million<br />
solar water heaters producing the equivalent of over 4% of Israel‟s electricity consumption as<br />
a result of mandatory solar water heating installations, it has only 886 kW of photovoltaic<br />
installations. In fact, the Ministry of National Infrastructures (MNI) estimates that, without<br />
7 Israel Central Bureau of Statistics. www.cbs.gov.il.<br />
CO2 emissions<br />
(1000 ton)<br />
Population<br />
(in 000)<br />
CO2 emissions<br />
per capita<br />
(in tons)<br />
2000 2,010,088 64,104 6,289 10.19<br />
2001 1,892,822 64,353 6,439 10.00<br />
2002 1,785,661 65,652 6,570 10.00<br />
2003 1,772,015 66,352 6,690 9.92<br />
2004 1,685,900 66,901 6,809 9.83<br />
2005 (est) 1,613,419 67,458 6,929 9.74<br />
Projections through 2025<br />
2010 70,988 7,634 9.30<br />
2015 74,702 8,410 8.88<br />
2020 78,611 9,266 8.48<br />
321
322<br />
ENERGY AND SUSTAINABLE DEVELOPMENT IN THE MEDITERRANEAN<br />
significant government involvement, solar penetration will continue to lag behind most<br />
European countries through 2025. However, without the initial government incentives, it is<br />
unlikely that solar PV and thermal systems, with facilities costs exceeding $4,000 per peak<br />
kW and few suppliers, will reach the necessary scale to be competitive with fossil fuels.<br />
Besides solar, Israel‟s renewables potential is limited. Biomass potential is about 8.6 Mtoe,<br />
primarily from municipal waste. Israel‟s wind potential is also rather low, with maximum<br />
capacity around 600 MW (or about 1.75 billion kWh), and faces the additional difficulties of<br />
location and grid interconnection. 8<br />
In 2004, the MNI published a set of policies and procedures to promote renewables<br />
development. The Israel Public Utilities Authority – Electricity (PUA) has since developed<br />
tariffs, licensing procedures, and codes of conduct for renewable electricity generators.<br />
Renewable electricity includes solar, wind, biomass, and all hydroelectric facilities except for<br />
pumped storage) 9 . To date, renewable developers‟ response to these government initiatives<br />
has been slow, and less than 100 MW of renewable generators have received conditional<br />
licenses 10 . In addition a 100-MW solar thermal generating station in the Negev (to be profiled<br />
below in greater detail) may receive a license in the near future.<br />
Nevertheless, the lack of renewables in Israel‟s energy portfolio is noteworthy; Israel‟s entire<br />
electricity generation mix in 2005 consisted of coal (75%), natural gas (11%), with the<br />
remainder consisting of oil, gasoil, and jet fuel (14%). Moreover, Israel‟s statistics on primary<br />
energy supply include no mention of renewables, indicating that renewables‟ share of<br />
primary energy supply is less than 0.1%, far less than the 2% to which the Government has<br />
committed since 2003.<br />
1.6 The scope of R UE in Israel<br />
Government standards for energy efficiency have been in place since 1989 when the Energy<br />
Resources Law was passed by the Knesset (Israel‟s Parliament). These standards include<br />
energy labeling for domestic products and inspections for larger commercial and industrial<br />
facilities. Although enforcement of these standards remains spotty due to lack of resources,<br />
energy efficiency as a strategic energy resource is just beginning to develop. The Israel<br />
Energy Master <strong>Plan</strong> and subsequent work indicate the potential for energy conservation of<br />
20% overall. Subsequent work by the Ministry of National Infrastructures suggests potential<br />
savings approaching 35% in all sectors – domestic, commercial, industrial, and<br />
transportation. 11 The MNI has begun the process of licensing energy service companies<br />
(ESCOs) to develop this RUE potential. As of September 2006 there were 16 ESCOs<br />
registered with the MNI, operating under performance contracts with standards set by<br />
Econoler, a major worldwide energy service provider assisting the MNI.<br />
1.7 Barriers to RE and R UE de ve lopm ent<br />
There is a number of reasons that RE and RUE have not made more inroads into Israel‟s<br />
energy sector, including the following:<br />
1) The Ministry of National Infrastructures, which has primary responsibility for energy<br />
policy, has not developed comprehensive implementation plans for RE and RUE. It has<br />
also not taken opportunities to coordinate RE and RUE with other Ministries that have<br />
mandates to promote RE and RUE. This inaction has impeded progress in establishing<br />
the necessary governmental coordination and budgeting for sustainable energy policy.<br />
2) The Israel Electric Corporation, due to its dominant role in electricity supply and fuel<br />
acquisition, has a strong bias toward maintaining and increasing dependence on<br />
traditional labor-intensive generation sources, especially coal. Despite recent initiatives<br />
to use cleaner coal and the notable shift to natural gas, IEC‟s fuel choices have<br />
increased risks to the environment and raised Israel‟s level of energy dependency.<br />
8 Presentation by Dan Raviv of RMST and Israel National Report on Climate Change.<br />
9 Israel Ministry of National Infrastructures, http://www.mni.gov.il/mni/heil/Energy/Electricity/ElectricitySustainability/ElectricityRenewables.htm<br />
10 Israel Public Utilities Authority – Electricity: www.pua.gov.il.<br />
11 MNI presentation at Prime Minister‟s Renewable and Alternative Energy Conference, November 2006
ISRAEL - National study<br />
Moreover, IEC has stymied PV growth by creating formidable procedural roadblocks for<br />
PV to obtain the required authorizations to interconnect with IEC‟s grid.<br />
3) Low renewable tariff incentives that reflect only marginal environmental externality costs,<br />
as opposed to incentives in other countries that compensate renewables for portions of<br />
their fixed costs as well. .<br />
4) The extremely low levels of public investment in research and development on RE and<br />
RUE. Much of the research and training in RE is funded by universities such as Ben-<br />
Gurion University in Beersheba and the Weizmann Institute in Rechovot. Most remaining<br />
R&D has been self-financed (for firms who have been successful abroad) or partially<br />
financed through small financing ventures through the Infrastructure and Environment<br />
Ministries. RUE investment is largely self-financed as well, as RUE training programs<br />
and technology improvements have largely been the initiative of Israel‟s electrical<br />
contracting and engineering organizations. Government funding to supplement these<br />
efforts has been inadequate.<br />
5) The lack of public awareness of climate change issues in Israel, which lags behind that<br />
of most European countries. Although opinion polls of Israelis indicate that an<br />
overwhelming majority believe that the Government does not do enough to address the<br />
environment (89%), and that nearly two-thirds identify global warming as a serious<br />
environmental issue (65%), actual practice indicates that less than 50% of Israelis have<br />
taken steps to reduce their energy consumption, 12 believing that the Government should<br />
take the initiative to developing the necessary action plans. Initiatives by organizations<br />
such as the Israel Union for Environmental Defense (“IUED”) and Greenpeace, as well<br />
as increased focus by the mainstream press on RE and RUE topics have only begun to<br />
address this issue.<br />
These factors explain why Israel has long ceased to be a leader in RE and RUE<br />
domestically. They may also explain why, despite Israel‟s proven capability in RE research<br />
and development, RE technology exports have been in the tens of millions of dollars, a small<br />
share of Israel‟s overall annual exports in excess of $20 billion. 13,14 Many promising RE and<br />
RUE developments have remained at the research stage because of the lack of resources<br />
and policy coordination necessary simply to make the initial assessment of their commercial<br />
viability.<br />
Therefore, it is critical that Israel improves its policymaking with regard to RE and RUE,<br />
despite an array of barriers including slow progress on policy, strong vested interest groups,<br />
and lack of public awareness. Such improvements must occur in the following areas:<br />
1) Ensuring compliance with higher efficiency standards mandated for new equipment.<br />
2) Converting voluntary standards for energy-efficient construction into requirements. This<br />
includes coordination between the Ministries for Environmental Protection, Housing &<br />
Construction, and Finance to develop mandatory “green” building standards.<br />
3) Improving the current time-of-use electricity tariffs to create stronger incentives for<br />
reduced usage during peak hours.<br />
4) Promoting entry of energy service companies (ESCOs), including expedited licensing<br />
processes.<br />
5) Improving the efficiency of street lighting for local and intercity roads<br />
The question for Israel is whether the small steps taken thus far will be sufficient to create an<br />
environmentally responsible, efficient, independent energy economy, while at the same time<br />
addressing growth rates that exceed those of Europe and North America.<br />
12 Pratt Survey of Environmental Sensitivity in Israel – survey for the Heschel Institute<br />
13 Israel Export Institute,. http://www.export.gov.il/Eng/_Uploads/4303Renewable.pdf<br />
14 Israel Ministry of Finance ,http://www.mfa.gov.il/MFA/MFAArchive/2000_2009/2002/5/High-<br />
Tech%20Opportunities%20in%20Israel<br />
323
324<br />
ENERGY AND SUSTAINABLE DEVELOPMENT IN THE MEDITERRANEAN<br />
2. Rational Energy Use (RUE) - Renewable Energies (RE): policies, tools,<br />
progress, resulting effects, case studies<br />
The starting points for RE and RUE policy in Israel are the UN Framework Convention on<br />
Climate Change and the Kyoto Protocol. Israel ratified the UN Framework Convention on<br />
Climate Change in September 1996, and set the groundwork for its activities following the<br />
Kyoto Protocol signing. Through its Inter-ministerial Committee on Climate Change, Israel<br />
prepared a national inventory of emissions and removal of GHGs, and has reported regularly<br />
on mitigation options and action plans to the United Nations, the most notable being:<br />
1) The integration of natural gas that should reduce Israel‟s CO2 emissions by 11.5 million<br />
tons annually by 2015.<br />
2) Budgeting for “green building” development that would reduce energy consumption by<br />
2.5 Mtoe. 15<br />
The Kyoto Protocol has been the main compliance standard for Israeli regulation and<br />
compliance since 1998, when Israel became a signatory. In February 2001, the Government<br />
issued an official decision 16 setting GHG targets and funding mechanisms pursuant to its<br />
Kyoto obligations as a signatory. Israel ratified the Kyoto Protocol in February 2004, to<br />
become effective in February 2005, and was classified as a non-Annex 1 country under the<br />
Climate Change Convention. To date, Israel has not adopted a position regarding post-Kyoto<br />
environmental standards to become effective in 2012, although the Ministry of Environmental<br />
Protection has recently issued tenders for assistance in addressing this post-Kyoto period,<br />
including assessing the merits of continuing Israel‟s Kyoto status as a “developing country”<br />
rather than a developed one. 17<br />
Soon after ratification, Israel created a Designated National Area (“DNA”) to determine<br />
whether its Clean Development Mechanism (“CDM”) initiative, developed in response to<br />
Kyoto ratification, complied with Kyoto‟s sustainable development criteria. The DNA consists<br />
of a variety of members, including Government ministries, the Israel Electric Corporation<br />
(“IEC”) and non-governmental organizations.<br />
In May 2003, the Government of Israel announced a strategic plan for sustainable<br />
development consistent with the <strong>Plan</strong> of Implementation accepted at the World Summit on<br />
Sustainable Development in 2002. Each Ministry is required to draft its own plan that sets<br />
forth tasks action plans, measurable goals, and target dates for achieving those goals within<br />
a predetermined budget. The overall strategic plan relates to the period from 2003 to 2020,<br />
and is updated every three years. While the Ministry of National Infrastructures has the<br />
greatest responsibility for RE and RUE development under the strategic plan, other Ministries<br />
assume major roles in developing energy efficiency, “green building” standards and<br />
legislation, and marketing RE and RUE. To date, the Ministries have largely met their<br />
obligations under the strategic plan, including updating their sustainable development<br />
strategies under the strategic plan, in 2004 and 2006. 18 The MNI is a glaring exception,<br />
however, having failed to meet obligations stipulated in the Strategic <strong>Plan</strong>, including: (a) to<br />
integrate solar energy in new construction, to have 2% of electricity production from<br />
renewable energy sources by 2007, and to stimulate the RE research and development<br />
necessary to meet future renewable energy targets.<br />
2.1 RUE and RE Policies<br />
2.1.1 Rational energy use policies<br />
Most of the MNI initiatives in RUE have occurred since 2004, following the completion of the<br />
Energy Master <strong>Plan</strong>. 19 RUE is an integral part of the Master <strong>Plan</strong> commissioned and mostly<br />
accepted by the MNI, and has been implemented slowly over the past 3 years. The Master<br />
15<br />
Israel National Report on Climate Change, http://www.sviva.gov.il/Enviroment/Static/Binaries/index_pirsumim/p0110en_1.pdf<br />
16<br />
Government of Israel Decision 2913(13).<br />
17<br />
Israel Ministry of Environmental Defense www.sviva.gov.il.<br />
18<br />
Israel Ministry for Environmental Protection (2006). “The Path toward Sustainable Development in Israel”<br />
http://www.sviva.gov.il/Enviroment/Static/Binaries/index_pirsumim/p0394_1.pdf<br />
19<br />
The energy master plan was not officially adopted by the Government.
ISRAEL - National study<br />
<strong>Plan</strong> addressed RUE in the context of energy conservation policy, defining it as “steps taken<br />
by the Government in order to achieve: maximum savings in primary energy usage;<br />
production and consumption efficiencies; and intelligent use of renewable energy from a<br />
societal, environmental, and market perspective. The <strong>Plan</strong> identified potential energy savings<br />
of more than 20%, which would have far-reaching effects on electricity system investment<br />
needs, economic growth, and environmental protection. Currently, the lack of timely<br />
information available to energy consumers and the exclusion of environmental externality<br />
costs in energy pricing have significantly restricted actual savings below the 20% level. To<br />
address this shortfall, the <strong>Plan</strong> made 3 major recommendations regarding RUE:<br />
3) Thorough information gathering regarding international experience;<br />
4) Developing rigorous methods of cost-benefit analysis for RUE reflecting social costs;<br />
5) Prioritization of RUE activities as a matter of policy.<br />
To date, the evaluation of RUE from a societal welfare perspective (including all<br />
environmental costs) is not integral to the Government‟s energy policy, and much of the<br />
energy efficiency efforts are targeted toward high-profile initiatives that can be implemented<br />
easily (e.g. large government offices and manufacturing companies).<br />
The MNI has focused primarily on developing energy efficiency standards for appliances,<br />
mechanisms for enforcing those standards, providing information regarding energy efficiency<br />
for the general public and mandating energy audits for large commercial and industrial<br />
consumers. In recent years, the rapid penetration of air-conditioning has been the primary<br />
driver of the growth in peak demand; air-conditioning load (over 250 thousand sold annually)<br />
now accounts for about 45% of the annual electric peak load. 20 . Since 2005, Israel has<br />
adopted new standards prohibiting the import of air conditioning with COP levels below 3 and<br />
with R22 coolants, in order to improve the efficiency of the air conditioning stock and reduce<br />
Freon gas release into the atmosphere.<br />
RUE at the national level is only in the initial stages, and there remains a distinct lack of<br />
information and training for electricity consumers, for whom the economic case for demandside<br />
efficiency has not yet been made. Moreover, despite the potential of over 100 million<br />
shekels‟ worth of savings in HVAC and refrigeration alone, RUE has not caught up with<br />
standards set in current law which have yet to be fully enforced. The Government itself may<br />
have started to recognize its obligation to provide RUE leadership, implementing its May<br />
2003 decision requiring each ministry to provide a sustainable development plan.<br />
Most significantly, the connection between GHG and residential energy usage has not been<br />
emphasized sufficiently, despite the fact that residential electricity consumers contribute<br />
nearly one-sixth of Israel‟s annual CO2 emissions. 21 Similarly, IEC has consistently fought<br />
demand-side measures as being opposed to its interests in deploying its workforce to<br />
construct new stations. However, with electricity generation comprising nearly 50% of Israel‟s<br />
energy requirements (with only 30% for transportation, and the remaining 20% for industrial<br />
and residential purposes), and electricity industry restructuring‟s increasing the financial risks<br />
associated with additional coal station investments, encouraging RUE may be in IEC‟s<br />
interests as well.<br />
Since 2004, the MNI has advanced the concept of energy service companies (“ESCOs”) to<br />
promote energy efficiency, beginning with commercial and industrial energy users. During<br />
these initial stages, the MNI has begun the approval process for ESCOs, developed<br />
performance contracting mechanisms, and earmarked funds for micro-projects (up to NIS<br />
100,000), while engaging international experts to develop its in-house expertise on ESCOs.<br />
Apparently, the rising cost of energy in the past several years is creating increased<br />
awareness of potential areas of energy savings, even for smaller to mid-sized companies.<br />
This awareness is reflected in the increasing frequency of energy efficiency articles in<br />
business and trade publications, and the anecdotal evidence of an increase in non-energy<br />
companies‟ participation in energy-related conferences and exhibitions. Potentially spurring<br />
some ESCO growth has been the PUA‟s imposition of time-of-use electricity rates on<br />
20 Climaton journal, November -December 2004 www.climaton.co.il.<br />
21 Israel National Report on Climate Change.<br />
325
326<br />
ENERGY AND SUSTAINABLE DEVELOPMENT IN THE MEDITERRANEAN<br />
electricity customers with annual energy consumption above 60,000 kWh has affected these<br />
customers‟ consumption patterns – possibly prompting them to hire energy saving consulting<br />
to identify ways to reduce and shift consumption, and thus reducing their electricity bills.<br />
Since, initial government-sponsored ESCO projects in Israel receive payments linked to the<br />
performance of the solutions they implement, they have a strong incentive to make the<br />
engineering and financial decisions to make those consumption changes happen.<br />
In response to this ESCO growth, the MNI is developing additional proposals for tax<br />
incentives and favorable loan conditions for all approved energy efficiency measures,<br />
regardless of whether they are implemented through an ESCO. Despite this advance, there<br />
is little overarching policy guidance from the MNI for the growing number of energy service<br />
professionals working with or for ESCOs. For example, licensed ESCOs, by focusing on<br />
energy savings in air conditioning and energy-intensive industrial equipment have reduced<br />
their customers‟ demand for energy by up to 30%. Perhaps more significantly, between 45%<br />
and 75% of these customers‟ overall electric bills reflect air-conditioning usage, usually<br />
occurring when Israel‟s electricity system is most stressed. The greatest success has been<br />
achieved for manufacturers with high energy requirements, which, by altering their<br />
manufacturing processes, have also reduced their emissions levels.<br />
The Government has also joined with MED-ENER to identify opportunities for energyefficient<br />
construction, and to develop awareness and commercial viability of new RUE<br />
projects. 22 . Recently, one such project funded in part by the Ministry for Environmental<br />
Protection, received MED-ENER‟s highest award for a “green” building project in the Arab<br />
village of Sakhnin. The Government considers this project to be of special importance in<br />
moving Israel toward the EU market requirement that at least 12% of conventional energy<br />
supply (including energy efficiency as a resource) be from alternative energy sources.<br />
Another recent example from the private sector is Intel‟s new building in its Haifa<br />
development center. This building is Intel‟s – and Israel‟s - first to be recognized as a “green”<br />
building through its LEED certification (Leadership in Energy and Environmental Design).<br />
As of September 2006 there were 16 ESCOs registered with the MNI, operating under<br />
performance contracts with standards. One problem that ESCOs have faced is the fact that<br />
the ESCO concept is alien to the Israeli banking community, which views even projects with<br />
very bankable results as being much riskier than they actually are (MNI website December<br />
12, 2006 conference on ESCOs). Nevertheless, ESCO development has created greater<br />
awareness of the need (and business case) for RUE, particularly by the high-tech and<br />
government sectors. New construction of high-tech office complexes, with its emphasis on<br />
glass exteriors and insufficient attention to energy-efficient HVAC design has in fact<br />
contributed to greater peak electricity consumption than many existing buildings. Moreover,<br />
in response to a fourfold increase in electricity use since the 1980s, and the claimed potential<br />
savings that may exceed 20%, the Knesset has passed legislation obligating public bodies to<br />
reduce electricity consumption.<br />
In addition to ESCO development, the MNI is authorized to offer incentives for purchasing<br />
more energy efficient appliances, especially in the case of market failures preventing such<br />
purchases, and to work with other Ministries to identify such opportunities (Energy Master<br />
<strong>Plan</strong>, “Energy Conservation Policy, May 2004"). To date, such efforts have been very limited,<br />
due to the combination of related factors, including:<br />
6) The Government‟s insufficient appreciation of energy efficiency for national policy;<br />
7) Insufficient – and declining - funding;<br />
8) Lack of centralized responsibility for energy efficiency; and<br />
9) General reticence toward market interference.<br />
Regarding local RUE initiatives, the MNI has not developed specific projects, but has worked<br />
with local authorities on projects such as increasing the penetration of photovoltaic systems<br />
in public buildings. It is unclear whether the Ministry will eventually develop local partnerships<br />
for RUE, as the Environment Ministry has done for its initiatives.<br />
22 Ministry of National Infrastructures website www.mni.gov.il
ISRAEL - National study<br />
Although the MNI‟s Energy Master <strong>Plan</strong> calls for an independent Energy Efficiency Authority<br />
to oversee energy efficiency, this area remains another small, underfunded division of the<br />
MNI that has received annual allocations below NIS 3 million out of a total national budget<br />
exceeding NIS 400 billion. If given a higher priority than the current Resources Division of<br />
the MNI, this Authority would be responsible for enforcing efficiency standards and<br />
integrating cogeneration, as well as integrating demand-side resources into electricity system<br />
planning. In contrast, the Israel Standards Institute has begun to set and enforce more<br />
stringent energy efficiency standards, especially for HVAC; this effort, while still not sufficient,<br />
is spurring developments in air-conditioning technology by Israel‟s major manufacturers such<br />
as Electra, Tadiran, and Trane.<br />
In February 2005, the Knesset (Israel‟s Parliament) passed an amendment to the Law of<br />
Municipal Government Supervision” requiring each local jurisdiction to form an environmental<br />
commission to “initiate and develop action plans regarding the environment and to ensuring<br />
sustainable development and growth”. As of late 2006, approximately 80 of Israel‟s 150<br />
municipalities have set up these commissions (53% of all municipalities) and another 15 are<br />
in the development process. Although there has been considerable interest in these<br />
commissions, and a substantial majority (nearly 75%) are satisfied with the performance of<br />
these commissions, many participants have noted that they lack the information required to<br />
carry out the Law‟s mandate. These participants have recommended training sessions to be<br />
held every few months, some of which began in December 2006. 23 Nevertheless, these<br />
commissions have been responsible for actions taken against Israel Electric Corporation‟s<br />
(“IEC‟s”) generating plants and for working with the Ministry and IUED to encourage “green<br />
schools” in their communities – Hadera being a prominent example of such a commission. 24<br />
The PUA has also promoted RUE, by means of expanding the time-of-use rate program,<br />
including mandating time-of-use rates for customers with annual consumption over 60,000<br />
kWh. Time-of-use rates in Israel have contributed to load shifting to off-peak hours, thereby<br />
reducing the probability of blackouts and allowing for more efficient dispatch of generators.<br />
Currently, although only 1.7% of IEC customers are billed at time-of-use rates, these<br />
customers constitute 55% of IEC load, and, without time-of-use rates, would contribute<br />
significantly to daily peak loads 25 . The PUA has begun investigating the viability of criticalpeak<br />
pricing, following the lead of successful programs in the US. Preliminary data from<br />
these programs indicate that critical peak pricing is significantly more effective than<br />
interruptible credit program and the time-of-use rates (both of which are offered by the PUA),<br />
in terms of meeting both customer preferences and system needs in maintaining reliability.<br />
As part of its RUE initiatives, the MNI issued a decision regarding co-generation in 2002<br />
reflecting the Government‟s goal of encouraging co-generation due to its high efficiency and<br />
low fuel consumption, while maintaining the efficiency of the current overall electricity<br />
generation system. The MNI has recognized cogeneration‟s benefits to Israel‟s energy<br />
sector, including its minimal land requirements and peak-shaving capability, while also<br />
recognizing the problems of non-dispatchability that cogeneration creates for the system<br />
operator. MNI staff estimates that the potential for cogeneration is about 3,000 MW of which<br />
about 2,000 MW is in industry.<br />
In 2004, the MNI issued rules for grid-connected cogenerators wishing to sell electricity to the<br />
grid. Cogenerators connected to the high-voltage distribution system can sell all of their<br />
electricity to the grid, while those connected to the transmission system can sell, during peak<br />
and shoulder periods, up to 70% of their output to the grid for 12 years or the greater of 35<br />
MW or 50% of their installed capacity for 18 years. The tariff set by the PUA compensates<br />
the cogenerators for normatively-determined capacity and fixed O&M costs, and varies<br />
inversely with the number of hours during which the cogenerators supplies capacity and<br />
23 Neaman Institute survey on Municipal Environmental Committees, September 2006 report to the Ministry for<br />
Environmental Protection; Climaton, December 2006, p. 31<br />
24 www.igudhadera.co.il<br />
25 Israel Public Utilities Authority presentation May2006.<br />
327
328<br />
ENERGY AND SUSTAINABLE DEVELOPMENT IN THE MEDITERRANEAN<br />
energy to the IEC grid. Nevertheless, it may be necessary to offer other incentives, such as<br />
participation in CDM markets, to make cogeneration a more attractive investment in Israel. 26<br />
Cogeneration‟s benefits to Israel may be limited nevertheless, due to the lack of very large<br />
manufacturing facilities and relatively low heating requirements. Moreover, the expansion of<br />
cogeneration in Israel depends greatly on the availability of inexpensive natural gas<br />
production and delivery during the coming years; reliance on diesel or oil for cogeneration<br />
creates environmental and potentially even larger price risks.<br />
2.1.2 Renewable energy (RE) development policies<br />
In 2002, the Government of Israel set a target of at least 2% of all electricity to be supplied by<br />
renewable energy by 2007; this target rises to 5% by 2016. Reaching this target requires the<br />
construction of large solar and wind plants, as well as a mixture of small hydro, biomass, and<br />
PV systems). Currently, although there are individual programs aimed at promoting RE, there<br />
is no overarching national strategy to achieve the Government-set RE targets.<br />
The Energy Master <strong>Plan</strong> commissioned by the MNI analyzes alternatives for RE, and makes<br />
recommendations for strategies to achieve specific RE objectives. However, rather than<br />
developing strategies, the Government has initiated individual programs with a few goals in<br />
mind. Some examples of programs include: incentive mechanisms for renewable electricity<br />
generation and co-generation, and stricter appliance efficiency standards, which are<br />
consistent with broadly defined goals such as improving Israel‟s balance of payments,<br />
improving public health, and promoting domestic achievements in renewable development.<br />
The Government‟s RE priority is solar energy, and the MNI has set an initial goal for solar<br />
thermal energy of 100 MW at an estimated cost of $225-$250 million, as a pilot project that<br />
should grow over time. Despite this emphasis on solar development as a policy matter,<br />
however, the Government has budgeted little for solar R&D; PV-related R&D spending was<br />
only NIS 688,000 in 2004 with an additional NIS 200,000 from non-governmental public<br />
funding. 27 In addition, the Israel Ministry for Environmental Protection has recently become<br />
involved in promoting promising Israel-based renewable technologies.<br />
In 2004, Israel, through the Environment Ministry established a Designated National<br />
Authority (DNA) for the Clean Development Mechanism. In May 2006, the Government and<br />
companies specializing in CDM projects sponsored a conference on the CDM and emissions<br />
trading as means of financing greenhouse gas reduction projects. Since Israel is classified as<br />
a non-Annex I developing country under the Kyoto Protocol, entrepreneurs who implement<br />
emissions reduction projects in Israel will be able to sell their carbon emissions credits to<br />
developed countries. Greenhouse gas emissions in Israel currently exceed 80 million tons<br />
per year, with 60% of the emissions generated by the energy sector. The electricity sector<br />
alone is responsible for over 35 million tons of GHG emissions.<br />
The Ministry of Environmental Protection has promoted Israel‟s unique advantages of being<br />
a developing country with the expertise in clean technologies and professional investment<br />
community of a developed country; this expertise is essential for developing and identifying<br />
projects to offset emissions in Kyoto-classified developed countries.<br />
The PUA has developed initiatives for incentivizing RE, through ratemaking and licensing<br />
procedures. Tariffs during the next decade are expected to cover over $1.5 billion in<br />
environmental investments by IEC alone, comprised of $1.4 billion in pollution reduction, and<br />
$0.1 billion in addressing hazardous waste cleanup at generator sites. 28<br />
The PUA is seeking to work with the Environment Ministry to set principles for long-term<br />
reduction of generator-caused pollution, including developing incentives for oil-fired<br />
generators that take steps to reduce pollution. The PUA has also tried to promote net<br />
metering for renewable (see below), but has received objections to this initiative for a variety<br />
of tax-related and operations-related reasons.<br />
26 Combined Heat & Power systems report, Neaman Institute, July 2006.<br />
27 National Survey Report of PV Power Applications in Israel 2004, May 2005 (report for the International Energy<br />
Agency under contract from the MNI).<br />
28 Israel Public Utilities Authority.
ISRAEL - National study<br />
In January 2007, the PUA issued draft licenses for small renewable generators selling<br />
directly to the IEC grid, which will comprise most of the generation licenses to be issued<br />
through mid-2007. These licenses set forth in broad terms the mutual obligations of the<br />
generator and IEC, but do not address the specific effects of intermittent, non-dispatchable<br />
generation on IEC‟s system operations. Such issues will be addressed in the broader context<br />
of electricity industry restructuring which is currently taking place.<br />
2.2 Ins tr ume n ts and measures to be taken in fa vo r of RUE and<br />
RE<br />
2.2.1 Tools and measures in favor of rational energy use<br />
The two primary policy actions for promoting RUE are:<br />
1) The expansion of mandatory time-of-use to all electricity customers using at least 60,000<br />
kWh per year; and<br />
2) The development of the ESCO mechanism, which has created significant energy<br />
savings in the large commercial and industrial sectors including large healthcare<br />
facilities.<br />
It remains the case that official development assistance is small, isolated, and with no longterm<br />
structuring capacity. The major area of improvement has been the improved<br />
coordination of renewable policy among all governmental parties involved in renewables<br />
generation from a policy perspective, with some linkage to the Ministry of Trade,<br />
Manufacturing and Industry and the Export Institute. Moreover, the area of energy efficiency<br />
has largely been a joint effort of the Environment Ministry, MNI, and the MNI‟s energy<br />
efficiency consultant Econoler, which has tailored the ESCO concept and the performance<br />
contract mechanism to Israel‟s circumstances.<br />
2.2.2 Tools and measures in favor of renewable energy<br />
The main economic incentive measures for RE are the renewable premium developed by the<br />
Israel Public Utilities Authority for non-IEC renewable electricity generator sales (except for<br />
some biogas) to the Israel Electric Corporation and the related feed-in tariff and licensing<br />
arrangements for solar thermal generation. In 2004, the PUA developed renewable premia to<br />
generation license holders producing electricity using renewable resources. The renewable<br />
premia reflect the costs of the avoided CO2, NOx, SO2 and particulate emissions due to the<br />
renewable generator‟s replacing fossil-fuel generators during each time-of-use period.<br />
The premium are based on the level of emissions in grams per kWh as determined<br />
periodically by the Environment Ministry, and is adjusted over time in response to Ministry<br />
revisions and changes in the CPI and the currency basket of the Bank of Israel. These<br />
premia are added to the recognized production costs paid by IEC to IPPs, and vary with the<br />
time-of-use blocks, reflecting the pollution properties of the fuels that would have been used<br />
for electricity generation if they had not been displaced by the renewable fuel. That is, the<br />
costs of acquiring the renewable energy are costs recognized in IEC rates.<br />
The approved premia are in effect for the lesser of:<br />
1) 15 years from the renewable generator‟s construction date; and<br />
2) The duration of the renewable generator‟s license.<br />
Although the premia are relatively small, ranging from 1.55 cents per kWh during shoulder<br />
hours to 2.45 cents per kWh during off-peak hours (due to the predominance of coal<br />
generation), the renewable premia have been an integral factor in obtaining financing for<br />
small renewable such as wind, small hydro, and biomass. Renewable generation owned by<br />
IEC is ineligible for the renewable premium, since the PUA already reflects these costs in<br />
designing IEC‟s tariffs. 29<br />
In August 2006, the PUA developed tariffs for solar thermal generators of 100 MW or greater<br />
(with and without fossil-fuel backup) and generators with installed capacities between 20 MW<br />
29 PUA Session 145, Decision 3 of July 13, 2004.<br />
329
330<br />
ENERGY AND SUSTAINABLE DEVELOPMENT IN THE MEDITERRANEAN<br />
and 100 MW. These tariffs reflect the normative (representative) costs of a solar thermal<br />
facility similar to those located in Southern California manufactured by Israel-based Luz (the<br />
predecessor of Solel Solar Systems Inc.), and do not include the renewable premium for<br />
which other renewable electricity generators are eligible.<br />
These normative costs are recognized in IEC‟s tariffs, since IEC is obligated to purchase the<br />
entire output of these generators. These tariffs do not assume any project financing support<br />
from outside sources, even from Government agencies. Nevertheless, the tariffs reflect<br />
normative values to be representative for the first 20 years of a solar thermal plant‟s<br />
operations, and lower values for later years, representing both efficiency improvements over<br />
time and the full repayment of long-term debt obligations. The current tariffs for solar thermal<br />
facilities have been in place since September 2006, but it is uncertain when the facilities<br />
themselves will be fully operational, due to substantial delays in the land acquisition and<br />
licensing processes. 30<br />
2.3 Energy E f fi ciency E vo l u ti on - decoupling<br />
Decoupling, or the separation of a direct increasing relationship between economic activities<br />
and energy consumption, has occurred at the national level in Israel. Energy intensity, the<br />
primary indicator of decoupling, has declined since 2002 from 53.9 Mtoe per NIS million GDP<br />
to 50.5.<br />
There has been no government policy aimed explicitly at reducing energy intensity, although<br />
Israel‟s transition to a value-added service economy and the declining role of heavy industry<br />
in the economy may help to explain the decrease. Moreover, it is possible (though barely<br />
detectable at this point) that the higher efficiency of power plants substituting natural gas for<br />
oil (and in the case of onsite generation, gasoil or diesel) may be contributing to this<br />
decoupling as well.<br />
It is unclear, however, whether changes in the electricity and natural gas delivery systems<br />
have contributed to lower energy intensity; the natural gas transmission system is new and<br />
the electricity transmission and distribution system have maintained loss rates comparable<br />
with the better electric systems in the US and Western Europe. 31<br />
The resolution of controversies between IEC workers and the Government regarding new<br />
coal generation may determine the rate of future decoupling, as coal‟s higher heat rates may<br />
undo some of the energy intensity improvements realized since 2002. Nevertheless, Israel is<br />
following the trend of energy intensities already set by most EU member countries.<br />
2.4 Renew able Ene rgy e vo l u ti on<br />
In 2002, the Government of Israel set a target of at least 2% of all electricity to be supplied by<br />
renewable energy by 2007; this target rises to 5% by 2016. Reaching this target requires the<br />
construction of large solar and wind plants, as well as a mixture of small biomass, and PV<br />
systems. The PUA is responsible for issuing licenses, setting tariffs and codes of conduct<br />
and overseeing IEC‟s conduct relative to renewable generators.<br />
In February 2004, the PUA set a premium for renewable suppliers based on the prices of the<br />
emissions avoided by substituting renewables for fossil units. That is, renewable generators<br />
are paid IEC‟s normative production costs plus the premium. As of 2006, all renewable<br />
generation except solar thermal is eligible for the premium, including renewable generation<br />
that is not selling to the grid or to private customers. The current premium ranges from 1.5<br />
cents during off-peak hours to 2.5 cents during peak hours. As of October 2006, the PUA has<br />
offered the premium to 7 generators, with total installed capacity of 13 MW, comprised of 6<br />
MW of wind, 6 MW of hydro, and 1 MW of biogas. However, this amount is expected to rise<br />
quickly, as nearly 150 MW of wind generation may receive conditional licenses.<br />
Tariffs for solar thermal generation are differentiated by size, reflecting the scale economies<br />
inherent in solar technology; solar thermal units with installed capacities under 100 MW<br />
receive a higher tariff than units with installed capacities of 100 MW or more. The tariffs are<br />
30 PUA Decision No. 177 (August 16, 2006 decision), www.pua.gov.il.<br />
31 See, for example, the 2005 IEC Statistical Report.
ISRAEL - National study<br />
also differentiated by time periods for which they are effective – the first 20 years and the<br />
next 10 years. In accordance with Government decisions, solar thermal units may retain that<br />
classification for fossil-fuel backup capacity up to 30% of the solar unit‟s installed capacity,<br />
and will be compensated according to the relevant fuel prices. The tariff for units with less<br />
than 100 MW capacity and units with at least 100 MW capacity are currently 20.7 cents and<br />
16.5 cents per kWh, respectively. The PUA expects that at least 200 MW of additional solar<br />
thermal capacity will be developed during the coming years.<br />
Investment in RE and RUE has been minimal, compared to conventional energies, with most<br />
investment being directed to the solar sector, both thermal and photovoltaic. The Israel<br />
Electric Corporation and the Israeli government have provided some financial assistance for<br />
projects that have demonstrated potential benefit to the electricity system. Until very recently,<br />
however, the investment and particularly the venture capital community has not financed<br />
these developments due largely to their long lead times to exits and the lack of opportunity to<br />
pilot-test their technologies locally. Consequently, successful firms such as Ormat<br />
(geothermal) and Solel (solar thermal) have relied heavily on power contracts and incentives<br />
abroad in order to develop their technologies in Israel.<br />
This phenomenon is beginning to change, however, as firms such as Israel Cleantech<br />
Ventures and Terra Venture Partners have begun to fund renewables technologies that have<br />
a sustainable business concept. In January 2007, Israel Cleantech Ventures completed its<br />
first closing of $15-25 million mainly from US investors; about 35% of this fund is targeted<br />
toward renewable energy and technologies improving electricity generation efficiency. 32<br />
Currently, Israel Cleantech Ventures alone has over 200 Israeli firms in its database, most of<br />
which are early-stage startups.<br />
Worldwide, the primary growth activity for renewables has been in the solar sector, which<br />
has increased rapidly in recent years. In 2005, solar generation increased by 44%, reflected<br />
in revenue increases of 50% and nearly 150% in profits. Solar generation is expected to<br />
increase six fold in the next 5 years. Israel continues to develop leading-edge solar<br />
technology in companies such as Solel and Millennium Electric, and at university settings<br />
including the Blaustein Institute on the Sde Boker campus of Ben-Gurion University and the<br />
Weizmann Institute.<br />
At the university centers, the main focus areas have been in materials studies, modeling<br />
solar devices and systems, energy conversion and storage, and concentrator photovoltaic.<br />
The most prominent developments at these centers have been the Weizmann Institute‟s<br />
solar tower for concentrating solar energy, and the solar dish facility at the Blaustein Institute.<br />
The Institute‟s main research emphasis has been on improving solar thermal and PV<br />
efficiency for commercial purposes while the Weizmann Institute in Rechovot has focused on<br />
solar technology as a base for other currently research-oriented processes such as hydrogen<br />
fuel storage and transportation. The Blaustein Institute is presently developing concentrating<br />
PV systems that may be able to reduce the cost of PV to $800 per kWp due to their energycollection<br />
efficiency and scale economies due to their multiple commercial applications. 33<br />
Within the corporate sector, leading-edge companies such as Solel (profiled below),<br />
SolarPower, and Millennium have made significant progress in solar thermal and PV<br />
development.<br />
DiSP has focused almost exclusively on developing concentrating PV systems for distributed<br />
power systems, with potential for providing both electricity and heat as a CHP unit (taking<br />
advantage of the act that 70%-90% of solar energy in most units escapes as heat rather than<br />
producing electricity Source: DiSP presentation at Nov 2006 conference).<br />
SolarPower has developed PV for a variety of applications in communications, “self-reliant”<br />
communities such as moshavim, and agriculture, thereby exploiting PV‟s unique ability to<br />
meet load reliably at specific locations at lower cost than the incumbent utility. SolarPower<br />
32 Israel Cleantech Ventures and Globes announcements www.globes.co.il.<br />
33 Israel Export Institute, December 30, 2006 www.export.gov.il/Eng/_Articles/Article.asp?ArticleID=5201&CategoryID=354 and<br />
Jerusalem Post November 13, 2006.<br />
331
332<br />
ENERGY AND SUSTAINABLE DEVELOPMENT IN THE MEDITERRANEAN<br />
has been planning PV expansion to larger areas, mainly Netanya-area industrial parks and<br />
facilities.<br />
Finally, Millennium Electric has used its PV/T solar cell array for monitoring traffic and billing<br />
on the Cross-Israel Highway toll road, on grid-connected school systems, and signage. IEC<br />
is working with Millennium on implementing a 29-home grid-connected “Solar Village”<br />
demonstration project in the Negev, to assess its impact on the local grid and the required<br />
interconnections and metering. Millennium‟s primary activities, however, are concentrated<br />
mainly in Europe and Southeast Asia, where it has collaborated with solar thermal and PV<br />
developers to construct 10-20 MW solar plants. 34<br />
It should be noted, however, that while IEC‟s investment in the project exceeds $1 million,<br />
the total funding for photovoltaics from the MNI in 2004 (as noted above) was only NIS<br />
688,000 ($160,000). 35<br />
In fact, since 80% of Israel‟s households use their solar water heating system (the largest<br />
such penetration in the world), suggests that PV should be readily accepted as well if prices<br />
declined sufficiently. Currently, most PV systems in Israel, with module prices averaging<br />
$5.50/peak-watt and marketed through a few specialty stores, are not cost-effective, mainly<br />
due to the lack of government incentives sufficiently promoting PV for it to achieve scale<br />
economies common in locations such as Northern Europe with far less solar intensity. To<br />
remedy this, the private sector has proposed a plan similar to Germany‟s for 50 thousand<br />
rooftop PV units, which would produce about 1% of current electricity and would avoid 1<br />
million tons of greenhouse gases. 36 . Until that time, most PV facilities will serve only<br />
environmental educational purposes.<br />
As of June 2006, 886 kWp of PV power have been installed in Israel, with 353 of that total<br />
installed in 2004 alone. Of the 886 kWp, 653 are off grid domestic, 210 are off-grid nondomestic;<br />
only 23 kWp are grid-connected. There are several projects and demonstrations of<br />
grid-connected PV systems, all of which are privately financed, and all of which are<br />
education-related demonstration and field-test programs. 37<br />
The Israel Electric Corporation (IEC), although not integrating RE into its fuel mix, has<br />
reduced its environmental footprint over the past 10 years through the substitution of fossil<br />
fuels with lower emissions. SO2 emissions per kWh dropped from 5.7 grams per kWh in<br />
1995 to 2.6 in 2004, mainly due to the substitution of 0.5% and 1.0% sulfur coal replacing<br />
coal with higher sulfur content, but also due to the substitution of natural gas for crude oil.<br />
Similarly, NOx emissions declined from 3.0 grams per kWh in 1995 to 2.0 in 2004, and<br />
particulates dropped from 0.28 grams per kWh to 0.09, mainly due to improved fuel burning<br />
technology and the introduction of natural gas. IEC has also taken steps to minimize the<br />
water pollution - and overall water needs-.of electricity generation, including the use of<br />
brackish water for cooling whenever feasible, and acquiring advanced fuel storage systems<br />
to minimize the possibility of groundwater pollution. 38<br />
In addition to solar, there is some potential for up to 600 MW of wind energy in Israel,<br />
although only 150-200 MW are included in the MNI-approved electricity plan. Currently, both<br />
IEC and private producers are either planning over 80 MW of wind facilities, exclusively in<br />
northern Israel. Although wind facilities developers have encountered few of the objections to<br />
wind power encountered by their counterparts in the US and Europe, there are few areas in<br />
Israel with the combination of topography and wind speed to make wind a viable option,<br />
despite its per-kWh cost being less than half of the cost of solar thermal and its being ideally<br />
suited to the PUA‟s renewables premium mechanism. The most prominent wind facility to<br />
date has been the 6-MW Golan Heights wind farm, producing approximately 12,000 MWh<br />
34 Millennium website: http://www.millenniumsolar.com.<br />
35 Millennium Solar presentation at 2005 Energin Conference.<br />
36 SolarPower presentation at 2005 Energy Conference in Tel Aviv Israel.<br />
37 IEA Cooperative Programme on Photovoltaic Power Systems, National Survey Report of PV Power Applications in Israel<br />
2004), May 2005.<br />
38 IEC Environmental Report 2004.
ISRAEL - National study<br />
per year. 39 In addition, the PUA has issued conditional licenses to other non-IEC wind<br />
facilities intending to sell their electricity to the IEC grid.<br />
A promising area for solar energy development, especially for regional development, is<br />
solar/desalination integration, by which solar energy produces electricity used by desalination<br />
facilities. Since the solar facility‟s operations are limited to daytime hours while the<br />
desalination system operates continuously, such integration requires either large heat<br />
storage capacity or fossil-fuel backup – both of which significantly reduce these facilities‟<br />
economic viability. To address these issues, Israeli firms such as Solel and IDE<br />
Technologies have developed technologies to improve solar radiation collection and to use<br />
the solar thermal energy to distill water directly via evaporation without generating electricity<br />
first.40 For facilities requiring electricity generation, however, the issue of fossil-fuel backup<br />
is significant, particularly with regard to future natural gas availability.<br />
In addition to the technology issues, solar/desalination integration in Israel has faced two<br />
additional obstacles: (1) a lack of sufficient inexpensive land along the <strong>Mediterranean</strong><br />
coastline and (2) lengthy licensing processes. Despite these obstacles, this integration has<br />
progressed, albeit slowly. The most prominent example of this integration is the cogeneration<br />
and desalination plant in Ashkelon, which is one of the largest in the world, and which is<br />
projected to produce over 100 million cubic meters (“MCM”) of water annually. The power<br />
plant‟s capacity will be approximately 80 MW, 56 MW of which will be used to power the<br />
desalination plant. To date, the cogeneration facility has received a conditional generation<br />
license from the PUA, but does not yet supply the desalination facility, which continues to<br />
receive electricity from IEC. This facility has become a model of compliance with high<br />
environmental standards, setting a benchmark for future facilities throughout the<br />
<strong>Mediterranean</strong> region. 41<br />
The Government of Israel is aware of the possibilities for regional development of solar<br />
energy projects, especially between Egypt‟s Sinai Peninsula, the Jordanian deserts, and<br />
Israel, thereby taking advantage of scale economies and information sharing, both of which<br />
are critical for solar development. This regional cooperation could occur through tax breaks<br />
and subsidized loans for companies – and universities – that are willing to engage in this<br />
regional development.<br />
It should be noted that these economic benefit estimates do not entirely reflect business<br />
competitiveness and international trade benefits. To the extent that RE and RUE reduce<br />
operating costs and create additional revenue streams (e.g., emissions permit trading), the<br />
above estimates understate the true value of RE and RUE.<br />
2.4.1 Rational use of energy<br />
With regard to RUE, achieving energy savings of 20% can result in an annual cost savings of<br />
some $2 billion (Eco Energy estimate). These cost savings do not include the costs avoided<br />
by the Israel Electric Company by reducing peak-hour consumption on the generation,<br />
transmission, and distribution systems. However, the incentives provided for RUE are limited<br />
to favorable performance contract provisions to spur ESCO growth, expanded use of time-ofuse<br />
rates, and net metering proposals (albeit at an initial stage).<br />
The PUA has also proposed a net metering mechanism for customers connected to the lowvoltage<br />
distribution network, and is primarily intended for photovoltaic and small wind<br />
systems. These customers are required to have time-of-use metering and all net metering<br />
settlement will be priced at the relevant time-of-use rate for low-voltage distribution<br />
customers with a discount reflecting avoided pollution costs. The PUA proposal allows<br />
residential customers to use either PV or small wind turbines, while other customers may use<br />
any renewable energy to be considered eligible net metering customers. IEC, in turn, would<br />
be responsible for accounting for the electricity generated to and consumed from the grid,<br />
and the relevant billing tariff, as well as ensuring that these generators meet the technical<br />
39<br />
Baruch, R. and Ben-Dov, E. (2002). “The use of wind energy for electricity generation or 0% polluting electricity” (Hebrew).<br />
40<br />
Sagie, D., Feinerman, E. and Aharoni, E. (2001). “Potential of solar desalination in Israel and in its close vicinity”, Desalination<br />
139, 21-33.<br />
41<br />
Einav, R. and Lokiec, F. (2003). “Environmental aspects of a desalination plant in Ashkelon”, Desalination 156, 79-85.<br />
333
334<br />
ENERGY AND SUSTAINABLE DEVELOPMENT IN THE MEDITERRANEAN<br />
standards required for grid interconnection. The PUA proposal also allows for some flexibility<br />
with regard to emissions trading mechanisms, by which either IEC or the customers would be<br />
eligible traders.<br />
Some potential tools for expanding RUE include:<br />
1) Greater education levels, beginning at the elementary school level, including greater use<br />
of mass media, with an emphasis on how personal energy decisions affect broader<br />
society. The education should also include improved energy efficiency labeling on<br />
appliances and on retail exhibits. Moreover, education efforts should give the successful<br />
ESCOs an opportunity to develop cooperative ventures to publicize their achievements;<br />
currently, most of this publicity reaches only the small community of energy professionals<br />
and interested policymakers.<br />
One possible education vehicle proposed by researchers at the Technion in Haifa is to<br />
have “Energy Star”-type ratings for buildings that have received thorough energy audits;<br />
the standards for these ratings would be the responsibility of the Israel Standards<br />
Institute. The reasons for a given rating would be explained at the layperson‟s level,<br />
emphasizing both environmental and economic benefits of RUE. Offices and large<br />
public buildings may be the logical initial audience for such education efforts, due to their<br />
higher energy bills and generally energy-inefficient design (e.g., excess use of reflective<br />
glass in office complexes and lack of ambient light).<br />
However, the residential and small commercial demands for air-conditioning and lighting<br />
should be approached soon afterwards, due to their more rapid demand growth and<br />
greater suitability for mass-market educational material.<br />
2) Mandatory demand-side management programs for all fuels, based on a “societal test”<br />
(net present value of the demand-side measure to society, including environmental<br />
costs), and directed primarily to inefficiencies resulting from market failures. Funding for<br />
such programs would come from fuel and electricity surcharges, as well as targeted tax<br />
breaks. The programs would be centrally administered by one entity (preferably an<br />
independent authority or an “efficiency utility” regulated by that authority).<br />
For example, air-conditioning, which is responsible for nearly half of Israel‟s summer<br />
peak loads, can be significantly more efficient when the financial incentives for<br />
purchasing higher COP units – many of which are manufactured domestically- make<br />
such purchases economically viable. Combined with more “aggressive”<br />
interruptible/curtailable and real-time pricing programs introduced by the PUA, these<br />
programs‟ valuations would increase – and their payback horizons would decrease -<br />
significantly. In this way, consumers‟ incentives and society‟s incentives for energy<br />
efficiency would be aligned.<br />
3) Non-bypassable public benefits charge on all electricity sales, in order to ensure<br />
adequate funding for RUE initiatives, including partial funding of efficient air conditioning<br />
systems, whose initial costs and long payback periods make such purchases<br />
unattractive to most residential and commercial customers. 42<br />
2.4.2 Recommendations for developing RE in Israel<br />
The following are recommended actions for developing RE in Israel, most of which require<br />
much more active government involvement:<br />
1) A “carrot-and-stick” approach to developing RE, consisting of a combination of improved<br />
feed-in tariffs and enforceable emissions standards. The recent development of feed-in<br />
tariffs for grid-connected solar thermal units reflecting the units‟ capital and fixed O&M<br />
costs should be expanded to other renewable technologies that are not yet costcompetitive<br />
with fossil fuel generation, and should be only the beginning of incentive<br />
mechanisms offered by the Government. Although the current premium for renewable<br />
energy reflect the marginal external cost of the non-renewable energy displaced, they do<br />
not allow the renewable generator a sufficient return on its fixed investment and O&M<br />
costs. The solar thermal tariffs follow the model of the successful feed-in tariff programs<br />
42 Dr. M. Hirsch et al. (2004). “A Survey of Air Conditioning in Israel – Potential savings and policies to allow its realization”,<br />
report for the Samuel Neaman Institute and Ministry of the Environment.
ISRAEL - National study<br />
in Europe, which have been responsible for rapid adoption of renewable generation and<br />
for R&D investment in new technologies. Such feed-in tariffs would also signal to the<br />
investment community abroad that Israel believes in the level of its domestically<br />
developed RE technology.<br />
An example of enforceable standards would be Emissions Performance Standards<br />
(EPS), which would complement and strengthen the appliance efficiency standards that<br />
the MNI has developed for nearly 20 years. EPS would require any new generation to<br />
emit less than a given amount of CO2 per MWh as a condition for receiving and keeping<br />
its license. EPS should be considered a temporary measure, however, until permanent<br />
load-based GHG emissions standards become feasible. Such a measure is proposed for<br />
California, for which emissions below the EPS cap of 500 kg of CO2 per MWh are<br />
achievable by a variety of technologies including “clean coal”. 43 EPS would require each<br />
unit to demonstrate its own emissions levels, without reliance on CDM or other<br />
emissions trading mechanisms. EPS thus functions as a binding standard reflecting<br />
Israel‟s future GHG obligations, allowing only new generation complying with those<br />
standards to be part of Israel‟s energy mix, and creating greater certainty, benefiting the<br />
electricity generation sector and its capital sources alike.<br />
2) A non-bypassable public benefits charge on all electricity sales, in order to ensure<br />
adequate funding for R&D in renewable energy.<br />
3) Regular updates of environmental costs that are reflected in the PUA tariff to account for<br />
worldwide changes in emissions values as emissions markets become larger and more<br />
liquid.<br />
4) Development of net metering, especially for small renewable generators wanting to sell<br />
excess generation to the IEC grid. Net metering allows the generator to (net) sell to the<br />
grid at peak hours and to (net) purchase from the grid during the remaining hours. It has<br />
been adopted by 40 US states and Canada, and has spurred the growth of small-scale<br />
solar photovoltaic systems and wind generation. Such an initiative requires little more<br />
than interval metering and appropriate tariffs and interconnection agreements with IEC.<br />
Net metering is an agenda item for the PUA, but it has not developed beyond the<br />
exploratory stage, to date, mainly due to issues regarding taxation and IEC<br />
interconnection.<br />
It may be necessary to set up a separate regulatory authority to implement these<br />
recommendations. This authority would introduce and promote them via introducing<br />
legislation and creating a broader base for education than is possible through private<br />
organizations. Education would also accelerate domestic R&D in energy efficiency, for which<br />
the authority can also address the market failures inhibiting its growth. The authority would<br />
also have broader powers for supervision and enforcement than is currently possible through<br />
a government ministry.<br />
2.5 Existing or expecte d effects and bene f its of RE and R UE<br />
The potential effect of both RE and RUE on Israel‟s economy is substantial. In a recent study<br />
conducted by Eco Energy, assuming 2,000 MW and 500 MW of PV phased in by the year<br />
2025, indicates that solar-generated electricity would reduce greenhouse gas emissions by<br />
nearly 4 million tons by 2025, and would increase steady-state (i.e., post construction)<br />
employment by nearly 3,200 per year. The overall benefits through 2025, taking into account<br />
employment, environment, avoided T&D infrastructure, avoided pollutants, and balance of<br />
payment improvements is between $1.8 billion and $2.7 billion, with ongoing postconstruction<br />
benefits of some $200 million per year. 44 That is, the benefits from developing<br />
Israel‟s solar sector include energy security, environmental improvement and increased<br />
economic opportunity in areas with poor job prospects, and which are national priority<br />
locations, but which are areas with significant solar exposure.<br />
In a different study performed by an Israeli developer of concentrated PV systems, the<br />
foreign currency expenditure saved by developing solar resources will be about $130 billion,<br />
43 California Public Utilities Commission Decision 07-01-039 dated January 25, 2007.<br />
http://www.bracewellgiuliani.com/blog/energylegalblog/uploads/CPUC%20GHG%20Order%201-25-07.pdf<br />
44 Source: EcoEnergy study for Greenpeace “Utilization of Solar Power in Israel – Economic and Social Impacts<br />
335
336<br />
ENERGY AND SUSTAINABLE DEVELOPMENT IN THE MEDITERRANEAN<br />
or $3.25 billion per year, 33,700 jobs will be created over a 40-year period and another 20<br />
thousand jobs will be created for export, while reducing Israel‟s fossil fuel dependency to a<br />
mere 20%. 45 These results are roughly consistent with Solel‟s estimate of $1.4 billion dollars<br />
from saving 3.5 million tons of fuel with 3,000 MW of solar generation.<br />
The potential benefits of RUE may be substantial as well. Consensus estimates of the<br />
potential energy consumption savings in buildings can range from 25-40% through improved<br />
insulation, more efficient heating/air-conditioning, maintaining year-round temperatures<br />
between 17.5 and 25.5 degrees Celsius, and passive solar energy. At current rates,<br />
electricity bill savings would decline by $1.0 to $1.6 billion annually.<br />
In addition to providing more funds for private savings and capital investments, the<br />
consumption decrease would enable IEC to avoid costly capital expenditures precisely when<br />
its precarious financial condition and imminent restructuring would cause the financial<br />
community to view such expenditures as very risky. Therefore, RUE would improve the<br />
financial viability and competitiveness of Israel‟s electricity consumers, while also improving<br />
IEC‟s prospects in advance of restructuring and partial privatization during the coming<br />
decade.<br />
3. Examples of good practice, case studies<br />
3.1 Derija t – Be douin vi llage in t he Ne ge v – solar PV sys t e ms<br />
Derijat is a small Bedouin village in southern Israel and is located about 6 km from the<br />
nearest IEC grid. It has depended on its own portable fossil-fueled onsite generators. Until<br />
recently, its entire electricity supply was provided by 26 old diesel generators that operated<br />
only a few hours each day. Recently, however, the Government provided funding for Derijat<br />
to install its own photovoltaic systems to meet its electricity needs; Derijat is now a fully<br />
“sustainable” village.<br />
The project was initiated by the MNI, the Negev Development Authority and the Office for<br />
Developing the Negev and the Galilee. As an unrecognized community, it was not connected<br />
to the water, electricity, or other systems. The village hired Haifa-based engineering firm<br />
Interdan to install and manage the multipurpose 21-MW solar electricity system project that<br />
provides power to the entire 850-person village.<br />
The contract includes a 4-year maintenance contract and allows Interdan to remove the<br />
system from customers misusing the system 46 . The energy is collected by 8 solar PV panels<br />
on the rooftops and stored in a DC battery system which converts it to AC, and has a storage<br />
capability of 4 days without direct sunlight (a rare occurrence in the Negev).<br />
The system, however, cannot support air conditioners and heaters that would quickly<br />
consume the stored energy, so generators are still used at night. The system has been<br />
installed in 20 of the 100 households thus far, as well as the local school, mosque and<br />
streetlights. 47<br />
The first stage of this project cost approximately $800 thousand, and the payback period for<br />
the project, accounting for fuel savings by not using the diesel generators, is expected to be<br />
about 3 years, assuming current diesel costs of NIS 4 per liter (i.e., NIS 1 per kWh).<br />
3.2 Solel - develope r of solar the rma l s ys t ems<br />
Solel is the largest developer of solar thermal technology for centralized power generation.<br />
Its predecessor, Luz, set up the world‟s largest solar thermal facility (SEGS) in southern<br />
California, but fell victim to low oil prices and lack of government commitment to incentives<br />
that would make such facilities more economically viable. However, the recent surge in oil<br />
prices and the rapidly increasing demand for proven renewable energy sources has<br />
45 Analysis by Dov Raviv of RMST, www.rmst.co.il.<br />
46 Photon International, February 2006<br />
47 http://www.israel21c.com , February 12, 2006, and presentation by Eddie Bet HaZevdi of MNI)
ISRAEL - National study<br />
transformed Solel from a small R&D company with annual revenues under $5 million to a<br />
major worldwide player with projected revenues exceeding $100 million in 2007.<br />
This growth has fuelled additional development, especially in heat collection, which may<br />
decrease the per-kWh cost of the technology from over 15 cents to nearly 6 cents by 2011,<br />
making Solel‟s technology competitive in many oil-based and natural gas-based electricity<br />
systems (e.g., Spain and the southwestern US) without factoring in government subsidies<br />
and avoided environmental costs. The SEGS generators have reduced fuel imports in the US<br />
by 11 million tons and reduced CO2 emissions by 24 million tons, in addition to creating<br />
economic opportunity in a remote section of southern California.<br />
Solel uses the solar-trough method which involved glass parabolic collectors that track the<br />
sun‟s movements throughout the day. The collectors concentrate sunlight onto steel pipes<br />
that contain a heat transfer fluid. That fluid is pumped through heat exchangers to generate<br />
steam, which powers the turbine that creates electricity. The technology is applicable for both<br />
central-station power plants and distributed generation on commercial and industrial sites.<br />
In Israel, Solel has received a special tariff from the PUA and is in the final stages of<br />
receiving a license for a 100-MW plant in the Negev desert that would be the first central<br />
solar thermal electricity generator in Israel. This facility would be able to meet the peak<br />
demands of approximately 200 thousand Israeli residential customers. The major factor<br />
hindering the licensing process has been land acquisition for the rows of collectors required.<br />
Solel has been able to convince many within the Israeli government of the economic,<br />
environmental, and energy security benefits of developing solar thermal as an indigenous<br />
renewable generating technology. Solel has set a goal of meeting 10% of Israel‟s electricity<br />
demand through its technology by 2020. 48<br />
Nevertheless, the difference between Solel‟s development outside Israel and its relative<br />
stagnation domestically points to the need for government involvement and citizen<br />
awareness of the benefits of solar technology. Solel‟s success in the southwestern US and<br />
southern Europe has been a result of government policy requiring utilities to purchase<br />
renewable generation and favorable tax and licensing provisions. Solel‟s slow progress in<br />
Israel has been a result of a combination of political factors such as ambiguity in the licensing<br />
responsibilities assigned to the Ministry and the PUA, and renewables policies that have not<br />
been followed, as well as opposition from IEC.<br />
Solel‟s ability to combine its own advocacy with various environmental groups and<br />
sympathetic officials at the MNI and PUA (who have been responsible for developing<br />
policies, tariffs and draft licenses) may have finally made the breakthrough for development,<br />
at long last, of a significant solar sector in Israel.<br />
4. Glossary<br />
CDM - Clean Development Mechanism. Arrangement under the Kyoto Protocol allowing industrial customers in<br />
developed countries to invest in emissions-reducing projects in developing countries, instead of investing in<br />
similar but more expensive projects in their countries.<br />
COP – coefficient of performance used to measure the efficiency of heating and cooling systems. It is the ratio of<br />
useful energy output (heat removal or heat delivery) to useful energy input<br />
ESCO – energy service company. A company that provides energy management services, frequently<br />
compensated on the basis of energy cost savings provided.<br />
HVAC – heating, ventilation, and air-conditioning<br />
IEC – Israel Electric Corporation (99.8% owned by the Government of Israel)<br />
kWp – kilowatt-peak. Measure of maximum capacity used mainly for intermittent renewables generation such as<br />
solar and wind.<br />
Ministry of Environmental Protection – the Government Ministry responsible for setting and enforcing<br />
environmental policy.<br />
48 Solel website www.solel.com<br />
337
338<br />
ENERGY AND SUSTAINABLE DEVELOPMENT IN THE MEDITERRANEAN<br />
MNI – Israel Ministry of National Infrastructures- the Government Ministry responsible, inter alia, for setting energy<br />
policy, including determination of supply-side and demand-side resource planning.<br />
PUA – Israel Public Utilities Authority – Electricity – the electricity regulator responsible for setting tariffs, issuing<br />
licenses, consumer protection, and setting performance criteria for licenseholders.<br />
PV – photovoltaic. Solar power technology using solar cells to convert solar energy into electricity.<br />
Toe – tons of oil equivalent (Mtoe = thousands of tons of oil equivalent)<br />
Time-of-use (T.o.U.) rates. Tariffs differentiated by time-of-day and season, thereby providing price incentives for<br />
customers to shift consumption from peak hours.
5. Table of figures<br />
ISRAEL - National study<br />
Figure 1 Historical and projected demands for electricity ........................................................................................................... 316<br />
Figure 2 Evolution of Total Primary Energy Supply 1971 – 2004 ................................................................................................. 318<br />
Figure 3 Israel electricity consumption per US$1000 of GDP ...................................................................................................... 319<br />
Figure 4 Energy supply per capita (in tons oil equivalent) ............................................................................................................ 320<br />
Table 1 Final Consumption of Energy Products for 2004 and 2005 ............................................................................................. 316<br />
Table 2 Energy intensity: 1990 - 2005 ....................................................................................................................................... 317<br />
Table 3 Type of primary fuel consumed by power plants*(Thousand tons) ................................................................................... 318<br />
Table 4 Historical trends for Israel’s total primary energy supply: 1980-2005 ............................................................................. 318<br />
Table 5 Annual Electricity Consumption by Sector: 2001-2005 .................................................................................................. 319<br />
Table 6 Annual average electricity price (in US cents per kWh) .................................................................................................... 319<br />
Table 7 Israel's Primary Energy Supply 2005 Thousands of t.o.e. ............................................................................................... 320<br />
Table 8 Israel's Primary Energy Supply 2004 Thousands of t.o.e. ............................................................................................... 320<br />
Table 9 Primary Energy Supply and Final Energy Consumption - forecast through 2025 ............................................................... 321<br />
Table 10 Total Emissions: 2000-2005 with projections through 2025 ........................................................................................ 321<br />
339
ITALY<br />
Mrs Carmen Glorioso, Mr Mario Lionetti and Mr Francesco Presicce, Italian<br />
Ministry for the Environment Land and Sea, Department for Environmental<br />
Research and Development<br />
TABLE OF CONTENTS<br />
I. Summary ........................................................................................................................ 343<br />
II. Résumé ......................................................................................................................... 345<br />
III. National Study Report ................................................................................................. 347<br />
Introduction .................................................................................................................................................... 347<br />
1. The country’s energy situation: indicators and basic data ................................................................ 347<br />
2. Rational energy use and renewable energies: policies, tools, progress, resulting effects,<br />
case studies ................................................................................................................................................... 353<br />
3. Energy technologies case studies and good practices ....................................................................... 366<br />
4. References ................................................................................................................................................ 369<br />
5. Table of illustrations ................................................................................................................................ 370
I. SUMMARY<br />
ITALY - Summary<br />
Italian priorities in the energy field are strictly related to the main issues of securing energy<br />
supply, reducing GHGs and pollutant emissions and assuring competitiveness in the energy<br />
sector. To this end, renewable energies and energy efficiency represent the key tools able to<br />
address simultaneously all the above mentioned topics.<br />
In this field, the main targets are the 6,5% of GHGs reduction with respect to 1990 levels<br />
under the Kyoto Protocol and the national indicative objective of 22% of electricity from<br />
renewable energy sources in the gross electricity consumption in 2010 under the EU<br />
Directive 2001/77/CE.<br />
Total primary energy supply will increase in the next years, but the policies adopted to<br />
promote renewable energy and energy efficiency will lead to a constant slow decrease of<br />
energy intensity. Anyway, Italy will remain dependent on fossil resources in the next future<br />
and, consequently, strongly dependent on external resources (almost 91% of natural gas and<br />
93% of oil are expected to be imported in 2020).<br />
Renewable energy will continue to increase in time, above all in the electricity sector. The<br />
2005 renewable energy electricity gross production (almost 50 TWh) represents 16,4 % of<br />
total gross production, 14,1% of gross inland consumption (352,8 TWh) and 15,1 % of total<br />
electricity demand (net consumption + network losses = 330,4 TWh).<br />
The main tool to support renewables will remain the “Green certificate” market-based<br />
mechanism. In parallel, the feed-in tariff scheme for photovoltaic and the recent legislation on<br />
the energy efficiency in the building sector will contribute to accelerate the increase of<br />
renewables in the energy mix.<br />
Another market-based mechanism, “White Certificates”, is also used to support energy<br />
efficiency and energy saving measures to reduce consumption to the end-use. The aim is to<br />
achieve, by the end of the five-year period 2005-2009, a total energy saving of 2.9 million<br />
tep.<br />
In terms of policy priorities, the building sector has been considered a relevant sector in<br />
which it is crucial to intervene to reduce energy consumption and related emissions. Among<br />
several standards, conditions and modalities to improve the energetic performance of the<br />
buildings, the recent legislation (Legislative Decree 29th December 2006, n.311) foresees<br />
also that in all new buildings, or in case of restoration of existing thermal plants, at least 50%<br />
of the annual primary energy necessary to produce hot sanitary water should be provided<br />
using renewable energy sources. This limit is reduced to 20% for buildings located in<br />
historical centres.<br />
For new buildings, or in case of restoration, it is foreseen the obligation to install photovoltaic<br />
for electricity production with a power capacity to be defined in ministerial decree.<br />
Furthermore, for new buildings, or in case of restoration, it is obligatory to foresee the setting<br />
of all necessary works related to the connection to the district heating network, if this is<br />
located nearby.<br />
Energy saving and renewable energy are also boosted through specific fiscal and<br />
administrative measures, generally introduced each year with the Financial Law, such as:<br />
deduction from taxes of a certain % of total cost of the interventions devoted to the<br />
increase of the efficiency or to the installations of renewable energy equipments;<br />
reduced taxation (such as VAT) for clean technology equipments and systems<br />
reduction/rationalization of administrative procedure and cost<br />
Capital incentive are also available, but the adoption of market-based mechanisms at<br />
national level leave them mainly as regional and local measures.<br />
To support measures to reduce GHGs emissions from energy sources, a Rotation Fund, with<br />
a size of 200 M€ for each year from 2007 to 2009, has been established to support a number<br />
343
344<br />
ENERGY AND SUSTAINABLE DEVELOPMENT IN THE MEDITERRANEAN<br />
of priority actions such as "high-performance distributed micro-cogeneration plants for<br />
electricity and heat generation" and other interventions (including pilot projects) utilizing<br />
renewable energies.<br />
Italy is also very active in promoting renewable energy and energy efficiency at international<br />
level through the implementation of cooperation projects and programmes. Among<br />
multilateral activities, a special mention has to be made on the active involvement in the field<br />
of renewable energies: in 2002 Italy launched the Type II Initiative “<strong>Mediterranean</strong><br />
Renewable Energy Programme (MEDREP)” with the aim to promote renewable energies in<br />
the <strong>Mediterranean</strong> region and in 2006 the international partnership on Bioenergy (GBEP)<br />
with the aim to promote a sustainable use of biomass and biofuels.<br />
Furthermore, Italy is carrying out a relevant bilateral cooperation on sustainable energy with<br />
China, Balkan countries and USA, mainly devoted to research and development on clean<br />
and innovative energy technologies and applications.<br />
As for the <strong>Mediterranean</strong> Region, Italy is further committed in increasing neighbourhood<br />
cooperation to improve regional energy infrastructures, such us the electrical<br />
interconnections North-South, that are crucial means to improve security in the electrical<br />
system.<br />
As for awareness raising in the field of clean energy, the Italian Ministry for the Environment<br />
Land and Sea is associated to the European Commission for the implementation of the<br />
Sustainable Energy Europe (SEE) Campaign in Italy. The aim is to raise public awareness<br />
and promote sustainable energy production and use among individuals and organisations,<br />
private companies and public authorities, professional and energy agencies, industry<br />
associations and NGOs across Europe.
II. RESUME<br />
ITALY - Résumé<br />
Les priorités énergétiques en Italie sont strictement liées aux problèmes principaux qui sont<br />
de sécuriser la distribution d'énergie, de réduire les gaz à effet de serre (GES) et les<br />
émissions polluantes et d'assurer la compétitivité du secteur de l'énergie. A cette fin, les<br />
énergies renouvelables et l'efficacité énergétique représentent les outils-clé capables de faire<br />
face en même temps à tous les sujets mentionnés ci-dessus.<br />
Dans ce domaine, les objectifs principaux sont les 6,5 % de réduction des GES par rapport<br />
aux niveaux de 1990 conformément au Protocole de Kyoto et l'objectif national indicatif de<br />
22% d'électricité provenant de sources d'énergie renouvelables dans la consommation<br />
d'électricité brute en 2010 sous la directive 2001/77/EC de l'UE.<br />
La fourniture d'énergie primaire augmentera dans les prochaines années, mais les politiques<br />
adoptées pour promouvoir les énergies renouvelables et l'efficacité énergétique mèneront à<br />
une décroissance constante lente de l'intensité énergétique. Dans tous les cas, l'Italie restera<br />
dépendante des sources d'énergie fossiles dans un futur proche et par conséquent,<br />
dépendante de ressources extérieures (presque 91 % de gaz naturel et 93 % du pétrole<br />
devront être importés en 2020).<br />
L'énergie renouvelable continuera d'augmenter dans le temps, surtout dans le secteur de<br />
l'électricité. En 2005, la production brute d'électricité provenant d'énergies renouvelables<br />
(presque 50 TWh) représente 16,4% de la production totale brute, 14,1% de la<br />
consommation brute domestique (352,8 TWh) et 15,1% de la demande totale en électricité<br />
(consommation nette + pertes des réseaux = 330,4 TWh)<br />
L'outil principal d'aide aux énergies renouvelables restera le mécanisme basé sur le marché<br />
du “Certificat Vert”. En parallèle, les tarifs de rachat pour le photovoltaïque et la récente<br />
législation sur l'efficacité énergétique dans le secteur de la construction contribueront à<br />
accélérer l‟augmentation de la part des énergies renouvelables dans le mix-énergétique.<br />
Un autre mécanisme basé sur le marché, les “Certificats Blancs”, est également utilisé pour<br />
aider l'efficacité énergétique et les mesures d'économie d'énergie pour réduire la<br />
consommation finale. Le but est de réaliser, d'ici la fin du quinquennat 2005 – 2009, une<br />
économie d'énergie totale de 2,9 millions de tep (tonnes équivalent pétrole).<br />
En termes de priorités politiques, le secteur de la construction est considéré comme un<br />
secteur pertinent dans lequel il est crucial d'intervenir pour réduire la consommation<br />
d'énergie et les émissions qui y sont liées. Parmi plusieurs standards, conditions et modalités<br />
pour améliorer la performance énergétique des bâtiments, la législation récente (Décret<br />
Législatif du 20 décembre 2006, N°311) prévoit aussi que dans tous les nouveaux bâtiments,<br />
ou en cas de restauration d'usines thermiques existantes, au moins 50 % de l'énergie<br />
annuelle nécessaire à la production d'eau chaude sanitaire devrait être fournie en utilisant<br />
des sources d'énergie renouvelables. Cette limite est réduite à 20 % pour les bâtiments<br />
situés dans les centres historiques.<br />
Pour les nouveaux bâtiments, ou en cas de restauration, on prévoit l'obligation d'installer du<br />
photovoltaïque pour la production électrique dont la capacité reste à définir par décret<br />
ministériel. De plus, pour les nouveaux bâtiments, ou en cas de restauration, il est obligatoire<br />
de prévoir le cadre de tous les travaux liés à la connexion au réseau de chauffage local, s'il<br />
est situé dans le voisinage.<br />
L'économie d'énergie et l'énergie renouvelable sont aussi encouragés par des mesures<br />
administratives et fiscales spécifiques, généralement introduites chaque année par la Loi de<br />
Finance, comme :<br />
déduction des impôts d'un certain % du coût total des interventions consacrées à<br />
l'augmentation de l'efficacité ou aux installations d'équipements en énergie renouvelable.<br />
Réduction d'impôt (comme la TVA) pour les équipements et les systèmes de technologie<br />
propre ;<br />
345
346<br />
ENERGY AND SUSTAINABLE DEVELOPMENT IN THE MEDITERRANEAN<br />
Réduction, rationalisation des procédures administratives et du coût.<br />
Les incitations par subvention sont aussi possibles, mais l'adoption de mécanismes basés<br />
sur le marché au niveau national les laisse disponibles surtout pour les mesures régionales<br />
et locales.<br />
Pour aider les mesures en faveur de la réduction des émissions des GES en provenance<br />
des sources d‟énergie, un Fond de Rotation de 200 M€ par an de 2007 à 2009 a été créé. Il<br />
aidera à financer un certain nombre d'actions prioritaires telles que des “usines haute<br />
performance utilisant la micro cogénération pour la production d'électricité et de chaleur” et<br />
d'autres interventions (incluant des projets pilotes) utilisant des énergies renouvelables.<br />
L'Italie est également très active dans la promotion de l'énergie renouvelable et l'efficacité<br />
énergétique au niveau international par la mise en oeuvre de projets et de programmes de<br />
coopération. Parmi les activités multilatérales, il convient de mentionner spécialement sa<br />
participation dans le domaine des énergies renouvelables : en 2002, l'Italie a lancé l'Initiative<br />
de Type II “Programme d'Energie Renouvelable en Méditerranée” (MEDREP) visant à<br />
promouvoir les énergies renouvelables dans la région méditerranéenne et en 2006 le<br />
partenariat international sur la Bioénergie (GBEP) qui vise à promouvoir une utilisation<br />
durable de la biomasse et des biocarburants.<br />
De plus, l'Italie met en oeuvre une importante coopération bilatérale sur l'énergie durable<br />
avec la Chine, les pays des Balkans et les USA, surtout destinée à la recherche et au<br />
développement de technologies et d'applications énergétiques propres et innovantes.<br />
Quant à la Région Méditerranéenne, l'Italie est aussi engagée dans une coopération de<br />
voisinage croissante pour améliorer les infrastructures énergétiques régionales, telles que<br />
les interconnexions électriques Nord – Sud, qui sont cruciales pour améliorer la sécurité du<br />
système électrique.<br />
Quant à la sensibilisation aux énergies propres, le Ministère Italien de l'Environnement<br />
Terrestre et Maritime est associé à la Commission Européenne pour la mise en oeuvre de la<br />
Campagne Europe Energie Durable (EED) en Italie. Le but en est de sensibiliser l'opinion et<br />
promouvoir la production d'énergie durable et son utilisation chez les particuliers, dans les<br />
organisations, les entreprises privées et les administrations, les agences professionnelles et<br />
énergétiques, les associations industrielles et les ONG dans toute l'Europe.
III. NATIONAL STUDY REPORT<br />
Introduction<br />
ITALY - National Study Report<br />
This document was prepared in the framework of the <strong>Mediterranean</strong> Strategy for Sustainable<br />
Development (MSSD) follow-up and is intended to set a basis for discussion in the workshop<br />
“Energy and Sustainable Development in the <strong>Mediterranean</strong>”.<br />
A brief overview is given to current RUE (Rational Use of Energy) and RE (Renewable<br />
Energy) strategies and policies in Italy, with an insight to existing data and forecasted<br />
evolutions. Institutional specificities, impacts and risks, as well as financing and investment<br />
needs are highlighted. Some case studies of successful projects in the field of energy<br />
technologies are also presented.<br />
1. The country’s energy situation: indicators and basic data<br />
1.1 Share of t he Energy S ecto r and Insti tu ti onal Specificities<br />
The Italian energy policy is currently based on market liberalisation, diversification of energy<br />
sources, transfer of powers to the regional authorities, energy security, energy efficiency and<br />
environmental protection. The energy mix is characterised by a substantial reliance on oil<br />
and gas. Gas utilisation is gradually increasing with respect to oil. As for renewable energies,<br />
although hydro still represents the main source, wind, solar and biomass are registering a<br />
significant growth. The nuclear energy option was abandoned in 1987, following a national<br />
referendum. Relevant progress has been recently made in implementing electricity and gas<br />
market reforms and restructuring the energy industry. Important objectives have been<br />
accomplished by transposing into legislation the EU directives for electricity and gas market<br />
liberalisation. Large state-owned energy companies started to be privatised and new<br />
institutions established.<br />
In 2005 gross internal consumption of energy amounted to 197,78 Mtoe. The following graph<br />
shows its trend over the last years, which registered an increase comparable to that of the<br />
GDP, thus not affecting energy intensity values (187 toe / M€ in 2004), confirming the<br />
substantial stability of this indicator. The low energy intensity values are due to a high degree<br />
of energy efficiency, but also to the economic environment and the high electricity prices.<br />
Energy intensity values are expected to further decrease in the next decades.<br />
Figure 1 Energy Intensity and Electrical Intensity vs. GDP, Gross Domestic Consumption and Electric<br />
Power Demand (Index Numbers: 1995=100)<br />
Source: ENEA: Report Energy and Environment 2005<br />
Italy‟s energy system remains substantially dependent on imports. In fact, although oil and<br />
gas geological reserves have the potential to increase the domestic production, demand<br />
largely exceeds potential supply. Yet, with the largest refining industry in Europe (17<br />
refineries), Italy has a significant export of oil products, mainly for central and Eastern<br />
Europe.<br />
347
348<br />
ENERGY AND SUSTAINABLE DEVELOPMENT IN THE MEDITERRANEAN<br />
The Italian gas pipeline network is well developed, although new infrastructure is necessary<br />
to satisfy the current trend of growth in gas demand. The transportation network includes<br />
17.000 km of high pressure pipelines and the distribution grid is nearly 200.000 km long.<br />
Italy has three entry points for gas imports: the Transmed pipeline, importing Algerian gas<br />
through Tunisia; the TAG pipeline, connecting to Austria and importing Russian gas through<br />
Ukraine and Slovakia); the TENP and Transitgas pipelines through Switzerland, importing<br />
Dutch gas via Germany and Norwegian gas via France.<br />
The Electricity network is made up as follows (2005 data):<br />
Table 1 Electricity network - 2005 data<br />
400 kV 216,5 km<br />
380 kV lines 10528 km<br />
220 kV lines 11387 km<br />
200 kV 859,8 km<br />
120/150 kV lines 45213 km<br />
The high voltage line is unevenly distributed over the Territory, with a density of 93 m/km2 in<br />
Northern Italy, 65 m/km2 in Central Italy and 54 m/km2 in Southern Italy. There are 18<br />
interconnection lines with border countries.<br />
The total net power installed in 2005 was 85470.3 MW, with the following shares: Hydro<br />
20.992,8 Thermal 62.164,7 Geothermal 670,8 Wind and PV 1.642,1<br />
1.2 Energy S u pply, Dema n d and Produc ti o n: evo luti on and<br />
s tr uc tu re<br />
The Italian energy mix mainly relies on oil and gas imports. Oil utilization is gradually<br />
decreasing, while gas and renewable energies are registering a trend of growth.<br />
Table 2 The shares in energy production in 2005<br />
Oil 43,1%<br />
Gas 36%<br />
Solid fuels 8.6%<br />
Renewables 6.8%<br />
Electricity (imports) 5.5%<br />
Source: Energy Balance published by the Italian Ministry<br />
for Economic Development<br />
Oil consumption has registered a continuous trend of decrease over the last few years.<br />
Natural gas demand displays a trend of growth also driven by the replacement of old oil-<br />
burning thermoelectric plants with new turbogas plants. Electrical energy demand in 2005<br />
amounted to 330.443 GWh. The trend of the last years showed a rate of growth higher than<br />
the GDP trend.<br />
Final energy uses (146.0 Mtoe in 2005) registered an increase in line with the GDP increase<br />
but with different trends in the different sectors. The transport sector, in particular, showed a<br />
relevant trend of increase.<br />
Table 3 Energy Consumption by sector<br />
Industry 28%<br />
Transport 30%<br />
Residential/Services 32.1%<br />
Others 9,9%<br />
The following tables show the energy shares in export and import per type of energy.
ITALY - National Study Report<br />
Figure 2 Oil trends from 1970 to 2005<br />
Figure 3 Gas trends from 1970 to 2005<br />
Figure 4 Solid fuels trends from 1970 to 2005<br />
349
350<br />
ENERGY AND SUSTAINABLE DEVELOPMENT IN THE MEDITERRANEAN<br />
Table 4 Electricity Consumption by sector in 2004 – 2005<br />
2004 M 2005 M<br />
Activity KWh KWh Var %<br />
Agriculture 5.184,8 5.364,4 3,5<br />
Industry 153.155,3 153.726,8 0,4<br />
Manufacturing (basic) (iron and non-iron metals, chemicals, construction<br />
materials, paper)<br />
71.525,7 71.726,8 0,3<br />
Manufacturing (non-basic) (food, tessile, mechanical, transportation,<br />
plastic materials, wood, others)<br />
64.899,1 65.003,4 0,2<br />
Constructions 1.608,0 1.708,8 6,3<br />
Energy and Water (Combustible Extraction, Refineries, Cokeries,<br />
Electricity & Gas, Aqueducts)<br />
15.122,5 15.287,8 1,1<br />
Tertiary 79.557,4 83.793,0 5,3<br />
Commercial services (Transport, Communications, Commercial, Hotels-<br />
Restaurants-Bars), Credit and Insurance, others)<br />
61.613,3 65.562,3 6,4<br />
Non commercial services (Public administration, public lighting, others) 17.944,1 18.230,7 1,6<br />
DOMESTIC 66.592,2 66.932,5 0,5<br />
TOTAL 304.489,7 309.816,8<br />
1.3 Impa cts and risks of th e observed and f ore cast evo l u t ions<br />
Despite the gradual shift of the Italian energy mix from oil, the national energy balance still<br />
heavily relies on import of fossil sources. This external dependency raises concerns of<br />
security of supply and high-energy costs. Diversification of supply is a challenging issue, as<br />
the options for fuel mix diversification are limited. Apart from the abandoned nuclear option,<br />
renewable energies are surely envisaged, while clean coal technologies may foster the coal<br />
option. New energy options, such as hydrogen, should be quickly moved from R&D and pilot<br />
applications to market.<br />
On the basis of the future population trends (calculated according to ISTAT models) and<br />
other factors (number of households, diffusion of electronic devices, etc.) and according to<br />
the evolution trend scenarios calculated by ENEA, energy demand will significantly increase<br />
in the field of electric uses, especially during next decade. Demand for heating will be<br />
increasing more modestly, because of higher efficiency technologies. Considering the<br />
medium to long term, the services and the transport sectors appear to be the most dynamic,<br />
while a modest reduction of the industry share is expected, due to the limited growth of the<br />
activities and the already high level of energy efficiency. Energy services demand is<br />
expected to basically follow the rate of growth of the economy (1,5%). As regards the<br />
transportation sector, the rate of growth of mobility demand is forecast to be 1% for<br />
passengers and 2.5% for freight. Taking into account these figures, the overall energy<br />
consumption is expected to grow constantly, following the trend of last decade. The forecast<br />
of Total Primary Energy Supply is expected to be 212 Mtoe in 2010 and 243 Mtoe in 2020.<br />
The expected annual rate of growth of GDP, TPES and Energy Intensity, according to the<br />
trend scenario, are summarised as follows.<br />
Table 5 The expected annual rate of growth of GDP, TPES and Energy Intensity, according to<br />
the trend scenario<br />
2005 - 2020<br />
GDP 1.65%<br />
TPES 1,38%<br />
Energy intensity -1%<br />
Source: Data from Ministry for the Economic Development<br />
Taking into account the energy sources, oil and gas will undertake different trends (the<br />
former of decrease, the latter of increase), with a common tendency to stabilise towards<br />
values comprised between 35% and 40% of Total primary energy consumption. As for oil, it<br />
will register a growth in the transportation sector that counterbalances the trend of decrease<br />
in thermoelectric uses, while a relevant reduction has already taken place in the industry and<br />
civil sector.<br />
As to coal consumption, after the growth of last years it is expected to stabilise in the short<br />
term, while the share could rise again in the medium to long term, due to new energy
ITALY - National Study Report<br />
generation technologies (in particular, gasification). A constant growth is foreseen for<br />
renewable energies.<br />
In addition to concerns about energy security and high energy costs, Italy is very vulnerable<br />
to climate change effects, in particular in the sectors of agriculture, forestry, water supply,<br />
tourism, human health and the service industries, particularly the insurance sector. The<br />
coastal and alpine regions are the most vulnerable. An increase in sea level could worsen<br />
damage to infrastructure, property and the tertiary sector in the coastal and lowland regions.<br />
In northern Italy soil degradation could take the form of increased erosion due to an increase<br />
in rainfall intensity and flooding, while in the south climate change could cause more severe<br />
drought, salinization, and nutrient loss.<br />
Human health is expected to be adversely affected, causing an average increase of 27<br />
deaths per annum across Italy if summer mean temperatures rise by 1ºC.<br />
The current situation of greenhouse gas emissions by sector is summarised in the following<br />
table. Calculations for energy consumption, whose values are strictly connected with<br />
emissions from the energy sector, were made on the basis of the following assumptions:<br />
GDP growth of 1.4% per year on average;<br />
Oil prices towards 35 US 2005 dollars in 2025;<br />
Reduction of GDP energy intensity by 0.3% per year;<br />
Growth of electricity intensity of GDP by 0.6% per year.<br />
Figure 5 Greenhouse gas emissions from energy activities: evolution and trends (1990 – 2020)<br />
Source: Italian report on demonstrable progress under the Kyoto Protocol<br />
1.4 Financ ing and inve s t ment needs<br />
The Italian power generation and industry sector is pretty unique compared to those of most<br />
industrialised countries. This is due to the following characteristics:<br />
Electricity demand is growing very strongly despite a weak level of economic activity; this<br />
is due to the increase in electricity consumption in the residential and industrial sector<br />
from the current relatively low levels<br />
Italy has a high dependency on natural gas and fuel oil; these two fuels have the<br />
disadvantage of having prices linked to those of crude oil, which increased dramatically in<br />
the last three years<br />
Italy has a very high dependency on electricity imports with respect to other industrialised<br />
countries, with a share of 14% of gross electricity consumption coming from abroad<br />
Italy has a low level of consumption of coal and the complete absence of nuclear<br />
The Italian manufacturing industry has already reached high energy efficiency levels,<br />
thanks to a continuous technology innovation which has taken place in the last 20-30<br />
years, mainly driven by high energy costs.<br />
351
352<br />
ENERGY AND SUSTAINABLE DEVELOPMENT IN THE MEDITERRANEAN<br />
Taking into account these considerations, securing energy supply and the fulfilment of the<br />
emission reduction objectives are ambitious goals, for which a timely investment is<br />
necessary in several sectors.<br />
A significant amount of financial resources has been already planned to put in place several<br />
measures and the implementation of some European directives (such as the EU directive on<br />
biofuels) will also contribute to drive resources towards a more sustainable energy scenario.<br />
In particular, a number of regulatory measures, market-oriented actions and fiscal incentives<br />
will be necessary to put in place some of the government priorities, i.e. improving the<br />
efficiency of the Italian economy, promoting the efficiency in the electricity sector, reducing<br />
energy consumption and promoting technology innovation in the transport sector, increasing<br />
the share of Renewables in the energy portfolio, reducing energy consumption in the<br />
residential, commercial and industrial sectors and promoting energy sources differentiation<br />
and energy security.<br />
At the same time, the modernisation of the country, especially in the South of Italy, requires<br />
the expansion of infrastructures, among which those of transport. New infrastructure is<br />
expected to enable a reduction of CO2 emissions and an increase in energy sustainability.<br />
A growth of the renewable energy option is also envisioned, even if markets will have to<br />
expand and technologies to improve in order to reach a competitive cost. Expanding markets<br />
in the <strong>Mediterranean</strong> Region is a priority for the Italian government that is providing financial<br />
support through a range of different bilateral and multilateral programmes. Among<br />
multilateral activities, a special mention has to be made on the active involvement in the field<br />
of renewable energies: in 2002 Italy launched the <strong>Mediterranean</strong> Renewable Energy<br />
Programme (MEDREP) with the aim to promote renewable energies in the <strong>Mediterranean</strong><br />
region.<br />
MEDREP‟s mission follows the recommendation of the G8 Renewable Energy Task Force<br />
that countries should develop and demonstrate renewable energy projects where renewable<br />
energy is a least cost option on a life cycle basis, and/or renewable energy can protect the<br />
local and/or global environment at a reasonable cost.<br />
Within these objectives, the programme aims to develop a sustainable renewable energy<br />
market system in the greater <strong>Mediterranean</strong> Region by establishing financial instruments and<br />
mechanisms to support renewable energy projects, strengthening policy frameworks and<br />
building stronger private sector infrastructure.<br />
In 2006 Italy also launched the international partnership on Bioenergy (GBEP) with the aim to<br />
promote the use of Bioenergy technologies. Italy is chairing the GBEP and has also financed<br />
its Secretariat in FAO in Rome. Italy also supports the Methane to Markets Partnership to<br />
develop strategies and markets for methane recovery (Landfill methane, coal mine methane,<br />
oil and gas systems and agriculture) via research and development, project activities, policy<br />
frameworks etc. and the International Partnership for Hydrogen Economy (IPHE) to<br />
accelerate the transition to a hydrogen economy. In addition Italy participates in several<br />
multilateral programmes launched by IEA, makes contribution to the core budget of the<br />
UNFCCC annually, and as of 2005 also makes a contribution to the Kyoto Protocol fund. Italy<br />
also makes a variety of voluntary payments to the Trust Fund for Developing Country<br />
Participation and the Trust Fund for Supplementary Activities. Furthermore, Italy is carrying<br />
out a relevant bilateral cooperation on sustainable energy with China, Balkan countries and<br />
USA, mainly devoted to research and development on clean and innovative energy<br />
technologies and applications.<br />
A rotation fund (Kyoto Rotation Fund) was established by the 2007 financial Law (commas<br />
1110 to 1115), allocating 200 million Euros per year from 2007 to 2009. This fund supports a<br />
number of priority actions such as "high performance distributed micro-cogeneration plants<br />
for electricity and heat generation" and other interventions (including pilot projects) utilizing<br />
renewable energies.
ITALY - National Study Report<br />
As for the Kyoto flexibility mechanisms, Italy so far has contributed to the Italian Carbon Fund<br />
with 108 million USD, to the Community Development Carbon Fund with 7 millions USD and<br />
to the BioCarbonFund with 2.5 million USD<br />
Several Capacity Building activities have also been financed, in particular in the<br />
<strong>Mediterranean</strong> Region, Eastern European Countries and China.<br />
The Italian government has also been active in promoting education and training<br />
programmes regarding energy efficiency and rational use of energy, both nationally and<br />
internationally, as well as research programmes on climate change and energy sustainability.<br />
As for the <strong>Mediterranean</strong> Region, Italy is further committed in increasing neighbourhood<br />
cooperation to improve regional energy infrastructures, such as the electrical<br />
interconnections North-South, that are crucial means to improve security in the electrical<br />
system.<br />
As for the awareness-raising in the field of sustainable energy, several activities and<br />
programmes, such as the “National System on Environmental Information, Training and<br />
Education (INFEA)” have been implemented at national and local level.<br />
Among the most recent initiatives in this field, the Italian Ministry for the Environment Land<br />
and Sea is associated to the European Commission for the implementation of the<br />
Sustainable Energy Europe (SEE) Campaign in Italy. The aim is to raise public awareness<br />
and promote sustainable energy production and use among individuals and organisations,<br />
private companies and public authorities, professional and energy agencies, industry<br />
associations and NGOs across Europe.<br />
2. Rational energy use and renewable energies: policies, tools, progress,<br />
resulting effects, case studies<br />
2.1 RUE and RE policies<br />
Socio-economic development is associated directly or indirectly with the energy use, but the<br />
energy availability, considering the non-renewable sources, is limited. Furthermore, energy<br />
related activities have a great impact on the environment. Such a situation requires more<br />
responsibility in the treatment of energy questions, through the implementation of appropriate<br />
policies.<br />
In Italy, the political institutions began to legislate on renewable energy sources after the<br />
energy crises of 1973 and 1978 with the efficiency and renewable energy sources Law<br />
308/82. Since the Kyoto Protocol was ratified, in June 2002, the government has been<br />
adopting various policies and measures, such as energy efficiency obligations for electricity<br />
and gas distributors and a portfolio obligation of renewable energy in the electricity sector.<br />
2.1.1 Rational energy use (RUE) policies<br />
In order to comply with the commitment taken at the EU level and in order to stimulate the<br />
use of energetically efficient technologies, Italy presented on 24 April 2001 two ministerial<br />
decrees (then replaced on 20 July 2004 - see par. 2.2.1 Tools and measures in favour of<br />
rational energy use), that introduced the obligation to electricity and gas distributors, with<br />
more than 100.000 clients, to achieve annual fixed objectives of energy savings for the fiveyear<br />
period 2005/09 through technological interventions to reduce end use energy<br />
consumption.<br />
Such objectives may be fulfilled either directly by distributors or by means of controlled<br />
societies; alternatively, distributors can buy “Energy Efficiency Certificates” emitted by the<br />
Italian Manager of the Electric Market (GME) to the Energy Service Companies (ESCO). The<br />
aim of the two decrees is to achieve by the end of the five-year period a total energy saving<br />
of 2.9 million tep, representing the annual increase in energy consumption registered in the<br />
period 1999-2001.<br />
The different typologies of intervention for the industrial and civil sectors are annexed to the<br />
decrees. The listed interventions relating to renewable energies are the following:<br />
353
354<br />
ENERGY AND SUSTAINABLE DEVELOPMENT IN THE MEDITERRANEAN<br />
photovoltaic, solar thermal, biomass boilers, cogeneration plants and geothermal energy<br />
plants.<br />
Building sector<br />
The reference law for energy efficiency in the building sector is the legislative decree n. 192<br />
of 19 August 2005 that complies with the EU directive 2002/91/EC. This decree introduced<br />
standards, conditions and modalities to improve the energy performance of buildings, thus<br />
contributing to achieve the emission reduction national objectives fixed by the Kyoto<br />
Protocol.<br />
This Law has been reviewed and improved recently through the introduction of the<br />
Legislative Decree 29th December 2006, n.311, that introduced new rules that will stimulate<br />
the diffusion of energetic plants powered by renewables in the building sector. Among other<br />
several measures and prescriptions, it is foreseen that in all new buildings, or in case of<br />
restoration of existing thermal plants at least 50% of the annual primary energy necessary to<br />
produce hot sanitary water should be provided using renewable energy sources. This limit is<br />
reduced to 20% for buildings located in historical centres. For new buildings, or in case of<br />
restoration, it is foreseen the obligation to install photovoltaic for electricity production with a<br />
power capacity to be defined in a ministerial decree.<br />
Furthermore, for new buildings, or in case of restoration, it is obligatory to foresee the setting<br />
of all necessary works related to the connection to the district heating-network, if this is<br />
located nearby, as well as to install a photovoltaic plant for electricity production with a power<br />
capacity to be defined in a ministerial decree.<br />
2.1.2 Renewable energy (RE) development policies<br />
The first National Energy <strong>Plan</strong> was elaborated in 1981, setting actions and targets for the<br />
development of renewable energy sources all over the territory. Law 308/82 was the first to<br />
address the issues of energy efficiency and renewable energies and established the basis for<br />
future public regulations and financial incentives.<br />
Renewable energy technologies started to reach a good level of maturity, new components<br />
and systems were set up and concrete applications began to be demonstrated and<br />
implemented.<br />
A new National Energy <strong>Plan</strong> was elaborated in 1988 with five objectives for the year 2000:<br />
1) Implementation of policies of energy saving and rational use of energy;<br />
2) Protection of the environment and human health;<br />
3) Development of national energy sources;<br />
4) Utilization of mixed energy sources and different geopolitical supplies;<br />
5) Improvement of competitiveness of the production system.<br />
Afterwards, all legislation regarding rational use of energy, energy savings, renewable<br />
energy sources and assimilated sources has been based on the principle of such objectives.<br />
For example, Law 9/91 liberalized electricity production from renewable energy sources and<br />
simplified the authorization procedures, while Law 10/91 required Regions to draw up energy<br />
plans, highlighting that the use of renewable energy sources was in the public interest and<br />
the implementation of related measures was a priority.<br />
The following measure CIP 6/92 (Interministerial Price Committee) of 29 April 1992<br />
encouraged electricity generation from renewables by setting incentivated prices for its sale<br />
for a period of 8 years.<br />
Following the publication of the European Commission‟s White Paper on renewables, Italy<br />
adopted a White Paper on the exploitation of energy from renewable sources, then approved<br />
by CIPE (Interministerial Committee for Economic <strong>Plan</strong>ning) in its Decision No 126 of 6<br />
August 1999. This document gave the state of the art of RE technologies and indicated<br />
policies, strategies and production targets up to 2008-2012 for each type of source (see the<br />
table below). In particular, the White Paper pointed out a more important role of the Regions
ITALY - National Study Report<br />
in supporting the national policies to achieve the targets by regional and local initiatives and<br />
measures.<br />
Table 6 RE technologies and indicated policies, strategies and production targets up to 2008-2012<br />
1997 2002 2006 2008/2012<br />
Source/technology MWe TWh MWe TWh MWe TWh MWe TWh<br />
Hydro > 10 MW 13942 33.47 14300 34.32 14500 34.8 15000 36<br />
Hydro = 10 MW 2187 8.12 2.400 8.88 2600 9.62 3000 11.1<br />
Geothermal 559 3.90 650 4.78 700 5.14 800 5.9<br />
Wind 119 0.12 700 1.4 1400 2.8 2500 5<br />
Solar 16 0.01 25 0.03 100 0.11 300 0.3<br />
Biomass and biogas 192 0.57 380 2.28 800 4.80 2300 13.8<br />
Waste 89 0.25 350 1.75 500 2.50 800 4.0<br />
Total 17104 46.44 18805 53.44 20600 59.77 24.700 76.1<br />
Currently, support for renewable energy is based on:<br />
Market-based mechanism of “green certificates” for electricity production;<br />
National and regional financial contribution;<br />
RECS and certifications;<br />
National and EC funds for R&D;<br />
Fiscal incentives.<br />
Direct incentives in capital law are today mainly competence of regional and local authorities,<br />
while central government is consolidating market-based mechanisms, fiscal incentives and<br />
laws prescriptions (such as in the building sector).<br />
2.1.3 Electricity production from renewable energy sources<br />
One of the most important legislative decrees introducing new incentives for electricity<br />
produced from renewable energy sources was decree 79 of 16 March 1999, concerning the<br />
restructuring of the electricity sector in compliance with Directive 96/92/EC. In particular, it<br />
introduced:<br />
In article 11, the scheme to incentive the electricity production from renewable energy<br />
sources, called “green certificates mechanism”;<br />
The priority in dispatching electricity from renewable energy sources;<br />
Transitory norms for the CIP6/92 power plants, both those already connected to the grid<br />
and those that will be connected in the next future;<br />
Specific incentives to the electricity from renewable energy sources. Regions will manage<br />
the funds according to a mechanism based on call for tender system.<br />
Another important piece of legislation supporting renewables for electricity production is<br />
legislative decree n. 387 of 29 December 2003, implementing the European directive<br />
2001/77/EC on the promotion of electricity produced from renewable energy sources in the<br />
internal electricity market. This decree introduced additional measures improving incentives<br />
and supporting Renewables.<br />
For instance, article 4 set the annual increase of 0.35% for the minimum obligation quota of<br />
electricity produced from renewables to be fed into the national grid, in the period 2004 to<br />
2006 (see paragraph 2.2.2 for the explanation of the mechanism). A provision was also<br />
introduced whereby the Minister for Production Activities (currently Minister for Economical<br />
Development), in concert with the Minister for the Environment and Territory (currently<br />
Minister for environment, Land and Sea), having consulted the Unified Conference, was to<br />
issue decrees establishing further increases of the minimum quota for the three-year period<br />
2007-2009 and the three-year period 2010 - 2012.<br />
With regard to specific sources, article 7 of Legislative Decree 387/03 stipulated that further<br />
decrees would lay down the incentive criteria to support electricity production from solar<br />
sources.<br />
355
356<br />
ENERGY AND SUSTAINABLE DEVELOPMENT IN THE MEDITERRANEAN<br />
Furthermore, in order to simplify the authorisation procedures, article 12 of Legislative<br />
Decree 387/03, established that construction and operation of plants producing energy from<br />
renewable sources are subject to a single authorisation, issued by the Region (or another<br />
official body empowered by the Region) following a single procedure (lasting no more than<br />
180 days).<br />
In addition, with reference to EC directive 2001/77/EC, requiring Member States to ensure<br />
that the origin of electricity produced from renewable energy sources can be guaranteed as<br />
such, article 11 of Legislative Decree 387/03 established that producers can require the<br />
“Guarantee of Origin” for the electricity produced by qualified plants using renewable<br />
sources. The Manager of Electrical System (Gestore del Sistema Elettrico – GSE) is the<br />
entity designated to issue the Guarantee of Origin, as well as green certificates. The<br />
Guarantee of Origin is issued when the annual production, or attributable production, is not<br />
less than 100 MWh, rounded off in accordance with commercial practice.<br />
2.2 Ins tr ume n ts a nd measures to be taken in fa vo u r of R UE<br />
a ndRE<br />
2.2.1 Tools and measures in favour of rational energy use (RUE)<br />
White Certificates Mechanism to support Energy Efficiency Measures<br />
This market-based mechanism has been introduced by the two Law Decrees “20th July<br />
2004” and represents the main tool to promote energy efficiency measures in Italy. Each<br />
white certificate (WC) testifies the saving of 1 ton of oil equivalent (toe) achieved through the<br />
implementation of specific projects. WCs are emitted by the Italian Manager of the Electric<br />
Market (GME) on the basis of the energy savings certified by the Italian Authority of Gas and<br />
Electricity (AEEG). The functioning of this mechanism is based on the obligation to electricity<br />
and gas distributors with more than 100.000 clients, to achieve annual fixed objectives of<br />
energy saving for the five-year period 2005/09. Further decrees will define the modalities for<br />
the application of the provisions of these Decrees to distributors with less than 100‟000<br />
clients. The annual energy saving objectives increase year by year and can be achieved<br />
through the implementation of specific projects (e.g. installation of high efficient boilers,<br />
thermal insulation interventions, etc.) with end-users that will benefit directly from the<br />
consequent reduced energy expenditures. When a distributor does not satisfy its annual<br />
obligation through the implementation of projects, it can buy white certificates generated by<br />
interventions implemented by other operators.<br />
The aim of the Law Decrees is to achieve by the end of the five-year period a total energy<br />
saving of 2.9 million toe, representing the energy consumption annual increase registered in<br />
the period 1999-2001.<br />
Table 7 Energy saving fixed targets for gas and electricity (Law Decrees 20th July 2004)<br />
Results achieved in 2005<br />
Electricity Gas<br />
Year target Year target<br />
(Mtoe) (Mtoe)<br />
2005 0,1 2005 0,1<br />
2006 0,2 2006 0,2<br />
2007 0,4<br />
2008 0,8<br />
2007 0,4<br />
2008 0,7<br />
2009 1,6 2009 1,3<br />
2005 was the first year of application of the White Certificates mechanism. The 2005 energy<br />
saving objective was 152,000 toe, while the certified achieved result was about 287,000 toe<br />
(the objective is referred only to distributors with more than 100,000 clients). This result is the<br />
consequence of projects started in 2001. Almost 75% of these projects have been devoted to<br />
reduce electrical consumption; 22% reduced natural gas consumption; 3% reduced energy<br />
consumption from other sources.
ITALY - National Study Report<br />
The total energy saved in 2005 is equivalent to the overall domestic consumption of an<br />
Italian city with 380,000 inhabitants or to the annual electrical production of a 160 MW power<br />
plant. The total CO2 eq avoided emissions were more that 750,000 tons. During 2005,<br />
13,898 white certificates were traded, representing almost 9% of the overall 2005 objective.<br />
Fiscal and Administrative Measures to Support Energy Saving<br />
Energy saving is also boosted through specific fiscal and administrative measures, generally<br />
introduced each year with the Financial Law, such as:<br />
Deduction from taxes of a certain % of total cost of the interventions<br />
Reduced taxation (such as VAT) for clean technology equipments and systems<br />
Reduction/rationalization of administrative procedures and costs.<br />
2.2.2 Tools and measures in favour of renewable energy (RE)<br />
Green Certificates Mechanism<br />
The most important mechanism incentivating electricity produced from renewable sources<br />
was introduced by Legislative Decree 79 of 16 March 1999 and completed by the<br />
subsequent Ministerial decrees of 11 November 1999 and 18 March 2002. The new<br />
approach to support renewable sources consists in an obligation, starting in 2002, for<br />
producers and importers of electricity produced from non-renewable sources to supply the<br />
electricity grid with a minimum quota of electricity produced by plants which use renewable<br />
sources and which started operating after 1 April 1999. The quota, initially set at 2%, is<br />
calculated on the basis of electricity production and imports of the previous year, exceeding<br />
100 GWh, net of co-generation output and internal power plant consumption and exports.<br />
The decrees of 11 November 1999 and 18 March 2002 defined as eligible to contribute<br />
towards achieving the quota those plants using renewable sources and which began<br />
operating after 1 April 1999 following new construction, upgrading, total or partial<br />
reconstruction or re-activation; it is also eligible new energy production from renewable<br />
sources - also in existing plants - obtained by means of co-combustion, i.e. simultaneous<br />
combustion of non-renewable fuels and solid, liquid or gas fuels obtained from renewable<br />
sources.<br />
Green certificates can be traded on a parallel market independent of the electricity market. In<br />
the green certificates market, demand is generated by the quota obligation to electricity<br />
producers and importers; offer is generated by the electricity produced from renewable<br />
energy plants (operating after 1 April 1999). GSE is the authority corroborating that the plant<br />
is powered by renewable sources, thus issuing the qualification certificate IAFR. The entity<br />
subjected to the quota obligation can generate green certificates from its own renewable<br />
plants or can buy green certificates generated by other renewable electricity producers. The<br />
exchange of green certificates can be made either bilaterally among operators or using a<br />
platform facility organized by the Manager of the Electric Market (Gestore del Mercato<br />
Elettrico – GME)<br />
For entities not fulfilling the obligation, the Ministerial Decree of 11 November 1999<br />
introduced penalties which consist in restricting their access to the electricity market as a<br />
whole.<br />
Feed-in tariff scheme for photovoltaic<br />
Following the decree 387/2003, that prescribed the establishment of incentives for electricity<br />
production from solar sources, the ministerial decree approved on July 28th 2005<br />
(modified/integrated on February 6th 2006) introduced in Italy the feed-in tariff to support<br />
photovoltaic.<br />
The Decree 19 February 2007 introduced a new version of the feed-in tariff. The new<br />
scheme is applied to PV plants connected to the grid with a nominal capacity higher than 1<br />
kWp realised by individuals, registered companies, condominia and public bodies.<br />
The decree foresees a set of tariffs, valid for a period of 20 years, according to the following table:<br />
357
358<br />
ENERGY AND SUSTAINABLE DEVELOPMENT IN THE MEDITERRANEAN<br />
Table 8 Set of tariffs established by the decree, valid for a period of 20 years<br />
<strong>Plan</strong>t nominal capacity<br />
(kWp)<br />
1 2 3<br />
Not integrated Partially integrated Full integrated<br />
A 1 < P < 3 0,4 0,44 0,49<br />
B 3 < P < 20 0,38 0,42 0,46<br />
C P > 20 0,36 0,40 0,44<br />
A tariff increase of 5% is foreseen:<br />
for B and C for energy self-producers, as defined by the Law Decree 79/1999<br />
for public schools and public health centres<br />
for installations integrated to building substituting asbestos roofs<br />
if the owner is a municipality with less than 5000 inhabitants.<br />
Furthermore, other increases of the tariff can be obtained, as premium, in case energy<br />
efficiency interventions that decrease the energy performance index of the building are<br />
implemented.<br />
<strong>Plan</strong>ts with a capacity lower than 20 kWp can further benefit of net metering, meaning that<br />
customer will not pay the electricity bill if the electricity fed to the grid balances the electricity<br />
taken from the grid. Otherwise to the net metering, the electricity not consumed by the user is<br />
sold to the grid to a fixed price.<br />
This mechanism is valid till the achievement of 1200 MW installed. The national indicative<br />
objective of PV installed capacity is 3000 MW to 2016.<br />
2.3 Energy E f fi ciency E vo l u ti on - decoupling 1<br />
The trend of various parameters is shown in the following graphs:<br />
Figure 6 Electrical and energy intensity of the GDP<br />
1 Energy data reported in this paragraphs come form the source “Scenari Energetici tendenziali 2020” of the Ministry<br />
for Economic Development
ITALY - National Study Report<br />
Figure 7 Energy intensity of the industrial sector<br />
The industrial sector absorbs around 30 % of the total primary energy consumption. The<br />
energy intensity of the industrial sector started to decrease with a constant rate mainly<br />
thanks to the energy efficiency policies started in the second half of ‟70. From ‟70 up to date,<br />
energy intensity has decreased by 45%.<br />
It can be observed the following:<br />
Natural gas is quickly replacing oil fuels and is moving to saturation<br />
Solid fuels are decreasing<br />
Electricity shows a modest increasing trend from the second half of „80s<br />
Renewable energies started to play a role since the second half of „90s<br />
An energy efficiency programme for the industrial sector should take into account that the<br />
Italian productivity sector is constituted mainly by small and medium enterprises generally<br />
grouped in industrial districts. In this context, efforts to increase energy efficiency should be<br />
made in the following fields:<br />
Technologies for the self-production of energy<br />
Energy valorisation of industrial wastes<br />
Re-organisation of the production process in order to make it more efficient<br />
Ad-hoc incentives for energy efficiency.<br />
The civil sector, composed by the Tertiary and Residential sectors, absorbs around 30 % of<br />
the total primary energy consumption.<br />
359
360<br />
ENERGY AND SUSTAINABLE DEVELOPMENT IN THE MEDITERRANEAN<br />
Figure 8 Energy intensity of the tertiary sector<br />
Italian energy intensity in the tertiary sector is still the lowest in the EU, but the trend shows<br />
an increase due to the diffusion of cooling systems and the consequent increase of electricity<br />
intensity. It can be observed the following:<br />
Oil fuels for heating are being gradually replaced by natural gas<br />
Oil products are decreasing towards the saturation values corresponding to their utilization<br />
in areas far from gas and electricity facilities<br />
Electricity intensity is increasing because of cooling systems diffusion<br />
The utilization of renewables is slowly increasing<br />
Figure 9 Energy intensity of the residential sector
ITALY - National Study Report<br />
As for the residential sector, the electricity intensity and the other typical indicators, such as<br />
the unitary electricity consumption per house, generally increase with the increasing of the<br />
“per capita average income”. This can be generally observed in the European Union. In this<br />
context, Italy shows an almost constant value in time for the electricity intensity, as well as<br />
one of the lowest values - among all member states - for the unitary electricity consumption<br />
per house. This is due mainly to the high electricity tariffs for families that acted as a demand<br />
side management policy.<br />
Anyway, the diffusion of electrical appliances for climatisation - mainly for air conditioning -<br />
made the electricity intensity trend increasing in the very last years, but with a rate<br />
substantially lower than the tertiary sector. The progressive increase of electricity<br />
consumption in the residential sector represents an inversion of trend in Italy, where<br />
electricity represents only 30% of the total energy final uses in houses. The decreasing of<br />
energy intensity in the residential and tertiary sectors should be made in the following fields:<br />
Improvement of the efficiency of existing buildings, usually old and not renovated, with<br />
particular focus on the Public estate.<br />
Improvement of the national electricity generation system through the diffusion of the<br />
micro-poly-generation distributed systems.<br />
Inversion of the trend of increase of electricity consumption due to the diffusion of air<br />
conditioning systems.<br />
Increase of the “energy quality” of appliances and other domestic products by improving<br />
standards and technologies.<br />
In the residential sector a great contribution to increase energy efficiency was given by the<br />
introduction of the Legislative Decree n.311 of 29 December 2006 that introduced the<br />
following measures:<br />
Obligation of Renewable Energy systems for at least 50% of hot water demand.<br />
Obligation of photovoltaic plants for new buildings.<br />
Introduction of the “Energy Certificate” for buildings.<br />
Simplified procedures for the substitution of old boilers with more efficient ones.<br />
Obligation to introduce “sun protection systems” for new and restored buildings.<br />
-Obligation for all new buildings to carry out all necessary works related to the connection<br />
to the district heating-network, if this is located nearby.<br />
Introduction of sustainable energy criteria in urban planning.<br />
The transport sector absorbs around 30 % of the total primary energy consumption.<br />
Figure 10 Energy intensity of the transport sector<br />
361
362<br />
ENERGY AND SUSTAINABLE DEVELOPMENT IN THE MEDITERRANEAN<br />
The rationalization of energy consumption in this sector is one of the main challenges in Italy,<br />
being the transport sector dependent from imported oil products and among the main<br />
responsible of CO2 emissions.<br />
After the increasing trend of energy intensity due to the motorization of the country, until the<br />
early ‟90s, today the trend is constant.<br />
The efficiency of technologies and engines has been improved, but the energy consumption<br />
of the sector is increasing rapidly together with the emissions and the consequent impacts on<br />
the environment.<br />
The main actions to be taken in order to decrease energy consumption of this sector and its<br />
negative effects are the following:<br />
Policies for the management of the territory and of the “mobility demand”.<br />
Improvement of transport infrastructures aiming at improving collective transport and<br />
decreasing “road transport”.<br />
Efficiency improvement of transport technologies and engines and promotion of lowconsumption<br />
vehicles.<br />
Introduction of biofuels and low-emissions fuels (natural gas).<br />
Figure 11 Energy intensity of the Agriculture sector<br />
The energy intensity of the agricultural sector is strictly dependent from oil products because<br />
of the predominance of “engines for agriculture”.<br />
In this sector, renewables show a gradual increase essentially due to the utilization of<br />
biomass for heat production.
The Electric sector<br />
Source: Terna<br />
ITALY - National Study Report<br />
Figure 12 Electric intensity per sector<br />
Table 9 Electricity consumption data - 2005<br />
More than 83% of the gross electricity production comes from thermal-electric plants. The<br />
average efficiency of the thermal-electric generation system is continuing to increase year by<br />
year, as shown in the figure below.<br />
363
364<br />
ENERGY AND SUSTAINABLE DEVELOPMENT IN THE MEDITERRANEAN<br />
Figure 13 Average efficiency of thermal-electric generation<br />
The “trend scenario” for the Italian electrical system foresees that the average efficiency of<br />
the thermal-electric generation system will overcome 50% in 2015.<br />
Electrical losses in 2005 was 20,6 TWh, representing more than 6% of the total electricity<br />
demand (330,4 TWh). Considering that the electricity deficit in Italy is close to 50 TWh, there<br />
is the real need to minimize losses through the electricity grid. In this regard, the diffusion of<br />
the distributed generation will help achieve this goal.<br />
2.4 Renew able Ene rgy e vo l u ti on<br />
In the electric sector, the total renewable energy installed capacity in 2005 was 20.9 GW,<br />
with an increase of 4% compared with the year 2004. The corresponding electricity<br />
production has been 49.9 TWh.<br />
Although hydropower still represents the main electricity source from renewables, with 72%<br />
of the total production, the highest grow rate belongs to wind energy, increased by 49% in<br />
2005 compared to the value of 2004. This was a good signal after some delay due to<br />
territorial constraints and long administrative procedures, as well as local resistance to new<br />
infrastructure.<br />
In fact, even if the general opinion towards renewable energies is certainly positive, one of<br />
the main issues regards public perception about their impact on landscape. This issue is of<br />
particular relevance in territories with a huge artistic and landscape heritage. The impulse<br />
recently given to renewable energies, particularly wind and photovoltaic, needs therefore to<br />
be homogenized with administrative rules taking in consideration the safeguard of historical,<br />
environmental and landscape heritage. This requires coordination among all institutions<br />
involved and responsible for environmental protection and cultural safeguard.
Source – GSE<br />
ITALY - National Study Report<br />
Table 10 Renewable energy - 2005<br />
As for photovoltaic, its development still lags behind its huge potentialities, but a deep<br />
increase is expected in 2007 thanks to the entry into force of the feed-in tariff introduced in<br />
July 2005. Up to the end of 2006, 387.7 MW had been admitted to benefit from the feed-in<br />
tariff, of which 6 MW already installed and 62 MW on course of installation.<br />
Source and elaboration: GSE<br />
Figure 14 Renewable Energy gross production trend (1994-2005)<br />
365
366<br />
ENERGY AND SUSTAINABLE DEVELOPMENT IN THE MEDITERRANEAN<br />
Figure 15 Comparison between total and renewable energy electricity gross productions (1994-2005)<br />
Source and elaboration: GSE<br />
The 2005 renewable energy electricity gross production represented 16,4 % of the total<br />
gross production, 15,1 % of the total electricity demand (net consumption + network losses =<br />
330,4 TWh), and 14,1% of the gross inland consumption (352,8 TWh). This last percentage<br />
rises to 17,3% 2 if we consider the importation of electricity from renewable energy sources<br />
certified through the Guarantee of Origin.<br />
3. Energy technologies case studies and good practices<br />
3.1 CdTe/CdS Thin Fi lm Solar Cells indus trial pr oduction<br />
This is an ongoing project in Italy with the aim at developing an industrial process for a largescale<br />
low-cost production of photovoltaic CdTe thin film modules.<br />
The entry into force, in Italy, of the feed-in tariff scheme to boost photovoltaic is leading to a<br />
deep increase of PV products demand that creates a sudden shortage of such products. In<br />
the short and medium term this could lead to an increase of technology costs and to a strong<br />
reliance of foreign supply.<br />
For this reason, starting from the most recent research studies carried out in Italian<br />
Universities (University of Parma), it has been decided to implement a project on innovative<br />
PV manufacturing cycle for the industrial production of CdTe thin film able to reduce<br />
significantly the costs.<br />
Thin film modules may become cost-competitive for at least three reasons:<br />
The amount of source material is at least 100 times lower than the amount used for single<br />
crystals modules and it is a negligible part of the overall cost.<br />
The manufacturing process can be completely automated and a production yield of one<br />
module per minute can be obtained.<br />
Low cost soda lime glass can be used as a substrate.<br />
A stable efficiency of 15.8% has been demonstrated for 1 cm 2 laboratory cell and it is<br />
expected that an efficiency of 12% can be obtained for 0.6x1.2m 2 modules.<br />
A fully automated in-line process with a capacity of 15-20 MW/year could produce 1 module<br />
every 2 minutes at a cost substantially less than 1€/W.<br />
2<br />
provisional data in 2005
ITALY - National Study Report<br />
It is estimated that, if the production of a single industrial plant will be higher than 100<br />
MWp/year, a production cost of less than 0.5$/Wp is possible.<br />
This costs should be compared with the traditional ones that, in Italy, range between 3 to 4.5<br />
€/W.<br />
3.2 Sino-Italian Ecologi cal and Eco -Efficient Building at<br />
T singhua Uni ve rsity ( B e i ji ng, China)<br />
Figure 16 Sino-Italian Ecological and Eco-Efficient Building at Tsinghua University (Beijing, China)<br />
In 2000 the Italian Ministry for the Environment and Territory and the Chinese Authorities<br />
established a Sino-Italian environmental cooperation programme, including several joint<br />
projects in the environmental field. In this framework, the Sino-Italian Eco-Efficient Building<br />
(SIEEB) was conceived with a view to creating a visible and active centre of research, testing<br />
and dissemination of efficient and low-carbon technologies in the building and housing<br />
sectors. SIEEB was inaugurated in 2006 as an intelligent, ecological and energy efficient<br />
building, that will serve as a model for a new generation of buildings and a concrete example<br />
for the dissemination of sustainable practices in the building industry. At the same time<br />
SIEEB is a laboratory for the development of innovative technologies in the energy efficiency<br />
field. SIEEB covers an area of 20.000 m2, is around 40 meters high, and will host an<br />
education, training and research centre for environmental protection and energy<br />
conservation, offices and a 200 seats auditorium. Envelope components, control systems<br />
and technologies employed in the SIEEB represent the state of the art of the innovative<br />
Italian production in the building sector.<br />
Design Methodology<br />
As a sustainable, low emission building the envelope and building services have been<br />
conceived as an integrated system since the earliest steps of the design process.<br />
Starting from the shape definition, a large number of possible configurations were firstly<br />
examined, using appropriate computer tools capable to evaluate the actual amount of solar<br />
radiation incident on the facades and taking into account the shadows cast by surrounding<br />
buildings. The final shape derived from an iterative series of tests and simulations supported<br />
by an intense dialogue between energy experts and architects.<br />
Energy Analysis<br />
The shape developed in the first step was then refined and adapted to more detailed formal<br />
and functional requirements and energy simulations were carried out. Building energy<br />
analysis showed that, in order to minimise carbon emissions, the key issue was electricity<br />
consumption, mainly because of the carbon based electric production system in China.<br />
Hence, the following design strategies were derived:<br />
367
368<br />
ENERGY AND SUSTAINABLE DEVELOPMENT IN THE MEDITERRANEAN<br />
Maximise natural lighting and minimise artificial lighting.<br />
Minimise the electricity demand of heating, ventilating, and air-conditioning systems<br />
(HVAC).<br />
Meet as much as possible the electricity demand of the system by means of cleaner<br />
production systems.<br />
Maximise natural lighting and minimise artificial lighting<br />
Window dimensions were optimised taking into account natural lighting, glare, energy losses<br />
and solar gains. The effect on artificial lighting demand of the most advanced techniques and<br />
technologies for enhancing natural lighting (such as light shelves, fixed and movable<br />
reflecting lamellas, prismatic louvers and laser cut transparent devices) was also explored<br />
and evaluated making use of appropriate computer simulation tools. The final design is the<br />
result of an iterative process involving energy and architectural issues. Part of the artificial<br />
lighting demand is met by the electricity production of photovoltaic louvers.<br />
Particular attention has been given to the study of a light shelf integrated in the façade.<br />
Moreover, an automatic light flow adjustment system is used for the offices and laboratories.<br />
Photo-sensors detect presence and luminescence, thus regulating the required light flow in<br />
the rooms.<br />
Minimise electricity demand<br />
The HVAC system chosen for the SIEEB is among the most efficient, combining<br />
displacement ventilation and radiant ceilings. Displacement ventilation allows for a significant<br />
reduction of the electricity consumption due to fans and provides high air quality. Radiant<br />
ceilings provide high standard thermal comfort exploiting the longwave radiative energy<br />
exchanges between the occupants and the enclosure and allow for low electricity<br />
consumption (only for pumping hot or cold water through them).<br />
Moreover, energy demand - for heating air in winter and for cooling and dehumidifying it in<br />
summer – is reduced. A sophisticated control system adjusts the air changes and<br />
temperature in each room according to its actual occupation. Computer simulations show<br />
that the adoption of this HVAC system instead of the usual ones allows for more about 30%<br />
reduction of primary energy consumption.<br />
Electricity from cleaner production systems<br />
The SIEEB building adopts the tri-generation concept and several technological and<br />
operational options were explored by means of computer simulations, aiming at assessing<br />
the best performance of the whole system comprising building, HVAC and tri-generation<br />
units.<br />
The desiccant cooling system was excluded because of its poorer performance compared<br />
with a double stage absorption chiller. Simulations showed also a mismatch between thermal<br />
and electrical power demand: sometimes, when thermal loads are low, electricity production<br />
is not sufficient and some power should be taken from the grid. Some other times the cooling<br />
loads are so high that too much electricity would be produced. To overcome this problem,<br />
compression heat pumps were added. They are powered with the excess the electricity<br />
produced by the tri-generation system, whose instantaneous power is modulated with an<br />
appropriate control system. In this way, there is no need for electricity exchange with the<br />
grid. The tri-generation concept was adopted also for another reason: in a more or less near<br />
future the SIEEB could become a zero emission building. This is possible by using biofuels<br />
instead of natural gas to power the engines, simply adapting or substituting them. A more<br />
long term scenario includes the use of fuel cells powered by hydrogen produced from<br />
renewable energy.<br />
For air temperature control, each office and laboratory is equipped with an electronic unit<br />
connected to a centralised Building Management System (BMS). Each control unit is<br />
equipped with a two ways valve electrically operated.
ITALY - National Study Report<br />
The whole building is equipped by a BMS that controls mechanical systems and electric<br />
systems. Both local and central level controls are connected to the BMS, having the goal of<br />
guaranteeing high comfort and low energy consumptions at the same time.<br />
Structural design principles<br />
The material selected for the floors rising above the ground level is steel, a material fully<br />
recyclable and of common use in Beijing, by means of which the supporting framework made<br />
of beams and pillars for the floors and the double skin glass shell was realized.<br />
The concrete floors, after a technique frequently used in China, have been realized on-site<br />
and integrated with the system of steel beams. The side stability of the building is guaranteed<br />
by the cores of the stairwells realized with braced frameworks of steel profiles. Underground<br />
floors are entirely made of reinforced concrete, realized after a 8 x 8 m grid of pillars and with<br />
nervate bed foundations at 8 meters from the ground level.<br />
The envelope of the building has four types of glazing surfaces, according to different<br />
orientation.<br />
Photovoltaic systems<br />
Photovoltaic systems consist of 190 modules, each with nominal power of 105Wp. The<br />
modules are assembled in 2 different fields having 95 modules each, over the terraces of the<br />
eastern and western wings of the building. The total nominal peak power of the plants is<br />
19.95 KWp. The conversion of the DC power produced by the modules into AC power for the<br />
building appliances is obtained by means of 6 inverters. The parallel interconnection of the<br />
series is realized inside these inverters.<br />
4. References<br />
AEEG Guidelines n. 224/00 of 6 December 2000<br />
AEEG Guidelines n. 34/05 of 28 February 2005<br />
AEEG Guidelines n.188/05 of 14 September 2005<br />
CIPE (Interministerial Committee for Economic <strong>Plan</strong>ning) Decision No 126 of 6 August<br />
1999 White Paper on the exploitation of energy from renewable sources<br />
ENEA: Report Energy and Environment 2005<br />
GRTN: dati statistici sull‟energia elettrica in Italia (statistical data on electricity in Italy)<br />
GSE: Statistiche sulle Fonti Rinnovabili in Italia 2005 (2005 statistics on Renewable<br />
Energy Sources in Italy)<br />
IEA: Energy Policy of IEA Countries -Italian Ministry for Economic Development: Energy<br />
Balance -Italian ministry for Economic Development: “Scenari Energetici tendenziali 2020”<br />
(2020 Trend energy Scenarios)<br />
Italian Ministry for the Environment Land and Sea: Italian report on demonstrable progress<br />
under article 3.2 of the Kyoto protocol<br />
Italian Ministry for the Environment Land and Sea: SIEEB - Sino-Italian Ecological and<br />
Energy Efficient Building<br />
Law 387 of 29 December 2003<br />
Legislative Decree 16 March 1999, n.79<br />
Legislative Decree 19 August 2005, n. 192<br />
Legislative Decree 29 December 2006, n.311<br />
Ministerial Decrees 20 July 2004<br />
Ministerial Decree 28 July 2005<br />
Ministerial Decree 6 February 2006<br />
Report from Italy in accordance with Article 3(3) and Article 5(5) of Directive 2001/77/EC<br />
TERNA: National statistics 2005<br />
369
5. Table of illustrations<br />
370<br />
ENERGY AND SUSTAINABLE DEVELOPMENT IN THE MEDITERRANEAN<br />
Figure 1 Energy Intensity and Electrical Intensity vs. GDP, Gross Domestic Consumption and Electric Power Demand<br />
(Index Numbers: 1995=100) ........................................................................................................................................... 347<br />
Figure 2 Oil trends from 1970 to 2005 ...................................................................................................................................... 349<br />
Figure 3 Gas trends from 1970 to 2005..................................................................................................................................... 349<br />
Figure 4 Solid fuels trends from 1970 to 2005 .......................................................................................................................... 349<br />
Figure 5 Greenhouse gas emissions from energy activities: evolution and trends (1990 – 2020) ................................................. 351<br />
Figure 6 Electrical and energy intensity of the GDP ..................................................................................................................... 358<br />
Figure 7 Energy intensity of the industrial sector ........................................................................................................................ 359<br />
Figure 8 Energy intensity of the tertiary sector ............................................................................................................................ 360<br />
Figure 9 Energy intensity of the residential sector ....................................................................................................................... 360<br />
Figure 10 Energy intensity of the transport sector ....................................................................................................................... 361<br />
Figure 11 Energy intensity of the Agriculture sector .................................................................................................................... 362<br />
Figure 12 Electric intensity per sector ........................................................................................................................................ 363<br />
Figure 13 Average efficiency of thermal-electric generation ........................................................................................................ 364<br />
Figure 14 Renewable Energy gross production trend (1994-2005) ............................................................................................. 365<br />
Figure 15 Comparison between total and renewable energy electricity gross productions (1994-2005) ...................................... 366<br />
Figure 16 Sino-Italian Ecological and Eco-Efficient Building at Tsinghua University (Beijing, China) ............................................. 367<br />
Table 1 Electricity network - 2005 data ...................................................................................................................................... 348<br />
Table 2 The shares in energy production in 2005 ....................................................................................................................... 348<br />
Table 3 Energy Consumption by sector ....................................................................................................................................... 348<br />
Table 4 Electricity Consumption by sector in 2004 – 2005 ......................................................................................................... 350<br />
Table 5 The expected annual rate of growth of GDP, TPES and Energy Intensity, according to the trend scenario........................... 350<br />
Table 6 RE technologies and indicated policies, strategies and production targets up to 2008-2012 .......................................... 355<br />
Table 7 Energy saving fixed targets for gas and electricity (Law Decrees 20th July 2004) ............................................................. 356<br />
Table 8 Set of tariffs established by the decree, valid for a period of 20 years ............................................................................. 358<br />
Table 9 Electricity consumption data - 2005 .............................................................................................................................. 363<br />
Table 10 Renewable energy - 2005 ........................................................................................................................................... 365
LIBYA<br />
Dr Mohamed Ekhlat, Dr Ibrahim M. Salah & Eng. Nureddin M. Kreama, General<br />
Electric Company of Libya "GECOL"<br />
TABLE OF CONTENTS<br />
I. Summary ........................................................................................................................ 373<br />
1. Libya Energy Situation ............................................................................................................................. 373<br />
2. Renewable Energy summary .................................................................................................................. 373<br />
3. What is needed to promote RE are ....................................................................................................... 374<br />
4. Environment and Rational Energy ......................................................................................................... 374<br />
II. Résumé ......................................................................................................................... 377<br />
1. La situation énergétique en Libye ......................................................................................................... 377<br />
2. Résumé sur les énergies renouvelables ............................................................................................... 377<br />
3. Ce qui est nécessaire pour promouvoir les ER .................................................................................... 378<br />
4. Environnement et Énergie Rationnelle ................................................................................................. 378<br />
III. National study .............................................................................................................. 381<br />
1. The country energy situation .................................................................................................................. 381<br />
2. Rational Use Of Energy (RUE) ................................................................................................................. 386<br />
3. Renewable energy .................................................................................................................................... 386<br />
4. Case studies on utilizing renewable energy in Libya .......................................................................... 396<br />
5. Summary and conclusion........................................................................................................................ 407<br />
6. Bibliography............................................................................................................................................... 410<br />
7. List of illustrations .................................................................................................................................... 411
I. SUMMARY<br />
1. Libya Energy Situation<br />
LIBYA - Summary<br />
In Libya, the energy sector plays a vital role in achieving social and economic development<br />
through satisfying the energy needs of the different economic sectors, in addition to the<br />
sector‟s effective contribution, particularly the oil and gas sector, to the GDP. In spite of such<br />
vital role, the sector has several features that can affect its contribution to the achievement of<br />
sustainable development this is mainly due to unsustainable energy production and<br />
consumption patterns, particularly in the end use sectors, the sector has its adverse<br />
environmental impacts on air, water and soil resources.<br />
Libya is experiencing strong economic growth during the last three years which made Libya<br />
one of highest per capita GDP in Africa.<br />
Oil export revenues are extremely important to the economic development of the country as<br />
they represent 90% of the total revenue.<br />
Libya has continues increasing in total primary energy supply with average annual growth of<br />
about 5 % and the oil has the largest share, while the total energy demand reached 9.1 Mte<br />
in 2003 with highest consumption in oil sector.<br />
The electricity is covering more than 99% of population; PV systems are used to supply<br />
electricity to about 2000 inhabitants in rural areas.<br />
The electric energy demand is expected to grow very rapidly in the next few years; water<br />
desalination plants will be the major drive for energy demand as Libya planned to install<br />
desalination plants with amount of one million meter cub per day in the next five years.<br />
The following points to be considered:<br />
Calling on developing and implementing policies and programs to change the current<br />
energy production and consumption patterns, through improving energy efficiencies in all<br />
sectors, particularly the highest energy consuming sectors, as well as promoting the use<br />
of cleaner fuels and renewable energy resources.<br />
Calling on supporting R&D, technology transfer and industrial development of sustainable<br />
energy technologies, utilizing the available bilateral, regional, and international technical<br />
cooperation and funding mechanisms.<br />
Calling on All Libyan organizations to put more emphasis on developing and implementing<br />
educational, capacity building and public awareness programs on energy for Sustainable<br />
Development.<br />
2. Renewable Energy summary<br />
The share of renewable energy technologies in Libya up to now hold only a small<br />
contribution in meeting the basic energy needs, it is used to electrify rural areas for<br />
sustainable development, supply microwave repeater station, and in cathodic protection. A<br />
setup plane was planed for implementing renewable energy sources is to contribute a 10%<br />
off the electric demand by the year 2020. The short plane for renewable energy is to invest<br />
500 million euro in the next five years.<br />
During the past three decades, photovoltaic is the most technology which has been used in<br />
rural applications, particularly for small- and medium- sized remote applications with proven<br />
economic feasibility, several constraints and barriers, including costs exist. The experience<br />
raised from PV applications indicates that there is a high potential of building a large scale of<br />
PV plants in the south of the <strong>Mediterranean</strong>.<br />
There is a great potential for utilizing, home grid connected photovoltaic systems, large scale<br />
grid connected electricity generation using Wind farms, and solar thermal for electricity<br />
generation, with capacities of several thousands of MW. The high potential of solar energy in<br />
373
374<br />
ENERGY AND SUSTAINABLE DEVELOPMENT IN THE MEDITERRANEAN<br />
Libya may be considered as a future source of electricity for the northern countries of<br />
<strong>Mediterranean</strong>.<br />
Solar energy resources in particular can be of great source of energy for Libya after oil and<br />
natural gas. Renewable energy resources offer good opportunities for technology transfer<br />
and international cooperation. The modularity and decentralised nature of renewable energy<br />
technologies make them particularly well suited for rural energy development. In this aspect,<br />
use can be made of the Clean Development Mechanism (CDM) adopted by Kyoto Protocol in<br />
renewable energy applications that would reduce greenhouse gases.<br />
Libya is located in a place which can be considered as a good place for renewable energy<br />
technology and applications development. It is also has great a resources for photovoltaic<br />
basic industry and a solar cell technology which can be built with the share of international<br />
investors.<br />
3. What is needed to promote RE are<br />
Promote and exerting private investment in renewable energy technology transfers and<br />
services.<br />
Increase informal education on all energy aspects as in the formal education.<br />
More attention needs to be paid to social issues related to energy.<br />
Disseminate widely an approach that could be implemented widely in all applications of<br />
RE.<br />
Need to establish partnership at local, national and international levels in order to develop<br />
policies based on evidence of the impact on people.<br />
Courage the international investment to invest in the industry.<br />
International cooperation to develop and build large scale solar energy applications as a<br />
pilot project.<br />
To develop and support, technically, financially, and institutionally, the national research<br />
and application institutions concerned with issues relevant to energy for sustainable<br />
development.<br />
To develop national energy policies and regulatory frameworks that will help to create the<br />
necessary economic, social and institutional conditions in the energy sector to improve<br />
access to reliable, affordable, economically viable socially acceptable and environmentally<br />
sound energy services for sustainable development.<br />
4. Environment and Rational Energy<br />
The usual practice in Libya showed low efficiencies in energy production and consumption,<br />
there is a real challenge to develop an efficient energy use in most sectors, with several<br />
barriers including: lack of access to technology, capacity building, and institutional issues.<br />
Energy efficiency can be implemented in both energy consumption and production sides.<br />
Almost in all energy end-uses, sectors, the focus is on improving the efficiency of equipment<br />
that provides the services, such as heating and air conditioning equipment, appliances,<br />
lighting and motors. In contrast, supply-side energy management focuses on performancebased<br />
improvements resulting in more-efficient energy generation, improved industrial<br />
processes, co- generation and energy recovery systems. On the production side there is a<br />
great importance in increasing efficiency in large- scale energy production. Energy efficiency<br />
can help reducing cost, preserving natural resources and protecting the environment. Energy<br />
efficiency can also be enhanced through access to appropriate technology, capacity-building,<br />
and institutional issues.<br />
Libya is non annex I country under the UN FCCC, and is signatory to the Kyoto protocol, thus<br />
Libya currently is eligible to the CDM. The main emitters of CO2 in 2003 are fuel combustion
LIBYA - Summary<br />
in the power generation sector. Libya's energy related CO2 emissions increased by more<br />
than 78% in one decade mostly due to increased energy supply.<br />
The analysis of the present energy situation in Libya clearly indicates that there are no<br />
programs toward rational use of energy. This situation related to many factors summarized<br />
as follow:<br />
Low electricity tariff specially for residential sector.<br />
Cheap oil prices for transportation.<br />
Lack of national policy toward the conservation of energy.<br />
Lack of specialized national institution which deal with the rational use of energy.<br />
Lack of detailed and deep studies related to the rational use of energy (RUE).<br />
Many studies have indicated that the country's energy demand generation could be<br />
significant reduced if improved energy utilization efficiency by the major energy sectors is<br />
achieved.<br />
375
II. RESUME<br />
1. La situation énergétique en Libye<br />
LIBYE - Résumé<br />
En Libye, le secteur énergétique joue un rôle essentiel dans le développement économique<br />
et social en satisfaisant les besoins en énergie des différents secteurs, en plus de sa réelle<br />
contribution au PNB, notamment provenant du secteur du pétrole et du gaz. En plus de ce<br />
rôle vital, ce secteur présente de nombreuses caractéristiques qui peuvent avoir une<br />
incidence sur le développement durable. Ceci est principalement dû à une structure de<br />
production énergétique et de consommation finale non durable. D‟autre part, le secteur a des<br />
impacts environnementaux défavorables sur l‟air, l‟eau et les ressources du sol.<br />
La Libye connaît depuis trois ans une forte croissance économique au point qu‟elle jouit de<br />
l‟un des PNB par habitant le plus élevé d‟Afrique. Les revenus liés aux exportations de<br />
pétrole sont extrêmement importants pour le développement économique du pays ; en effet,<br />
ils représentent 90% du revenu total du pays.<br />
La Libye continue d‟accroître son offre en énergie primaire totale avec une croissance<br />
annuelle moyenne d‟environ 5%, dont le pétrole représente la part la plus importante tandis<br />
que la demande totale en énergie atteignait 9,1 Mtep en 2003 avec la consommation la plus<br />
élevée dans le secteur du pétrole.<br />
Plus de 99% de la population a accès à l‟électricité. Les systèmes photovoltaïques sont<br />
utilisés pour fournir de l‟électricité à environ 2000 habitants dans les zones rurales.<br />
Pour les prochaines années, un accroissement très rapide de la demande en énergie<br />
électrique (électricité) est attendu ; les usines de dessalement de l‟eau constitueront les<br />
principaux moteurs de la demande en énergie sachant que la Libye a prévu la mise en place<br />
d‟usines de dessalement pour un volume de un million de mètres cube par jour dans les 5<br />
prochaines années.<br />
Les points suivants sont à retenir :<br />
faire appel à des politiques de développement et des programmes pour changer la<br />
structure actuelle de production énergétique et les modes de consommation, à travers<br />
l‟amélioration de l‟efficacité énergétique dans tous les secteurs, en particulier ceux<br />
présentant les consommations énergétiques les plus fortes, et également promouvoir<br />
l‟utilisation de combustibles plus propres et les sources d‟énergies renouvelables.<br />
Encourager la R&D, le transfert de technologie et le développement industriel des<br />
technologies énergétiques durables en faisant appel à la coopération technique bilatérale,<br />
régionale et internationale existante ainsi qu‟aux mécanismes de financement.<br />
Encourager toutes les organisations libyennes à mettre plus l‟accent sur le<br />
développement et la mise en place de programmes éducatifs, de renforcement des<br />
capacités et de sensibilisation du public au développement énergétique durable.<br />
2. Résumé sur les énergies renouvelables<br />
Jusqu‟à maintenant, la part des technologies d‟énergies renouvelables en Libye ne contribue<br />
que très faiblement à répondre aux besoins énergétiques fondamentaux ; elle est utilisée<br />
pour électrifier les zones rurales, fournir des stations de communication et dans la protection<br />
cathodique. Un plan d‟organisation a été prévu pour la mise en place des sources d‟énergies<br />
renouvelables de façon à contribuer à hauteur de 10% à la demande d‟électricité dès 2020.<br />
A court terme, il est prévu des investissements à hauteur de 500 millions d‟euros dans les<br />
énergies renouvelables dans les cinq prochaines années.<br />
Depuis les trois dernières décennies, le photovoltaïque est la technologie qui a été la plus<br />
utilisée dans les zones rurales, en particulier pour les zones isolées de petite et moyenne<br />
distance, avec une faisabilité économique prouvée. De nombreuses contraintes et barrières<br />
existent, dont les coûts financiers. L‟expérience issue des applications photovoltaïques<br />
377
378<br />
ENERGY AND SUSTAINABLE DEVELOPMENT IN THE MEDITERRANEAN<br />
solaires indique qu‟il existe un fort potentiel de construction de centrales solaires à grande<br />
échelle dans le Sud méditerranéen.<br />
Il existe un grand potentiel pour les systèmes photovoltaïques individuels connectés au<br />
réseau, pour les fermes éoliennes de grande échelle connectées au réseau et les systèmes<br />
solaires thermiques pour la production d‟électricité avec des capacités de plusieurs milliers<br />
de MW. Le potentiel en énergie solaire très élevé de la Libye pourrait être considéré comme<br />
une source d‟énergie future pour les pays du Nord de la Méditerranée.<br />
Après le pétrole et le gaz naturel, les ressources en énergie solaire en particulier peuvent<br />
être une importante source d‟énergie pour la Libye. Les ressources en énergies<br />
renouvelables offrent de bonnes opportunités pour le transfert de technologie et la<br />
coopération internationale. Le caractère modulaire et décentralisé des technologies des<br />
énergies renouvelables les rend particulièrement adaptées pour le développement<br />
énergétique dans les espaces ruraux. Dans ce cadre, le Mécanisme de Développement<br />
Propre (MDP) du Protocole de Kyoto peut être utilisé dans les applications d‟énergies<br />
renouvelables qui réduisent les gaz à effet de serre.<br />
La Libye est située dans un endroit naturellement favorable au développement des énergies<br />
renouvelables et de leurs applications. Elle dispose également d‟importantes ressources<br />
pour l‟industrie photovoltaïque et la technologie des cellules solaires dont la construction<br />
pourrait se faire en collaboration avec des investisseurs internationaux.<br />
3. Ce qui est nécessaire pour promouvoir les ER<br />
Promouvoir et solliciter les investissements privés dans les technologies et services<br />
d‟énergie renouvelable (transferts de technologie).<br />
Améliorer l‟éducation informelle aussi bien que l‟éducation officielle sur tous les aspects<br />
énergétiques.<br />
Une plus grande attention doit être accordée aux questions sociales liées au secteur<br />
énergétique.<br />
Large diffusion d‟une approche qui pourrait être appliquée à grande échelle dans toutes<br />
les applications d‟ER.<br />
Nécessité d‟établir des partenariats aux niveaux local, national et international afin de<br />
développer des politiques prenant en compte les besoins et effets sur les populations.<br />
Encourager les investisseurs internationaux à investir dans l‟industrie.<br />
Une coopération internationale pour développer et construire à une application solaire de<br />
grande échelle sous forme de projet-pilote.<br />
Développer et supporter, techniquement, financièrement et institutionnellement les<br />
institutions nationales de recherche et d‟application concernées par les problématiques en<br />
rapport avec le développement durable de l‟énergie.<br />
Développer des politiques énergétiques nationales et des cadres réglementaires qui<br />
faciliteront la création de conditions économiques, sociales et institutionnelles dans le<br />
secteur de l‟énergie afin d‟améliorer l‟accès à des services énergétiques fiables,<br />
abordables, économiquement viables, socialement acceptables et pertinent du point de<br />
vue environnemental pour le développement durable.<br />
4. Environnement et Énergie Rationnelle<br />
On observe en Libye une faible efficacité dans la production et la consommation d‟énergie. Il<br />
existe un réel défi dans le développement de l‟utilisation efficace de l‟énergie dans la plupart<br />
des secteurs. Pour cela, il existe plusieurs obstacles : manque d‟accès à la technologie, de<br />
renforcement des capacités et de problématiques ainsi que des obstacles d‟ordre<br />
institutionnel.
LIBYE - Résumé<br />
L‟efficacité énergétique peut être mise en place aussi bien du côté de la consommation que<br />
de la production d‟énergie.<br />
Dans pratiquement tous les secteurs d‟utilisateurs finaux, l‟accent doit être mis sur<br />
l‟amélioration de l‟efficacité des équipements qui fournissent les services tels que le<br />
chauffage et l‟air conditionné, les appareils, l‟éclairage et les moteurs. D‟autre part, la gestion<br />
de l‟offre énergétique est centrée sur des améliorations de la performance aboutissant à une<br />
production d‟énergie plus efficace, des processus industriels améliorés, la co-génération et<br />
des systèmes de récupération de l‟énergie. Côté production, il est très important d‟accroître<br />
l‟efficacité de la production d‟énergie à grande échelle. L‟efficacité énergétique peut aider à<br />
réduire les coûts, préserver les ressources naturelles et protéger l‟environnement. L‟efficacité<br />
énergétique peut être valorisée via l‟accès à une technologie appropriée, au renforcement<br />
des capacités et aux questions institutionnelles.<br />
La Libye ne figure pas parmi les pays de l‟annexe I de l‟UN FCCC, et est signataire du<br />
protocole de Kyoto ; elle est ainsi éligible pour le MDP. Les principaux émetteurs de CO2 en<br />
2003 sont la combustion du fuel dans la production d‟électricité. En Libye, les émissions de<br />
CO2 liées à l‟énergie ont augmenté de plus de 78% en une seule décennie principalement en<br />
raison de l‟accroissement de l‟offre énergétique.<br />
L‟analyse de la situation énergétique actuelle en Libye montre clairement qu‟il n‟existe pas<br />
de programmes en faveur de l‟utilisation rationnelle d‟énergie. Cette situation est liée à de<br />
nombreux facteurs résumés comme suit :<br />
Faibles tarifs de l‟électricité notamment dans le secteur résidentiel.<br />
Pétrole bon marché pour le transport.<br />
Absence de politique nationale en faveur de la préservation de l'énergie.<br />
Manque d‟institutions nationales traitant de l‟utilisation rationnelle d‟énergie.<br />
Manque d‟études détaillées et approfondies sur l‟utilisation rationnelle d‟énergie (URE).<br />
De nombreuses études ont montré que la production de la demande en énergie du pays<br />
pourrait être réduite de manière significative si l‟efficacité énergétique était améliorée dans<br />
les principaux secteurs énergétiques.<br />
379
III. NATIONAL STUDY<br />
1. The country energy situation<br />
LIBYA - National study<br />
1.1 The ene rg y situation in Libya<br />
Oil and natural gas are the main sources of energy in Libya. Libya is an important oil country<br />
particularly to European countries. Libya had total proven oil reserve of 35 billion barrels at<br />
the end of 2005 and 53 TCF proven natural gas reserves 1 . Libya's export revenues have<br />
increased sharply in recent years to $ 34 billion by the end of 2006 up from only $ 5.3 billion<br />
in 2001 2 .<br />
Oil export revenues are extremely important to the economic development of the country as<br />
they represent 90% of the total revenue 3 .<br />
Area of Libya is 1,759,540 km 2<br />
with a popular of 5,853,000 (2005). Due to Libya oil export<br />
revenue, Libya experienced strong economic during 2003,2004 and 2005 with the real gross<br />
domestic product (GDP) of 46 billion (US $ 97) in 2005 which made Libya one of the highest<br />
per capita GDPs in Africa.<br />
Libya is hoping to reduce its dependency on oil on the country source of income, and to<br />
increase investment in tourism, fisheries, mining and natural gas. Libya also is attempt to<br />
position it self as a key economic intermediary between Europe and Africa.<br />
As illustrated in Figure 1, Total revenue (as percentage of GDP) has increased very rapidly<br />
between 2001 to 2004. This attributed to the rapid growth of the oil sector and its influence<br />
on the economic and social development.<br />
Figure 1 Total Revenue as percentage of GDP<br />
It is noticeable from Figure 1 that the total revenue on a percentage of GDP has decreased<br />
in 2005 due to the fact that there are other sources of income rather than oil.<br />
1.2 Total primary e ne rgy s u pply ( T PES)<br />
TPES has increased from 9.7 Mte in 1990 to 17.7 Mte in 2003 with an average annual<br />
growth of 4.7 %. Figure 2 shows that the oil has a largest share of TPES (57-66%) during<br />
1990-2000 with a little decrease in last years because of using more natural gas in electrical<br />
power generation.<br />
1 National Oil Company (NOC) information<br />
2 Central Bank Of Libya – Economic Bulletin- First Quarter 2003 – Vol No 43.<br />
3 Central Bank Of Libya – Economic Bulletin- First Quarter 2003 – Vol No 43.<br />
381
382<br />
ENERGY AND SUSTAINABLE DEVELOPMENT IN THE MEDITERRANEAN<br />
Figure 2 Share of oil and gas in TPES<br />
Figure 3 shows the trends for TPES, GDP (US $ 1997) for the period from 1986 to 2005.<br />
Figure 3 GDP & TPES From 1986 To 2005<br />
GDP has increased from 25 billion $ in 1986 to 46 billion $ in 2005 with an average annual<br />
growth rate of 4%.<br />
1.3 Energy d emand<br />
1.3.1 Energy demand in oil sector<br />
The total energy demand has increased from 5.4 Mte in 1990 to 9.1 Mte in 2003 with growth<br />
of 60 % as shown in Figure 4. Figure 4 shows also that the oil sector has highest<br />
consumption with 61% of total consumption in 2003.Primary studies shows that the Future<br />
Energy demand in 2010 will be 11.5 Mte as shown in Figure 5 4 .<br />
rd<br />
4<br />
Energy & Life Journal , 23 issue ,June 2006.<br />
Figure 4 The energy demand in oil sector
1.3.2 Electrical energy demand<br />
LIBYA - National study<br />
Figure 5 Forecasted energy demand<br />
The electric energy sector has been developed during the last decade, become the<br />
economic and social development. The peak load has increased from 1595 MW in 1990 to<br />
3875 MW in 2005 while the total installed capacity has increased from 3352 MW in 1990 to<br />
512MW in 2005, and the generated electric energy from 9851 GWh in 1990 to 22500 GWh in<br />
2005. The contribution of steam power plants 65%. Natural gas represents 32% of the fuel<br />
supply for electric power plants and 33% heavy oil fuel and 35% light oil. Figure 6 shows the<br />
growth of peak load during the period from 1992 to 2006, and its forecast until 2020.<br />
Figure 6 The Growth Of Peak Load<br />
383
384<br />
ENERGY AND SUSTAINABLE DEVELOPMENT IN THE MEDITERRANEAN<br />
Figure 7 Locations Of The Electrical Power <strong>Plan</strong>ts<br />
The energy consumption per capita has increased from 1493 kwh/c in 1990 to 3119kwh/c in<br />
2005. The national electric network is accessible to 99% of the population.<br />
Most of electric network is concentrated on the coast, where most of the inhabitants live.<br />
Figure 7 shows the locations of the electrical power plants in Libya<br />
The electric energy demand is expected to grow very rapidly. Its expected that electrical<br />
energy will be double by the year 2014 and it will be more than two and half by the end of<br />
year 2020 5 , as shown in Figure 8. The total number of customers in electric system in Libya<br />
is about one million distributed among seven categories. Residential sector represents 39%<br />
of the total consumption followed by commercial with 14% as shown in Figure 9.<br />
Figure 8 Total number of customers in Electric System<br />
As you can see that the residential sector represents the highest share in electrical energy<br />
demand in Libya. The share of residential load is about 40 % of the overall peak load of<br />
electrical power system in Libya.<br />
The electric system in Libya is run by the state- owned general electric company of Libya<br />
(GECOL). GECOL responsible for generation, transmission and distribution of electricity for<br />
5 General Electric Company Of Libya , Annual Report
LIBYA - National study<br />
entire Libya. GECOL also responsible for water desalination plants in Libya. GECOL planned<br />
to install desalination plants with amount of one million meter cube per day for the period<br />
from 2007 to 2012, this will need about 1.8 TWh/year. This means that the water desalination<br />
plants will be a major drive for energy demand in Libya.<br />
1.4 Envi ronme n t<br />
Libya is a Non-Annex I country under the United Nations Framework Convention on Climate<br />
Change (ratified June 14th, 1999) and it is a signatory to the Kyoto Protocol. Thus, Libya<br />
currently is eligible to the CDM. GECOL has already started contacts with international<br />
agencies and investors to use CDM for renewable energy development; the Libyan<br />
government has already issued a law to encourage foreign investors for all sectors.<br />
The main emitters of CO2 in 2003 in Libya, as shown in Figure 9, are fuel combustion in the<br />
power generation sector (38%), in the transport sector (20%) and in industry (8%). Other<br />
sectors represent 34%. In total, energy-related emissions are responsible for almost 100% of<br />
CO2 emissions in the country 6 .<br />
Figure 9 CO2 Emission by sectors<br />
a b<br />
In 2003 petroleum accounts for more than 60% of carbon emissions in Libya and natural gas<br />
is responsible for around 40% 7 . The increasing reliance on natural gas should work to lower<br />
carbon emissions. Libya„s energy-related CO2 emissions increased by more than 78%, from<br />
less than 18.7 Mte in 1980 to around 50 Mte in 2003 (8% average annual growth between<br />
2001 to 2003), mostly due to increased energy supply Figure 10.<br />
Figure 10 CO2 emissions over the period 1980 to 2003<br />
6 General Electric Company Of Libya , Annual Report.<br />
7 Bureau of Energy Data and Studies, LNEC –Libyan National Energy Information-sixth edition 2004.<br />
385
2. Rational Use Of Energy (RUE)<br />
2.1 Energy I n te nsity<br />
386<br />
ENERGY AND SUSTAINABLE DEVELOPMENT IN THE MEDITERRANEAN<br />
Several studies have investigated the potential impact of improved energy use efficiency in<br />
Libya. Bullut and Ekhlat 8 have indicated that the potential impact of improved energy<br />
utilization efficiency and energy management can be quite significant, a mounting to reduce<br />
the demand by about 50 million barrels of oil in the year 2020 (20 %).<br />
Similarly, the country's electricity generation could be significant reduced if improved energy<br />
utilization efficiency by the major energy sectors is achieved. This could amount to 2160 MW<br />
reduction in capacity to be added by the year 2020 9 .<br />
Figure 11 shows Total Energy Intensity and per sector, It is clearly show that the total energy<br />
intensity almost constant during 1995 – 2002.<br />
Figure 11 Energy intensity (Total &Per Sectors)<br />
The analysis of the present energy situation in Libya clearly indicates that there are no<br />
programs toward rational use of energy especially in the industrial sector and transportation<br />
sector. This situation related to many factors summarized as follow:<br />
low electricity tariff specially for residential sector.<br />
2- cheap oil prices for transportation.<br />
3- lack of national policy toward the conservation of energy.<br />
4- lack of specialized national institution which deals with the rational use of energy<br />
lack of detailed and deep studies which help the decision makers to adopt RUE programs.<br />
3. Renewable energy<br />
3.1 Renew able resour ces<br />
Libya is located in the middle of North Africa with 88% of its area considered to be desert<br />
areas, the south is located in the Sahara desert where there is a high potential of solar<br />
energy which can be used to generate electricity by both solar energy conversions,<br />
photovoltaic, and thermal.<br />
8 Dr. Abdullah Ballut, Dr. Mohamed Ekhlat "The Potential Impact Of Improved Energy. Utilization Efficiency On The Future<br />
Energy Demand In Libya Up To The Year 2020" 17th World Energy Congress, USA ,1998.<br />
9 Dr. Abdullah Ballut, Dr. Mohamed Ekhlat "The Potential Impact Of Improved Energy. Utilization Efficiency On The Future<br />
Energy Demand In Libya Up To The Year 2020" 17th World Energy Congress, USA ,1998.
3.1.1 Solar radiation<br />
LIBYA - National study<br />
The solar radiation in Libya considered being very high the direct radiation on the horizontal<br />
plan is shown in Figure 12, the total energy received on horizontal plan reach up to 7.1<br />
KWh/m 2<br />
per day, while Figure 13 shows a map for Libya indicating the radiation Level.<br />
Figure 12 The average monthly daily global radiation on the horizontal surface<br />
3.1.2 3.1.2 Wind Potential<br />
Figure 13 The average global radiation on the horizontal plane<br />
The measured of wind energy showed high potential of wind energy in Libya, Figure 14<br />
shows the potential wind energy measured data on 40 m height for the costal side of Libya.<br />
Figure 14 Wind potential for the Libyan coast area<br />
387
3.1.3 Other sources<br />
388<br />
ENERGY AND SUSTAINABLE DEVELOPMENT IN THE MEDITERRANEAN<br />
Other renewable sources are available in Libya like geothermal, Biomass, tidal waves, all<br />
these sources have less potential in Libya.<br />
3.2 Resources estima ti on for Libya<br />
The renewable energy sources estimated for Libya according to the MED-CSP scenario is<br />
shown in Table: 1, while the electric consumption and its sources in year 2050 are shown in<br />
Figure 15.<br />
Table 1 Renewable energy sources for Libya<br />
Type Potential<br />
Solar electricity 140,000 TWh/y<br />
Wind electricity 15 TWh/y<br />
Biomass 2 TWh/y<br />
Total 157,000 TWh/y<br />
Figure 15 Electricity consumption in Libya and supply resources<br />
3.3 Renew able energy a p p lications<br />
The use of renewable energies have been introduced in wide applications due to its<br />
convenience use and being economy effective in many applications, the renewable energy<br />
used in Libya consists of photovoltaic, solar thermal application, wind energy, and Biomass.<br />
3.3.1 Photovoltaic<br />
The use PV systems started in 1976, and since then many projects have been erected for<br />
different sizes and applications. The first project put into work was a PV system to supply a<br />
cathodic protection to protect the oil pipeline connecting Dahra oil field with Sedra Port.<br />
Projects in the field of communication was started 1980 where a PV system was used to<br />
supply energy to a microwave repeater station near Zella. Projects in the field of water<br />
pumping was started 1983 where PV pumping system was used to pump water for irrigation<br />
at El-Agailat. The use of PV systems for rural electrification and lighting was started in 2003.<br />
Water pumping projects was also erected beginning in 1984. The role of PV application was<br />
grown in size and type of application.<br />
PV in Microwave Communication Networks<br />
The Libyan Microwave communication networks consist of more than 500 repeater stations.<br />
Only 9 remote stations were running by photovoltaic systems till the end of 1997 with a total<br />
peak power of 10.5 KWp. four of these stations are still running after 26 years of work, the<br />
batteries which are of open type batteries were replaced three times with an average life time<br />
of eight years.
LIBYA - National study<br />
It was the success of the PV systems technically and economically that pushes the changing<br />
of all possible diesel stations to PV stations in the Libyan communication networks. The total<br />
number of stations running by PV in the field of communications exceeding 100 stations.<br />
The total installed photovoltaic peak power installed by the end of the year 2006 is around<br />
690 KWp. Figure 16, showing the accumulated installed photovoltaic systems in the<br />
communication networks in the period 1980-2006.<br />
Figure 16 The accumulated installed PV peak power 1980-2006<br />
Gained and remarks that were drawn from the past experience of PV systems are as follows:<br />
1) No spare parts had been used for PV systems which are installed 26 years ago.<br />
2) No failure has been registered for the systems installed 26 years ago.<br />
3) Very low cost or no running cost for most of the PV systems.<br />
4) Batteries have been changed after about ten years from installation.<br />
5) Lack of knowledge; People in developing countries should be made aware of PV<br />
systems through increased their understanding of this technology.<br />
6) The average production energy for systems of 1.2 KWP is 6 KWh/day.<br />
7) The AC option of electricity for rural electrification was the best convenience choice.<br />
8) The closed type batteries option was the best convenience choice.<br />
PV in Cathodic protection<br />
The first system in this field was put into work in 1976, the accumulated total power of PV<br />
systems in this field is second to PV systems in communications, the total PV systems in this<br />
field is around 320 system by the end of 2006, with a total installed PV systems of 650 KWp.<br />
PV technology is considered to be a relatively new in developing countries; the problem we<br />
are facing not dealing with the technology rather how other people dealing with it. We are<br />
experiencing some vandalisms issues.<br />
Figure 17 The accumulated installed PV peak power in the period 1983-2006<br />
The experienced advantages of using PV solar generators can be summarized as follows<br />
Low running cost.<br />
High reliability.<br />
389
PV IN Rural Electrification<br />
390<br />
ENERGY AND SUSTAINABLE DEVELOPMENT IN THE MEDITERRANEAN<br />
Durability of the system<br />
Fewer services visits<br />
Low maintenance cost.<br />
Less number of thefts.<br />
No communication stops.<br />
Vandalisms<br />
Problems facing the electrification of all regions in any country are low population, and being<br />
away from the electric networks. It is so expensive to extend high line voltage through desert<br />
to electrify few hundred inhabitants. In low population countries electricity is only available in<br />
the cities and no electric network is used to power its rural areas, where as powering rural<br />
areas are not easy or available. The electric network in low population countries may not be<br />
available within a reaching distance of the needed places.<br />
The Libyan national plane to electrify rural areas consists of electrifying scattered houses,<br />
villages, and water pumping. The PV supply systems for ten villages was introduced as a<br />
project to electrify remote areas some of these villages are<br />
a) Mrair Gabis village as an example of scattered houses<br />
b) Swaihat village as an example of scattered houses<br />
c) Intlat village as an example of scattered houses<br />
d) Beer al-Merhan village as an example of scattered houses<br />
e) Wadi Marsit village as an example of a village having diesel generator<br />
f) Intlat village<br />
The installation of photovoltaic systems started in the middle of 2003. The total number of<br />
systems installed by the General Electric Company of Libya (GECOL) are 340 with a total<br />
capacity of 220 kWp, while that which was installed by Center of Solar Energy Studies<br />
(CSES) and Saharian Center is 150 systems one of the system is a hybrid system with diesel<br />
generator to supply a village of 200 inhabitances. The total peak power is 125 KWp, other<br />
involved in using PV has installed 50 PV systems with a total capacity of 60 KWp. In these<br />
applications 440 systems have been installed with total peak power of 405 KWp.<br />
Figure 18 Wade Marsite PV Central <strong>Plan</strong>t
PV for Water pumping<br />
LIBYA - National study<br />
Figure 19 PV isolated system in Emrier-Gabes<br />
Figure 20 Location Of PV Systems (GECOL)<br />
Water pumping was considered as one of the best PV applications in Libya as remote wells<br />
which are used to supply water for human animals in rural places. The water pumping project<br />
consists of installing of 40 PV systems with a total estimated peak power for this application<br />
is 120 KWp.<br />
391
392<br />
ENERGY AND SUSTAINABLE DEVELOPMENT IN THE MEDITERRANEAN<br />
Figure 21 PV Water Pumping Beer Jufar<br />
Figure 22 PV Water Pumping Beer Tssawa<br />
These PV systems proved to be reliable and justified economically for these types of<br />
applications. Table 2 showing the total installed PV capacity in Libya by the year 2006.<br />
Table 2 Total installed PV capacity in Libya by the year 2006<br />
Applications Number of systems Total power [KWp]<br />
Communication 120 690<br />
Cathodic protection 320 650<br />
Rural Electrification 440 405<br />
Water pumping 40 120<br />
Total 920 1865
3.3.2 Thermal Conversion<br />
LIBYA - National study<br />
The use of domestic solar heater started in 1980 by installing a pilot project of 35 systems,<br />
follows by some other projects. There are all together about 6000 solar heaters in Libya. The<br />
use of evacuated tubes for solar haters has been started for some hotels and homes and<br />
expected to grow up soon. Water heating energy consumption is about 12% of the national<br />
electricity production. The use of solar heaters has not spread in all country due to<br />
1) No national or personal industry has been established for local individuals.<br />
2) Lack of Knowledge for the people.<br />
3) Low electric energy tariff.<br />
3.3.3 Solar Bond Demonstration Project<br />
A solar bond was installed in 1994 as a pilot project for water desalination Unit with<br />
production of 5 m3/Day, the size of which is 800 square meter.<br />
3.3.4 Wind Energy in Libya<br />
Wind energy was utilized for water pumping in many oasis beginning 1940, sizes of 50 –<br />
1000W, the use of this energy has not been developed as the wind-mills need some<br />
maintenance from time to time. A demonstration project of one unit of size 10 KW was<br />
installed 1993. In 2004 measurement of the wind speed for wind potential has been<br />
conducted. The measurements showed that there is a high potential for wind energy in Libya<br />
and the average wind speed at a height of 40 meter is between 6- 7.5 m/s. Figure 23 shows<br />
wind potential for the Libyan coast area.<br />
Figure 23 Wind potential for the Libyan coast area<br />
The use of wind energy for electricity production has not started yet in Libya, but a project<br />
was contracted for installing 25 M W as a pilot project to be erected in two years time. A<br />
project to present two Atlases that provide fact access to reliable solar and wind data through<br />
out Libya is also been contracted for. The Atlases allow for accurate analysis of the available<br />
wind and solar resources anywhere in Libya, and is therefore very valuable for planning<br />
profitable wind farms and solar projects.<br />
3.4 Nati ona l re new ab le ene rgy s t ra teg y<br />
From the experience gained in utilizing PV systems, a proposed national Renewable Energy<br />
plan that aims toward bringing RE into the main stream of the national energy supply system<br />
with a target contribution of 10% of the electric energy demand by the year 2020. a.<br />
3.4.1 Short term plane for utilization for using Renewable Energy<br />
The proposed plan calls for a wide spectrum of Renewable energy applications. Table 3<br />
shows short term plane for renewable energy contribution in the energy supply for Libya<br />
393
394<br />
ENERGY AND SUSTAINABLE DEVELOPMENT IN THE MEDITERRANEAN<br />
Table 3 Proposed plan for the next five years (2006-2010)<br />
Technology 2006 2007 2008 2009 2010 Total<br />
PV 1 2 2 2 3 10 Map<br />
Wind 15 30 30 35 40 150 MW<br />
Water heating 2000 4000 4000 4000 6000 20,000 m2<br />
Thermal electricity - - - - 20 20 MW<br />
Thermal Desalination - - - - 20,000 20,000 m3<br />
Hydrogen - - - 10 10 20 KW<br />
3.4.2 Long term plane for Renewable Energy<br />
A long term plane for 2005-2010 will make use of all possible renewable sources, table 4<br />
shows the contribution of each source for the years 2006-2020.<br />
3.4.3 Strategy objectives<br />
Table 4 Proposed plan (2010-2020).<br />
Technology Total<br />
PV 10 MWp<br />
Wind 150 MW<br />
Thermal Water heating 20,000 m2<br />
Thermal electricity 20 MW<br />
Thermal Desalination 20,000 m3<br />
Hydrogen 20 KW<br />
The objectives of implementing this strategy are summarized as follow:<br />
1) To improve energy efficiency and energy conservation<br />
2) Capacity building<br />
3) Coordination of national efforts towards the achievement of the strategy target for<br />
renewable energy<br />
4) Support of renewable energy market penetration<br />
5) Support of renewable energy Technology transfer<br />
6) Support of R&D, education and training in the field of renewable energy<br />
3.4.4 <strong>Action</strong>s required to promote RE<br />
Regulations:<br />
Incentives<br />
Quality Insurance<br />
Finance:<br />
Support Of R&D<br />
Investment...Projects/Studies<br />
Technology:<br />
Demo projects<br />
Pilot Projects
Manufacturing<br />
Supportive: Training<br />
Education<br />
Information<br />
LIBYA - National study<br />
3.4.5 Research and development (R& D) Facilities<br />
To help implementing the renewable energy strategy some kind of R&D facilities needed,<br />
there are three research centers, five university, and two companies which having some kind<br />
of renewable energy activates, the most active in this is Renewable Energy and Water<br />
Desalination Research Center. The R&D Facilities in this centre are:<br />
Solar Thermal Laboratories<br />
Mobile Liquid Solar Collector Performance Test Faculties.<br />
Solar Collector Qualification Test Lab.<br />
Mobile Solar Liquid Heating Test Lab.<br />
Liquid Solar Thermal Storage Tank Facilities.<br />
Photovoltaic Laboratories<br />
Semiconductors and Solar cells Lab.<br />
Solar Cells and PV Modules Testing Lab.<br />
PV Outdoor testing Facilities<br />
General Purposes Laboratories<br />
Optical Properties Test Facilities.<br />
Steady State Solar Simulator.<br />
Metrological Sensors Calibration Lab.<br />
Wind Energy Lab Laboratories<br />
Wind Energy Converter System Test Station<br />
3.5 Future pr os pects of PV in Libya<br />
There is a great potential to use PV systems and other renewable energy sources in Libya,<br />
the following are some of the projects planed for.<br />
3.5.1 Desalination pilot project powered from renewable energy sources:<br />
General Electricity Company of Libya is planning to install of pilot plant for Sea Water<br />
Reverse Osmosis desalination powered from Renewable Energy Sources. The nominal<br />
production of the plant will be 300 m³/d for the supply of a village with potable water. Both<br />
wind energy conversion and photovoltaic (PV) power generation will be integrated into a grid<br />
connected power supply for a Reverse Osmosis (RO) desalination plant with power recovery.<br />
3.5.2 One MW PV pilot plant in Libya<br />
GECOL is now planning a PV project of 1 MW capacity grid connected system. The site of<br />
the plant is already decided.<br />
This pilot PV project is intended to accommodate know - how on PV technology and on the<br />
operation, maintenance and management of a large PV system, in preparation for larger -<br />
scale installations in the future. The consulting firm is already selected employed to prepare<br />
detailed design of the pilot plant, to produce a tender specifications for selecting the supplier<br />
and to supervise the project implementation.<br />
3.5.3 Water pumping Systems<br />
A plane was made to install around 100 PV systems to pump water for irrigation of date trees<br />
in the desert of Libya.<br />
3.5.4 Grid connected PV Systems<br />
Due to the performance of stand alone PV systems GECOL is planning to erect a project of<br />
10 PV systems grid connected in the year 2007.<br />
395
396<br />
ENERGY AND SUSTAINABLE DEVELOPMENT IN THE MEDITERRANEAN<br />
This pilot PV project is intended to accommodate know - how on PV technology and on the<br />
operation, in preparation for larger - scale installations in the future.<br />
4. Case studies on utilizing renewable energy in Libya<br />
4.1 Case stud y o n rur al electrification using p hotovoltaic<br />
s ys t e ms<br />
The electrification of rural areas and villages is one of the problems facing electric company<br />
in all countries, it is a known fact that it is very costly to extend local electric network to the<br />
places that fare away. The use of diesel generators will not be the best solution as it has a<br />
high running cost and need special handling. Thus it will be more practical to use other<br />
possible sources of energy, as renewable sources. The General Electrical Company of Libya<br />
(GECOL), which is the electric company responsible for electrification, has conducted a<br />
survey to estimate the real need of inhabitants living in the remote areas. Based on the real<br />
needs, the suitable type of source was selected as an AC current, the batteries was chosen<br />
to suite the people, in this case closed type of batteries was chosen which do not need any<br />
maintenance, the project planed to electrify about ten villages , A case study of this project is<br />
Mrrair-Gabis. The village was electrified in the year 2003.<br />
4.1.1 Mrrair-Gabis Location and Activities<br />
Mrrair-Gabis village was selected as a village which has no electric power supply, the village<br />
is located about 250 km west of Benghazi city and nearest city is Gdabia which is 50 Km<br />
away. The climate in this selected region is the <strong>Mediterranean</strong> Sea; the ambient temperature<br />
ranges between - 5o C and 45o C. The population of the village is counted as 39 families<br />
totaling of 350 inhabitances scattered in an area of about 15 sq. km. This population is living<br />
either in houses or huts, in addition to a school for the students from the first to the ninth<br />
grad. The main activity of this village is livestock pasturing and agricultural.<br />
4.1.2 Options to Electrify the Village<br />
The main options for electric energy production for the selected site are:<br />
a) Electric grid<br />
b) Diesel generation<br />
c) PV generation<br />
a) The Electric Grid Option<br />
The expected daily energy consumption; using the national grid; may reach 1000 KWh for<br />
the whole village and this amount will grow by about 25% by the end of the expected life time<br />
of the system which is assumed to be 20 years.<br />
Looking to the geographical map of the site, there is one way to supply the required electric<br />
energy from the national grid. It is to construct a high line voltage of 66 KV for 50 km from<br />
Gdabia.<br />
Referring to the prices of delivery and installing 66 KV lines given by the general electric<br />
company; 66/11 KV substations of about 0.5 MVA, the village 11 KV network, the 11 KV<br />
substations, and the distribution network. Accordingly the capital investment is 2,401,102 LD,<br />
in addition to maintenance, this will come 3,100,400 LD. This will give a cost of 0.62<br />
LD/KWh.<br />
b) The Diesel Generation Option<br />
The proposed life time of diesel generators are about 12 years, however, the local<br />
experience showed that the average life time ranges between 7 to 8 years only. This is<br />
mainly due to the severe climatic conditions. It is to be noted that several problems arise with<br />
diesel generators resulting in long down times. The fuel transportation through difficult desert<br />
ways adds other problems to this way of generation of electrical energy. To electrify the<br />
village with diesel generators, this will required two 0.5 M V generators, beside a local<br />
distribution network , taking into account the maintenance running cost which we take it to be
LIBYA - National study<br />
a yearly 35% of the installation cost. The total cost becomes over 20 years will be 3,598,000<br />
LD. This will give a cost of 0.72 LD/KWh.<br />
c) PV Generation<br />
Two options were considered to generate the required amount of energy using the direct<br />
conversion of solar energy; mainly the central and distributed sources. The central way of<br />
energy production was omitted firstly due to the geographical nature of the site; secondly to<br />
get rid of having a distribution network and the problems arises with any fault in the network<br />
and/or other load problems in spite of the main advantage of it, namely the reduced storage<br />
capacity required. It was decided to use the A.C supply system to be consistent with the<br />
available appliances in the local market. The electricity produced by PV conversion of solar<br />
energy will not be used in the same way as that which has been designed to be supplied by<br />
electric grid.<br />
4.1.3 Load Estimation to supply remote areas houses By PV systems<br />
A survey was conducted to estimate the real need of inhabitants living in the remote areas.<br />
Based on the real needs, the suitable type of supply was selected as an ac current, the<br />
batteries was chosen to suite the people, in this case closed type of batteries was chosen<br />
which do not need any maintenance, the load is defined as follows.<br />
The load was calculated for each type of living places based on general assumptions. The<br />
load was estimated for average house as given in Table 5, and for average hut as given in<br />
Table 6. The total energy for house is taken to be 3.5 KWh/day, for the huts of type a taken<br />
to be 2 KWh/day.<br />
Load type No of<br />
units<br />
Table 5 Load estimation for an average house<br />
Unit power<br />
(w)<br />
Working<br />
factor<br />
Power<br />
Watt<br />
Working<br />
hours/day<br />
4 20 50% 40 6 240<br />
Energy/day<br />
Wh/day<br />
Indoor Lighting<br />
Outdoor lighting 2 20 100% 40 3 120<br />
Refrigeration 1 150 100% 150 12 1800<br />
TV set 1 120 100% 120 4 480<br />
Water pump 1 400 100% 400 1 400<br />
Radio 1 10 100% 10 3 30<br />
Fans 2 70 50% 70 2 140<br />
Other 1 100 100% 100 3 300<br />
Total 930 3510<br />
Table 6 Load estimation for an average hut<br />
No of Unit power Working Power Working Energy/day<br />
Load type<br />
units (watts) factor watt hours/day Wh/day<br />
Indoor Lighting 4 20 50% 40 6 240<br />
Outdoor lighting 1 20 100% 20 3 60<br />
TV 1 100 100% 100 4 400<br />
Fans 1 70 100% 70 2 140<br />
Others 1 110 100% 110 10 1100<br />
Total 340 1940<br />
The house of 3.5 KWh was designed with 1200 Wp, while the houses of 2 KWh was<br />
designed with 750 Wp.<br />
397
4.1.4 Results of PV System Sizing<br />
398<br />
ENERGY AND SUSTAINABLE DEVELOPMENT IN THE MEDITERRANEAN<br />
All houses in the village have been chosen to be of 1.2 KWp. The PV system assumed to<br />
have a life time of 25 years and the batteries of eight years, no electronic parts expected to<br />
be replaced. The total cost for this type is 24,190 LD. From the actual data we have<br />
experienced in electrifying Mrrair-Gabis village we calculated the actual cost of the KWh. The<br />
calculation was based on the actual energy production of the PV system for houses of 1.2<br />
KWp, the recorded average energy production over years of working for some of the systems<br />
is 6 KWh/day. This will give a cost of 0.44 LD/KWh. Figure 24, showing a comparison<br />
between the cost per KWh for the three types of the generations.<br />
Figure 24 Cost Different Option<br />
From Figure 24, it is clear why it was decided to take the option of PV systems to electrify<br />
remote areas.<br />
4.1.5 PV Systems Performance<br />
Forty systems were installed in Mrrair-Gabis village since 2003. Due to the importance of<br />
evaluating the performance the PV systems installed, we selected thirty systems of the over<br />
all systems installed; all systems were equipped by a data logger” ENERPACK”.<br />
To help evaluating the performance of this type of PV systems, we collected the data from<br />
Jan 2004 to July 2006. The performance analysis was based on the PV system performance<br />
ratio introduced by International Energy Agency (IEA PVPS), and usage factor introduced by<br />
Didier Mayer and Michael Herdernreich. To evaluate the potential energy we found that the<br />
average potential energy of all systems is 5.43 Kwh/d, systems with potential energy more<br />
than 5.6 KWh/day are shown in Figure 25 the maximum potential energy recorded in one day<br />
is 7.32 KWh/d and a maximum monthly average of 6.75 KWh/d.<br />
Potential Energy<br />
To evaluate the potential energy we found that the average potential energy of all systems is<br />
5.43 KWh/d, systems with potential energy more than 5.6 KWh/day are shown in Figure 25<br />
the maximum potential energy recorded in one day is 7.32 KWh/d and a maximum monthly<br />
average of 6.75 KWh/d.<br />
Figure 25 System with potential energy more than 5.6 Kwh/D
Array output energy<br />
LIBYA - National study<br />
To evaluate the array output energy we found that the average array energy of all systems is<br />
3.32 KWh/d, systems with array energy more than 4.0 KWh/day are shown in Figure 26. The<br />
maximum array energy recorded in one day is 6.28 KWh/d and a maximum monthly average<br />
of 5.6 KWh/d.<br />
Load performance<br />
Figure 26 System With Array Output Energy More Than 4 KWh/D<br />
To evaluate the load energy we found that the average load energy of all systems is 3.25<br />
KWh/d, systems with load energy more than 3.6 KWh/day are shown in Figure 27. The<br />
maximum load energy recorded in one day is 6.4 KWh/d and a maximum monthly average of<br />
5.6 KWh/d<br />
Usage Factor Performance<br />
Figure 27 Systems with load energy more than 3.6 KWh/d<br />
In evaluating the system‟s usage factor we found that the average usage factor of all<br />
systems is 61%, systems with usage factor more than 70% are shown in Figure 28. The<br />
maximum usage factor recorded in one month is of 96%.<br />
399
Global efficiency<br />
400<br />
ENERGY AND SUSTAINABLE DEVELOPMENT IN THE MEDITERRANEAN<br />
Figure 28 Systems with usage factor more than 70%<br />
In evaluating the system‟s global efficiencies we found that the average global efficiency of<br />
all systems is 48%, systems with usage factor more than 55% are shown in Figure 29. The<br />
maximum global efficiency recorded in one month is of 80%. The performance figures show<br />
the average potential energy is almost five times the peak power, the average system losses<br />
0.06 KWh/d which indicate that there the losses due to the system components is very small,<br />
the average capture losses is 2.7 KWh/d which means that the system is not capturing<br />
almost half it‟s potential energy (production factor 50.5%), the average usage factor is 61%<br />
which is considered good for this type of SAS, the average performance ratio is 49% which is<br />
considered also very high, the overall performance of these systems are quite high as it has<br />
quite high usage factor, and performance ratio, while it has high capture losses, the overall<br />
performance are more than reasonable for these kind of systems. we noticed that no break<br />
down has been recorded from any system and the load energy in summer is more than that<br />
in the winter.<br />
Figure 29 Systems with global eff. More than 55%<br />
4.1.6 Experience from rural electrification<br />
The use of PV systems becomes more visible, and a greater attention was given to its use<br />
for developing remote areas in low population countries, therefore the PV systems will be the<br />
way to electrify rural areas.<br />
As a first step in the direction of using PV systems, it is essential that people be made aware<br />
of the technology through increasing the understanding of the processes and the
LIBYA - National study<br />
fundamental principles on which it is based. The following are some remarks which has been<br />
noticed from the projects which installed in the year 2003.<br />
1) People in these villages in spite of being not knowledgeable with the technology yet they<br />
are dealing with the systems with care.<br />
2) In spite that PV systems does not have energy meters to disconnect the load when the<br />
energy drawn by the house holder more than designed , non of the systems went over<br />
discharge.<br />
3) The PV systems which are installed in all villages are working without any system failure.<br />
4) The average production energy for systems of 1.2 KWP is 6 KWh/day.<br />
5) The a.c option of electricity was the best choice.<br />
6) The closed type batteries option was the best choice for the rural areas people.<br />
7) More and more remote areas people asking for PV system.<br />
8) The people in the villages started to have night gatherings.<br />
9) The people start to watch TV and using refrigerator.<br />
10) The PV systems performance at the local environment proved to be highly reliable and<br />
cost competitive.<br />
11) Children should be aware of the PV systems through their schools.<br />
12) Repeated visits should be done to inshore the correct use of the PV systems.<br />
13) All systems have been installed by local engineering and technicians.<br />
4.1.7 Social impacts of PV systems<br />
Since this technology is considered as relatively new; we are experiencing a lot of social<br />
changes; among these; the settlement of Bedouins in some locations started even before<br />
starting the installation of the PV systems, we are expecting that some small industries will<br />
be started. The availability of power supply will give a good chance to involve the populations<br />
of such remote areas in increasing their knowledge and be familiar with the modern society<br />
daily life. The existence of electrical power supply motivates the population to use more<br />
appliances like TV sets, refrigerators that are normally in use in grid connected areas. As a<br />
result we have noticed load increase in some houses which exceed the maximum capacity of<br />
the PV supply systems. We also noticed due to the availability of electrical energy some<br />
population start to move back to these remote areas resulting in adding new houses and<br />
loads that area not planned. It is expected that the increase in population will drop the family<br />
income and this may drive some family members to move to other places looking for new<br />
jobs. The reception of TV programs may change the way of family life resulting in low<br />
productivity. We also noticed due to the availability of electrical energy some population start<br />
to move back to these remote areas resulting in adding new houses and loads. The<br />
reception of TV programs may change the way of family live resulting in lower productivity.<br />
We have not experience any vandalism, and the only problem reported in one of the system<br />
in which the inverter stopped due over load which may be considered to be due to the<br />
equipment itself.<br />
4.2 Case stud y o n using photovo l taic sys t ems in<br />
c om municati o n ne tw orks<br />
As more information needed to be distributed around, more and more telecommunication<br />
networks have to be extended. The only problem facing the wide distribution of information is<br />
the availability of electric power in rural areas where powering of telecommunication systems<br />
are not easy or available. The need to increase rural telecommunications becomes more and<br />
more important and as more rural telecommunications needed, more dependent, and reliable<br />
sources of energy are needed. The electric network in developing countries may not be<br />
available within a reaching distance of the needed places. It will be very costly to extend local<br />
401
402<br />
ENERGY AND SUSTAINABLE DEVELOPMENT IN THE MEDITERRANEAN<br />
electric network to the places where it is required. Thus it will be more practical to use other<br />
possible sources of energy, which will be either diesel generators or renewable sources .The<br />
use of diesel generators will not be the best solution as it need skilled personal, a routine<br />
maintenance, and fuel delivery, which will not suit the developing countries.<br />
Thus the use of PV systems becomes more visible, and a greater attention should be given<br />
to its use for developing telecommunication networks in developing countries, and so the PV<br />
system will be the way to develop the telecommunication networks.<br />
The use of photovoltaic systems as a power generator in communication was first<br />
established in the industrial countries but it is also established in the developed ones, where<br />
PV systems were used in communications field as a power supply in microwave networks,<br />
VSAT stations, and railway communications.<br />
As a first step in the direction of using PV systems, it is essential that developing countries<br />
be made aware of the technology through increasing the understanding of the processes and<br />
the fundamental principles on which it is based.<br />
4.2.1 Options available for powering remote telecommunications networks<br />
There are four options available for electricity generation in remote and isolated areas,<br />
namely electric network, diesel generators, wind energy, and photovoltaic systems. The<br />
electric network may not be available at the place needed beside in developing countries the<br />
electricity from the national grid is subjected to stops without notice, in addition you have to<br />
think about a reliable back up system, which means that you either use batteries or diesel<br />
generators. Therefore if you are thinking to power a rural station you may not be able to use<br />
electric network as an option in most of developing countries.<br />
The use of wind energy in this type of applications will not be a reliable source as wind<br />
energy is not a continuous supply, beside the use of wind source need maintenance<br />
personal, and so this option has to be omitted as a power supply. Finally we end up with two<br />
technologies that can be used for rural telecommunications. The diesel generators option<br />
has been used in many countries as a power supply for rural telecommunication but it was<br />
found that it is not suitable for developing countries, as it needs maintenance, skilled<br />
personal which not available for developing countries, its high running cost and reliability<br />
made this option not preferable for the developing countries. We left with the PV systems<br />
utilization, which considered as a new technology for developing countries and as a new<br />
technology it has some obstacles.<br />
4.2.2 Obstacle opposing popularization of PV system option<br />
There are some Obstacles opposing fast and wide spread of PV systems in the developing<br />
countries, these because of lack of knowledge, experience, and confidence in using this type<br />
of energy. Table 7 showing some of these Obstacles and some solutions.<br />
Table 7 Obstacle facing the wide spread of PV technology in the developing countries.<br />
Obstacle solutions<br />
Lack of knowledge developing countries should be made aware of the technology through<br />
increased their understanding and appreciation of this technology.<br />
Lack of experience Exchange experience between developing countries<br />
Lack of prestige Prestige awards and events for persons and organization in developing<br />
countries<br />
Disregard Exchange of information between the countries and organization who<br />
have implemented PV systems<br />
Marketing Implement strategies to facilitate the developing of market in<br />
developing countries<br />
Developing countries<br />
policies<br />
Make loans of free interest available to PV system buyers<br />
Cost Cost reduction on PV prices for PV systems users
LIBYA - National study<br />
Quality control of product Improving the technical performance of PV system used in developing<br />
countries<br />
Services Make services available to users in his country<br />
Operation and maintenance Make training available to users from developing countries<br />
Oil prices Take out the subsidizing of oil prices in developing countries<br />
Taxation policies developing countries should exclude this technology from any kind of<br />
taxes<br />
4.2.3 Case study<br />
To reflect the importance of using PV systems in the field of telecommunication, we introduce<br />
the use of PV systems in telecommunication networks in Libya. In this case study we<br />
introduce the importance, the advantageous of using PV systems, and experience gained in<br />
utilizing the photovoltaic systems in rural telecommunication. In repeater stations, which are<br />
away from cities, or away from general electric grid, diesel generators have been used as a<br />
power supply. The diesel power system in most of the repeater stations consists of two<br />
diesel generators, each generator works for one week, while the other is standby. The diesel<br />
generators need a constant supply of fuel, continuous maintenance, skilled labour, special<br />
handling machines, and cause stooping of communication.<br />
4.2.4 PV systems for powering Libyan communication network:<br />
The use of PV systems was first started in Libyan communication network as a pilot project<br />
in 1980 where ten small repeater stations were put into work. The use of the PV systems<br />
proved to be suitable for this type of application, the stations which is running by PV systems<br />
did not stop due to lack of fuel or maintenance problems, and the stations are still running,<br />
Table 8 summarizes the operating technical experience gained from the pilot stations running<br />
by diesel in comparison with stations running by solar in the last 26 years of work.<br />
Table 8 Technical comparison between stations running on diesel and on solar<br />
Diesel generators PV Solar generators<br />
Need special machines for installation or No need for special machines<br />
replacement<br />
Experience more theft cases, in fuel and spare parts No theft problems<br />
More communication stops due to power failure No power failure<br />
Need qualified personal for maintenance Experience no maintenance<br />
Need spare parts No spare parts ever used<br />
Stops due to fuel theft No fuel<br />
Stops due to fuel run out No need for fuel<br />
Rate of stops is 1.5 days per month per link No power failure<br />
4.2.5 Photovoltaic power systems as powers supplies<br />
The excellent performance of the pilot PV project dictate the use of PV solar energy instead<br />
of diesel generators, The outcome of the pilot project convinced The General post and<br />
Telecommunication of Libya (GPTC)to plan to use PV systems as power supply rather than<br />
diesel generators. The GPTC put a plan to change all repeater stations which running by<br />
diesel generators to PV solar generator, seventy stations of medium size (about 15 kwh/day)<br />
It was the success of the PV systems technically and economically that pushes the changing<br />
of all possible diesel stations to PV stations. The total number of stations running by PV in<br />
the field of communications is 75 stations; the increase in the number of PV stations counter<br />
a decrease of the number of stations running on diesel, Figure 30, shows the increase of PV<br />
stations and the decrease in the diesel stations in the Libyan communication Networks..<br />
403
404<br />
ENERGY AND SUSTAINABLE DEVELOPMENT IN THE MEDITERRANEAN<br />
Figure 30 No of PV and diesel stations in the communication network<br />
4.2.6 Economic comparison between source available of energy sources<br />
An economical study was conducted on using solar generators instead of diesel generators.<br />
The study was conducted between three different types of systems that can be used to<br />
supply power to the repeater stations, these are<br />
a) Diesel generators.<br />
b) General electric grid.<br />
c) Stand alone PV solar system.<br />
The study was done based on the following assumptions:<br />
The comparison period is 20 years, the lifetime of the PV solar system.<br />
Capitol and installation cost of the power system.<br />
The diesel generator lifetime has been set to seven years.<br />
The supply of energy by general grid network was considered only for stations not far<br />
more than 5 km, with one diesel generator as a backup.<br />
Running cost for diesel generators as, maintenance, fuel, distilled water, and Oil.<br />
Batteries lifetime has been set to 10 years for PV system.<br />
Batteries for startup of the diesel generators.<br />
Spare parts for diesel generators.<br />
Rectifier for diesel generator stations. Figure 31 gives the results of the economical<br />
comparison between the three types of power supplies.<br />
Figure 31 Cost comparison between diesel, grid, PV solar generators<br />
4.3 Case stud y o n pilot w ind farm project<br />
4.3.1 Introduction<br />
Although being one of the greatest oil exporting countries Libya has identified the existence<br />
of potential renewable energy resources. In year 2000 the Libyan electricity utility GECOL<br />
began seeking professional engineering experts, which would help the company to qualify<br />
the country‟s wind energy potential and build the first commercial wind farm to both generate<br />
electricity from a renewable energy source on economically reasonable terms and educate<br />
local engineers in understanding the requirements and interrelating subjects of wind farm<br />
development.
4.3.2 Project’s Objective<br />
LIBYA - National study<br />
The project‟s objective is to install a pilot wind farm with up to 25 MW nameplate capacity if<br />
at least one of the selected candidate sites proves to be an option for a technically and<br />
economically feasible wind farm operation. A technical knowledge transfer in the field of wind<br />
power technology. The project is structured into four phases:<br />
Phase 1: Preparation of Feasibility Study<br />
Preparation and survey of candidate sites<br />
Site investigation and installation of monitoring equipment<br />
Data processing and analysis of the wind and electrical measurements<br />
Evaluation of recorded climatic data<br />
Site layout and energy yield calculation for the wind farm preliminary feasibility study<br />
Documentation of all findings<br />
Phase 2: Definition of technical specifications<br />
Identification of local conditions and limitations that require consideration when compiling<br />
the specifications of the prospective wind farm site<br />
Electrical grid facilities study<br />
Identification of special needs of GECOL<br />
Definition of the appropriate technical standards<br />
Geotechnical soil analysis<br />
Analysis of the infrastructure requirements for the transport of shipped goods from the<br />
harbour to the site<br />
Definition of specifications for<br />
Foundations<br />
Access roads<br />
Electrical transmission system, incl. cables, transformers, switches etc.<br />
Wind turbines, incl. tower, blades, gearbox, computer aided remote control<br />
system, etc.<br />
Preparation of tender documents<br />
Phase 3: Tenders and Contracts<br />
Evaluation of all quotes for their compliances with the tender terms and specifications<br />
Preparation of a document comparing and summarizing the technical and economical<br />
differences of all received quotes<br />
Contract negotiations and conclusions for the purchase of goods and for engineering<br />
contractors<br />
Phase 4: Construction, Commissioning, Testing<br />
Project management, including procurement, supervision of construction and<br />
commissioning<br />
Wind farm testing prior to grid connection, performance testing and provision of all<br />
collected data<br />
Technical assistance during the first year of operation<br />
Design of a monitoring program and conduction of a research program for the<br />
performance evaluation of the wind farm operation<br />
Phase 1 – Results<br />
Phase 1 has started in late 2001 with the identification of five candidate sites for<br />
measurements and a later wind farm along Libya‟s coast line east of Tripoli. The<br />
measurements began in September 2002 using high quality measurement equipment. The<br />
sites were selected after inspections, considering accessibility and grid connection<br />
possibilities.<br />
405
406<br />
ENERGY AND SUSTAINABLE DEVELOPMENT IN THE MEDITERRANEAN<br />
During the measurement period GECOL provided data about the grid connection nodes,<br />
which were used to calculate key figures indicating the stability of the grid and its potential of<br />
integrating wind generated electricity. It was found that at all sites the capability of the grid is<br />
sufficient from a network operator‟s point of view. Though, at some sites the capacity is<br />
limited to take the wind power.<br />
A preliminary survey of soil conditions was performed at all sites using international standard<br />
techniques and procedures. Seismicity was also investigated on a source study basis and<br />
incorporated in the findings and recommendations. The report states that all sites have good<br />
to acceptable bearing capacities with no or low additional requirements on the foundations of<br />
the wind turbines.<br />
After one year of measurements all data have been processed, analyzed, corrected<br />
according to calibration figures and correlated to long term values. The values range from 6.4<br />
m/s to 8.3m/s in 50 m above ground level, meaning good to excellent wind conditions. Table<br />
9 summarizes the results of phase 1. Layouts using three different wind farm sizes (5 MW,<br />
15 MW and 25 MW) and three wind turbine sizes (< 1,000 kW, < 1,500 kW, > 1,500 kW)<br />
were created for all five candidate sites and energy yields were calculated accordingly (using<br />
the European Wind Atlas Model). An economic model was constructed, applying MS Excel.<br />
Each individual site was assessed to determine the most suitable wind farm size with the<br />
corresponding wind turbine size from<br />
Site and height above ground<br />
level [m]<br />
A [m/s]<br />
1 - Misratah<br />
2 – Sirt*<br />
3 - Al Maqrun<br />
4 - Tolmetha<br />
5 - Dernah<br />
Table 9 Summary results of phase 1<br />
Vmean in<br />
[m/s] Weibull-parameters<br />
K<br />
50<br />
m 6.8 m/s 7.6 m/s 2.35<br />
50<br />
m 6.7 m/s 7.6 m/s 2.53<br />
50<br />
m 7.4 m/s 8.4 m/s 2.42<br />
50<br />
m 6.4 m/s 7.2 m/s 1.69<br />
50<br />
m 8.3 m/s 9.3 m/s 2.67<br />
Power density in<br />
[W/m²]<br />
305 W/m 2<br />
285 W/m 2<br />
399 W/m 2<br />
365 W/m 2<br />
504 W/m 2<br />
An economical perspective taking into account an evaluation of the researched local factors<br />
such as wind resources, accessibility, subsoil conditions and the existing electricity<br />
transmission grid. The model output offers solid figures such as a variety of rates of return on<br />
investment and the corresponding wind energy production costs. These figures, which are<br />
backed up by highly scrutinized input data, give a first insight into the predicted project‟s<br />
financial returns. The conclusion of the sensitivity analysis is, that the Dernah site in Libya‟s<br />
east is most feasible from both an economical and technical point of view. It has<br />
excellent wind conditions,<br />
good accessibility<br />
Dernah has an own seaport,<br />
the second largest seaport of Libya is Benghazi 200 km west of Dernah,<br />
the coast highway crosses the site,<br />
easy terrain,<br />
good grid connection possibilities<br />
in 12 km (66 kV) for 25 MW or more or
LIBYA - National study<br />
in 30 km (220 kV) for 100 – 150 MW,<br />
manageable logistical problems<br />
crane availability for installation and repair must be secured<br />
high extension potential (100 – 150 MW)<br />
low additional foundation requirements in a homogenous soil environment.<br />
It furthermore has been found that the 25 MW wind farm size has the most economic<br />
Benefits<br />
The entire project aims to prepare and create a sustainable development of utilizing wind<br />
energy in Libya. Projects in comparable social and technically developed countries have<br />
shown that its success was less dependent on using latest technologies but on technical<br />
understanding and full commitment. The wind farm pilot project is therefore based on the<br />
strategy to both<br />
plan and build a wind farm using best engineering experience from the leading countries<br />
in wind energy utilization and<br />
at the same time educate and train local engineers on “their” project and subsequently<br />
transfer substantial know-how to them during all phases.<br />
This success promising strategy allows Libya to gather experience in planning and operating<br />
in a safe environment and further develop the potential of wind energy in Libya.<br />
A calculated net capacity factor of 35% means approximately 80.000.000 kWh for a 25 MW<br />
wind farm and a corresponding saving of 80.000 tons of CO2 emission per year. The wind<br />
farm and its potential extension can significantly contribute to Libya‟s measures to fulfil its<br />
Kyoto goals.<br />
Phase 2-3: Results<br />
Almost phase 2 and phase 3 has been completed. The tasks which were performed in there<br />
two phases are as follow:<br />
defining the technical specifications of 25 MW wind farm.<br />
preparation of the tender document -Evaluation of the received quotes.<br />
GECOL decided to give chance to many manufacture companies to revise their quotes. It is<br />
expected that the construction of 25 MW wind farm in Derna to start at the beginning of 2008.<br />
5. Summary and conclusion<br />
Libya Energy Situation:<br />
In Libya, the energy sector plays a vital role in achieving social and economic development<br />
through satisfying the energy needs of the different economic sectors, in addition to the<br />
sector‟s effective contribution, particularly the oil and gas sector, to the GDP. In spite of such<br />
vital role, the sector has several features that can affect its contribution to the achievement of<br />
sustainable development this is mainly due to unsustainable energy production and<br />
consumption patterns, particularly in the end use sectors, the sector has its adverse<br />
environmental impacts on air, water and soil resources.<br />
Libya is experiencing strong economic during last three years which made Libya one of<br />
highest per capita GDP in Africa.<br />
Oil export revenues are extremely important to the economic development of the country as<br />
they represent 90% of the total revenue.<br />
Libya has continues increasing in total primary energy supply with average annual growth of<br />
about 5 % and the oil has the largest share, while the total energy demand reached 9.1 Mte<br />
in 2003 with highest consumption in oil sector.<br />
407
408<br />
ENERGY AND SUSTAINABLE DEVELOPMENT IN THE MEDITERRANEAN<br />
The electricity is covering more than 99% of population; PV systems are used to supply<br />
electricity to about 2000 inhabitants in rural areas.<br />
The electric energy demand is expected to grow very rapidly in the next few years; water<br />
desalination plants will be the major drive for energy demand as Libya planned to install<br />
desalination plants with amount of one million meter cub per day in the next five years.<br />
The share of renewable energy technologies in Libya up to now hold only a small<br />
contribution in meeting the basic energy needs, it is used to electrify rural areas for<br />
sustainable development, supply microwave repeater station, and in cathodic protection. A<br />
setup plane was planed for implementing renewable energy sources is to contribute a 10%<br />
off the electric demand by the year 2020. The short plane for renewable energy is to invest<br />
500 million euro in the next five years.<br />
During the past three decades, photovoltaic is the most technology which has been used in<br />
rural applications, particularly for small- and medium- sized remote applications with proven<br />
economic feasibility, several constraints and barriers, including costs exist. The experience<br />
raised from PV applications indicates that there is a high potential of building a large scale of<br />
PV plants in the sought of the <strong>Mediterranean</strong>.<br />
There is a great potential for utilizing, home grid connected photovoltaic systems, large scale<br />
grid connected electricity generation using Wind farms, and solar thermal for electricity<br />
generation, with capacities of several thousands of MW. The high potential of solar energy in<br />
Libya may be considered as a future source of electricity for the northern countries of<br />
<strong>Mediterranean</strong>.<br />
Solar energy resources in particular can be of great source of energy for Libya after oil and<br />
natural gas. Renewable energy resources offer good opportunities for technology transfer<br />
and international cooperation. The modularity and decentralised nature of renewable energy<br />
technologies make them particularly well suited for rural energy development. In this aspect,<br />
use can be made of the Clean Development Mechanism (CDM) adopted by Kyoto Protocol in<br />
renewable energy applications that would reduce greenhouse gases.<br />
Libya is located in a place which can be considered as a good place for renewable energy<br />
technology and applications development. It is also has great a resources for photovoltaic<br />
basic industry and a solar cell technology which can be built with the share of international<br />
investors.<br />
The usual practice in Libya showed low efficiencies in energy production and consumption,<br />
there is a real challenge to develop an efficient energy use in most sectors, with several<br />
barriers including: lack of access to technology, capacity building, and institutional issues.<br />
Energy efficiency can be implemented in both energy consumption and production sides.<br />
Almost in all energy end-uses, sectors, the focus is on improving the efficiency of equipment<br />
that provides the services, such as heating and air conditioning equipment, appliances,<br />
lighting and motors. In contrast, supply-side energy management focuses on performancebased<br />
improvements resulting in more-efficient energy generation, improved industrial<br />
processes, co- generation and energy recovery systems. On the production side there is a<br />
great importance in increasing efficiency in large- scale energy production. Energy efficiency<br />
can help reducing cost, preserving natural resources and protecting the environment. Energy<br />
efficiency can also be enhanced through access to appropriate technology, capacity-building,<br />
and institutional issues.<br />
Libya is non annex I country under the UN FCCC, and is signatory to the Kyoto protocol, thus<br />
Libya currently is eligible to the CDM. The main emitters of CO2 in 2003 are fuel combustion<br />
in the power generation sector. Libya's energy related CO2 emissions increased by more<br />
than 78% in one decade mostly due to increased energy supply.<br />
The analysis of the present energy situation in Libya clearly indicates that there are no<br />
programs toward rational use of energy. This situation related to many factors summarized<br />
as follow:
LIBYA - National study<br />
1) Low electricity tariff specially for residential sector.<br />
2) Cheap oil prices for transportation.<br />
3) Lack of national policy toward the conservation of energy.<br />
4) Lack of specialized national institution which deal with the rational use of energy.<br />
5) Lack of detailed and deep studies related to the rational use of energy (RUE).<br />
Many studies have indicated that the country's energy demand generation could be<br />
significant reduced if improved energy utilization efficiency by the major energy sectors is<br />
achieved.<br />
What is needed to promote RE & RUE are:<br />
Promote and exerting private investment in renewable energy technology transfers and<br />
services.<br />
Increase informal education on all energy aspects as in the formal education.<br />
More attention needs to be paid to social issues related to energy.<br />
Disseminate widely an approach that could be implemented widely in all applications of<br />
RE.<br />
Need to establish partnership at local, national and international levels in order to develop<br />
policies based on evidence of the impact on people.<br />
Courage the international investment to invest in the industry.<br />
International cooperation to develop and build large scale solar energy applications as a<br />
pilot project.<br />
To develop and support, technically, financially, and institutionally, the national research<br />
and application institutions concerned with issues relevant to energy for sustainable<br />
development.<br />
To develop national energy policies and regulatory frameworks that will help to create the<br />
necessary economic, social and institutional conditions in the energy sector to improve<br />
access to reliable, affordable, economically viable socially acceptable and environmentally<br />
sound energy services for sustainable development.<br />
Developing and implementing policies and programs to change the current energy<br />
production and consumption patterns, through improving energy efficiencies in all sectors,<br />
particularly the highest energy consuming sectors, as well as promoting the use of cleaner<br />
fuels and renewable energy resources.<br />
Supporting R&D, technology transfer and industrial development of sustainable energy<br />
technologies, utilizing the available bilateral, regional, and international technical<br />
cooperation and funding mechanisms.<br />
Calling on All Libyan organizations to put more emphasis on developing and implementing<br />
educational, capacity building and public awareness programs on energy for Sustainable<br />
Development.<br />
409
6. Bibliography<br />
National Oil Company (NOC) information.<br />
410<br />
ENERGY AND SUSTAINABLE DEVELOPMENT IN THE MEDITERRANEAN<br />
Central Bank Of Libya – Economic Bulletin- First Quarter 2003 – Vol No 43.<br />
rd<br />
Energy & Life Journal , 23 issue ,June 2006.<br />
General Electric Company Of Libya , Annual Report.<br />
Bureau of Energy Data and Studies, LNEC –Libyan National Energy Information-sixth edition 2004.<br />
Dr. Abdullah Ballut, Dr. Mohamed Ekhlat "The Potential Impact Of Improved Energy. Utilization Efficiency On The<br />
Future Energy Demand In Libya Up To The Year 2020" 17th World Energy Congress, USA, 1998.
7. List of illustrations<br />
LIBYA - National study<br />
Figure 1 Total Revenue as percentage of GDP ............................................................................................................................ 381<br />
Figure 2 Share of oil and gas in TPES ......................................................................................................................................... 382<br />
Figure 3 GDP & TPES From 1986 To 2005 ................................................................................................................................. 382<br />
Figure 4 The energy demand in oil sector ................................................................................................................................... 382<br />
Figure 5 Forecasted energy demand .......................................................................................................................................... 383<br />
Figure 6 The Growth Of Peak Load ............................................................................................................................................. 383<br />
Figure 7 Locations Of The Electrical Power <strong>Plan</strong>ts ....................................................................................................................... 384<br />
Figure 8 Total number of customers in Electric System ............................................................................................................... 384<br />
Figure 9 CO2 Emission by sectors............................................................................................................................................... 385<br />
Figure 10 CO2 emissions over the period 1980 to 2003 ............................................................................................................. 385<br />
Figure 11 Energy intensity (Total &Per Sectors) .......................................................................................................................... 386<br />
Figure 12 The average monthly daily global radiation on the horizontal surface ........................................................................... 387<br />
Figure 13 The average global radiation on the horizontal plane .................................................................................................. 387<br />
Figure 14 Wind potential for the Libyan coast area ..................................................................................................................... 387<br />
Figure 15 Electricity consumption in Libya and supply resources ................................................................................................ 388<br />
Figure 16 The accumulated installed PV peak power 1980-2006 ............................................................................................... 389<br />
Figure 17 The accumulated installed PV peak power in the period 1983-2006 ........................................................................... 389<br />
Figure 18 Wade Marsite PV Central <strong>Plan</strong>t ................................................................................................................................... 390<br />
Figure 19 PV isolated system in Emrier-Gabes ........................................................................................................................... 391<br />
Figure 20 Location Of PV Systems (GECOL) ................................................................................................................................ 391<br />
Figure 21 PV Water Pumping Beer Jufar ..................................................................................................................................... 392<br />
Figure 22 PV Water Pumping Beer Tssawa ................................................................................................................................. 392<br />
Figure 23 Wind potential for the Libyan coast area ..................................................................................................................... 393<br />
Figure 24 Cost Different Option ................................................................................................................................................. 398<br />
Figure 25 System with potential energy more than 5.6 Kwh/D .................................................................................................... 398<br />
Figure 26 System With Array Output Energy More Than 4 KWh/D ................................................................................................ 399<br />
Figure 27 Systems with load energy more than 3.6 KWh/d ......................................................................................................... 399<br />
Figure 28 Systems with usage factor more than 70% ................................................................................................................. 400<br />
Figure 29 Systems with global eff. More than 55% ..................................................................................................................... 400<br />
Figure 30 No of PV and diesel stations in the communication network ........................................................................................ 404<br />
Figure 31 Cost comparison between diesel, grid, PV solar generators ......................................................................................... 404<br />
Table 1 Renewable energy sources for Libya .............................................................................................................................. 388<br />
Table 2 Total installed PV capacity in Libya by the year 2006 ...................................................................................................... 392<br />
Table 3 Proposed plan for the next five years (2006-2010)......................................................................................................... 394<br />
Table 4 Proposed plan (2010-2020). ........................................................................................................................................ 394<br />
Table 5 Load estimation for an average house ........................................................................................................................... 397<br />
Table 6 Load estimation for an average hut ................................................................................................................................ 397<br />
Table 7 Obstacle facing the wide spread of PV technology in the developing countries. ............................................................... 402<br />
Table 8 Technical comparison between stations running on diesel and on solar .......................................................................... 403<br />
Table 9 Summary results of phase 1 .......................................................................................................................................... 406<br />
411
MALTA<br />
Mr George CASSAR & Mr Anthony Sammut, Malta Resources Authority<br />
TABLE OF CONTENTS<br />
I. Summary ........................................................................................................................ 415<br />
1. Challenges and energy sustainability.................................................................................................... 415<br />
2. Indicators ................................................................................................................................................... 415<br />
3. The currently established policies in terms of RE and URE ............................................................... 416<br />
4. Difficulties, possible solutions, needed reforms ................................................................................. 416<br />
5. Success story............................................................................................................................................. 416<br />
II. Résumé ......................................................................................................................... 419<br />
1. Défis et durabilité énergétique............................................................................................................... 419<br />
2. Indicateurs ................................................................................................................................................. 419<br />
3. Les Politiques établies actuellement en termes d'ER et d'URE ........................................................ 420<br />
4. Difficultés, solutions possibles et réformes nécessaires ................................................................... 420<br />
5. Success stories ......................................................................................................................................... 420<br />
III. National study .............................................................................................................. 423<br />
1. The energy situation in Malta ................................................................................................................. 423<br />
2. Rational energy use (RUE) and renewable energies (RE): policies, tools, progress,<br />
resulting effects, case studies .................................................................................................................... 436<br />
3. Proposals for more sustainable energy development ........................................................................ 454<br />
4. Annexes ...................................................................................................................................................... 456<br />
5. Bibliography............................................................................................................................................... 462<br />
6. Table of illustrations ................................................................................................................................ 464
I. SUMMARY<br />
MALTA - Summary<br />
1. Challenges and energy sustainability<br />
Malta is practically totally dependent upon imported fossil fuels for its energy needs.<br />
Currently over 63% of the primary energy is used for power generation. The remaining oil<br />
consumption is mainly used for transportation (85%) and only a minor share is used for other<br />
purposes (15%). Heavy fuel oil and light distillate are used for power generation. Transport<br />
fuel consists of petroleum products and a small percentage of biodiesel (0.52%) (1.5 million<br />
litres of biodiesel).<br />
Consumption of electrical energy has been increasing steadily over the years and this is due<br />
to various factors including economic growth and higher living standards. The average<br />
annual increase in electricity generation between 1981–1990 was 11 % and between 1991–<br />
2000 it was around 5.5%. The active power maximum demand in summer has over the past<br />
few years surpassed the winter maximum demand in terms of magnitude, indicating<br />
increases in air conditioning demand.<br />
Malta ratified the United Nations Framework Convention on Climate Change (UNFCCC) as a<br />
non-Annex I party on 17th March 1994, and on the same basis, subsequently ratified the<br />
Kyoto Protocol on 11th November 2001. Malta is a non-Annex I party to the Kyoto Protocol. It<br />
is also excluded from the list of EU Member States forming part of the burden-sharing<br />
agreement under Council Decision 2002/358/EC concerning the approval, on behalf of the<br />
European Community, of the Kyoto Protocol to the UNFCCC and the joint fulfilment of<br />
commitments.<br />
Though currently Malta does not have any quantified mandatory targets for the limitation or<br />
reduction of greenhouse gas emissions, it is however obliged to comply to various EU<br />
Directives including the Emission Trading Directive as well as other various EU Directives on<br />
emission limitations, air and fuel quality.<br />
2. Indicators<br />
Detailed studies on the potential of renewable energy sources in Malta have since been<br />
carried out and taking into account various aspects. These studies indicate that for Malta,<br />
wind, solar photovoltaic (PV), biomass wastes, landfill gases and sewage treatment plant gas<br />
offer some potential for exploitation. On the other hand tidal flow, geothermal, hydropower,<br />
biomass energy crops and wave do not appear to offer significant opportunities for<br />
exploitation on a commercial scale.<br />
Malta‟s production of biofuels from waste cooking oil has been very successful. This has led<br />
to very positive developments in relation to EU Directive 2003/30/EC on the promotion of the<br />
use of biofuels or other renewable fuels for transport which requires Member States to set<br />
national indicative targets based upon reference vales of 2% for 2005 and 5.75 % for 2010.<br />
The “unconstrained” PV resource potential in Malta is enormous given the geographical<br />
location and relatively high incident solar radiation particularly when compared to other<br />
European countries. The main constraint relating to PV is the high costs of PV at present.<br />
The potential of electricity from the treatment of municipal solid waste has been assessed by<br />
Government. Malta is in the process of constructing mechanical biological treatment plants to<br />
treat municipal solid waste. The total potential electricity generated from treatment of this<br />
municipal waste is estimated at around 25 GWh/annum.<br />
With regards to offshore wind energy, the bathymetry of Maltese waters imposes severe<br />
difficulties and limitations on wind farm development, since the 25 meter contour extends to<br />
just around 2 to 3 km off the coast. Government has just issued a call for expressions of<br />
interest for development of deepwater offshore wind farms, and the feedback is being<br />
analysed. Concerns on the impacts associated with large scale on-land wind farms in a small<br />
country and particularly the intrusive visual impact in a landscape such as Malta‟s, have been<br />
415
416<br />
ENERGY AND SUSTAINABLE DEVELOPMENT IN THE MEDITERRANEAN<br />
expressed. Government has therefore concluded that authorization of windfarms on land is<br />
inappropriate at present.<br />
Rational energy use provides a feasible potential for greater saving. With effect from 2008<br />
and in line with EU Directive 2006/32/EC, Malta is obliged to set an energy efficiency target<br />
by 1% per year and has to report to the European Commission by mid 2007 through an<br />
Energy Efficiency <strong>Action</strong> <strong>Plan</strong>.<br />
3. The currently established policies in terms of RE and URE<br />
Sustainable energy use is the prime objective of any energy policy. As reported earlier the<br />
Government of Malta in 2005 highlighted its intention to evaluate the implications of Malta‟s<br />
dependency on fossil fuels and adopt such necessary measures in order to reduce this<br />
dependency. Government has embarked on a series of measures to address this situation<br />
including:<br />
carrying out feasibility studies on the purchase of electricity through the European grid as<br />
well as through the installation of a pipeline or gas storage plant in order to introduce gas<br />
as another source for the generation of electricity;<br />
greater use of alternative sources of energy;<br />
raising public awareness on energy efficiency and alternative energy sources;<br />
Specific measures to promote RUE and use of RES that have been undertaken include:<br />
educational Campaign on Sustainable Energy Use;<br />
promotion of Combined Heat and Power and RES;<br />
legislative measures to improve Energy Performance in Buildings;<br />
financial Instruments to promote take up of RES and use of efficient appliances.<br />
4. Difficulties, possible solutions, needed reforms<br />
The National Commission for Sustainable Development (NCSD) was established by the<br />
Environment Protection Act. Its functions include identification of relevant processes or<br />
policies which may be undermining sustainable development and propose alternative<br />
processes or policies to the Government for adoption and preparation of a National Strategy<br />
for Sustainable Development.<br />
The NCSD has since 2002 been involved in proposing and drafting a National Strategy for<br />
Sustainable Development. The sustainable development strategy proposes 20 priority areas<br />
for Malta, as they were considered to be warranting foremost attention for the attainment of<br />
sustainable development goals in Malta. In particular, the NCSD is recommending action in<br />
the climate change and air quality priority areas.<br />
5. Success story<br />
Water in the Maltese islands is a scarce resource and with high population density, small<br />
surface area and high percentage of urban development as well as a semi-arid climate,<br />
pressures on existing water resources are intense. Water to meet the needs of the<br />
population is obtained from two main sources: groundwater and desalination. Desalination<br />
facilities were introduced in the 1980s in response to water scarcities arising from increasing<br />
demand and insufficient natural supplies. Today desalination contributes to around 50% of<br />
the potable water supply in Malta.<br />
Various projects have also been undertaken by the Water Services Corporation to improve<br />
the energy efficiency of the RO plants. Modern energy recovery technology was incorporated<br />
in existing plants as follows:<br />
Pelton wheels were installed on 6 trains employing reverse running pumps at Pembroke<br />
Phase II. This consisted in a simple replacement of the latter equipment. This project
MALTA - Summary<br />
contributed to a reduction in the specific energy consumption from 4.5 kWh/m3 to 3.6<br />
kWh/m 3 .<br />
Pressure exchangers as incorporated in Lapsi R.O. <strong>Plan</strong>t. This required a complete reengineering<br />
of the equipment including replacement of the high pressure pump and two<br />
trains of previous rating were incorporated in the process. The specific energy<br />
consumption was reduced from 4.8 kWh/m 3 to 3.2 kWh/m 3 through this project.<br />
This has contributed to an annual electricity savings of approximately 13 million kWh (Water<br />
Services Corporation, 2006).<br />
417
II. RÉSUMÉ<br />
1. Défis et durabilité énergétique<br />
MALTA - Résumé<br />
Pour ses besoins énergétiques, Malte est pratiquement totalement dépendante des énergies<br />
fossiles importées. Actuellement, plus de 63 % de l'énergie primaire est utilisée pour la<br />
production d‟électricité. Le reste de la consommation de pétrole est surtout utilisé pour le<br />
transport (85 %) et seule une petite partie est utilisée à d'autres fins (15%). Les fuels lourds<br />
et les distillats légers sont utilisés pour produire de l'énergie. Les carburants pour les<br />
transports sont fabriqués à partir de produits pétroliers et un petit pourcentage de biodiesel<br />
(0,52%) (1,5 millions de litres de biodiesel).<br />
La consommation d'énergie électrique a augmenté régulièrement ces dernières années et<br />
cela est dû à divers facteurs incluant la croissance économique et des niveaux de vie plus<br />
élevés. L'augmentation moyenne annuelle de la production électrique entre 1981 et 1990<br />
était de 11 % et entre 1991 et 2000, elle a été de 5,5 %. La demande maximum en énergie<br />
en été a, ces quelques dernières années, surpassé la demande maximum hivernale en<br />
terme de magnitude, montrant une augmentation de la demande en climatisation.<br />
Malte a ratifié la Convention-Cadre des Nations Unies sur le Changement Climatique<br />
(CCNUCC) en tant que partie non-Annexe I, le 17 Mars 1994 et, sur la même base, a<br />
ensuite ratifié le Protocole de Kyoto le 11 novembre 2001. Malte appartient à une partie non-<br />
Annexe I du Protocole de Kyoto. Elle est également exclue de la liste des États Membres se<br />
partageant le poids de l'accord selon la Décision du Conseil 2002/358/EC qui concerne<br />
l'approbation – de la part de la Communauté Européenne – du Protocole de Kyoto auprès de<br />
l'UNFCCC et de la réalisation commune des engagements.<br />
Bien qu'actuellement Malte n'ait pas d‟objectif obligatoire quantifié en ce qui concerne la<br />
limitation ou la réduction des émissions de gaz à effet de serre, elle est cependant obligée<br />
de se plier aux différentes directives de l'UE, dont la Directive sur les Échanges de Droits<br />
d'Émission ainsi que d'autres Directives de la CE sur les limitations des émissions, la qualité<br />
de l'air et des carburants.<br />
2. Indicateurs<br />
Des études détaillées sur le potentiel des sources d'énergies renouvelables à Malte ont<br />
depuis été menées. Elles tiennent compte de ces divers aspects. Ces études montrent que<br />
pour Malte, le vent et le photovoltaïque solaire (PV), les déchets de biomasses, les gaz de<br />
décharges et les gaz des usines de traitement des eaux usées offrent quelques possibilités<br />
pour l'exploitation. D'un autre côté, le flux des marées, la géothermie, l'hydro énergie, les<br />
récoltes à des fins d'énergie par la biomasse ne semblent pas offrir de véritables possibilités<br />
d'exploitation à l'échelle commerciale.<br />
La production de biocarburants de Malte à partir des huiles de cuisson usées est très<br />
réussie. Cela a conduit à des développements très positifs en relation avec la Directive de<br />
l'UE 2003/30/CE sur la promotion de l'utilisation des biocarburants ou autres carburants<br />
renouvelables pour le transport, ce qui oblige les États Membres à fixer des buts nationaux<br />
basés sur les valeurs de 2 % en 2005 et de 5.75 % pour 2010.<br />
Le potentiel de ressources, non obligatoire, en PV à Malte est énorme étant donné la<br />
localisation géographique et l'incidence de la radiation solaire relativement haute<br />
particulièrement lorsqu'on le compare à d'autres pays européens. La seule contrainte liée au<br />
PV est le coût élevé du PV à l'heure actuelle.<br />
Le potentiel d'électricité provenant des déchets solides municipaux a été estimé par le<br />
gouvernement. Le potentiel électrique total produit par le traitement de ces déchets<br />
municipaux est estimé à environ 25 GWh/an.<br />
En ce qui concerne l'énergie éolienne maritime, la bathymétrie des eaux maltaises impose<br />
de sévères limitations et pose des difficultés au développement de l'énergie éolienne, étant<br />
donné que les 25 mètres de contour s'étendent jusqu‟à environ 2 ou 3 km de la côte. Le<br />
419
420<br />
ENERGY AND SUSTAINABLE DEVELOPMENT IN THE MEDITERRANEAN<br />
Gouvernement vient d'appeler à exprimer s'il y a un intérêt à développer des fermes<br />
éoliennes en haute mer et le retour est en cours d'analyse. Des préoccupations sur les<br />
conséquences liées aux fermes éoliennes terrestres dans un petit pays et particulièrement à<br />
l'impact de l'aspect visuel intrusif dans un paysage tel que celui de Malte ont été exprimées.<br />
Le Gouvernement a donc conclu qu'une autorisation de ferme éolienne terrestre est<br />
inappropriée pour le moment.<br />
L'utilisation rationnelle de l'énergie fournit un potentiel pour des économies plus importantes.<br />
A partir de 2008 et à la suite de la Directive de l'UE 2006/32/EC, Malte est obligée de fixer<br />
une cible concernant l'efficacité énergétique de 1 % par an et doit en référer à la Commission<br />
Européenne vers le milieu de 2007 par un <strong>Plan</strong> d'<strong>Action</strong> pour l'Efficience Energétique.<br />
3. Les Politiques établies actuellement en termes d'ER et d'URE<br />
L'utilisation de l'énergie durable est le premier objectif de toute politique énergétique.<br />
Comme rapporté ci-dessus, en 2005, le Gouvernement de Malte a mis en avant son<br />
intention d'évaluer les implications de la dépendance de Malte des énergies fossiles et<br />
d'adopter les mesures nécessaires afin de réduire cette dépendance. Le Gouvernement a<br />
entrepris trois séries de mesures pour faire face à cette situation ; elles incluent :<br />
mener des études de faisabilité pour l'achat d'électricité à travers la grille européenne<br />
ainsi par l'installation d'un pipeline ou d'une station de stockage de gaz afin d'introduire le<br />
gaz comme source d'énergie pour la production d'électricité ;<br />
une plus grande utilisation de sources d'énergie alternatives ;<br />
accroître la sensibilité du public à l'efficacité énergétique et aux sources d'énergie<br />
alternatives.<br />
Les mesures spécifiques pour promouvoir l'URE et l'utilisation des ER qui ont été<br />
entreprises incluent :<br />
une Campagne d'Education sur l'Utilisation d'Energie Durable ;<br />
la promotion des co-générateurs chaleur et énergie ainsi que les ER ;<br />
des mesures législatives pour améliorer la Performance énergétique dans le Bâtiment ;<br />
des outils financiers pour promouvoir l'adoption des ER et l'utilisation d'appareils<br />
efficaces.<br />
4. Difficultés, solutions possibles et réformes nécessaires<br />
La Commission Nationale pour le Développement Durable (CNDD) a été créée par la Loi de<br />
Protection de l'Environnement. Ses fonctions incluent l'identification des processus<br />
nécessaires ou les politiques qui peuvent miner le développement durable et de proposer au<br />
Gouvernement des processus ou politiques alternatifs afin d'adopter et de préparer une<br />
Stratégie Nationale pour le Développement Durable.<br />
Le NCSD a participé depuis 2002 aux propositions et aux esquisses d'une Stratégie<br />
Nationale pour le Développement Durable. La stratégie de développement durable propose<br />
20 domaines prioritaires pour Malte, domaines qui sont considérées comme garantissant la<br />
plus grande attention aux objectifs du développement durable à Malte. En particulier, le<br />
NCSD recommande de prendre des mesures en faveur les domaines prioritaires que sont le<br />
changement climatique et la qualité de l'air.<br />
5. Success stories<br />
Dans les îles maltaises, l'eau est une ressource rare ; or, avec une haute densité de<br />
population, de petites surfaces et un haut pourcentage de développement urbain, ainsi qu'un<br />
climat semi-aride, la pression sur les ressources en eau existantes est très forte. Pour faire<br />
face aux besoins de la population, l'eau est obtenue de deux façons : les sources et le<br />
dessalement. Les installations de dessalement ont été introduites dans les années 80 en<br />
réponse à un manque d'eau provenant d'une demande croissante et d'une insuffisance d'eau
MALTA - Résumé<br />
naturelle. Aujourd'hui, le dessalement contribue jusqu'à 50 % à la fourniture en eau potable<br />
de Malte.<br />
Divers projets ont aussi été entrepris par la Corporation des Services des Eaux pour<br />
améliorer l'efficacité énergétique des usines d'O.I. (Osmose Inverse). Une technologie<br />
moderne de récupération de l'énergie a été incorporée aux usines existantes comme suit :<br />
des roues Pelton ont été installées sur 6 trains utilisant des pompes pour osmose inverse<br />
à Phase Pembroke II. Cela a consisté en un simple remplacement d'un équipement plus<br />
ancien. Ce projet a contribué à une réduction de la consommation d'énergie de 4,5 kWh/<br />
m 3 à 3,6 kWh/ m 3 .<br />
Des échangeurs de pression comme ceux incorporés dans l'installation d'O.I. De Lapsi.<br />
Cela a nécessité un changement complet de l'équipement ainsi qu'un remplacement de la<br />
pompe à haute pression et deux trains anciens ont été incorporés dans le processus. La<br />
consommation énergétique spécifique a été réduite de 4,5 kWh/ m 3 à 3,2 kWh/m 3 grâce à<br />
ce projet.<br />
Cela a participé à une économie annuelle en électricité d'environ 13 millions de kWh<br />
(Corporation des Services des Eaux, 2006).<br />
421
III. NATIONAL STUDY<br />
1. The energy situation in Malta<br />
MALTA - National study<br />
1.1 Share of t he energy s ecto r and ins ti t utions<br />
The Maltese archipelago consists of Malta, Gozo and Comino and a number of uninhabited<br />
islets. The total area is 316 km 2<br />
and the population is approximately 400,000. Between 1931<br />
and 2005 the population density increased from 764 to 1,282 inhabitants/km 2<br />
. Malta has one<br />
of the highest population densities in the world and this is almost 11 times the EU25 average.<br />
The average population growth rate between 1995-2005 was 0.7% / annum.<br />
The economy of Malta is highly dependant upon the tourism and manufacturing industries.<br />
The manufacturing industry is characterised by a significant proportion of micro enterprises<br />
consisting around 94 % of the total number of firms in these two sectors. There are also a<br />
number of relatively large foreign owned subsidiaries of multinational companies operating<br />
and these are mostly export driven. Tourism also contributes significantly to Malta‟s<br />
economic growth, employment creation and foreign exchange earnings.<br />
1.1.1 Sector’s Economic Weight<br />
Malta is practically totally dependent upon imported fossil fuels for its energy needs. Malta<br />
has no refineries. Malta also has no natural gas, gas network or interconnections. Coal for<br />
electricity generation used to be imported until the 1990s but this was stopped for<br />
environmental reasons.<br />
The State of the Environment report notes that in 2003 over 63% of the primary energy is<br />
used for power generation. The remaining oil consumption is mainly used for transportation<br />
(85%) and only a minor share is used for other purposes (15%). Heavy fuel oil and light<br />
distillate are used for power generation. Transport fuel consists of petroleum products and a<br />
small percentage of biodiesel (0.52%) (1.5 million litres of biodiesel).<br />
Consumption of electrical energy has been increasing steadily over the years and this is due<br />
to various factors including economic growth and higher living standards. The electricity<br />
demand has increased from 284 GWh in 1970, 550 GWh in 1980, 1,186 GWh in 1990 to<br />
1,603 GWh in 1995 to 2,263 GWh in 2005. Between 1970–1980 the average annual<br />
increase in electricity generation was 8.8 %. The average annual increase in electricity<br />
generation between 1981–1990 was 12 % and between 1991 – 2000 it was around 6.1%.<br />
The active power maximum demand in summer has over the past few years surpassed the<br />
winter maximum demand in terms of magnitude.<br />
Figure 1 Power Generation 1970- 2006<br />
423
424<br />
ENERGY AND SUSTAINABLE DEVELOPMENT IN THE MEDITERRANEAN<br />
The State of the Environment Report for 2005 notes that Malta‟s total energy generated per<br />
unit GDP (at constant prices) has risen sharply, particularly since 2002, after declining during<br />
the 1990s. It is argued that the major contributing factors to this change in direction was<br />
related to the sharp rise in energy generation since the hot summer of 2002 as compared to<br />
the rate of GDP growth, which has been slower. The Report notes that there is an urgent<br />
need to decouple economic growth from energy consumption and to limit CO2 emissions<br />
from power plants (Malta Environment and <strong>Plan</strong>ning Authority, 2006).<br />
The Economic Survey October 2005 (Ministry of Finance, 2006) outlines the main<br />
developments of employment in direct production and an overview is given in Table 1. The<br />
private sector accounts for the vast majority of jobs in total direct production. However in the<br />
energy, gas and water sector practically all jobs in direct production are with the public<br />
sector. These sectors contribute to around 6-8% of the total jobs in direct production.<br />
Table 1 Employment in Direct Production<br />
Electricity, Gas and Total employment in % share of employment in<br />
Water<br />
direct production<br />
direct production<br />
Private Public Total Private Public Total % of % of % of<br />
Private Public Total<br />
2002 2 3133 3135 35137 11249 46386 0.01% 27.85% 6.76%<br />
2003 1 3059 3060 34257 10961 45218 0.00% 27.91% 6.77%<br />
2004 1 3557 3558 33206 9828 43034 0.00% 36.19% 8.27%<br />
2005 1 3405 3406 33063 9555 42618 0.00% 35.64% 7.99%<br />
2006 5 3254 3259 32639 9666 42305 0.02% 33.66% 7.70%<br />
Excludes temporary employees<br />
Source: Ministry of Finance, 2006<br />
1.1.2 Main Institutions<br />
The main institutions in the energy sector in Malta are:<br />
1) Enemalta Corporation which was established by virtue of the Enemalta Act (Cap. 272) of<br />
1977, with responsibility for generation, transmission and distribution of electricity and for<br />
the importation, storage and distribution of petroleum products. Enemalta Corporation<br />
falls under the responsibility of the Ministry for Investment Industry and Information<br />
Technology.<br />
2) Malta Resources Authority (MRA) which was set up in accordance with the Malta<br />
Resources Authority Act, 2000 (Cap. 423, Act XXV of 2000) as the regulator for energy,<br />
water and minerals resources. The Malta Resources Authority falls under the<br />
responsibility of the Ministry for Resources and Infrastructure. The functions of the<br />
Authority are shown in Annex 1 – A1.1.<br />
3) Malta Environment and <strong>Plan</strong>ning Authority which is the competent authority for the<br />
purposes of the Environment Protection Act 2001, to carry out the functions of the<br />
Competent Authority under this Act. The Malta Environment and <strong>Plan</strong>ning Authority falls<br />
under the responsibility of the Ministry for Rural Affairs and the Environment.<br />
4) Malta Transport Authority as the competent authority responsible for road transport<br />
regulation, management, safety and control. The Malta Transport Authority falls under<br />
the responsibility of the Ministry for Urban Development and Roads.<br />
5) Malta Standards Authority as the entity entrusted with the coordination of standardization<br />
and related activities. The Malta Standards Authority falls under the responsibility of the<br />
Ministry for Competitiveness and Communications.<br />
1.1.3 National Energy Resources and Potential Savings<br />
Fossil Fuels<br />
Malta has no indigenous supplies of fossil fuels. Petroleum exploration in Malta has been<br />
undertaken since 1954 and an onshore well was drilled in 1958. Various other exploratory<br />
wells have been drilled both onshore and offshore. The offshore area has been parcelled into<br />
blocks and this has been made available to the oil industry for exploration. The area is made
MALTA - National study<br />
up of different sedimentary domains some of which produce petroleum in neighbouring<br />
countries (Sicily and Libya). (Ministry for Resources and Infrastructure, 2007).<br />
No commercial discoveries however have been made to date although some wells have<br />
tested good oil shows. Various offshore licences have also been awarded the possibility of<br />
making a commercial discovery in the future is realistically good.<br />
Renewable Energy Sources in Malta – Potential and Savings<br />
The Treaty of Accession of Malta to the EU set a target of 5% of the total electricity<br />
generated in 2010. Detailed studies on the potential of renewable energy sources in Malta<br />
have since been carried out and taking into account various aspects. This included resource<br />
characterisation, analysis of environmental and land use impacts from large, medium and<br />
micro-generation, feasible penetration rates and realistic support measures that may sustain<br />
such penetration rates as well as technical issues including impacts on system grid stability<br />
in a small isolated electricity system associated with large scale wind development.<br />
These studies have highlighted both the overall country‟s potential as well as realistically<br />
achievable figures of penetration of renewable energy sources in the energy mix of the<br />
country. These studies indicate that for Malta, wind, solar photovoltaic (PV), biomass wastes,<br />
landfill gases and sewage treatment plant gas offer some potential for exploitation. On the<br />
other hand tidal flow, geothermal, hydropower, biomass energy crops and wave do not<br />
appear to offer significant opportunities for exploitation on a commercial scale.<br />
In a report to the EU Commission on the implementation of EU Directive 2001/77/EC on the<br />
Promotion of Electricity from Renewable Energy Sources, Malta noted that given existing<br />
constraints a realistic figure for the national indicative target for electricity generated from<br />
renewable energy sources by 2010 should be around 1.37 % with the construction of a large<br />
scale wind farm while this would be reduced to 0.31% if the construction of a large scale<br />
wind farm is excluded (Ministry for Resources and Infrastructure, 2005).<br />
Onshore Wind Power<br />
To assess the onshore wind power generation potential in Malta, a comprehensive sitespecific<br />
analysis was undertaken by Mott Macdonald (2005) on behalf of Government. The<br />
unconstrained potential of wind energy in Malta was analysed and estimated at 230 MW.<br />
Subsequently the „constrained‟ potential taking into account various barriers was evaluated.<br />
It has been noted that the constraints to the wind potential at these sites vary and include<br />
lack of access, airport interference analysis, ecology and landscape Impacts. Furthermore<br />
due to electricity system stability and until connection to European grid, wind capacity is<br />
estimated to be limited to 40 MW.<br />
Malta has a very small and limited land area (316 km2) and a high population density (1,282<br />
inhabitants/km 2 ). Malta also has an open landscape with little tree cover affording long distance<br />
uninterrupted views and the high visibility and natural light intensity during practically the whole year.<br />
In view of these characteristics and scale of development – visual impacts can be significant and likely<br />
to limit number of windfarms.<br />
In view of these factors, the Government of Malta has expressed concern on the impacts<br />
associated with large scale wind farms in a small country and particularly the intrusive visual<br />
impact in a landscape such as Malta‟s leading to deterioration in the overall quality of life of<br />
citizens and tourists. Government has therefore concluded that authorization of windfarms on<br />
land is inappropriate.<br />
A complementary analysis was carried out by the Malta Resources Authority as part of the<br />
response to an assessment carried out by the European Environment Agency on<br />
„Environmentally-compatible wind energy potential‟ the constraints to wind energy use in<br />
Malta were reviewed and mapped. Areas of zero potential were identified and include<br />
surface water bodies, infrastructures (roads), tourist sites, military areas, woodland/ forests,<br />
water bodies, Natura 2000 sites and important bird areas. In addition other areas posing high<br />
constraints were considered to include the airport plus a 4km buffer as well as urban areas<br />
plus a 2km buffer.<br />
425
426<br />
ENERGY AND SUSTAINABLE DEVELOPMENT IN THE MEDITERRANEAN<br />
Figure 2 Environmentally compatible wind energy potential<br />
Source: Malta Resources Authority<br />
Offshore Wind Power<br />
Similar site specific analysis were undertaken to assess the offshore wind power generation<br />
potential (Mott MacDonald, 2005; Malta Resources Authority, 2005). The bathymetry of<br />
Maltese waters imposes severe difficulties and limitations on wind farm development, since<br />
the 25 meter contour extends to just around 2 to 3 km off the coast. The main constraints to<br />
offshore wind farm development at these sites include the heavy and conflicting use of the<br />
waters where a significant proportion of the economy depends on marine activities and<br />
tourism.<br />
Further assessments were also carried out on deepwater sites. Although yet commercially<br />
unproven, it is considered that such sites may have potential particularly in view of reduced<br />
environmental and visual impacts as well as reduced conflicts with other maritime activities.<br />
Solar Energy<br />
The “unconstrained” PV resource potential in Malta is enormous given the geographical<br />
location and relatively high incident solar radiation particularly when compared to other<br />
European countries. The annual mean of daily global irradiation on an inclined south facing<br />
solar panel has been estimated at 5.491 kWh/m²/day. The PV potential of a 1kWp PV system<br />
for horizontal surface in built-up areas has been estimated at around 1360 kWh/annum (Suri<br />
et al., 2004).<br />
The “unconstrained” PV electrical potential has also been estimated based upon maximum<br />
roof space available and this is extremely high at 1,724 GWh/annum by 2020. However<br />
exploitation of this resource requires significant financial support due to the high capital costs<br />
of PV systems. This is considered to be the main barrier to market uptake of solar<br />
photovoltaic installations in Malta.<br />
The realistically realisable potential is however also constrained by other factors including<br />
visual impacts on the urban landscape and of reflective glare particularly in areas protected<br />
by cultural and historical designations, changing shadow patterns with increasing upward<br />
extensions of building stock and shared ownership of rooftop space (Mott MacDonald, 2005).<br />
Given these constraints, particularly the high financial support requirements and based upon
MALTA - National study<br />
feasible penetration rates set using other countries as a reference, the realistic target for PV<br />
potential to 2010 has been estimated at 1.45 GWh/annum by 2010. (Ministry for Resources<br />
and Infrastructure, 2005a).<br />
Solid Waste Treatment<br />
The potential of electricity from the treatment of municipal solid waste has been assessed by<br />
Government. Malta is in the process of constructing mechanical biological treatment plants to<br />
treat municipal solid waste. The total potential of electricity generated from treatment of<br />
municipal at the MBTs is estimated at around 25 GWh/annum. Further studies have also<br />
been carried out on the potential of treating refuse derived fuel (RDF) produced from the<br />
mechanical biological treatment plants. It has been estimated that the total electricity<br />
potential generated from treatment of RDF may be around 36 GWh/annum. This plant is not<br />
expected to be constructed before 2010.<br />
Sewage and Animal Waste Treatment<br />
In a report to Government on agricultural waste management, Sustech Consulting et al.<br />
2005, recommend that digestion of cattle, poultry and rabbit manure may be carried out in 3-<br />
4 centralised anaerobic digestion (CAD) plants for the stabilisation of the manure and the<br />
production of electricity from biogas. It has been suggested that the plants would provide 24<br />
GWh of electricity every year. No decision on the construction of these plants has been taken<br />
and therefore are not expected to be implemented before 2010.<br />
Work is currently also underway in Malta to develop the sewage treatment infrastructure with<br />
the construction of 3 new sewage treatment plants (one in Gozo and two in Malta). The<br />
largest plant in the South will have an anticipated treatment capacity of 438,000 p.e. and will<br />
be equipped with anaerobic sludge digestion facilities. Preliminary estimates indicate that the<br />
energy recovery may be approximately 6.72 GWh/annum which is equivalent to 0.24% of the<br />
electricity consumption in 2010.<br />
Biofuels<br />
EU Directive 2003/30/EC on the promotion of the use of biofuels or other renewable fuels for<br />
transport requires Member States to set national indicative targets based upon reference<br />
vales of 2% for 2005 and 5.75 % for 2010.<br />
Malta‟s potential for growing crops for producing biofuels is negligible due to the limited land<br />
availability, high population density, poor soil fertility and limited freshwater resources and<br />
where 50% of potable water is supplied from desalination. Given the lack of agricultural<br />
residues due to the reasons listed above, industrial and domestic waste is the only<br />
substantial source of biomass and, therefore, the only substantial source of producing<br />
biofuels.<br />
With these constraints, Malta‟s production of biofuels from waste cooking oil has been very<br />
successful.<br />
1.1.4 Rational Use of Energy<br />
Rational energy use provides a feasible potential for greater saving. With effect from 2008<br />
and in line with EU Directive 2006/32/EC, Malta is obliged to set an energy efficiency target<br />
by 1% per year and has to report to the European Commission by mid 2007 through an<br />
Energy Efficiency <strong>Action</strong> <strong>Plan</strong>.<br />
Distribution losses and unaccounted for electricity in 2004/05 is estimated at around 365<br />
MWh/annum. This is equivalent to around 16% of the electricity generated during the period.<br />
1.1.5 Energy Policies<br />
The Government of Malta has developed its draft energy policy for the Maltese Islands. A<br />
document on this Energy Policy was published for public consultation in June 2006.The<br />
policy is based upon three objectives all pursued in a balanced way to move towards a<br />
sustainable energy supply. These objectives are:<br />
security of supply,<br />
427
428<br />
ENERGY AND SUSTAINABLE DEVELOPMENT IN THE MEDITERRANEAN<br />
environmental protection,<br />
the social dimension, affordability and competitiveness.<br />
This draft policy also includes a series of measures and actions designed to reach the<br />
various objectives, as well as the entity responsible to co-ordinate the various actions.<br />
Following the publication of its draft Energy Policy, the Government of Malta also published a<br />
draft Renewable Energy Policy in August 2006 (Government of Malta, 2006a). This RES<br />
Policy identifies three key objectives namely:<br />
1) Promotion of RES by setting ambitious goals and targets for penetration and putting in<br />
place appropriate support schemes and regulatory measures to encourage meaningful<br />
public investment and participation. Government will also lead by example.<br />
Ensuring that the quality of life is not compromised or negatively affected by the choices<br />
made in considering and promoting RES development.<br />
2) Seeking the holistic, most suitable and robust adoption of RES by ensuring that support<br />
services and development facilities are available and accessible including access to and<br />
dissemination of information, the promotion of public participation and acceptance of<br />
RES projects as well as human resource development to participate meaningfully and<br />
with excellence in the development and uptake of RES (Government of Malta, 2006a)<br />
1.2 Energy s u pply, de mand and production: evo l u tion and<br />
s tr uc tu re<br />
The energy sector in Malta has been for a significant period characterised by strong state<br />
involvement and is presently dominated by a state-owned monopoly – Enemalta Corporation.<br />
Enemalta Corporation is a horizontally and vertically integrated undertaking (utility), which<br />
has had exclusive rights and public service obligations to satisfy „reasonable‟ energy<br />
demands. At the time of its formation it took over the operations and functions of the Malta<br />
Electricity Board, the Gas Board as well as the operations then carried out in the petroleum<br />
sector by various operators.<br />
Enemalta Corporation continues to be the main producer of electricity in Malta, but this<br />
sector is now open to competition. In addition according to LN 511 of 2004 it is also the sole<br />
entity authorised to supply electricity to consumers. Enemalta Corporation is also designated<br />
as the distribution system operator in Malta and is responsible for operating, ensuring the<br />
maintenance of and, if necessary, developing the distribution system in a given area and,<br />
where applicable, its interconnections with other systems and for ensuring the long term<br />
ability of the system to meet reasonable demands for the distribution of electricity. Enemalta<br />
Corporation is responsible for dispatching generation plant and for balancing the distribution<br />
system responsible and for maintaining a secure, reliable and efficient electricity distribution<br />
system within Malta.<br />
1.2.1 The Electricity System and Electricity Access<br />
The electricity system in Malta is a small isolated system. Electricity generation is carried out<br />
by Enemalta Corporation (EMC), the national energy utility, which operates two conventional<br />
thermal power stations.<br />
The 132 and 33kV system consists mainly of underground cables with a total length of<br />
approximately 214 km. Gozo is supplied with electricity from Malta via three submarine cable<br />
circuits which pass over the island of Comino where there is a 33/11kV distribution centre to<br />
supply electricity to Comino. The 11KV system consists in 1041km of 11kV underground<br />
cables and 159 km of 11kV overhead lines. Some major industrial and commercial<br />
customers are supplied directly with electricity at 11kV. The low voltage system in the<br />
Maltese Islands is a three phase, 4 wire, 400/230V system (Enemalta Corporation, 2006a).<br />
In Malta, practically 100% of the population has access to electricity. Enemalta Corporation<br />
supplies electricity to some 200,000 consumers.
Enemalta Corporation, 2006a<br />
MALTA - National study<br />
Figure 3 Distribution System<br />
1.2.2 Evolution and structure of the energy demand<br />
Electricity demand in Malta has constantly increased during the last 15 years at a high rate<br />
as shown in<br />
429
430<br />
ENERGY AND SUSTAINABLE DEVELOPMENT IN THE MEDITERRANEAN<br />
Table 2. Today total electricity consumption is around 2,243 GWh/year (year 2003/2004) an<br />
increase of 75 % over 1990/1991 when electricity consumption was 1,278 GWh. The<br />
increase in electricity demand may be attributed to various factors including:<br />
a) Changing lifestyles including increased purchases of and demands for various energyrelated<br />
products and services. For example there has been a significant market<br />
penetration of new equipment particularly air-conditioning systems which have<br />
contributed to increases and shifts of the active power maximum demand (measured in<br />
MW) in any one year from winter to summer.<br />
b) General development and improvement in the country‟s infrastructure and services such<br />
as:<br />
a) the construction and commissioning of a new airport terminal in 1992,<br />
b) the construction and commissioning of a number reverse osmosis plants between<br />
1982– 1994 to satisfy potable water demands,<br />
c) the construction Malta Freeport in 1988 and various projects subsequently<br />
undertaken to expanding the facilities and increasing the equipment fleet. This<br />
has resulted in an increase from 94,500 TEUs handled and 231 ship calls in 1990<br />
to 1,461,174 TEUs handled and 1,698 ship calls in 2004 (Malta Freeport<br />
Terminals Ltd, 2007)<br />
d) construction of a number of yacht marinas and general upgrading of the country‟s<br />
tourism‟s infrastructure,<br />
e) Development and investment by the private sector including:<br />
f) construction of various tourism related, large scale commercial and residential<br />
development, private hospitals, nursing homes etc. which have all contributed to<br />
a higher quality of life and improvement in services in Malta as well as<br />
associated increases in electricity demand;<br />
g) investment and setting up and/or expansion of operations of various industries<br />
such as ST Microelectronics (Malta) Ltd, Playmobil (Malta) Ltd., Trelleborg Dowty<br />
Malta Ltd, Lufthansa Technik Malta etc.,
Year<br />
Used in<br />
station -<br />
MWh<br />
Consumption<br />
by Industrial<br />
Sector -<br />
MWh<br />
MALTA - National study<br />
Table 2 Total Electricity Demand<br />
Consumption<br />
by<br />
Commercial<br />
Sector -<br />
MWh<br />
Consumption<br />
by Domestic<br />
Sector -<br />
MWh<br />
Street<br />
Lighting<br />
- MWh<br />
Lost in<br />
distribution<br />
and<br />
unaccounted<br />
for<br />
1990/91 100,246 361,479 247,439 320,865 22,881 225,592<br />
1991/92 105,972 406,462 274,689 357,747 22,493 272,603<br />
1992/93 114,046 426,567 294,242 340,575 22,822 265,496<br />
1993/94 117,648 488,266 317,414 381,596 25,585 211,132<br />
1994/95 112,790 488,962 340,095 425,659 28,270 262,589<br />
1995/96 105,512 509,876 367,397 430,413 29,180 215,135<br />
1996/97 108,465 452,620 411,940 461,779 29,757 221,370<br />
1997/98 111,408 406,844 348,835 501,996 24,442 326,989<br />
1998/99 118,737 477,003 423,731 463,668 28,759 328,448<br />
1999/00 116,979 477,379 457,142 539,796 27,551 297,776<br />
2000/01 117,661 482,908 503,660 540,265 42,733 256,123<br />
2001/02 123,987 504,760 501,582 561,907 44,901 317,936<br />
2002/03 125,093 499,230 553,804 623,679 35,220 370,989<br />
2003/04 127,777 505,535 592,158 623,672 29,068 365,750<br />
Source: Enemalta Corporation<br />
The development of electricity demand as well as a forecast developed by Enemalta is shown in<br />
Figure 1.<br />
Source: Enemalta Corporation<br />
Figure 4 Development and forecast electricity demand (units generated)<br />
Units Generated (Data from Enemalta)<br />
1.2.3 Evolution and structure of production<br />
Electricity Generation<br />
Malta‟s electricity system is a small isolated system. All energy for power generation is<br />
derived from imported fossil fuel. Coal which was formerly used for power generation was<br />
abandoned in the nineties. The amount of fuel that is used for purposes other than power<br />
generation and that can be replaced by gas is small.<br />
Two power plants are operated by Enemalta Corporation, Marsa Power Station and Delimara<br />
Power Station. These power plants utilise heavy fuel oil for conventional steam plant<br />
(boiler/turbo generation) and gas-oil for gas turbines and supply all the electrical power<br />
needs of the country. There are also three open cycle gas turbines, one at Marsa Power<br />
Station (16 years old) and two at Delimara Power Station (11 years old). These are<br />
expensive to operate and generally are reserved for peak load or emergency duty.<br />
431
432<br />
ENERGY AND SUSTAINABLE DEVELOPMENT IN THE MEDITERRANEAN<br />
Marsa Power Station has a total installed generation capacity of 267MW. The average age of<br />
the steam turbines at Marsa Power Station is 45 years and the age of the boilers ranges from<br />
19 to 37 years. Over the years a number of turbines have been refurbished.<br />
Delimara Power Station was first commissioned in 1992 and has a total installed generation<br />
capacity of 340 MW. Two steam units are 14 years old and the combined cycle plant (CCGT)<br />
is 8 years old.<br />
The average operating efficiency of the operational steam plant at Marsa Power Station is<br />
27% compared with an average efficiency of the steam plant at Delimara Power Station of<br />
32% and of the CCGT plant of 40%. (Enemalta Corporation, 2006b).<br />
The energy sector is facing extensive reform with Malta‟s accession to the EU and the<br />
implementation of the EU Directives. Legal Notice 511/2004 establishes rules for the<br />
licensing of activities in the electricity sector and lay down the rules relating to the<br />
organisation and functioning of the electricity sector in Malta, access to the market, the<br />
operation of the system and the regulation of electricity tariffs, with a view to achieving a<br />
competitive, secure and environmentally sustainable market in electricity.<br />
Forecast of Electricity Consumption<br />
The calculated present growth rate in peak demand (MW) is about 3% per annum over the<br />
present peak load with the peaks occurring both during the summer and winter months. This<br />
increase in peak demand is associated with an increase in electrical energy consumption<br />
(MWh) of just over 2% of present demand (Enemalta Corporation, 2006b)<br />
Enemalta Corporation (2006b) have estimated the anticipated increase in electricity<br />
consumption over the period 2005 to 2020 and is shown in Table 3. This estimate was<br />
based upon an annual natural increase of approximately 2% of the present consumption<br />
(linear), with an expected decrease in this rate of increase brought about by the increased<br />
utilisation of energy efficient appliances and buildings and programmes for energy<br />
conservation.<br />
It was noted that concurrently a number of major developments are expected to be<br />
operational during the period which would increase the electricity consumption in a step<br />
manner. In a small isolated system such as Malta‟s major developments such as the<br />
construction and commissioning of the new Mater Dei Hospital and the construction of Tigne<br />
– Manoel Island residential and commercial development has a disproportionate effect on<br />
demand. Electricity consumption is thus estimated to increase from 2.26 TWh in 2005 to 3.29<br />
TWh in 2020.<br />
Source: Enemalta Corporation 2006b<br />
Table 3 Forecasts of Electrical Energy Consumption<br />
Year Generation - MWh<br />
2005 2,263,145<br />
2006 2,311,145<br />
2007 2,389,145<br />
2008 2,507,145<br />
2009 2,625,145<br />
2010 2,693,145<br />
2011 2,781,145<br />
2012 2,859,145<br />
2013 2,937,145<br />
2014 3,015,145<br />
2015 3,093,145<br />
2016 3,133,145<br />
2017 3,173,145<br />
2018 3,213,145<br />
2019 3,253,145<br />
2020 3,293,145
MALTA - National study<br />
1.3 Impa cts and risks of th e observed and f ore cast evo l u t ions<br />
1.3.1 Energy dependence and Energy bill<br />
Malta is totally reliant on imported fossil fuels for its energy needs. Fossil fuels in the form of<br />
oil and gas are the primary energy sources utilised in Malta. These products are imported<br />
from several countries including Libya, Iraq and Russia and are typically uplifted from<br />
locations in Sicily, Italy, France, Spain, Israel and the Black Sea bordering countries.<br />
Fuel oils are currently purchased as refined products. In the past, oil was purchased as crude<br />
stock and was shipped to refineries where it was refined into various distillates. Those<br />
products that were not used on the local market were sold or traded.<br />
The fuels that are imported for inland use are fuel oils of varying sulphur content; gasoil of<br />
varying sulphur content and including EN590, light cycle oil leaded and unleaded gasoline,<br />
kerosene, Jet A1, aviation fuel, liquefied petroleum gas. Coal was also imported and used in<br />
the generation of electrical power up to 1995.<br />
There are also a number of companies operating in the oil bunkering and storage business<br />
which operate fuel storage facilities.<br />
In 2006 Government decided in favour of an HVDC cable interconnection with Sicily to<br />
supplement or enhance on island generation. A consultancy study on the optimal sizing of<br />
the interconnection and feasibility and other studies on options for diversification of fuels for<br />
on island generation – by considering natural gas and liquefied natural gas as alternatives to<br />
the existing fuel oil/gas oil mix is expected to commence shortly.<br />
1.3.2 Greenhouse gas effect<br />
Malta submitted its report to the first communication to the United Nations Framework<br />
Convention on Climate Change. This Communication provides a national greenhouse gas<br />
inventory for the period 1990-2000. Malta‟s total CO2 emissions increased from 1,895 Gg in<br />
1990 to 2,450 Gg in 1999. It has been noted that energy sector (power generation and<br />
433
434<br />
ENERGY AND SUSTAINABLE DEVELOPMENT IN THE MEDITERRANEAN<br />
transport) is a major contributor to GHG emissions in Malta. The sector contributes<br />
approximately 63 percent of Malta‟s direct GHG emissions, with approximately 75 percent of<br />
national CO2 emissions. (Sammut and Micallef, 2004)<br />
CO2 emissions from electricity generation stood at 1,397 Gg in 1990, 1,727 in 1995 and<br />
rising to 1,784 Gg in 2000 and to 1,973 Gg in 2003.<br />
At the same time energy consumption has seen a growth of 61 percent between 1990/1991<br />
and 2001/2002. The domestic and commercial sectors have contributed most significantly to<br />
the increase in demand.<br />
Between 1990-1995 electrical energy production increased around 5.6 % annually. This<br />
increase eased off after 1995 because of the decline in electrical energy use by the Water<br />
Services Corporation (WSC), the largest single consumer, where electrical energy is used for<br />
desalination. 1<br />
Transport is also a major contributor to Malta‟s total GHG emissions. Between 1999-2000,<br />
the number of private cars increased by an annual average of 7%. CO2 emissions from<br />
transport were estimated at 342 Gg in 1990, 440 Gg in 1995, 496 Gg in 2000 and rising to<br />
525 Gg in 2003. Transport constitutes approximately 20% of the emissions from the energy<br />
sector. Road transport is the major contributor at 96-97 % of the CO2 emissions from<br />
transport.<br />
Malta’s GHG Emissions Obligations<br />
Malta ratified the United Nations Framework Convention on Climate Change (UNFCCC) as a<br />
non-Annex I party on 17th March 1994, and on the same basis, subsequently ratified the<br />
Kyoto Protocol on 11th November 2001. Malta is a non-Annex I party to the Kyoto Protocol.<br />
It is also excluded from the list of EU Member States forming part of the burden-sharing<br />
agreement under Council Decision<br />
2002/358/EC concerning the approval, on behalf of the European Community, of the Kyoto<br />
Protocol to the UNFCCC and the joint fulfilment of commitments there under.<br />
Currently Malta does not have any quantified mandatory targets for the limitation or reduction<br />
of greenhouse gas emissions. It is however obliged to comply to various EU Directives<br />
including the Emission Trading Directive as well as other various EU Directives on emission<br />
limitations, air and fuel quality.<br />
Malta has submitted to the EU Commission its 2 nd<br />
National Allocation <strong>Plan</strong> for the period 2008<br />
-2012 and this was prepared pursuant to obligations under Emissions Trading Directive<br />
2003/87/EC. This <strong>Plan</strong> highlights Malta‟s overall greenhouse gas emissions are small<br />
compared to those of the European Union as a whole (at 0.058% of the total EU-25<br />
emissions). This is due to the small size of the country in geographical, population and<br />
economic terms. Malta also has one of the lowest emission rates per capita within the EU (7<br />
tonnes of CO2 equivalent per capita, compared to an average of 11 tonnes for the EU- 25).<br />
The specific GHG emissions per unit of gross domestic product (GDP) for Malta are 924<br />
tonnes of CO2 equivalent per million Euro of GDP, as against the EU average of 607 tonnes.<br />
Malta‟s NAP notes that this reflects more Malta‟s (relatively low) GDP rather than high<br />
emissions along with the fact that Malta is too small to benefit from „economies of scale‟ (for<br />
example, in electricity production) and that it is (at present) an isolated energy system with a<br />
limited choice of fuels.<br />
The National Allocation <strong>Plan</strong> proposed that Malta‟s proposed total quantity of allocation for<br />
the period 2008 to 2012 is therefore 14,777,981 tonnes of CO2. A total of 10,946,653 tonnes<br />
of CO2 would be allocated to Enemalta, with 3,831,328 tonnes of CO2 held in reserve for new<br />
entrants (Ministry for Rural Affairs and the Environment, 2006).<br />
The EU Commission is requesting Malta to make a number of changes to the NAP including<br />
a reduction in the total quantity of allowances to be allocated by Malta to installations and to<br />
1 Desalination contributes to around 50% of Malta‟s potable water supply.
MALTA - National study<br />
new entrants to 2.143061 million tonnes. This is equivalent to a reduction of 0.812539 million<br />
tonnes per year for the trading period (Commission of the European Communities, 2006).<br />
1.3.3 Other impacts on the Environment<br />
Apart from greenhouse gas emissions, air quality is also a major environmental issue in<br />
Malta and the energy sector is also a contributory party. In 1995 for example coal for<br />
electricity generation was phased out due to air quality concerns in the vicinity of Marsa<br />
Power Station.<br />
Various EU environmental directives exist which Malta has transposed and obliged to adopt<br />
to limit the emissions to the air resulting from various sources. These include the Large<br />
Combustion <strong>Plan</strong>ts Directive, the National Emission Ceilings Directive, the Integrated<br />
Pollution Prevention and Control Directive, Ambient Air Quality Assessment and<br />
Management Regulations, and the Greenhouse Gas Emissions Trading Scheme.<br />
There is no fixed energy infrastructure connecting Malta to potential fuel product suppliers.<br />
All fuels are transported to Malta by ocean going vessels.<br />
The transportation of fuels to Malta by sea going vessels poses inherent risks in terms of<br />
potential marine pollution. The risks from marine pollution in view of the country‟s<br />
geographical location are recognised particularly since Malta lies at the heart of major<br />
shipping routes.<br />
Other environmental impacts associated with fuel storage include hydrocarbon losses and<br />
leaks from storage tanks and pipelines, which can contaminate the local terrain as well as<br />
surface, coastal and ground water resources. Typically such losses and leaks can arise out<br />
of insufficient asset maintenance or accidental damage. Apart from this, land use and silting<br />
impacts including the effects on visual amenity associated with the location of the storage<br />
facilities.<br />
1.4 Financ ing and inve s t ment needs<br />
A National Strategic Reference Framework (NSRF) document has been drafted through an<br />
intensive dialogue process and an extensive assessment of the country‟s needs and<br />
challenges, strategic objectives for development for the medium and longer term. This<br />
document provides the goals and the basic strategic framework for the operational<br />
programmes on the objective of sustaining economic competitiveness through innovation<br />
and entrepreneurship and facilitating a knowledge-based economy through investment in the<br />
necessary physical and social infrastructural capabilities, education and social inclusion.<br />
(Government of Malta 2006c)<br />
435
436<br />
ENERGY AND SUSTAINABLE DEVELOPMENT IN THE MEDITERRANEAN<br />
In 2006 Enemalta Corporation published its Electricity Generation <strong>Plan</strong> for the period 2006 to<br />
2015. This <strong>Plan</strong> notes that the existing generation plant has aged considerably while their<br />
operating efficiency is relatively low. In addition given expected new developments which will<br />
increases expected peak demand and consumption, the existing generation capacity is only<br />
expected to meet this demand until 2010. Further loss due to faults to one of the larger units<br />
could also mean a shortfall in generation in summer 2007. Enemalta Corporation further<br />
notes that environmental obligations arising from various EU Directives (Large Combustion<br />
<strong>Plan</strong>t directive, National Emissions Ceiling Directive, Emission Trading Directive and the<br />
National Allocation <strong>Plan</strong>) and the Gothenburg Protocol pose additional constraints on existing<br />
and planned generating plant. This <strong>Plan</strong> highlights the need for 200 MW of local generation<br />
to be replaced either by new generating plant or by a cable interconnection (Enemalta<br />
Corporation, 2006b).<br />
It has been noted that the energy sector requires massive investment (generation and<br />
distribution) to sustain the growth in demand created by changing standard of living of<br />
citizens and increased economic activity.<br />
Investment is also required in certain critical sections of the distribution system to prevent<br />
distribution failures.<br />
Enemalta Corporation 2006b estimate that the expected expenditure levels for the following<br />
infrastructure projects are as follows:<br />
130MW CCGT plant -Lm35-40 million (€ 81.5 - € 93.2 million)<br />
132kV DC‟s and cables Lm20 million (€ 46.6 million)<br />
200MW electric cable interconnection Lm55 million (€ 128.1 million)<br />
33kV Distribution Centre‟s and reinforcement Lm10 million (€ 23.3 million)<br />
Malta Sicily gas pipeline (if adopted) Lm65 million (€ 151.4 million).<br />
2. Rational energy use (RUE) and renewable energies (RE): policies,<br />
tools, progress, resulting effects, case studies<br />
2.1 RUE and RE policies<br />
Sustainable energy use is the prime objective of any energy policy. As reported earlier the<br />
Government of Malta in 2005 highlighted its intention to evaluate the implications of Malta‟s<br />
dependency on fossil fuels and adopt such necessary measures in order to reduce this<br />
dependency. Government has embarked on a series of measures to address this situation<br />
including:<br />
carrying out feasibility studies on the purchase of electricity through the European grid as<br />
well as through the installation of a pipeline or gas storage plant in order to introduce gas<br />
as another source for the generation of electricity;<br />
greater use of alternative sources of energy;<br />
raising public awareness on energy efficiency and alternative energy sources.<br />
2.1.1 Rational energy use (RUE) policies<br />
An energy efficiency policy is being prepared using a structured approach based on the<br />
following methodology.<br />
Establish quantitatively how energy, imported into Malta as fossil fuel, is transformed or<br />
otherwise made available to consumers in the required convenient forms.<br />
Identify the uses to which this energy is put.<br />
Identify whether and how increased energy efficiency can be achieved in the<br />
transformation processes and in energy use. – technical measures, attitude change by<br />
consumers, educational programs, etc.<br />
Quantify the potential for achieving this increased efficiency, investigate holistically the<br />
costs involved and hence determine cost-effective measures to be taken.
MALTA - National study<br />
Set plans and programs to achieve this cost-effective energy efficiency, including the<br />
resources required, priority in allocating resources, targets and timeframes and the<br />
responsibility to achieve them.<br />
Monitoring and reporting.<br />
This action plan covers all fuels imported for final consumption in Malta, including those used<br />
for combustion for electricity generation. It excludes marine and air bunkering fuels.<br />
2.1.2 Renewable energy (RE) development policies<br />
A draft RES policy document was published by the Government of Malta in August 2006.<br />
This document identified three key objectives namely:<br />
1) Promotion of RES;<br />
2) Quality of Life;<br />
3) Support facilities and services.<br />
Complementary to these key policy objectives, Government also identified a series of<br />
strategic measures and actions. It is stated that Government intends to pursue these<br />
measures to attain its policy objectives.<br />
This policy document notes that Government is committed towards the promotion of<br />
renewable energy:<br />
by identifying and keeping under review what natural resources can be exploited in Malta<br />
at any time in the light of available technology and the balance of their benefits and costs;<br />
by setting clear, feasible goals and ambitious national indicative targets for penetration of<br />
the market by these energy sources;<br />
by keeping its policy under constant review to encourage best practice standards to<br />
promote rather than inhibit RES together with energy efficiency;<br />
by putting in place appropriate support mechanisms and financing options and establish<br />
regulatory and administrative procedures that minimise as much as possible the burden<br />
associated with them;<br />
by leading by example and encouraging the Maltese public to take up renewable energy<br />
as a matter of economic, social and environmental choice (Government of Malta, 2006a).<br />
In addition the draft RES Policy notes that:<br />
In managing the introduction of renewable energy sources, Government will ensure that<br />
on balance, the overall quality of life of citizens is not adversely affected or compromised.<br />
Diverse technologies have different characteristics and their impact on the quality of life<br />
needs to be determined individually.<br />
Government will seek the holistic, proper and robust adoption of RES by ensuring that<br />
support services and development facilities are available and accessible. These facilities<br />
and services include access to and dissemination of information, the promotion of public<br />
participation and acceptance of RES projects as well as human resource development to<br />
participate meaningfully and with excellence in the development and uptake of RES<br />
(Government of Malta, 2006a).<br />
2.2 Ins tr ume n ts and measures to be taken in fa vo u r of R UE and<br />
R E<br />
2.2.1 Tools and measures in favour of rational energy use (RUE)<br />
Administrative and legislative measures<br />
Energy end use<br />
Government has introduced various legal notices to address and promote energy efficiency<br />
and in line with harmonisation and transposition requirements associated with Malta‟s<br />
accession to the European Union. These include:<br />
Efficiency Requirements for New Hot-Water Boilers Fired with Liquid or Gaseous Fuels<br />
Regulations, 2002 (Legal Notice 62 of 2002)<br />
437
438<br />
ENERGY AND SUSTAINABLE DEVELOPMENT IN THE MEDITERRANEAN<br />
Energy Efficiency Requirements for Household Electric Refrigerators, Freezers and<br />
Combinations thereof, 2002 (Legal Notice 63 of 2002)<br />
Energy Efficiency Requirements for Ballasts for Fluorescent Lighting Regulations, 2002<br />
(Legal Notice 100 of 2002)<br />
Indication by Labelling and Standard Product Information of the Consumption of Energy<br />
and other Resources by Household Appliances (Amendment) Regulations. (Legal Notices<br />
99 of 2002, 27 of 2003 and 235 of 2003)<br />
Combined Heat and Power<br />
EU Directive 2004/8/EC on the promotion of cogeneration based on a useful heat demand in<br />
the internal energy market and amending Directive 92/42/EEC was transposed into Maltese<br />
legislation through Legal Notice 2 of 2007.<br />
This Legal Notice seeks to promote cogeneration based on useful heat demand. Promotion<br />
measures transposed by the legal notice include the facilitation of access to the grid and the<br />
issue of guarantees of origin certificates for CHP installations.<br />
At this stage, the potential for CHP in Malta is relatively unknown.<br />
Energy Performance in Buildings<br />
Regulations have been introduced with the aim to improve the energy performance of<br />
buildings in line with the requirements of Directive 2002/91/EC of the European Parliament<br />
and of the Council of 16 December 2002 on the energy performance of buildings. These are<br />
legislated by Legal Notice 238/2006 "Minimum Requirements on the Energy Performance of<br />
Building Regulations, 2006" under the Malta Resources Authority Act. These regulations set<br />
out requirements, by means of any technical guidance document, with regards to:<br />
1) the application of minimum energy performance requirements for newly constructed<br />
buildings;<br />
2) the application of minimum energy performance requirements for large existing buildings<br />
that are subject to major renovation;<br />
3) the general framework for a national methodology for the calculation of the integrated<br />
energy performance of buildings;<br />
4) the energy performance certification of newly constructed buildings and large existing<br />
buildings subject top major renovation when these buildings change ownership or are<br />
rented out;<br />
5) the regular inspection of boilers and of air-conditioning systems in buildings with regard<br />
to reducing energy consumption and limiting carbon dioxide emissions.<br />
Minimum requirements for the energy performance of buildings in Malta have been set for<br />
separate building elements - floors, windows, walls and roofs.<br />
Educational Campaign on Sustainable Energy Use<br />
A national educational campaign is being planned to increase the level of the general public<br />
and consumers‟ awareness on sustainable energy use. The aims of this campaign are:<br />
1) To educate consumers through dissemination of information and knowledge :<br />
a) on Malta‟s dependency of oil;<br />
b) associated measures that may be implemented to reduce this dependency on oil<br />
including energy efficiency measures, energy conservation measures and<br />
integration of renewable energy sources;<br />
c) benefits of sustainable energy use to the environment and society as a whole;<br />
2) To increase public participation and change consumers‟ behaviour towards more<br />
sustainable energy use.<br />
The educational campaign will address the following key issues:<br />
d) Energy efficiency and conservation of electricity;<br />
e) Micro-generation through renewable energy sources and promotion of solar<br />
thermal systems;<br />
f) Energy efficiency in transport;
g) Energy performance in buildings.<br />
MALTA - National study<br />
The project is divided in 3 phases with the target audiences in Phases 1 and 2 being<br />
domestic consumers, school children and environmental NGOs and opinion leaders. The<br />
specific objectives of the Phases of the campaign are to:<br />
1) raise public awareness on energy efficiency, energy conservation and integration of<br />
renewable energy resources in Malta;<br />
2) educate consumers on measures and best practices for sustainable energy use;<br />
3) educate school children on sustainable energy use,<br />
4) disseminate information on Government‟s policies, measures and support mechanisms<br />
to assist consumers in energy efficiency, energy conservation and use of renewable<br />
energy sources;<br />
5) ensure that consumers become more aware of their energy consumption and<br />
understand the benefits associated with energy efficiency and conservation and<br />
contribution of micro generation from RES (wind and solar);<br />
6) change consumers behaviour towards energy saving and sustainable energy use.<br />
Phase 3 of the campaign seeks to target professional bodies and associations, government<br />
departments and entities, importers and industry associations and organisations and other<br />
heavy consumers. The specific objectives in this phase are to:<br />
1) raise target specific groups awareness on energy efficiency, energy conservation and the<br />
integration of renewable energy resources in Malta;<br />
2) educate heavy consumers on measures and best practices for sustainable energy use;<br />
3) disseminate information on Government‟s policies, measures and support mechanisms<br />
to assist heavy consumers in energy efficiency, energy conservation and use of<br />
renewable energy sources;<br />
4) ensure heavy consumers are aware of their energy consumption and understand the<br />
benefits associated with energy efficiency and conservation and contribution of micro<br />
generation from RES (wind and solar).<br />
Financial Instruments<br />
With effect from 1st January 2006 Government introduced a financial support scheme aimed<br />
at increasing energy efficiency at domestic premises through a grant of 25% on the purchase<br />
price of roof thermal insulation material at domestic residences [subject to a maximum of LM<br />
100 (€ 233)].<br />
In November 2006, Government introduced another financial instrument to increase energy<br />
efficiency by the domestic sector. This consist in a scheme for grants on the purchase of<br />
household appliances for domestic use certified as being efficient in the use and<br />
consumption of energy is offering a 20% refund (up to a maximum of Lm 50 (€ 233) for<br />
cooling appliances and Lm25 (€ 58) for other appliances) on energy efficient washing<br />
machines, fridges, freezers and their combinations, tumble dryers, dishwashers and air<br />
conditioners for domestic use. Equipment eligible for the rebate has to be labelled A or better<br />
in accordance with the directives issued under the framework Council Directive 92/75/EEC 2<br />
(transposed into LN 99/2002) 3 .<br />
Case Study 1: Energy Efficiency in Desalination - Water Services Corporation<br />
Water in the Maltese islands is a scarce resource and with high population density, small surface<br />
area and high percentage of urban development as well as a semi-arid climate, pressures on<br />
existing water resources are intense. Water to meet the needs of the population is obtained from<br />
two main sources: groundwater and desalination. Desalination facilities were introduced in the<br />
1980s in response to water scarcities arising from increasing demand and insufficient natural<br />
supplies. Today desalination contributes to around 50% of the potable water supply in Malta.<br />
2 Directive 92/75/EEC of 22 September 1992 on the indication by labelling and standard product information of the<br />
consumption of energy and other resources by household appliances<br />
3 Budget Speech 2007 (Government of Malta, October 2006).<br />
439
440<br />
ENERGY AND SUSTAINABLE DEVELOPMENT IN THE MEDITERRANEAN<br />
The first desalination plant was constructed in Malta at Lapsi with a capacity of 20,000m 3<br />
/day in<br />
1982 and increased to 24,000 m /day in 1986.<br />
Source: MDS Sea and Brackish Water Desalination<br />
3<br />
Table 4 Desalination <strong>Plan</strong>ts<br />
Energy usage is a major cost element and environmental impact in the operation of desalination<br />
plants.<br />
In 2000/2001, the total energy consumption for operation of the RO plants amounted to 103,562<br />
MWh. The energy consumption of the WSC during 1999/2000 was 131,043 MWh or 8.8% of the<br />
total energy sales by Enemalta Corporation (WSC, 2001).<br />
The Water Services Corporation is thus a major consumer of electricity in Malta and careful<br />
monitoring of its electricity consumption has been carried out through energy audits. Variances<br />
between actual data and design parameters are noted and recommendations to improve the<br />
plants‟ operating efficiency (including membrane additions or replacement) are considered and<br />
where applicable implemented (Water Services Corporation 2001).<br />
Case Study 1: Energy Efficiency in Desalination - Water Services Corporation (cont.)<br />
Various projects have also been undertaken by the Water Services Corporation to improve the<br />
energy efficiency of the RO plants between 2000-2002. Modern energy recovery technology was<br />
incorporated in existing plants as follows:<br />
Pelton wheels were installed on 6 trains employing reverse running pumps at Pembroke<br />
Phase II. This consisted in a simple replacement of the latter equipment. This project<br />
contributed to a reduction in the specific energy consumption from 4.5 kWh/m3 to 3.6 kWh/m3.<br />
Pressure exchangers as incorporated in Lapsi R.O. <strong>Plan</strong>t. This required a complete reengineering<br />
of the equipment including replacement of the high-pressure pump and two trains<br />
of previous rating were incorporated in the process. The specific energy consumption was<br />
reduced from 4.8 kWh/m3 to 3.2 kWh/m3 through this project.
MALTA - National study<br />
Figure 5 Pressure Exchangers at Lapsi R.O. <strong>Plan</strong>t<br />
Source: Water Services Corporation<br />
Figure 6 shows the total specific power (production and distribution) of the RO plants<br />
between 1998–2007 and in particular the improvements registered in energy consumption at<br />
Pembroke and Lapsi R.O. <strong>Plan</strong>ts.<br />
Source: Water Services Corporation<br />
Figure 6 Total specific power - RO plants<br />
Case Study 1: Energy Efficiency in Desalination - Water Services Corporation (cont.)<br />
Following these projects, the Water Services Corporation is planning further projects including<br />
procurement of further pressure exchangers and new membranes with the intention of:<br />
1. increasing the production capacity of RO plants;<br />
2. improving the quality of the desalinated water;<br />
3. decreasing the energy consumption in the RO plants;<br />
4. decreasing the reliance on groundwater for potable water supply.<br />
The planned projects consist in installation and commissioning:<br />
1. two complete systems at Cirkewwa R.O. <strong>Plan</strong>t and consisting in new pumps, pressure<br />
exchangers and membrane replacements;<br />
441
442<br />
ENERGY AND SUSTAINABLE DEVELOPMENT IN THE MEDITERRANEAN<br />
2. two complete systems at Lapsi R.O. <strong>Plan</strong>t and consisting in new pumps, pressure exchangers<br />
and membrane replacements;<br />
3. three complete systems at Pembroke Phase 1;<br />
4. replacement of membranes at Pembroke Phase 2.<br />
The production capacity is expected to increase from 70,000 m 3<br />
/day to 97,000 m 3<br />
/day, the<br />
chloride levels reduced from 250 mg/l to 150 mg/l while the specific power reduced from 5.5<br />
kWh/m 3<br />
to 4.4 kWh/m 3<br />
. This is expected to contribute to an annual electricity savings of<br />
approximately 13 million kWh (Water Services Corporation, 2006).<br />
2.2.2 Tools and measures in favour of renewable energy (RE)<br />
ENE_C08: Expenditures in RE and RUE: RE and RUE programmes share in energy<br />
investments and R&D expenses:<br />
Data not available<br />
ENE_C05: Final consumer energy price per fuel and per sector:<br />
Refer to Annex 1 Table 12 for detailed breakdown of current electricity and fuel prices<br />
Table 5 Average Electricity Prices<br />
Industrial Users €/kWh Households - €/kWh<br />
1991 0.0654 0.0538<br />
1992 0.0658 0.0541<br />
1993 0.0591 0.0486<br />
1994 0.0606 0.0498<br />
1995 0.0588 0.0484<br />
1996 0.0578 0.0476<br />
1997 0.0596 0.0490<br />
1998 0.065 0.0587<br />
1999 0.0635 0.0573<br />
2000 0.0675 0.0609<br />
2001 0.0683 0.0617<br />
2002 0.0698 0.0631<br />
2003 0.0636 0.0652<br />
2004 0.062 0.0636<br />
2005 0.0706 0.0727<br />
2006 0.0711 0.0904<br />
Source: Eurostat, 2006<br />
ENE_C11: Share of fuel and electricity expenditures in household budgets.<br />
Average annual household<br />
expenditure for all<br />
households (for year 2000)<br />
% of Average<br />
household disposable<br />
income 4 (for year<br />
2000)<br />
Water and electricity bills: Lm 150.8 1.83%<br />
Gas and liquid fuels: Lm 21.7 0.26 %<br />
Solid fuels: Lm 1.3 0.02 %<br />
4 Average household disposable income (Lm) : LM 8,202.2 (for year 2000) based on National Statistics Office, 2003
Fuels and lubricants; maintenance, repair and<br />
other services related to personal transport<br />
equipment:<br />
Source: National Statistics Office, 2003<br />
MALTA - National study<br />
Average annual household<br />
expenditure for all<br />
households (for year 2000)<br />
% of Average<br />
household disposable<br />
income 4 (for year<br />
2000)<br />
Lm 432.7 5.28 %<br />
ENE_C07: Cities/regions/provinces with an existing energy audit and/or a carbon audit and/or<br />
with objectives in terms of RE and RUE - None<br />
Administrative and Legislative Measures<br />
Various measures have been introduced by Government to implement and support greater<br />
penetration of renewable energy sources in Malta. This includes both financial instruments<br />
and administrative measures.<br />
EU Directive 2001/77/EC on the promotion of electricity generated from renewable energy<br />
sources was transposed into Maltese legislation through Legal Notice 186 of 2004. Malta<br />
also submitted its report to the EU Commission on the implementation of the EU Directive<br />
2001/77/EC in accordance with the reporting obligations under Article 3 (3) for the publication<br />
period ending 27 October 2005. This report includes an analysis of the success in meeting<br />
the national indicative targets taking into account in particular climatic factors likely to affect<br />
443
444<br />
ENERGY AND SUSTAINABLE DEVELOPMENT IN THE MEDITERRANEAN<br />
the achievement of those targets and which indicates to what extent the measures taken are<br />
consistent with national climate change commitment.<br />
Wind Energy<br />
Following various studies on RES potential and options available for Malta, Government in<br />
2006 decided that the best option for Malta to seek a significant contribution from RES in the<br />
energy mix is through the exploitation of offshore wind energy. It has been noted that<br />
relatively shallow water sites (< 20 m) are very limited around Malta and this appears also to<br />
limit the potential of exploitation of this resource.<br />
A call for expressions of interest for offshore windfarm development from interested parties<br />
willing to undertake offshore wind projects with a final capacity of between 75 and 100 MW in<br />
Maltese territorial waters on a public private partnership basis has been issued and the<br />
responses submitted to this Call are being assessed by Government. This approach also<br />
coincided with a decision taken by the Government that the national electricity distribution<br />
grid was to be interconnected with the European grid. Such an interconnection would render<br />
the system stable and robust and permit a scale of operations sufficient to make the project<br />
economically feasible.<br />
Solar Energy<br />
Government has also sought to increase penetration of micro generation from RES.<br />
Administrative barriers associated with the application for permitting and licensing of smallscale<br />
auto-generators (e.g. households or small businesses generating electricity using PV<br />
systems) have been reviewed and reduced or eliminated. A fast-track notification process<br />
has been developed for micro-generating renewable energy systems and small combined<br />
heat and power installations. In addition revisions have been included in MEPA‟s Policy and<br />
Design Guidance 2005 to reduce planning barriers for solar photovoltaic installations and<br />
solar water heaters.<br />
Most of the solar energy used is solar thermal energy (particularly solar water heaters for<br />
domestic use) rather than electricity generated using PV. The Government has over the<br />
years introduced subsidies to support and increase penetration of RES aimed at the<br />
domestic consumer. The introduction of a fuel surcharge in 2005 to compensate for higher<br />
fuel prices as well as these Government support schemes are proving an increasing<br />
incentive for end consumers to invest in solar water heaters.<br />
During 2006, Government granted subsidies to around 1564 consumers for the installation of<br />
a solar water heater compared to around 360 consumers in 2005.<br />
Waste<br />
The first mechanical biological treatment plant (MBT) is expected to start treating and<br />
receiving waste by mid 2008 and this would treat approximately 71,000 tonnes of municipal<br />
solid waste which would generate approximately 7 GWh/annum of electricity (equivalent to<br />
0.26 % of electricity consumption in 2010). Two further MBTs are also planned to be<br />
constructed and when operational would generate an additional 18.68 GWh of electricity<br />
annually. This equivalent to around 0.66 % of electricity consumption of 2010.<br />
In addition existing closed landfills are also being rehabilitated and collection systems<br />
constructed to enable utilisation of good quality gases for production of electricity. In addition<br />
the production of biogas from Ta‟ Zwejra and Ghallis engineered landfills is being undertaken<br />
and it is expected that by mid 2007 capability for an estimated 2.63 GWh/annum may start to<br />
be generated annually. The installed power is expected to increase towards 2010 with an<br />
additional 1.3 MW of electrical power producing 11.4 GWh of electricity annually.<br />
Biofuels<br />
EU Directive 2003/30/EC on the promotion of the use of biofuels or other renewable fuels for<br />
transport was transposed into Maltese legislation through Legal Notice 528 of 2004. Malta<br />
has also submitted its national reports to the EU Commission in accordance with Article 4 on<br />
the implementation of this directive for 2004, 2005 and 2006. These annual reports outline:
MALTA - National study<br />
the measures taken to promote the use of biofuels or other renewable fuels to replace<br />
diesel or petrol for transport purposes;<br />
the national resources allocated to biomass for energy uses other than transport;<br />
total sales of transport fuel and the share of biofuels pure or blended, and other renewable<br />
fuels placed on the market for the preceding year.<br />
Biofuel production and use has seen significant penetration rates in Malta. Biodiesel<br />
accounted for 0.52% of total fuel used for road transport in 2005, a significant improvement<br />
on the 0.1% achieved in 2004 and 0.02% in 2003. This figure is in fact higher than the<br />
national indicative target of 0.3% which had been set for 2005. (Ministry for Resources and<br />
Infrastructure, 2004, 2005b, 2006b).<br />
Case Study 2: Biofuel Production - Edible Oil Refining Co. Ltd.<br />
Edible Oil Refining Co. Ltd. started operations in the early 1950s. Up to 1993 the company<br />
enjoyed a quasi-monopoly in vegetable oils in the Maltese internal market, but market share<br />
started being gradually eroded with a liberalization process<br />
In 2000 the EORC group embarked on a pilot project on the production of biodiesel from<br />
vegetable oils and fats. Trials were carried out for a 3 year period and during this time the<br />
company also carried out house trials on its fleet to ensure that optimum product would be<br />
developed prior to its launch on the market. In 2004, EORC launched its biodiesel and sold<br />
some 150,000 litres. In 2006 sales of biodiesel surpassed 1.7 million litres. Apart from reducing<br />
the amount of waste cooking oil finishing in the sewers, presently this process is serving as the<br />
only source of indigenous production of biofuels in Malta.<br />
The company considered that the most important issue was the sourcing of a reliable but<br />
competitive feedstock for the production of biodiesel since the use of virgin oils would have been<br />
far too expensive given the low price of fossil fuel prevailing at the time. The company realized<br />
that used cooking oil was a useful resource in this respect and which up to that time was being<br />
discarded and disposed in the waste stream. The company estimated that based on the total<br />
market sales of some 9,000 tons of material and taking into account European recovery statistics,<br />
the residual amount being disposed in the waste stream was some 3600 tons of fats and oils.<br />
Thus EORC implemented the following measures to recover used cooking oils from the waste<br />
stream:<br />
1. The catering sector was stimulated by offering up to 33% rebate in fresh oil for those clients<br />
returning used cooking oil.<br />
2. A number of strategic partnerships were struck between EORC and key entities<br />
including;<br />
(i) Malta Tourism Authority (MTA) where an audit trail and accountable system for all<br />
establishments processing and disposing of oils and fats were established. The document<br />
was also integrated and formed part of the licensing renewal conditions issued by the MTA.<br />
(ii) Wasteserve Ltd. for the use of biodiesel by government entities and corporations and the<br />
launch of a household collection scheme.<br />
(iii) Malta Hotels and Restaurants Association (MHRA) where members of MHRA were given<br />
special terms for the return of used oil.<br />
To address quality issues in the production of biodiesel EORC together with the University of<br />
Malta (Department of Engineering) set up a testing and evaluation process to test the biodiesel<br />
produced. The Malta Standards Authority on its part also defined the quality norms for biodiesel<br />
to be sold in Malta.<br />
445
446<br />
ENERGY AND SUSTAINABLE DEVELOPMENT IN THE MEDITERRANEAN<br />
Case Study: Biofuel Production - Edible Oil Refining Co. Ltd. (cont.)<br />
Marketing and Raising Consumer Awareness<br />
In marketing the product and to increase public awareness EORC implemented various<br />
measures. These included:<br />
1. An agreement reached with Enemalta on the retailing of fuels for transport in licensed service<br />
stations.<br />
2. Appointment of Malta‟s largest independent fuel distributor as its agent in the market for<br />
industry.<br />
3. Setting up a sales team and invested in an educational programme through the ministry<br />
responsible for the environment.<br />
4. Opening up of a good dialogue with the Malta Resources Authority ( the authority regulating<br />
the fuel sector in Malta) and agreement was reached on the form and manner in which<br />
biodiesel could be sold in the absence of a liberalized market<br />
5. Sending diesel mechanics overseas to get educated in bio diesel and its role<br />
6. Hosting three national seminars where the general audience, as well as specific audiences<br />
(engineers and key stakeholders such as station owners) were targeted. Foreign speakers<br />
were also invited to attend during these seminars.<br />
7. Joining Government‟s campaign on the “Clean the world”;<br />
8. Launching a mass media and public relations campaign including a household mail shot.<br />
9. A promotional and educational campaign was set up in schools where audio visual aids were<br />
used to support the project and its benefits. This included in station promotions where<br />
franchise girls in bio wear gave promotional material to young children. Consumers were<br />
educated on the use and application of biodiesel from an individual perspective as well as the<br />
environmental benefits associated with its use.<br />
Government Incentives<br />
Government on its part de-taxed biodiesel, and legislated its incorporation with fossil diesel at a<br />
maximum of 5% in line with the EU directive on the promotion of biofuels for road transport.<br />
Government also established a green procurement policy.<br />
Project’s Recognition, Key Outcomes and Results<br />
Bio diesel can today be sourced from 46% of the stations in Malta and Gozo. The project is<br />
mopping up some 1200 tons of waste material produced locally which would have otherwise<br />
been thrown in the waste stream.<br />
During 2005, total production of 100% biodiesel was around 1.492 Mlitres, of which 60% was<br />
used for transport purposes, and 40% for industrial use. The total amount of biodiesel sold for<br />
the transport sector was of 0.895 Mlitres. This increased compared to 0.18 Mlitres of biodiesel for<br />
road transport in 2004.<br />
Case Study: Biofuel Production - Edible Oil Refining Co. Ltd. (cont.)<br />
The project has also reached international acclaim when in 2005 it placed second in the BBC<br />
world challenge – (an international competition where 78 countries competed with 476<br />
environmental projects) and sponsored by BBC World, Shell and Newsweek. The project was<br />
also featured in the Newsweek magazine and on BBC World.<br />
The company has also attracted the participation in the world record breaking circumnavigation<br />
attempt being carried out in March / April 2007 and powered exclusively with 100% bio diesel.<br />
This will include the refuelling with biodiesel in Malta<br />
1. The key issues which have contributed to the success of the project have been<br />
2. Research
3. Product development<br />
4. Testing and road worthiness<br />
5. Education<br />
6. Marketing<br />
7. Promotion<br />
MALTA - National study<br />
8. Institutional support and legislative modification.<br />
Financial Instruments<br />
Government has introduced various financial support schemes aimed at increasing microgeneration<br />
from as well as passive use of RE. This includes:<br />
1) An increase in the refund on the purchase price of solar energy products for domestic<br />
premises from 15% to 25% [subject to a maximum of Lm100 (€ 233)]. In addition the<br />
network connection fee of Lm 70 (€ 163) is waived by Enemalta Corporation in the case<br />
of new households installing these systems.<br />
2) A grant of 25% on the purchase price of microwind systems (with a maximum generation<br />
capacity of 3.7 kW) and which are installed on domestic premises [subject to a maximum<br />
of Lm 100 (€ 233)].<br />
3) A grant of 20% on the purchase price of photovoltaic installations with a minimum size of<br />
1 kWp and less than 3.7 kWp on domestic premises. This grant is subject to a maximum<br />
of Lm 500 (€ 1166) with an additional grant of Lm 250 (€ 582) for every additional 1 kWp<br />
(±5%) above the minimum 1 kWp. In addition other support measures for such<br />
installations include:<br />
Waiving of the meter costs by Enemalta Corporation and amounting to Lm 20 (€ 47)<br />
fee for the installation of the meter necessary for the operation of the photovoltaic<br />
technology;<br />
Net metering for electricity generated from renewable energy sources with a spill tariff<br />
of 3c/kWh (€ 0.07/kWh) for any excess electricity fed into the grid.<br />
In addition Government has also introduced tax incentives measures for the promotion of<br />
biofuels, whereby the biomass content (i.e. percentage element) in biodiesel is exempt from<br />
the excise duty.<br />
In addition to the above in the Draft RES policy it is further noted that:<br />
1) Government will on its part seek to increase state funding in support schemes. Surplus<br />
electricity exported to the grid will be fairly valued taking into account the benefits<br />
associated with distributed generation;<br />
2) Government will give priority and seek to incentivise RES industries especially the solar<br />
thermal and solar photovoltaic industries. These include fiscal incentives, such as<br />
advantageous tax rates, special loans and loan guarantees, training grants and<br />
subsidised property rates;<br />
3) Permitting of large-scale RES projects will be facilitated, with public-private partnership<br />
schemes encouraged.<br />
4) Government will consider revisions to the building regulations and planning permits to<br />
make inclusion of solar water heating a mandatory element in all new housing, tourism<br />
and major retrofit projects. Exceptions will need to be approved where applicant clearly<br />
demonstrates that other energy efficiency measures have been included. (Government<br />
of Malta, 2006a)<br />
447
448<br />
ENERGY AND SUSTAINABLE DEVELOPMENT IN THE MEDITERRANEAN<br />
2.3 Energy e f ficiency e vo l u ti on – decoupling<br />
ENE_C03: Efficiency of Energy conversion and distribution<br />
Efficiency in energy conversion - Average operating efficiency:<br />
(i) Marsa steam plant = 27%<br />
(ii) Delimara Steam plant = 32%<br />
(iii) CCGT = 40%<br />
Note: Refer also Annex 1 Table 9 and Table 10<br />
Efficiency in electricity distribution:<br />
Losses in distribution and unaccounted for = 16 -18 %<br />
(Refer also
Table 2)<br />
2.3.1 Energy Intensity<br />
MALTA - National study<br />
Energy intensity is the ratio between gross inland consumption of energy (kgoe) and the<br />
GDP (000 EUR at constant 1995 prices). The gross inland consumption of energy is<br />
calculated as the sum of five energy types being coal, electricity, oil, natural gas and<br />
renewable energy sources.<br />
The energy intensity for Malta improved slightly from 337 to 292 between 1993 and 2004. An<br />
increase was registered in the mid- nineties as shown in Table 6. The energy intensity is<br />
however relatively high compared to EU 25 and EU 15 averages.<br />
The energy intensity was at its highest in 1998 at 347.7 kgoe/€ 1000.<br />
Table 6 Energy Intensity of the Economy (kgoe/1000 EUR)<br />
Energy Intensity of the Economy (Kgoe/1000 €)<br />
Malta EU 25 EU 15<br />
1993 337.04 239.89 211.85<br />
1994 310.28 231.34 206.10<br />
1995 320.23 230.39 205.38<br />
1996 339.67 234.98 209.35<br />
1997 342.32 227.58 202.71<br />
1998 347.70 224.16 201.03<br />
1999 332.28 214.94 195.69<br />
2000 303.23 208.76 190.53<br />
2001 266.59 209.71 191.35<br />
2002 263.88 206.51 188.42<br />
2003 284.16 207.56 189.48<br />
2004 292.35 204.89 187.48<br />
Source: Eurostat, 2006<br />
Source: Eurostat, 2006<br />
Figure 7 Energy Intensity of the Economy<br />
449
450<br />
ENERGY AND SUSTAINABLE DEVELOPMENT IN THE MEDITERRANEAN<br />
Table 7 gives an overview of the final energy consumption in households, trades, services,<br />
etc. covers all energy products consumed by private households, small-scale industry, crafts,<br />
commerce, administrative bodies, services (with the exception of transportation, agriculture<br />
and fishing) (Eurostat 2006).
MALTA - National study<br />
Table 7 Final Energy Consumption by households, trades, services, etc. (1000 toe)<br />
1993 1994 1995 1996 1997 1998 1999 2000 2001 2002 2003 2004<br />
EU (25<br />
countries)<br />
EU (15<br />
430493 420343 427073 457612 440217 442350 (p) 439731 440802 463627 450910 (p) 470440 (p) 471730 (p)<br />
countries) 363550 355823 362486 392982 376947 381663 (p) 378928 382866 402200 390452 (p) 409511 (p) 411361 (p)<br />
Malta 123 99 104 120 120 112 121 128 131 136 146 142<br />
Source: Eurostat 2006<br />
2.3.2 Efficiency in Electricity generation and Distribution<br />
The conversion efficiency in Malta‟s power stations is related to the age of the infrastructure<br />
where the average age of the steam turbines at Marsa Power Station is 45 years and the age<br />
of the boilers range from 19 to 37 years. At Delimara Power Station, the two steam units are<br />
14 years old while the combined cycle plant (CCGT) is 8 years old. The open cycle gas<br />
turbine at Marsa Power Station is 16 years old while those at Delimara Power Station are 11<br />
years old. The average operating efficiency of the operational steam plant at Marsa is 27%<br />
compared with an average efficiency of the steam plant at Delimara Power Station of 32%<br />
and of the CCGT plant of 40% (Enemalta Corporation, 2006b).<br />
During the past few years, various capacitors have been installed in key areas of the<br />
distribution network to improve the power factor, and further reduce losses. This has been<br />
accompanied by upgrading works to the 132 kV network to reduce current and losses in the<br />
network.<br />
Further opportunities exist to increase the efficiency and reduce energy losses in the<br />
generation and distribution processes. This includes:<br />
1) Replacement of old and inefficient power generation equipment with new plant;<br />
2) Greater use of renewable energy sources for power generation as well as for passive<br />
devices;<br />
3) Greater use of demand management to reduce need to generate electricity using<br />
inefficient peaking plant;<br />
4) Improvements in the power factors in the distribution network to reduce losses due to<br />
unnecessarily high currents.<br />
451
2.4 Renew able energy e vo l u ti on<br />
452<br />
ENERGY AND SUSTAINABLE DEVELOPMENT IN THE MEDITERRANEAN<br />
ENE_P02: Renewable energy share 5 in the total energy (2006)= 0<br />
The renewable energy share (electricity generated from RES) of the total energy balance is<br />
zero. Electricity generated from renewable energy sources in Malta is negligible<br />
(approximately 0.003% of electricity consumption).<br />
Currently solar thermal applications constitute Malta‟s main contribution to renewable energy<br />
and these also offset electricity generation. When solar thermal applications are included in<br />
the renewable energy share 6 then the contribution is estimated at 0.18% of the total energy<br />
share in 2006. The contribution of solar thermal applications is also estimated to be around<br />
0.28% of the electricity generated in 2006 7 . Solar thermal water heaters have seen a<br />
significant uptake in 2006 over previous years. In 2006 there were approximately 1564<br />
applications for subsidy on solar water heaters compared to around 360 in each of the two<br />
previous years – an increase of around 334 %.<br />
The other schemes however (photovoltaic and micro-wind) were insufficient to stimulate the<br />
market with only a limited number (2 participants) applying under the PV scheme and no<br />
take-up to the micro-wind scheme.<br />
The causes to the lack of response may also have been diverse for solar photovoltaic and for<br />
micro-wind. Despite the grant given to consumers, solar photovoltaic are still considered to<br />
be expensive and have relatively long payback periods. The total number of installations<br />
notified to, or authorised by, the Malta Resources Authority amount to 24 for a total capacity<br />
of 48 kWp.<br />
On the other hand, the lack of market response to micro-wind installations may also be<br />
attributed to general lack of knowledge by consumers to RES as well as planning barriers.<br />
5 For the purposes of calculating the RES share only “commercial energy” i.e. electricity generated from solar , hydraulic, wind<br />
and geothermal is required to be included in the calculation according the <strong>Plan</strong> Bleu Methodological Sheet for Priority Indicators<br />
MSSD7 ENE_P02 and from correspondence with <strong>Plan</strong> Bleu. Solar thermal applications (solar water heaters) are therefore being<br />
excluded for the purposes of reporting on this indicator.<br />
6 When biodiesel use is included, then the total renewable energy share (biodiesel + solar thermal applications) in the total<br />
energy share (electricity generation + road transport) in 2006 is estimated at 0.33 %<br />
7 Estimated based on 8,037 solar water heaters in operation with an average daily consumption of 3 kWh spread over 270 days.
MALTA - National study<br />
Property owner intending to install a micro-wind turbine are required to be obtain a full<br />
development permit for this installation.<br />
2.5 Existing or expecte d effects and bene f its of RE and R UE<br />
2.5.1 Job Creation and Investment<br />
The Draft Renewable Energy Policy for Malta highlights that additional benefits are expected<br />
to occur through job creation and investment in local production of components and systems,<br />
and in the training and certification of installers. Amongst the policy measures being<br />
proposed are:<br />
1) The strengthening and promotion of institutional capacities in education and information<br />
particularly through participation in the <strong>Mediterranean</strong> Renewable Energy Programme.<br />
2) the promotion of continuing professional development with respect to RES. Training,<br />
accreditation and certification of providers of RE equipment is essential to prevent<br />
against the negative effects of bad workmanship, poor installations and poor quality<br />
equipment;<br />
3) Collaboration and cooperation between the different agencies (University of Malta,<br />
Institute of Energy technology, Malta Council for Science and Technology (MCST), the<br />
Employment and Training Corporation (ETC), the Malta College for Arts, Science and<br />
Technology (MCAST)).<br />
4) Government will promote human resource development and training in these<br />
technologies to attract further enterprise and private investment to the country and<br />
creation of new jobs in the sector.<br />
5) Government encourages the participation of private enterprise. It will identify projects<br />
which are appropriate for implementation through „public private partnership‟<br />
arrangements, where the risks are shared between the parties (Government of Malta,<br />
2006a).<br />
2.5.2 Research and Development<br />
The Malta Council for Science and Technology (MCST) has been established as the national<br />
advisory body to Government on science and technology policy. The MCST is also the<br />
national agency responsible for management of the local RTDI programme and the national<br />
contact organisation for the Sixth Framework Programme.<br />
In 2006 the Government of Malta published the National Strategic <strong>Plan</strong> for Research and<br />
Innovation (NSRI) 2007-2010. This strategy presents a vision for Research and Innovation<br />
(R&I) in Malta based upon a set of underpinning strategic principles namely through<br />
1) addressing national issues;<br />
2) focusing on selected areas of economic performance;<br />
3) enabling SMEs to innovate;<br />
4) exporting locally generated R&I;<br />
5) expanding Malta‟s science, engineering and technology human capital base;<br />
6) establishing the nexus between the knowledge institutions and business;<br />
453
454<br />
ENERGY AND SUSTAINABLE DEVELOPMENT IN THE MEDITERRANEAN<br />
7) developing a national pro-Innovation culture supportive of invention, risk-taking and<br />
entrepreneurship (Government of Malta, 2006b).<br />
The NSRI notes that Malta Enterprise is currently engaged in a number of R&I policy<br />
development actions. It currently operates 22 schemes to support foreign direct investment<br />
and local enterprise.<br />
Amongst the support measures are soft loans (Regulation 8 and article 2B) to support<br />
enterprise through loans at low interest rates for part financing investments in qualifying<br />
expenditure. It is also aimed to encourage investment in plant and machinery first used in<br />
Malta and for research and development. The NSRI notes that the scheme is particular ideal<br />
for enterprises intent on increasing competitiveness through the acquisition of tangible and<br />
intangible capital assets for more effective and efficient production and supply of service;<br />
Innovation; and energy and water conservation.<br />
The NSRI recommends amongst others that “Government must leverage state R&I finances /<br />
funding to address pressing national issues relating to water, energy and the environment.”<br />
The NSRI notes that Government financing and State intervention over the period of the<br />
strategy should focus on various areas designated as platforms of strategic importance<br />
(PSI). These PSI include amongst other environment and energy resources with focus on<br />
solar, wind, and bio energy together with energy efficiency technologies, as well as water,<br />
desalination, waste rehabilitation technologies, soil and marine management.<br />
The Strategy places R&I as a fundamental pivot / driver of Maltese economy. The NSRI<br />
notes that only through establishing R&I within the economic and supporting institutional<br />
fabric can Malta aspire to be a knowledge economy. R&I is not seen as end goals but are<br />
considered as critical catalysts upon which growth and wealth are highly dependent – which<br />
in turn demands a primary focus towards business driven and applied R&I (Government of<br />
Malta, 2006b).<br />
The draft RES policy also notes a series of measures with respect to R&D namely:<br />
1) The MCST will seek to promote participation in research, development and<br />
demonstration projects and the development of innovative solutions with a view to<br />
reducing costs of solar power and offshore wind power and mitigation of environmental<br />
impacts.<br />
2) Government will support and promote participation by its own entities and nongovernmental<br />
organisations in EU funded RTD projects.<br />
3) Government will seek to promote research and innovation in application of RES to local<br />
conditions such as in solar thermal and cooling technologies and application of ground<br />
source heat pumps particularly for large buildings.<br />
4) Government will lead by example in the introduction of renewable energy technologies.<br />
Government will promote installation of photovoltaic systems and micro wind energy<br />
systems on public buildings and information and results of these demonstration projects<br />
disseminated to the public. (Government of Malta, 2006a).<br />
3. Proposals for more sustainable energy development<br />
3.1 Proposal for a sustainable energy d e ve l o pme n t<br />
Strategy for Sustainable Development<br />
Government‟s proposals for more sustainable energy development are outlined in the draft<br />
energy policy and the renewable energy policy as highlighted in section 2.1.2.<br />
In addition to this, the National Commission for Sustainable Development (NCSD) was<br />
established by the Environment Protection Act (Cap 435 of the Laws of Malta). Its functions<br />
are established in the same act. These include identification of relevant processes or policies<br />
which may be undermining sustainable development and propose alternative processes or
MALTA - National study<br />
policies to the Government for adoption and preparation of a National Strategy for<br />
Sustainable Development.<br />
The Commission is made up of representatives of a wide spectrum of Maltese society. It<br />
includes all Ministers or their representatives, two members of the House of Representatives,<br />
the Chairman of the Malta Council for Economic and Social Development, representatives of<br />
various public entities, the association of local councils and representatives of organisations<br />
which represent or have an interest in business, industry and/or industrial relations, scientific<br />
and academic bodies, the media, and other non-governmental organisations.<br />
The NCSD has since 2002 been involved in proposing and drafting a National Strategy for<br />
Sustainable Development. This National Strategy is now in its fourth draft. The process<br />
leading to its development included extensive public consultation and the involvement of<br />
government ministries, departments and public sector agencies. The Strategy has been<br />
adopted by the Commission for submission to the Cabinet of Ministers for possible<br />
endorsement by the Government of Malta.<br />
The sustainable development strategy proposes 20 priority areas for Malta. These areas<br />
were given major importance during the consultation process and the NCSD considered<br />
them as warranting foremost attention for the attainment of sustainable development goals in<br />
Malta. These priority areas were accompanied by indicators and targets. Of particular and<br />
direct relevance are the following priority areas:<br />
Climate Change<br />
The NCSD is recommending that steps are taken to reduce greenhouse gas emissions<br />
through transport policy and an energy policy that seeks to promote environmental<br />
protection, competitiveness and security of supplies, and as a result decouple the rate of<br />
growth of GHG emissions from economic growth.<br />
Air Quality<br />
The NCSD is proposing that remedial action is taken to control emissions of air pollutants<br />
(ambient levels of particulate matter, sulphur dioxide, carbon monoxide, benzene, lead,<br />
ozone, heavy metals and nitrogen oxides) and achieve compliance with European standards<br />
(National Commission for Sustainable Development, 2006).<br />
455
4. Annexes<br />
456<br />
ENERGY AND SUSTAINABLE DEVELOPMENT IN THE MEDITERRANEAN<br />
4.1 FUNCTIONS OF THE M AL T A R E SOURCE S AU T H O RITY<br />
Article 4 of the Malta Resources Authority Act, 2000 (Chapter 423 of the Laws of Malta)<br />
establishes that the Authority shall have the following functions:<br />
(a) to regulate, monitor and keep under review all practices, operations and activities<br />
relating to energy, water and mineral resources;<br />
(b) to grant any licence, permit or other authorisation, for the carrying out of any operation or<br />
activity relating to energy, water and mineral resources;<br />
(c) to regulate and secure interconnectivity for the production, transmission and distribution<br />
of the services or products regulated by or under this Act;<br />
(d) to ensure fair competition in all such practices, operations and activities;<br />
(e) to establish minimum quality and security standards for any of the said practices,<br />
operations and activities and to regulate such measures as may be necessary to ensure<br />
public and private safety;<br />
(f) to secure and regulate the development and maintenance of efficient systems in order to<br />
satisfy, as economically as possible, all reasonable demands for the provision of the<br />
resources regulated by or under this Act;<br />
(g) to carry out studies, research or investigation on any matter relating to the resources<br />
regulated by or under this Act;<br />
(h) to provide information and issue guidelines to the public and to commercial and other<br />
entities on matters relating to the said resources;<br />
(i) to regulate the price structure for any activity regulated by this Act and where<br />
appropriate to establish the mechanisms whereby the price to be charged for the acquisition,<br />
production, manufacture, sale, storage and distribution thereof is determined;<br />
(j) to establish the minimum qualifications to be possessed by any person who is engaged<br />
or employed in any activity regulated by or under this Act;<br />
(k) to establish measures for the protection of the environment in the practices, operations<br />
and activities regulated by or under this Act;<br />
(l) to ensure that international obligations entered into by the Government relative to the<br />
matters regulated by or under this Act are complied with;<br />
(m) to advise the Minister on the formulation of policy in relation to matters regulated by this<br />
Act, and in particular in relation to such international obligations;<br />
(n) otherwise to advise the Minister on any matter connected with its functions under this<br />
Act;<br />
(o) to formulate and implement the policies and strategies with short-term and long-term<br />
objectives, in relation to the activities regulated by this Act;<br />
(p) to perform such other functions as may from time to time be assigned to it by the<br />
Minister.<br />
In addition with respect to energy resources the Authority is also responsible for:<br />
(i) promoting, encouraging and regulating the harnessing, generation and use of all forms<br />
of energy; and<br />
(ii) encouraging the use of alternative sources of energy and for such purpose in<br />
accordance with such regulations as may be prescribed, to impose levies on energy<br />
produced by non renewable sources and grant subsidies in connection with the production of<br />
energy from renewable sources.
MALTA - National study<br />
Table 8 Power generated 1970- 2006<br />
Year Power generated -<br />
MWh<br />
1970/1971<br />
284,703<br />
1971/1972<br />
309,991<br />
1972/1973<br />
334,362<br />
1973/1974<br />
347,325<br />
1974/1975<br />
310,274<br />
1975/1976<br />
351,170<br />
1976/1977<br />
386,920<br />
1977/1978<br />
432,469<br />
1978/1979<br />
469,613<br />
1979/1980<br />
509,823<br />
1980/1981<br />
550,333<br />
1981/1982<br />
558,559<br />
1982/1983<br />
652,168<br />
1983/1984<br />
715,471<br />
1984/1985<br />
767,283<br />
1985/1986<br />
826,233<br />
1986/1987<br />
933,409<br />
1987/1988<br />
995,233<br />
1988/1989<br />
1,095,024<br />
1989/1990<br />
1,143,573<br />
1990/1991 1,180,396<br />
1991/1992 1,336,137<br />
1992/1993 1,351,802<br />
1993/1994 1,425,921<br />
1994/1995 1,547,512<br />
1995/1996 1,553,960<br />
1996/1997 1,580,787<br />
1997/1998 1,611,512<br />
1998/1999 1,723,722<br />
1999/2000 1,801,646<br />
2000/2001 1,825,689<br />
2001/2002 1,931,086<br />
2002/2003 2,082,922<br />
2003/2004 2,116,183<br />
2004/2005 2,214,892<br />
2005/2006 2,263,145<br />
Source: Enemalta Corporation<br />
457
458<br />
Unit<br />
ENERGY AND SUSTAINABLE DEVELOPMENT IN THE MEDITERRANEAN<br />
Table 9 Installed generating plant at Marsa Power Station<br />
Commissioning<br />
date1<br />
Age of<br />
plant<br />
(years) 1<br />
Nominal<br />
Rating<br />
(MW)<br />
Actual<br />
Rating<br />
(MW)<br />
Efficiency<br />
2 %<br />
Steam T/A 3 1970 36 30 30<br />
Steam T/A 4 1970 36 30 30 25<br />
Steam T/A 5 1982 (1952) 24 (54) 30 30<br />
Steam T/A 6 1983 (1952) 23 (54) 30 30<br />
Steam T/A 7 1984 (1952) 22 (54) 30 30<br />
Steam T/A 8 1987 (1959) 19 (47) 60 60 29<br />
Gas T/A 1 1990 16 37.5<br />
W 36.5<br />
S 30<br />
32 (at<br />
base<br />
load)<br />
Remarks<br />
Typical<br />
efficiency at<br />
part loads < 19<br />
%<br />
Bolier 3 1969 37 35 25 In service<br />
Bolier 4 1969 37 35 25 In service<br />
Bolier 5 1982 24 35 25 In service<br />
Bolier 6 1982 24 35 35 In service<br />
Bolier 7 1984 22 70 70 In service<br />
Bolier 8 1987 19 70 60 In service<br />
Notes: 1 Figure in brackets represents original commissioning abroad for reconditioned plant 2 Efficiency<br />
given is total unit efficiency (from combustion of fuel and includes auxiliary consumption).<br />
Source: Enemalta Corporation 2006b<br />
Unit<br />
Table 10 Installed generating plant at Delimara Power Station<br />
Commissioning<br />
date<br />
Age of<br />
plant<br />
(years)<br />
Nominal<br />
Rating<br />
(MW)<br />
Steam Unit 1 1992 14 60 60 32<br />
Actual<br />
Rating<br />
(MW) Efficiency % Remarks<br />
Steam Unit 2 1992 15 60 60<br />
W 36 S<br />
32<br />
Gas Turbine No 1 1995 11 37.5 30<br />
W 36<br />
Gas Turbine No 2 1995 11 37.5 S 30<br />
Combined Cycle<br />
<strong>Plan</strong>t 1998 8 110<br />
Source: Enemalta Corporation 2006b<br />
W 110 S<br />
90<br />
46 (at base<br />
load)<br />
Table 11 Current Retailed Petroleum Products (as on 1st January 2007)<br />
Unleaded Petrol 42c6 / litre<br />
Lead Replacement Petrol 45c6 / litre<br />
Diesel 38c9 / litre<br />
Kerosene 39c0 / litre<br />
Light Heating Oil 24c0 / litre<br />
Thin Fuel Oil 200 sec LM 136.50 / tonne<br />
Thin Fuel Oil 450 sec LM 130.00 / tonne<br />
Thin Fuel Oil 950 sec LM 120.00 / tonne<br />
Source: Enemalta Corporation 2006b<br />
Part load efficiency<br />
20%<br />
Part load efficiency<br />
20%<br />
Efficiency of 39%<br />
at typical operation
MALTA - National study<br />
Table 12 Summary of Electricity Tariffs (with effect from 1st January 2007)<br />
Summary of Electricity Tariffs applicable to supply Final Customers by Enemalta Corporation (From 1st January 2007)<br />
459
460<br />
ENERGY AND SUSTAINABLE DEVELOPMENT IN THE MEDITERRANEAN
MALTA - National study<br />
These tariffs are regulated by regulations 33, 34, 37, 38 and 39A of the Electricity Supply Regulations (as amended by Legal Notice 27 of 1999, Legal Notice 99 of 2003 and Legal<br />
Notice 132 of 2005, Legal Notice 409 of 2005, Legal Notice 37 of 2006, Legal N These tariffs may be subject to conditions, exceptions and exemptions that are not reproduced in<br />
this summary.<br />
Source: Malta Resources Authority<br />
461
5. Bibliography<br />
462<br />
ENERGY AND SUSTAINABLE DEVELOPMENT IN THE MEDITERRANEAN<br />
Commission of the European Communities, (2006). Commission Decision of 29 November 2006 concerning the<br />
national allocation plan for the allocation of greenhouse gas emission allowances notified by Malta in<br />
accordance with Directive 2003/87/EC of the European Parliament and of the Council.<br />
Enemalta Corporation (2006a). Electricity Distribution. http://www.enemalta.com.mt/page.asp?p=927&l=1<br />
accessed on 21st December 2006<br />
Enemalta Corporation (2006b). Electricity Generation <strong>Plan</strong> 2006 – 2015. Enemalta Corporation. Malta<br />
European Solar Thermal Industry Federation (2006). Solar Thermal Market in Europe. Trends and Market<br />
Statistics 2005. www.estif.org accessed on 2nd February 2007.<br />
Eurostat (2006). Environment and Energy.<br />
http://epp.eurostat.ec.europa.eu/portal/page_pageid=1996,45323734&_dad=portal&_<br />
schema=PORTAL&screen=welcomeref&open=/&product=Yearlies_new_environmen t_energy&depth=4<br />
accessed on 18th October 2006<br />
Government of Malta (2006a). A Draft Renewable Energy Policy for Malta. Government Press. Malta<br />
Government of Malta (2006b). National Strategic <strong>Plan</strong> for Research and Innovation 2007-2010. Building and<br />
Sustaining the R&I Enabling Framework. Government Printing Press, Malta.<br />
Government of Malta (2006c). National Strategic Reference Framework. Malta 2007-2013. Draft Document for<br />
Consultation. Malta<br />
Hackl, A. (2005). Report Waste to Energy. Scenarios for Waste Management Treatment in Malta. Report<br />
submitted to WasteServ Malta Ltd. 9th June 2005. Unpublished.<br />
Malta Environment and <strong>Plan</strong>ning Authority (2006). State of the Environment Report, 2005.<br />
Malta Freeport Terminals Ltd. (2007). Container Terminals – Traffic.<br />
http://www.freeport.com.mt/ContainerShipCalls.asp accessed on 22nd February 2007.<br />
Malta Resources Authority (2005). Offshore Wind Resource Potential. Part 1: Main Report. Part 2: Annexes. Draft<br />
Report. Unpublished.<br />
Ministry for Resources and Infrastructure (2007). Oil Exploration Department http://www.mri.gov.mt/oed.htm<br />
accessed on 8th January 2007<br />
Ministry for Resources and Infrastructure (2004). Report on the application of Directive 2003/30/EC (promotion of<br />
the use of biofuels or other renewable fuels for transport) in accordance with Article 4(1). Government of<br />
Malta, Malta.<br />
Ministry for Resources and Infrastructure (2005a). Report by Malta to the European Commission on the<br />
implementation of Directive 2001/77/EC on the promotion of electricity from renewable energy sources.<br />
Government of Malta, Malta.<br />
Ministry for Resources and Infrastructure (2005b). Report submitted to fulfil requirements of Article 4 of Directive<br />
2003/30/EC on the promotion of biofuels and other renewable fuels for transport. Government of Malta, Malta.<br />
Ministry for Resources and Infrastructure (2006a). A Proposal for an Energy Policy for Malta. Malta<br />
Ministry for Resources and Infrastructure (2006b). Malta’s Annual Report for 2005 submitted to fulfil requirements<br />
of Article 4 of Directive 2003/30/EC on the promotion of biofuels and other renewable fuels for transport.<br />
Government of Malta, Malta.<br />
Ministry for Rural Affairs and the Environment (2006). National Allocation <strong>Plan</strong> for Malta (2008 – 2012)<br />
submission to the EU Commission, September 2006.<br />
Ministry for Rural Affairs and the Environment (2004). National Allocation <strong>Plan</strong> for Malta (2005-2007) submission<br />
to the EU Commission, 18th October 2004.<br />
Ministry for the Environment (2001). A Solid Waste Management Strategy for the Maltese Islands. Office of the<br />
Director General, Floriana, Malta.<br />
Ministry of Finance (2006). Economic Survey October 2006. Government Press, Malta.<br />
Mott MacDonald (2005). Strategy for Renewable Electricity Exploitation in Malta. Final Report. Volume 1 &<br />
Annexes A – I. July 2005. Unpublished.<br />
National Commission for Sustainable Development (2004). A Sustainable Development Strategy for the Maltese<br />
Islands 2007-2016. Unpublished.<br />
National Statistics Office (2003). Household Budgetary Survey, 2000. National Statistics Office, Malta.<br />
Sammut, C. and Micallef A. (ed) (2004). The First Communication to the United Nations Framework Convention<br />
on Climate Change. Ministry for Rural Affairs and the Environment, Malta.
MALTA - National study<br />
Suri, M. Huld, T.A., Dunlop, E., (2004). Regional Differences of the PV Electricity Production in EU25 Countries,<br />
in 19th European Photovoltaic Solar Energy Conference and Exhibition 711 June 2004, Paris, France<br />
Sustech Consulting, International Biogas and Bioenergy Competence Centre IBBK (2005). Agricultural Waste<br />
Management <strong>Plan</strong> for the Maltese Islands. Draft Final Report. Unpublished.<br />
Water Services Corporation (2000). The Report for 1999-2000. Water Services Corporation, Malta.<br />
Water Services Corporation (2001). Annual Report 2000-2001 activities, statistics, environmental and water<br />
quality reviews. Water Services Corporation, Malta.<br />
Water Services Corporation (2006). Drinking Water Quality Project. ERDF 28. Unpublished.<br />
463
6. Table of illustrations<br />
464<br />
ENERGY AND SUSTAINABLE DEVELOPMENT IN THE MEDITERRANEAN<br />
Figure 1 Power Generation 1970- 2006 .................................................................................................................................... 423<br />
Figure 2 Environmentally compatible wind energy potential ....................................................................................................... 426<br />
Figure 3 Distribution System ..................................................................................................................................................... 429<br />
Figure 4 Development and forecast electricity demand (units generated) .................................................................................... 431<br />
Figure 5 Pressure Exchangers at Lapsi R.O. <strong>Plan</strong>t ....................................................................................................................... 441<br />
Figure 6 Total specific power - RO plants ................................................................................................................................... 441<br />
Figure 7 Energy Intensity of the Economy ................................................................................................................................... 449<br />
Table 1 Employment in Direct Production .................................................................................................................................. 424<br />
Table 2 Total Electricity Demand................................................................................................................................................ 431<br />
Table 3 Forecasts of Electrical Energy Consumption ................................................................................................................... 432<br />
Table 4 Desalination <strong>Plan</strong>ts ....................................................................................................................................................... 440<br />
Table 5 Average Electricity Prices .............................................................................................................................................. 442<br />
Table 6 Energy Intensity of the Economy (kgoe/1000 EUR) ........................................................................................................ 449<br />
Table 7 Final Energy Consumption by households, trades, services, etc. (1000 toe) .................................................................... 451<br />
Table 8 Power generated 1970- 2006 ....................................................................................................................................... 457<br />
Table 9 Installed generating plant at Marsa Power Station ......................................................................................................... 458<br />
Table 10 Installed generating plant at Delimara Power Station ................................................................................................... 458<br />
Table 11 Current Retailed Petroleum Products (as on 1st January 2007) .................................................................................... 458<br />
Table 12 Summary of Electricity Tariffs (with effect from 1st January 2007)................................................................................. 459
MAROC<br />
Berdai Mohamed, CDER (Centre de Développement des Energies<br />
Renouvelables)<br />
TABLE DES MATIERES<br />
I. Résumé .......................................................................................................................... 467<br />
1. Défis et durabilité énergétique............................................................................................................... 467<br />
2. Indicateurs chiffrés .................................................................................................................................. 468<br />
3. Les politiques d’ER et d’URE actuellement en place .......................................................................... 469<br />
4. Blocages, solutions possibles, réformes nécessaires ........................................................................ 469<br />
5. Success story............................................................................................................................................. 470<br />
II. Summary ....................................................................................................................... 471<br />
1. Challenges and Energy Sustainability ................................................................................................... 471<br />
2. Indicators in numbers .............................................................................................................................. 472<br />
3. Current RE and RUE policies ................................................................................................................... 472<br />
4. Obstacles, possible solutions, necessary reforms .............................................................................. 473<br />
5. Success story............................................................................................................................................. 473<br />
III. Etude Nationale ........................................................................................................... 475<br />
1. Situation énergétique du pays : indicateurs et données de base..................................................... 475<br />
2. Utilisation rationnelle de l’énergie (URE) - Energies Renouvelables (ER) : politiques,<br />
outils, progrès, effets induits ....................................................................................................................... 482<br />
3. Exemples de bonnes pratiques - Etudes de Cas .................................................................................. 493<br />
4. Pistes de réflexion pour un scénario de Développement Energétique plus durable ..................... 498<br />
5. Bibliographie ............................................................................................................................................. 502<br />
6. Table des illustrations .............................................................................................................................. 503<br />
Annexe 1 ........................................................................................................................................................ 504<br />
Annexe 2 ........................................................................................................................................................ 505<br />
Annexe 3 ........................................................................................................................................................ 506<br />
Annexe 4 ........................................................................................................................................................ 507<br />
Annexe 5 ........................................................................................................................................................ 508
I. RESUME<br />
1. Défis et durabilité énergétique<br />
MAROC - Résumé<br />
Dans un contexte de forte croissance économique, plus de 8 %, entretenue par le<br />
déploiement de programmes stratégiques d’infrastructure et de développement (autoroutes,<br />
ports, aéroports, habitat, santé, tourisme, eau potable, électrification rurale, agriculture,<br />
industrie…), l’évolution de la demande énergétique s’est établi en 2005 à près de 5%, avec<br />
plus de 8 % pour l’électricité, 5 à 6 % pour les GPL et 3 % pour les autres produits pétroliers.<br />
Aussi les défis énergétiques auxquels fait face le Maroc, pays non producteur d’énergies<br />
fossiles, restent nombreux et diversifiés tels que :<br />
la forte dépendance des énergies fossiles avec importation de 96% des besoins. En 2005,<br />
la consommation d’énergies commerciales s’est élevée à 12.3 MTEP (charbon 30.2%,<br />
produits pétroliers 62%, GN 3.1%, Eolien 0.4%, Electricité importée 1.7%, et Hydroélectricité<br />
3%).<br />
La base de consommation en énergie commerciale, ramenée à l’habitant, «faible» avec<br />
0.41TEP/hab./an et 480 kWh/hab./an, induisant une intensité énergétique raisonnable de<br />
0.26, bien que de fortes disparités existent entre catégories de consommateurs et<br />
présentant un potentiel de croissance élevé.<br />
Les besoins en investissement supérieurs à un milliard Euros par an.<br />
Les coûts d’accès contraignants en raison du poids de la compensation des produits<br />
pétroliers assurée par l’Etat (700 Millions d’Euros environ en 2005), du poids de la facture<br />
énergétique, près de 3.5 Milliards d’Euros (20% du montant global des importations), d’un<br />
système de péréquation des tarifs urbain/rural tirant les coûts de l’électricité vers le haut<br />
tout comme la courbe de charge électrique qui présente un pic de demande élevé le soir<br />
(3700 MW par rapport à un appel de 2200 MW en heures creuses en 2006).<br />
L’impact sur l’environnement notamment en termes d’émissions de gaz à effet de serre<br />
(60% des émissions sont liées à l’énergie) et en terme de pression sur la ressource<br />
forestière avec une consommation de biomasse pour le chauffage et la cuisson en milieu<br />
rural estimée à 3.3 MTEP, générant la perte de quelques 30000 hectares de forêts<br />
annuellement et reflétant un accès encore limité aux services énergétiques modernes<br />
dans ces zones.<br />
A ces défis les pouvoirs publics répondent par une stratégie visant :<br />
la sécurisation de l’approvisionnement par la mise à niveau des installations de raffinages,<br />
l’augmentation des capacités de stockage et de réception des produits pétroliers au<br />
niveau des ports et le renforcement des interconnexions électriques et gazières avec<br />
l’Espagne et l’Algérie,<br />
la diversification des sources d’énergie par l’introduction du gaz naturel, le maintien des<br />
efforts de prospection pétrolière et l’encouragement au recours aux énergies<br />
renouvelables,<br />
la généralisation de l’accès à l’énergie en particulier à travers le Programme Global<br />
d’électrification rurale (PERG) qui étend le service électrique en une décennie (taux actuel<br />
de 90% au lieu de 20% en 1996), le renforcement de la distribution GPL et la promotion<br />
d’expertise et de services de proximité par le biais de micro entreprises de services<br />
(Maisons Energies),<br />
l’optimisation des coûts par la libéralisation progressive des marchés, la restructuration<br />
des filières à travers une réforme profonde du secteur : l’indexation partielle des coûts sur<br />
les prix du marché international, l’homogénéisation fiscale,<br />
la maîtrise de la consommation de l’énergie en particulier à travers des programmes de<br />
DSM et une tarification incitative,<br />
467
468<br />
ENERGIE ET DEVELOPPEMENT DURABLE EN MEDITERRANEE<br />
la sécurité et le contrôle énergétique, la préservation de l’environnement.<br />
En ce qui concerne les préoccupations environnementales, le Maroc fait également face à<br />
nombres de défis liés aux questions énergétiques tels l’amélioration de la qualité des<br />
carburants par la production de diesel 10 et 50 ppm et la suppression du plomb dans<br />
l’essence, la sécurité d’approvisionnement en eau potable secteur hautement vulnérable, la<br />
substitution du bois de feu par le GLP et les énergies renouvelables comme contribution à la<br />
lutte contre la déforestation ou encore l’atténuation des impacts environnementaux de la<br />
forte urbanisation notamment par la prise en considération des aspects énergétiques au<br />
niveau des bâtiments, des plans de circulation ou de la gestion des déchets.<br />
Aujourd’hui, la prise de conscience sur les questions énergétiques est réelle, en témoigne<br />
l’intérêt grandissant que portent décideurs institutionnels, élus, opérateurs économiques et<br />
société civile à cette problématique. L’incertitude sur l’évolution des coûts en est la raison<br />
principale compte tenu des systèmes tarifaires en vigueur au Maroc.<br />
Il est toutefois difficile d’apprécier le degré de durabilité du développement énergétique, le<br />
mixte énergétique projeté pour le pays restant basé pour l’essentiel sur les énergies fossiles<br />
d’une part et d’autre part le maintien de pratiques de développement sectoriel au détriment<br />
d’approches intégrées ne facilite pas la prise en compte des questions énergétiques et<br />
environnementales de manière transversales, le tout relevant plus d’un scénarii tendanciel.<br />
2. Indicateurs chiffrés<br />
Les énergies renouvelables contribuent à hauteur de 4% au bilan énergétique national (hors<br />
biomasse) et sont à l’origine de la production de près de 10% de l’énergie électrique, grâce à<br />
l’effort important de mobilisation de la ressource hydraulique ainsi qu’à l’effort d’implantation<br />
de premiers parcs éoliens (64 MW installés et 240 MW en cours de mise en place). Il y a lieu<br />
de noter que de manière générale les énergies renouvelables font l’objet d’un portefeuille de<br />
projets diversifié (centrale thermo solaire, station de pompage turbinage hydraulique,<br />
valorisation énergétique des déchets, pompage de l’eau, dessalement de l’eau de mer,<br />
climatisation et chauffage solaire de l’eau sanitaire,….) s’impliquant ainsi dans divers<br />
programmes économiques et sociaux comme c’est le cas du programme d’électrification<br />
rural dont les objectifs sont pris en charge à hauteur de 7% par les systèmes solaires<br />
photovoltaïques individuels.<br />
Les ressources sont importantes avec en particulier une estimation pour l’éolien de 6 GW, un<br />
marché potentiel du solaire thermique d’un million de M², et des possibilités importantes de<br />
valorisation de la biomasse (9 millions ha de forêts et vocation agricole du pays). En terme<br />
de tendance, les attentes vis-à-vis de cette filière sont importantes de la part des<br />
institutionnels, des opérateurs économiques ou tout simplement des consommateurs.<br />
Malheureusement la croissance des marchés reste faible en raison des contraintes qui sont<br />
traitées ci-dessous.<br />
L’expérience en matière d’efficacité énergétique est aussi diversifiée que celle des énergies<br />
renouvelables. Elle s’est articulée autour de projets de renforcement de capacité et de<br />
développement d’expertise nationale (bureaux d’études spécialisés), de mise à niveau<br />
énergétique et environnementale d’unités industrielles ou tertiaires, d’actions pilotes et<br />
d’accompagnement technique et financier pour la réalisation des recommandations des<br />
audits. La visibilité et l’impact de ces actions restent limités en raison de l’approche projet<br />
adoptée au détriment de l’approche programme global et pérenne.<br />
Cette expérience a porté sur le bâtiment, l’industrie et la préservation de ressources (ex bois<br />
de feu). Globalement le potentiel d’économie d’énergie est supérieur à 15% (17% dans le<br />
secteur industriel avec temps de retour sur investissement de 18 mois). Celui de la<br />
cogénération est de 400 MW. Comme pour les énergies renouvelables, la sensibilité des<br />
institutionnels, des opérateurs économiques et des consommateurs est forte, les tarifications<br />
énergétiques en vigueur aidant (indexation partielle des coûts des produits pétroliers sur les<br />
prix internationaux, tarification par tranches pour l’électricité BT, tarification tri-horaire pour la<br />
MT et la HT).
MAROC - Résumé<br />
3. Les politiques d’ER et d’URE actuellement en place<br />
A l’occasion du débat national sur l’énergie organisé en octobre 2006, les énergies<br />
renouvelables et l’efficacité énergétique prennent place aux côtés des produits pétroliers et<br />
de l’électricité comme secteur à part entière. En témoigne l’annonce faite par les pouvoirs<br />
publics du « Programme National de Développement des EnR et de l’Efficacité<br />
Énergétique » dont l’objectif principal est de rehausser la contribution des Énergies<br />
Renouvelables à 20% du bilan électrique national et 10% du bilan énergétique à l’horizon<br />
2012 avec en sus une économie d’énergie de près de 800 MTEP.<br />
La concrétisation de ces objectifs se traduira par l’implantation de nouveaux parcs éoliens<br />
totalisant une puissance installée de 1200 MW, l’extension de services énergétiques<br />
durables décentralisés au profit de 300 000 foyers ruraux, la promotion de la production de<br />
biocarburants, l’élaboration d’un code d’efficacité énergétique dans le bâtiment et<br />
l’accompagnement des opérateurs dans sa mise en place, l’encadrement d’action de gestion<br />
de la demande énergétique au profit des secteurs tertiaires et industriels.<br />
Le cadre légal, réglementaire et incitatif pour ce programme est en cours de validation, il<br />
comprend :<br />
Une Loi cadre Efficacité Energétique, Energies Renouvelables.<br />
Fonds de financement pour soutenir les programmes d’efficacité énergétique et énergies<br />
renouvelables.<br />
Un décret autorisant l’accès des autos producteurs d’électricité au réseau et le<br />
rehaussement du seuil de production de 10 MW à 50 MW.<br />
La restructuration du CDER en Agence opérationnelle de mise en œuvre de la politique<br />
nationale énergies renouvelables et efficacité énergétique.<br />
Il est intéressant de noter que cette approche s’intègre dans un programme global de<br />
réforme du secteur de l’énergie soutenu par la Banque Mondiale à travers un prêt de<br />
politique de développement énergie. La GTZ qui soutient également ce processus intervient<br />
au niveau du développement du dispositif réglementaire d’application de la loi cadre et de<br />
l’accompagnement dans la mise en œuvre de celui-ci.<br />
Les activités de promotion entamées concernent, la préparation des nouveaux parcs éoliens<br />
et la sensibilisation des autos producteurs potentiels, le lancement du projet de<br />
réglementation thermique du bâtiment avec le soutien du GEF, du PNUD et du<br />
Gouvernement italien, la généralisation des applications solaires thermiques et de LBC au<br />
niveau du parc immobilier publique, l’optimisation de la gestion de l’éclairage publique avec<br />
les collectivités locales, la préparation d’actions DSM dans le cadre de programme de mise à<br />
niveau des PME et PMI.<br />
4. Blocages, solutions possibles, réformes nécessaires<br />
Le dispositif réglementaire mentionné est appelé à lever progressivement nombre de<br />
barrières et obstacles qui limitent le développement à grande échelle des énergies<br />
renouvelables et de l’efficacité énergétique.<br />
Ainsi au niveau incitatif et institutionnel, il y a lieu de noter essentiellement, l’absence de<br />
cadre réglementaire régissant ce secteur, l’absence d’une agence opérationnelle dédiée à<br />
cette activité, la faible considération des ENR et de l’EE par les programmes nationaux de<br />
développement permettant de donner l’exemple et de garantir une demande durable pour les<br />
technologies et services Enr et EE, l’iniquité fiscale pour avoir des conditions de marché<br />
incitatives,<br />
D’un autre côté, bien que les aspects technologiques ne constituent pas une barrière, il reste<br />
que la prise en compte d’Approches Qualité Globale reste limitée, le renforcement des<br />
capacités est insuffisant (public et privé) tout comme l’information et la sensibilisation du<br />
grand public, la Recherche & Développement base d’innovation et d’adaptation<br />
d’équipement et services au contexte spécifique national est réduite.<br />
469
470<br />
ENERGIE ET DEVELOPPEMENT DURABLE EN MEDITERRANEE<br />
Enfin au niveau financier, l’approche projet pratiquée longtemps ne favorise pas les<br />
investissements, en particulier pour le développement de l’offre, réduisant la visibilité, les<br />
configurations de financement usuelles (IPP) restent contraignantes en terme de coût, et les<br />
opérateurs financiers qui s’intéressent fortement au secteur de l’énergie conventionnel,<br />
restent distants par rapport aux Ent et l’EE, enfin la valeur ajoutée des projets Enr ou d’EE<br />
en termes de préservation d’emploi, de génération de nouveaux investissements ou encore<br />
de créations d’emploi n’est pas prise en compte.<br />
Le dispositif prévu par les pouvoirs publics pour la promotion des Enr et de l’EE est judicieux.<br />
Il est important pour une réelle concrétisation des orientations retenues de disposer au<br />
niveau des réformes envisagées :<br />
D’un système réglementaire plus intégré énergie & environnement tourné vers<br />
l’opérationnel.<br />
D’une base normative large, obligatoire promue au moyen de labellisation.<br />
D’une stratégie de mobilisation des opérateurs privés pour une disponibilité d’offres<br />
d’équipements de services de qualités, de modes de financements adaptés et de<br />
mécanismes assurant une bonne articulation entre les interventions des différents acteurs<br />
et une réelle durabilité des marchés.<br />
Des moyens d’accompagnement et de contrôle nécessaires souvent parent pauvre de<br />
politiques Enr et EE.<br />
D’une stratégie de renforcement des capacités et de sensibilisation pour l’émergence<br />
d’une culture Enr et EE au niveau du grand public.<br />
D’une base partenariale (publique & privé) novatrice oeuvrant pour un positionnement<br />
régional des opérateurs.<br />
5. Success story<br />
L’Efficacité énergétique, une voie pour découpler croissance économique et croissance de la<br />
demande énergétique.<br />
Les projets d’efficacité énergétiques en milieu professionnel, le PROMASOL, programme de<br />
transformation du marché des chauffe-eau solaires (CES), le programme de mise à niveau<br />
énergétique des hammams et fours boulangeries par la diffusion de technologies améliorées<br />
d’économie de bois, la promotion d’expertise et de services énergétiques de proximité, sont<br />
des programmes porteurs d’efforts d’innovations techniques, d’organisation et de<br />
financement.<br />
Ils permettent aujourd’hui au Centre de Développement des énergies renouvelables le<br />
développement conceptuel du programme d’efficacité énergétique dans le bâtiment collectif<br />
suivant un processus de capitalisation des mécanismes promotionnels, de consolidation des<br />
partenariats et d’accompagnement des chantiers stratégiques de construction<br />
d’infrastructures relevant ses secteurs de la Santé, l’Habitat, l’éducation nationale,<br />
l’Hôtellerie et les Collectivités Locales.<br />
Il s’agit d’une intégration horizontale des préoccupations énergétiques dans l’acte de bâtir<br />
englobant la réglementation thermique du bâtiment, la normalisation et la labellisation<br />
(conception architecturale, matériaux de construction, équipements énergétiques), le<br />
développement normatif et de guides techniques pour les professionnels, le renforcement de<br />
capacité des intervenants publics et privés, la réalisation d’un programme pilote touchant les<br />
secteurs clé mentionnés, le financement durable à travers les ressources budgétaires des<br />
établissements.<br />
Le programme résulte d’une maturation conjointe de l’approche chez les partenaires<br />
convaincus de la nécessité d’œuvrer ensemble pour répondre aux besoins et à l’exigence de<br />
confort croissante en contribuant à la maîtrise la demande énergétique du pays, à la<br />
préservation de l’environnement et à l’optimisation de la gestion budgétaire des<br />
établissements.
II. SUMMARY<br />
MAROC - Summary<br />
1. Challenges and Energy Sustainability<br />
In Morocco, economic growth is strong, above 8%, and is sustained by the deployment of<br />
strategic programs for infrastructure development (motorways, ports, housing, health,<br />
tourism, drinking water, rural electricity, agriculture, industry). In 2005, energy demand<br />
accounted for approximately 5%, with over 8% for electricity, 5 to 6% for gas and 3% for<br />
other oil products.<br />
Morocco is not a fossil energy producer and as such faces many diversified challenges:<br />
High dependency on fossil energy imports (96% of national requirements). In 2005,<br />
energy consumption reached 12.3 Mtoe (coal 30.2%, oil products 62%, natural gas 3.1%,<br />
wind 0.4%, imported electricity 1. 7%, and hydropower 3%).<br />
Basic energy consumption per capita remains low, at 0.41 toe/capita/year and at 480 kWh<br />
per capita/year. Energy intensity levels are still reasonable, at 0.26. However, disparities<br />
between consumer categories are high and show strong potential for growth.<br />
Necessary investments exceed 1 bn €/year<br />
Access costs are high due to the State’s support of oil products (around 700 M € in 2005)<br />
to high electricity prices, nearing 3.5 bn € (20% of global imports); urban/rural price<br />
equalisation systems and the evening consumption peaks (3 700 MW vs 2 200 MW during<br />
off-peak hours in 2006) further increase electricity costs<br />
The environmental impact in term of greenhouse gas emissions (60% from industry) and<br />
of the pressure on forests is high: in rural areas, biomass is used for heating and cooking<br />
and consumption is estimated at 3.3 Mtoe, generating annual losses of some 30 000<br />
hectares of forest surface and indicating that access to energy supply services is still<br />
limited in these areas.<br />
The public authorities have developed a strategy:<br />
To secure supply through the upgrading of refineries, increasing oil storage and reception<br />
capacity in the ports and reinforcing electric and gas grid connections with Spain and<br />
Algeria;<br />
To diversify energy sources with the introduction of natural gas, sustained oil exploration<br />
efforts and promotion of RE use;<br />
To generalize access to energy through the Global Rural Electrification Program (PERG),<br />
aiming at extending the scope of electrical services over the next ten years (current rate at<br />
90% vs 20% in 1996), promoting the supply of LPG and the development of local<br />
expertise and services through the creation of micro-enterprises (Maisons Energies);<br />
To optimize costs through gradual market liberalization and in-depth reforms of the energy<br />
sector: partial indexation of costs on international market prices, coherent taxation;<br />
To control energy consumption through DSM programs and more incentive pricing;<br />
To ensure secure energy supply and control, and environmental protection.<br />
In its efforts to cover environmental requirements, Morocco is working on projects to improve<br />
the quality of fuels through the production of 10 and 50 ppm diesel and to stop leaded fuel<br />
supply, to secure the highly vulnerable supply of drinking water, to promote the use of gas<br />
instead of firewood, to use renewable energies (RE) for combating deforestation and to<br />
mitigate the environmental impacts of urban sprawl, by considering Opportunities for Energy<br />
Efficiency in Buildings, traffic and waste management plans …<br />
Awareness on energy issues is widespread in the country, as demonstrated by the interest<br />
shown by institutional decision-makers, politicians, economic stakeholders and civil society,<br />
spurred by the uncertain evolutions of costs resulting from the national pricing system.<br />
471
472<br />
ENERGIE ET DEVELOPPEMENT DURABLE EN MEDITERRANEE<br />
The degree of sustainability in energy development is difficult to assess, as national plans for<br />
energy mix are still essentially based on fossil energies and on sector-based development<br />
practices to the detriment of integrated approaches. A trend scenario would be required to<br />
facilitate global coverage of energy and environmental issues.<br />
2. Indicators in numbers<br />
Renewable energies (RE) represent 0.4% of the national energy balance (excluding<br />
biomass) and nearly 10% of electricity production, supported by strong hydropower sources<br />
and the newly installed wind energy parks (64 MW installed and 240 MW under deployment).<br />
Many initiatives are dedicated to RE such as solar power plants, pumping stations, hydraulic<br />
turbines, waste recycling, water pumps, sea water desalination, air conditioning and solar<br />
water heaters. RE is also the focus of many economic and social programs, as in the case of<br />
rural electrification, where individual photovoltaic solar systems account for 7% of energy<br />
production.<br />
Energy sources are significant. Forecasts estimate wind energy potential at 6 GW, the solar<br />
heater market at 1M m 2 , and highlight strong potential for biomass enhancement (9 million<br />
hectares of wooded areas and strong national agricultural traditions). The expectations in this<br />
field are high among institutional stakeholders, economic players and also consumers.<br />
Unfortunately, as explained hereafter, developments are hindered by specific constraints.<br />
Experience in energy efficiency and RE is wide-ranging. Morocco has organized programs in<br />
capacity building and national expertise development (specialized design offices), in<br />
upgrading industrial and commercial infrastructures, in pilot projects and initiatives for<br />
technical and financial support in the preparation of audit recommendations. The visibility<br />
and impact of these initiatives remain limited due to the sector-based approach preferred<br />
over a more global and sustainable approach.<br />
The national expertise in renewable energy has been applied to construction, industry and<br />
protection of resources (firewood…). Globally, potential energy savings exceed 15% (17% in<br />
industry with an ROI time of 18 months). Potential in cogeneration is assessed at 400 MW.<br />
As in the case of RE, awareness is high among the institutional and economic stakeholders<br />
and among consumers and energy prices are attractive (partial indexation of oil costs on<br />
international market prices, pricing per tranche for low voltage electricity, peak and off-peak<br />
pricing for medium and high voltage).<br />
3. Current RE and RUE policies<br />
During the National Debate on Energy, held in October 2006, RE and RUE were considered<br />
as full-fledged energy sectors, on a par with Oil Products and Electricity. Indeed, the main<br />
objective of the National RE and RUE Development Program is to increase the share of RE<br />
in the national electricity balance by 20% and their contribution to the energy balance by 10%<br />
by 2012, aiming at energy savings of nearly 800 Mtoe.<br />
These goals will be achieved through wind energy installations with a total installed capacity<br />
of 1 200 MW, through the supply of sustainable and decentralized energy-related services to<br />
300 000 rural households, through the promotion of biofuel production, the design of energy<br />
efficiency approaches in construction and support to operators for implementation, and<br />
through energy demand management initiatives in favour of the industrial and commercial<br />
sectors.<br />
The relevant legislation, regulations and incentives are currently under validation and include<br />
such instruments as:<br />
a framework Law on energy efficiency and RE;<br />
support funds for energy efficiency and RE programs;<br />
a decree giving RE electricity self-producers access to the national grid and increasing the<br />
production threshold from the current 10 MW to 50 MW;
MAROC - Summary<br />
reorganization of the CDER as an operational agency to implement the national RE and<br />
energy efficiency policy.<br />
It is interesting to note that this approach is part of a global World Bank program to reform<br />
the energy sector, through loans to Energy Development Policies. GTZ also supports the<br />
process and contributes to the development of the regulatory implementation and support<br />
mechanisms for the framework law.<br />
With the support of GEF, UNDP and the Italian Government, promotional campaigns focus<br />
on new wind energy installations, on awareness-raising among potential energy selfproducers,<br />
and on the launch of solar heating regulations applicable to buildings. These<br />
campaigns also target the generalization of solar energy and Low Consumtion Light in the<br />
public housing sector, the optimization of street lighting management with local authorities,<br />
the preparation of DSM action plans within the framework of SME and SMI upgrading<br />
operations.<br />
4. Obstacles, possible solutions, necessary reforms<br />
The regulatory mechanism described above aims at removing the barriers and obstacles to<br />
the large-scale development of RE and energy efficiency.<br />
There are four main obstacles to incentives and institutional approaches: regulations are<br />
lacking, there is no dedicated agency, RE and energy efficiency are low priorities for national<br />
development programs dedicated to raising awareness and to ensuring sustainable demand<br />
in RE and energy efficiency technologies and services, and taxation does not provide<br />
attractive market conditions.<br />
Although technology is not in itself a barrier, consideration of global quality approaches<br />
remains limited and capacity expansion is insufficient (public and private). The same applies<br />
to the information and public awareness-raising. There are still too few national R&D efforts<br />
to develop and upgrade equipment and services.<br />
Lastly, from the financial standpoint, not only does the current approach reduce visibility, it is<br />
also unfavorable to investments, particularly as regards supply growth. Traditional funding<br />
mechanisms (PPI) are costly and financial operators favor the traditional energy sector over<br />
RE and energy efficiency. Finally, the added value of RE and RUE in employment and in<br />
attracting new investments is not taken into account.<br />
The mechanism developed by public authorities to promote RE and energy efficiency is<br />
highly favorable to the achievement of the objectives through relevant reforms:<br />
operational regulations which more fully integrate energy and environment;<br />
wide-ranging and mandatory standards promoted through labelling;<br />
strategies to pool private operators in favour of more available quality equipment and<br />
services, of adapted financial instruments and mechanisms to ensure proper alignment of<br />
stakeholder initiatives and genuine market sustainability;<br />
support and monitoring tools, all too often neglected in RE and energy efficiency policies;<br />
capacity expansion and awareness-raising strategies to educate the population in the RE<br />
and energy efficiency culture;<br />
innovative private and public partnerships to enhance the regional visibility of operators.<br />
5. Success story<br />
Energy efficiency: the tool to decouple economic growth and increased energy demand<br />
In Morocco, energy efficiency programs bring innovations in the field of technology,<br />
organization and funding. They include: PROMASOL, for the development of the solar water<br />
heater market, the use of improved wood savings technologies to upgrade hammams and<br />
bakery ovens, and promotional campaigns for local expertise and services.<br />
Within the framework of current national programs, the RE Development Center is working<br />
on designing the energy efficiency approach to collective housing. The approach involves<br />
473
474<br />
ENERGIE ET DEVELOPPEMENT DURABLE EN MEDITERRANEE<br />
capitalizing on promotional mechanisms, consolidating partnerships and supporting strategic<br />
infrastructure construction projects in the fields of Health, Housing, National Education,<br />
Hotels and Local Communities.<br />
This is a fully-integrated approach to energy in construction work. It covers heating<br />
regulations, standards and labels (architectural design, building materials and equipment),<br />
normative technical guidelines for professionals, the upgrading of the capacity of public and<br />
private operators, the development of a pilot program in the above-mentioned areas, and<br />
sustainable funding through the financial resources of the different institutions.<br />
The program was developed jointly by the partners, convinced of the need to cooperate in<br />
satisfying requirements and in meeting the ever stronger demand for comfort, by contributing<br />
to energy demand management, to environment protection and to optimized institutions<br />
budgets.
III. ETUDE NATIONALE<br />
MAROC - Etude Nationale<br />
1. Situation énergétique du pays : indicateurs et données de base<br />
1.1 Poi ds du secteur et spécificités insti tu ti onnelles<br />
1.1.1 Poids économique du secteur<br />
Avec un chiffre d’affaire de près de 38 Milliards de DH, le secteur de l’énergie contribue à<br />
hauteur de 7 % au produit intérieur brut. Il a généré en 2005, des recettes fiscales de 12,5<br />
MM DH et une facture pétrolière de 33 Milliards de DH, soit près de 20 % du total des<br />
importations. Le secteur qui emploie près de 30 000 personnes est fortement capitalistique.<br />
En 2005, les investissements qu’il a réalisés atteignent 10 milliards de DH.<br />
1.1.2 Ressources nationales en énergie observées et potentielles<br />
Le Maroc est un pays importateur net d’énergie sous forme de produits pétroliers, de<br />
charbon et d’électricité. En termes de ressources propres, Il dispose d’un potentiel en<br />
énergies renouvelables et efficacité énergétique considérable (Cf. chapitre II et IV suivants)<br />
et de gisements de schistes bitumineux intéressants.<br />
Schistes : Le Maroc dispose de grandes réserves de schistes bitumineux (REF 16). Le<br />
gisement de Timahhdit au centre renferme des réserves de 20 milliards de tonnes de<br />
schistes avec une teneur en huile de 7,3%, soit plus de 1,5 milliards de tonnes d’huile en<br />
place. Le gisement de Tarfaya au sud a des réserves prouvées de 73 milliards de tonnes<br />
avec une teneur moyenne de 5,7%, soit plus de 4 milliards de tonnes d’huile en place.<br />
L’étude de faisabilité d’un pilote de production d’électricité exploitant les schistes bitumineux<br />
est en cours<br />
Produits pétroliers : Malgré une politique d’exploration (REF 24) pétrolière beaucoup plus<br />
volontariste ces dernières années, soutenue par la promulgation en 2000 d’un nouveau code<br />
des hydrocarbures plus incitatif et la présence de bassins sédimentaires très prometteurs,<br />
les découvertes restent modestes et l’approvisionnement du pays est assuré pratiquement<br />
en totalité par les importations (REF 5).<br />
Quantité de Produits Pétroliers en<br />
1000 T<br />
Figure 1 Dépendance par rapport aux Produits Pétroliers<br />
Dépendance par rapport aux Produits Pétroliers<br />
7000<br />
6000<br />
5000<br />
4000<br />
3000<br />
2000<br />
1000<br />
0<br />
1955<br />
1970<br />
1980<br />
1990<br />
2000<br />
Production (1000 T)<br />
Consom. (1000 T)<br />
Charbon : a représenté 30.2 % de la consommation énergétique totale en 2005, soit en<br />
valeur absolue, dix fois plus qu’en 1980. Cette percée s’explique par le recours important au<br />
charbon (80 %) pour la production d’électricité (63%), le reste étant consommé<br />
essentiellement par les cimenteries. Les faibles ressources en charbon dont disposait le<br />
pays au niveau des mines de Jerrada, au Nord Est sont épuisées.<br />
475
476<br />
quantité de charbon en Tonnes<br />
7000000<br />
6000000<br />
5000000<br />
4000000<br />
3000000<br />
2000000<br />
1000000<br />
0<br />
ENERGIE ET DEVELOPPEMENT DURABLE EN MEDITERRANEE<br />
Figure 2 Dépendance par rapport au charbon<br />
Dépendance par rapport au charbon<br />
1955 1965 1970 1980 1990 2000 2003<br />
1.1.3 Spécificités institutionnelles et politiques de l’énergie<br />
con. Charbon T<br />
Charbon local T<br />
D’un point de vue institutionnel, la tutelle du secteur est assurée par le Ministère de l’Energie<br />
et des Mines dont la réorganisation récente (2003) a scindé la Direction de l’Energie en<br />
quatre Directions : Combustibles et Carburants, Electricité et Energies Renouvelables,<br />
Etudes et Observation, Contrôle.<br />
Au niveau opérationnel, la politique nationale est mise en œuvre par :<br />
l’Office National de l’Electricité (ONE) pour la production, le transport et partiellement la<br />
distribution qui fait l’objet, dans le cadre du projet de libéralisation progressive du secteur<br />
de l’électricité (REF. 25), d’un travail préparatoire de restructuration par sa transformation<br />
en société anonyme et sa filialisation.<br />
l’Office National de Hydrocarbures et des Mines pour l’exploration pétrolière et minière qui<br />
est le fruit de la fusion récente du Bureau des Recherches et Participations Minières avec<br />
l’Office National des Recherches et Explorations Minières.<br />
Le Centre de Développement des Energies Renouvelables pour la promotion de ces<br />
filières. Il fait l’objet actuellement d’un travail préparatoire de restructuration pour<br />
consolider son rôle opérationnel et l’extension de ses missions aux énergies<br />
renouvelables.<br />
L’Ecole Nationale de l’Industrie Minérale, institut supérieur de formation d’ingénieurs<br />
notamment au profit des industries minières et énergétiques,<br />
Toujours au niveau opérationnel, il y a lieu de noter le rôle déterminant joué par le privé,<br />
grâce à une mutation profonde du secteur, entreprise par les pouvoirs publics en 1994 et qui<br />
a porté sur :<br />
La Privatisation de l’activité de raffinage,<br />
La Privatisation totale de l’activité de distribution des produits pétroliers et la préparation<br />
de la libéralisation du marché,<br />
L’Introduction de la production d’Electricité Concessionnelle avec perte par l’ONE, du<br />
monopole de production,<br />
L’Introduction de la gestion déléguée pour les services de distribution d’eau, d’électricité<br />
et d’assainissement liquide,<br />
L’interconnexion gazière avec le Gazoduc Maghreb – Europe dans un cadre<br />
concessionnel privé,<br />
L’interconnexion électrique avec l’Espagne et l’Algérie<br />
L’Indexation des Tarifs des produits pétroliers sur le marché international et la réforme du<br />
système fiscale (stabilisation des recettes fiscales de l’Etat en aval au moyen de la TIC<br />
calculée sur la base du pouvoir calorifique des produits,
MAROC - Etude Nationale<br />
La mise en place d’une tarification de l’électricité sur une base tri horaire pour les clients<br />
THT, HT et MT et tarification par tranches (5) pour les abonnés BT,<br />
Cette mutation a permis l’émergence au niveau du paysage énergétique national,<br />
d’opérateurs privés pour la production d’électricité (Jorf Lasfar Energy Corporation,<br />
Compagnie Eolienne du Détroit, …), la distribution (Lydec à Casablanca, Redal à Rabat,<br />
Amendis à Tanger - Tétouan,…), la raffinage (groupe Coral),…<br />
Une nouvelle dynamique de réforme est aujourd’hui entamée, impulsée, il est vrai par la<br />
flambée des prix des produits pétroliers et la pression grandissante des différentes<br />
catégories de consommateurs. Avec le soutien de la Banque Mondiale qui accorde un prêt<br />
de politique de développement du secteur de l’énergie (REF 23) d’un montant global de 300<br />
millions de $ US les pouvoirs publics ont arrêté pour les 3 années à venir le programme de<br />
travail ci-après résumé :<br />
Stratégie d’Approvisionnement en énergie<br />
Stratégie des stocks de sécurité et mise en oeuvre<br />
Code Gazier<br />
Loi sur la Modernisation et la Libéralisation du secteur électrique<br />
Régulateur du secteur de l’électricité<br />
Loi sur l’EE et les EnR et décrets d’application<br />
Restructuration du CDER<br />
Mesures incitatives pour l’éolien<br />
Normes et standards pour l’EE et les EnR<br />
Application cohérente du principe de révision des prix des produits pétroliers<br />
<strong>Plan</strong> pour la réduction de la subvention du butane<br />
Accompagnement des consommateurs de butane à faibles revenus<br />
Elimination des goulots d’étranglement dans la chaîne logistique (déchargement et<br />
stockage) pour les produits liquides<br />
Arrêté sur les émissions des raffineries et des centrales électriques et mise en application<br />
de la réglementation des émissions<br />
Arrêté sur l’élimination du diesel 10,000ppm et de l’essence contenant du plomb<br />
Mise en place d’un système d’information sur l’énergie<br />
Indicateurs pour le suivi de la mise en œuvre de la politique de l’énergie<br />
1.2 Dema n de, offre et pr oduc ti on d’ énergie : évo luti on et<br />
s tr uc tu re<br />
Dans un contexte de forte croissance économique, plus de 8 % en 2006, entretenue par le<br />
déploiement de programmes de développement stratégiques, la croissance de la demande<br />
énergétique s’est établie en 2005 à près de 5% (REF 19), avec plus de 8 % pour l’électricité,<br />
5 à 6 % pour les GPL et 3 % pour les autres produits pétroliers.<br />
Principaux programmes de développement<br />
Initiative Nationale de Développement Humain (réduction de la pauvreté au niveau de 400<br />
communes rurales et 250 quartiers urbains, généralisation des services sociaux de base tels que<br />
l’eau potable, l’électrification rurale, la santé, … ), Habitat (100 000 nouveaux logements par an),<br />
Hôtellerie (10 millions de touristes en 2010), Mise à niveau et développement de l’infrastructure<br />
portuaire et aéroportuaire, Autoroutes (1500 KM), <strong>Plan</strong> émergence pour un développement<br />
industriel ciblé,…<br />
1.2.1 Evolution et structure de la demande d’énergie 1980 – 2003<br />
De 1980 à 2005, la consommation énergétique globale est passée de 4.6 millions de TEP à<br />
12.3 millions de TEP (REF. 3 et 5) avec une recomposition de structure mettant en exergue :<br />
la percée du charbon de 371 000 TEP à 3.7 millions de TEP, soit 10 fois plus en valeur<br />
absolue<br />
477
478<br />
ENERGIE ET DEVELOPPEMENT DURABLE EN MEDITERRANEE<br />
l’explosion de la consommation d’électricité avec une croissance annuelle moyenne de<br />
7%<br />
la baisse de la part des produits pétroliers de 85 % à 61%,<br />
l’introduction des ER (Eolien)<br />
l’introduction du gaz naturel<br />
l’importation de l’énergie électrique<br />
Le tableau ci-dessous reflète clairement les tendances de la politique énergétique retenue<br />
par les pouvoirs publics et qui visent la diversification des sources d’approvisionnement, la<br />
mobilisation des ressources locales, la généralisation de l’accès à l’énergie, l’intégration<br />
régionale des réseaux électriques et gaziers<br />
Tableau 1 Consommation d’Energie Primaire (extrait REF. 3)<br />
Par secteur, cette consommation est répartie comme suit :<br />
Industrie 32 %<br />
Résidentiel et tertiaire 41 %<br />
Transport 22 %<br />
Usages non énergétiques 5 %<br />
Notons enfin l’effort particulier fourni pour généraliser l’accès à l’électricité (Voir Etude de cas<br />
Chapitre 3) et qui a permis l’évolution du taux d’électrification rurale de 18 % en 1995 à 98%<br />
en 2007.<br />
1.2.2 Evolution et structure de la production (2005)<br />
L’Electricité<br />
Le parc de production est réparti entre les capacités propres de l’ONE (66 %), et celles des<br />
producteurs indépendants (34 %). La capacité des auto-producteurs reste très limitée.<br />
Tableau 2 Parc de production<br />
Production Parc ONE Production Indépendante Auto Production<br />
Puis. Installée<br />
Therm. charb<br />
Therm. GN<br />
Therm. Fioul<br />
Therm Diesel<br />
Turbine gaz<br />
Hydraulique<br />
Eolien<br />
Prod. Energie<br />
Thermique<br />
Hydraulique<br />
Eolien<br />
Sources ONE<br />
425 MW<br />
600 MW<br />
69 MW<br />
615 MW<br />
1729 MW<br />
4 MW<br />
6929 GWH 34.9 %<br />
5964 GWH 30 %<br />
965 GWH 4.9 %<br />
1360 MW<br />
384 MW<br />
50 MW 1 %<br />
12 031 GWH ~ 62 %<br />
JLEC 51 %<br />
Tahaddart 10 %<br />
206 GWH 1.1%<br />
86 GWH (0.4 %)
MAROC - Etude Nationale<br />
L’évolution de la production est présentée dans les tableaux ci-dessous (REF. 1) qui<br />
explicitent l’entrée en service de la STEP pour l’énergie hydraulique en 2003 et l’importance<br />
des importations qui ont atteint 16 % en 2000.<br />
Tableau 3 Production d’électricité (Extrait REF. 3)<br />
Tableau 4 Achat d’électricité<br />
Au niveau de la distribution, L’ONE acheteur unique de l’ensemble de la production, soit près<br />
de 20 TWH en 2005, gère une puissance d’appel de 3500 MW.<br />
Raffinage (REF 19 )<br />
Tableau 5 Distribution d’électricité<br />
Distribution ONE Régies & Concession. Clients directs<br />
Puissance 1500 MW<br />
42.8 %<br />
1700 MW 48.6 % 300 MW 8.6 %<br />
Energie 6456 GWH 8 474 GWH 48 % 2697 GWH 15 %<br />
Distribuée<br />
37 %<br />
La capacité de raffinage nationale est de 7,7 millions T/an. Elle se caractérise par un<br />
excédent en essences et en fuel et un déficit en gasoil et en butane.<br />
La mise à niveau en cours de cette infrastructure vise la suppression du gasoil à 1% de<br />
soufre, l’introduction du gasoil 50 ppm de soufre, la suppression de l’essence plombée et<br />
son remplacement par l’essence super sans plomb. L’investissement consenti s’élève à 700<br />
Millions de $. Un projet d’extension de la capacité nationale de raffinage est en cours de<br />
réalisation.<br />
Butane (REF 5 et 19)<br />
Avec une croissance de 5 à 6 % par an, la consommation du gaz butane a représenté en<br />
2005, 18 % de l’ensemble de la consommation des Produits Pétroliers contre 6 % seulement<br />
en 1980. La Production locale est de l’ordre de 200 000 T alors que les quantités importées<br />
en 2005 avoisinent 1200000 T. La capacité actuelle d’emplissage est de 1.5 millions de<br />
tonnes par an. Son extension et le développement de l’infrastructure y afférente nécessitent<br />
un investissement annuel de 500 millions DH (1.5 millions de nouvelles bouteilles Pour<br />
renforcer le parc existant de 30 millions de bouteilles 12 KG et 3 KG).<br />
479
Gaz Naturel<br />
480<br />
Quantité Butane (T)<br />
1800000<br />
1600000<br />
1400000<br />
1200000<br />
1000000<br />
800000<br />
600000<br />
400000<br />
200000<br />
0<br />
ENERGIE ET DEVELOPPEMENT DURABLE EN MEDITERRANEE<br />
Figure 3 Consommation butane<br />
Consom. Butane<br />
1970 1985 2005 2012<br />
L’introduction du gaz naturel dans le bilan énergétique du pays résulte de la construction du<br />
Gazoduc Maghreb - Europe (GME) dont la mise en service a eu lieu en novembre 1996. La<br />
capacité initiale de cet ouvrage était de 8,5 milliards M3 avant son extension à 12,5 milliards<br />
M3.<br />
Le premier usage du gaz naturel est industriel pour la production d’électricité : centrale à<br />
cycle combiné de Tahaddart, près de Tanger au nord, d’une puissance de 385 MW (10% de<br />
la production) et consommant près de 400 millions M3/an.<br />
En 2012, la consommation de gaz naturel projetée dans le cadre du projet du plan gazier,<br />
s’élèverait à 3,750 milliards M3 : Électricité (1,85 milliard M3) Raffinage (1,1 milliard M3),<br />
Industrie (800 millions M3).<br />
Pour la régulation de ce nouveau marché, un code gazier est en préparation au MEM.<br />
1.3 Impa cts et risques des évo luti o ns observé es et pr é vues<br />
Les défis énergétiques auxquels fait face le Maroc, pays non producteur d’énergies fossiles,<br />
restent nombreux et diversifiés tels que la garantie d’approvisionnement et maîtrise des<br />
coûts. La situation énergétique du pays se caractérise par :<br />
1.3.1 Dépendance et lourde facture énergétique<br />
La forte dépendance des énergies fossiles avec l’importation de 96% des besoins. En<br />
2005, la consommation d’énergies commerciales s’est élevée à 12.3 MTEP (charbon<br />
30.2%, produits pétroliers 62%, GN 3.1%, Eolien 0.4%, Electricité importée 1.7%, et<br />
Hydro-électricité 3%) ;<br />
Une importation d’électricité en forte croissance avec 6 % en 2006 et des prévisions à la<br />
hausse (près de 20 % en 2009) ;<br />
La base de consommation en énergie commerciale, ramenée à l’habitant, «faible» avec<br />
0.41TEP/hab./an et 480 kWh/hab./an, induisant une intensité énergétique à parité de<br />
pouvoir d’achat raisonnable de 0.1, bien que de fortes disparités existent entre catégories<br />
de consommateurs. Cette base de consommation présente un potentiel de croissance<br />
élevé. Une consommation supérieure à 1 TEP/hab./an est prévue à l’horizon 2030 ;<br />
Les besoins en investissement sont supérieurs à un milliard Euros par an ;<br />
Les coûts d’accès contraignants en raison du poids de la compensation des produits<br />
pétroliers assurée par l’Etat (700 Millions d’Euros environ en 2005) et du poids de la<br />
facture énergétique (RE. 19), près de 3.5 Milliards d’Euros (20% du montant global des<br />
importations) ;<br />
Les coûts d’accès sont contraignants également en raison d’un système de péréquation<br />
des tarifs urbain/rural tirant les coûts de l’électricité vers le haut tout comme la courbe de
MAROC - Etude Nationale<br />
charge électrique qui présente un pic (ANNEXE 4) de demande élevé le soir (3700 MW<br />
par rapport à un appel de 2200 MW en heures creuses en 2006) ;<br />
L’impact sur l’environnement notamment en termes d’émissions de gaz à effet de serre<br />
(60% des émissions sont liées à l’énergie (REF. 15) et en terme de pression sur la<br />
ressource forestière avec une consommation de biomasse pour le chauffage et la cuisson<br />
en milieu rural estimée à 3.3 MTEP, générant la perte de quelques 30000 hectares de<br />
forêts annuellement et reflétant un accès encore limité aux services énergétiques<br />
modernes dans ces zones.<br />
1.3.2 Gaz à effet de serre, Autres impacts sur l’environnement<br />
En ce qui concerne les préoccupations environnemental, le Maroc fait également face à<br />
nombres de défis liés aux questions énergétiques tels l’amélioration de la qualité des<br />
carburants par la production de diesel 10 et 50 ppm et la suppression du plomb dans<br />
l’essence, la sécurité d’approvisionnement en eau potable secteur hautement vulnérable en<br />
raison d’une situation de stress hydrique structurelle, la substitution du bois de feu par le<br />
GLP et les énergies renouvelables comme contribution à la lutte contre la déforestation et la<br />
désertification ou encore l’atténuation des impacts environnementaux de la forte urbanisation<br />
notamment par la prise en considération des aspects énergétiques au niveau des bâtiments,<br />
des plans de circulation ou de la gestion des déchets,.. , au niveau des nouvelles villes.<br />
Aujourd’hui, la prise de conscience sur les questions énergétiques est réelle, en témoigne<br />
l’intérêt grandissant que portent décideurs institutionnels, élus, opérateurs économiques et<br />
société civile à cette problématique. L’incertitude sur l’évolution des coûts et les risques de<br />
dégradation de l’environnement constituent les raisons principale de cette prise de<br />
conscience.<br />
Il est toutefois difficile d’apprécier le degré de durabilité du développement énergétique, le<br />
mixte énergétique projeté pour le pays restant basé pour l’essentiel sur les énergies fossiles<br />
d’une part et d’autre part le maintien de pratiques de développement sectoriel au détriment<br />
d’approches intégrées ne facilite pas la prise en compte des questions énergétiques et<br />
environnementales de manière transversales.<br />
Compte tenu de la croissance soutenue de la consommation d’énergie, le scénario de<br />
référence 2020 (émission de près 110 millions T CO2 ) sera confirmé par l’étude en cours,<br />
d’actualisation de l’inventaire des émissions de GES. L’étude sur le potentiel EnR du Maroc<br />
met en évidence des perspectives d’atténuation de 24 millions T CO2, plus importantes que<br />
le scénario d’atténuation proposé en 2001.<br />
1.4 Besoins de fi nancement et investisseme n ts (REF 13)<br />
A ces défis les pouvoirs publics répondent par une stratégie visant :<br />
la sécurisation de l’approvisionnement par la mise à niveau des installations de raffinages,<br />
l’augmentation des capacités de stockage et de réception des produits pétroliers au<br />
niveau des ports et le renforcement des interconnexions électriques et gazières avec<br />
l’Espagne et l’Algérie ;<br />
la diversification des sources d’énergie par l’introduction du gaz naturel, le maintien des<br />
efforts de prospection pétrolière et l’encouragement au recours aux énergies<br />
renouvelables ;<br />
la généralisation de l’accès à l’énergie en particulier à travers le Programme Global<br />
d’électrification rurale (PERG) qui étend le service électrique en une décennie (taux actuel<br />
de 90% au lieu de 20% en 1996), le renforcement de la distribution GPL et la promotion<br />
d’expertise et de services de proximité par le biais de micro entreprises de services<br />
(Maisons Energies) ;<br />
l’optimisation des coûts par la libéralisation progressive des marchés, la restructuration<br />
des filières à travers une réforme profonde du secteur : l’indexation partielle des coûts sur<br />
les prix du marché international, l’homogénéisation fiscale ;<br />
la maîtrise de la consommation de l’énergie en particulier à travers des programmes de<br />
DSM et une tarification incitative ;<br />
la sécurité et le contrôle énergétique et la préservation de l’environnement.<br />
481
1.4.1 Investissements 2007 – 2012<br />
482<br />
ENERGIE ET DEVELOPPEMENT DURABLE EN MEDITERRANEE<br />
Selon les récentes études (REF. 3) les prévisions de consommation d’énergie et d’électricité<br />
en 2015 se présentent comme suit :<br />
Consommation électricité: 38 000 GWH<br />
Parc Production Electricité : 12 600 MW (2.5 fois la capacité actuelle)<br />
Consommation Energies : ≥ 17 MTEP<br />
Pour faire face à ces besoins, le programme d’investissement annoncé par le MEM à<br />
l’horizon 2012 prévoit un total de 62,5 Milliards de DH, ventilés comme suit :<br />
Centrales électriques 47.5 milliards DH (ONE, IPP)<br />
Terminal gazier 11 milliards DH (ONE, SAMIR, AKWA Groupe)<br />
Mise à niveau de la Raffinerie 8 milliards DH (SAMIR)<br />
Exploration pétrolière 3 milliards DH (ONHYM et Opérateurs privés)<br />
Biodiesel 70 000 M3 (1.5 à 2 % de la consommation du gasoil,<br />
investissement privé)<br />
2. Utilisation rationnelle de l’énergie (URE) - Energies Renouvelables<br />
(ER) : politiques, outils, progrès, effets induits<br />
2.1 Politi q ues d’ utilisati o n ra ti o nne lle de l’énergie (URE) et<br />
d ’énergie re nouvelabl e (E R)<br />
A l’occasion du débat National sur l’Energie organisé en octobre 2006, Les énergies<br />
renouvelables et l’efficacité énergétique ont pris place aux côtés des Produits Pétroliers et de<br />
l’Electricité comme secteur à part entière. En témoigne l’annonce faite par les pouvoirs<br />
publics du « Programme National de Développement des ER et de l’Efficacité Énergétique »<br />
dont l’objectif principale est de rehausser la contribution des Energies Renouvelables à 20%<br />
du bilan électrique national et 10% du bilan énergétique à l’horizon 2012 (y compris<br />
Biomasse et hydraulique) et avec en sus une économie d’énergie de près de 800 MTEP. Ce<br />
positionnement par rapport aux ER et à l’EE est dû à la forte croissance des cours des<br />
produits pétroliers au niveau des marchés internationaux, à la forte croissance de la<br />
demande énergétique du pays, aux résultats concluant d’une réelle des ER notamment<br />
solaires et éoliennes.<br />
La concrétisation de ces objectifs se traduira par l’implantation de nouveaux parcs éoliens<br />
totalisant une puissance installée de près de 1200 MW, l’extension de services énergétiques<br />
durables décentralisés au profit de 150 000 foyers ruraux, la promotion de la production de<br />
biocarburants, l’élaboration d’un code d’efficacité énergétique dans le bâtiment et<br />
l’accompagnement des opérateurs dans sa mise en place ainsi que l’encadrement d’action<br />
de gestion de la demande énergétique au profit des secteurs tertiaires et industriels.<br />
Le cadre légal, réglementaire et incitatif pour ce programme est en cours de validation, il<br />
comprend :<br />
La loi cadre sur l’Efficacité Energétique (EE) et les Energies Renouvelables (ER) en cours<br />
d’approbation annonce les dispositions réglementaires qui seront précisées par décrets<br />
dont l’efficacité énergétique dans les bâtiments, l’industrie et les transports et le recours<br />
massif aux énergies renouvelables. Ce projet de loi annonce la préparation d’une<br />
réglementation thermique du bâtiment et des normes y afférentes, l’audit énergétique<br />
obligatoire à partir d’un seuil de consommation, l’optimisation de la consommation<br />
énergétique des collectivités locales au niveau de l’éclairage public et du transport, etc.<br />
Des incitations fiscales et financières sont également préconisées. Un fonds dédié à<br />
l’encouragement des investissements dans le domaine des énergies renouvelables est<br />
prévu et fait l’objet d’études d’approche par la Banque mondiale et la BEI ;<br />
La loi encourageant l’auto production d’électricité par le relèvement du seuil de production<br />
de 10 MW à 50 MW ainsi que par l’accès au réseau et le rachat de l’excès d’énergie<br />
produite (ce n’est pas encore le système incitatif de garantie d’achat de toute énergie<br />
produite par EnR pratiqué en Europe, le « Feed in Tarrif ») ;
MAROC - Etude Nationale<br />
Rémunération : 8cMAD/KWh, ramenée à 6cMAD/kWh pour toute énergie transportée<br />
avant 2009 ;<br />
Achat de l’excédent de l’énergie produite moyennant une rémunération augmentée de<br />
20% par rapport aux tarifs commerciaux pratiqués.<br />
La restructuration du CDER en Agence opérationnelle de mise en œuvre de la politique<br />
nationale énergies renouvelables et efficacité énergétique.<br />
Il est intéressant de noter que cette approche s’intègre dans un programme global de<br />
réforme du secteur de l’énergie soutenu par la Banque Mondiale à travers un Prêt de<br />
Politique de Développement du secteur de l’Energie. L’Agence de Coopération Technique<br />
Allemande GTZ qui soutient également ce processus intervient à travers l’accompagnement<br />
au développement du dispositif réglementaire d’application de la loi cadre et à la mise en<br />
œuvre de celui-ci. Elle intervient également à travers la réalisation d’une étude sur le<br />
potentiel des énergies renouvelables, les impacts sociaux économiques et le développement<br />
d’un concept de promotion de ces énergies.<br />
Les activités de promotion entamées concernent, la préparation des nouveaux parcs éoliens<br />
et la sensibilisation des auto producteurs potentiels, le lancement du projet de<br />
réglementation thermique du bâtiment avec le soutien du GEF, du PNUD et du<br />
Gouvernement Italien, la généralisation des applications solaires thermiques et de LBC au<br />
niveau du parc immobilier publique, l’optimisation de la gestion de l’éclairage publique avec<br />
les collectivités locales, la préparation d’actions DSM dans le cadre de programme de mise à<br />
niveau des PME et PMI.<br />
Le dispositif réglementaire mentionné est appelé à lever progressivement nombre de<br />
barrières et obstacles qui limitent le développement à grande échelle des énergies<br />
renouvelables et de l’efficacité énergétique.<br />
Ainsi au niveau incitatif et institutionnel, il y a lieu de rappeler essentiellement, l’absence de<br />
cadre réglementaire régissant ce secteur, l’absence d’une agence opérationnelle en charge<br />
de l’efficacité énergétique, la faible considération des ER et de l’EE par les programmes<br />
nationaux de développement permettant de donner l’exemple et de garantir une demande<br />
durable pour les technologies et services y afférents et l’inéquité fiscale par rapport à<br />
d’autres énergies,<br />
D’un autre côté, bien que les aspects technologiques ne constituent pas une barrière, il reste<br />
que la prise en compte d’Approches Qualité Globales reste limitée, le renforcement des<br />
capacités est insuffisant tout comme l’information et la sensibilisation du grand public ; la<br />
Recherche & Développement, base d’innovation et d’adaptation d’équipement et de services<br />
au contexte spécifique national, est réduite.<br />
Enfin au niveau Financier, l’approche « projet », longtemps pratiquée, ne favorise pas les<br />
investissements, en particulier pour le développement de l’offre, réduisant la visibilité, les<br />
configurations de financement usuelles (IPP) restent contraignantes en terme de coût, et les<br />
opérateurs financiers qui s’intéressent fortement au secteur de l’énergie conventionnel,<br />
restent distants par rapport aux ER et l’EE. Enfin la valeur ajoutée des projets ER ou d’EE en<br />
termes de préservation d’emploi, de génération de nouveaux investissements ou encore de<br />
création d’emplois n’est pas prise en compte.<br />
2.2 Ins tr ume n ts et mesures en fa ve ur de l’URE et des ER<br />
2.2.1 Autres dispositions réglementaires<br />
Parmi les autres dispositions réglementaires qui vont certainement concourir à la promotion<br />
des énergies renouvelables et de l’efficacité énergétique, il a lieu de noter :<br />
La Loi relative à la libéralisation du marché de l’électricité, dans le processus<br />
d’approbation. Celle-ci prévoit la mise en place d’un marché libre (producteurs libres,<br />
producteurs autorisés, auto producteurs, clients éligibles, bourse,..) au côté du marché<br />
réglementé (concessionnaires, régies, société nationale de production, société nationale<br />
de distribution,..), la séparation des activités électriques de production, de transport, de<br />
483
484<br />
ENERGIE ET DEVELOPPEMENT DURABLE EN MEDITERRANEE<br />
distribution et de commercialisation, la mise en place enfin d’un régulateur indépendant.<br />
D’un point de vue institutionnel, un opérateur système pour la gestion du réseau de<br />
transport et une Agence Nationale de Régulation seront crées ;<br />
La loi n° 28-00 relative à la gestion des déchets et leur élimination (promulguée en<br />
2006) a pour objet, la modernisation du processus de gestion en vigueur et la réduction<br />
des impacts négatifs des déchets sur la santé de l’homme et de l’environnement : définit<br />
les types des déchets, rend obligatoire les plans de gestion des déchets, réglemente de la<br />
gestion des différents types de déchets : déchets hospitaliers, inertes, industriels, spécifie<br />
les conditions d’ouverture, de fermeture et de gestion des installations de traitement et de<br />
valorisation des déchets, met les bases d’un système de contrôle, d’infractions et de<br />
sanctions en cas de non respect des différentes dispositions de la loi ;<br />
La loi n° 54-05 relative à la gestion déléguée des services publics (février 2006) ;<br />
La loi cadre de protection et mise en valeur de l’environnement (2003) ;<br />
La loi sur les études d’impact (2003) ;<br />
La loi relative à la lutte contre la pollution de l’air (2003) ;<br />
La Loi 10-95 sur l'eau (1995).<br />
2.2.2 L’exemple des pouvoirs publics<br />
Il s’agit de l’intégration des énergies renouvelables et du renforcement de l’efficacité<br />
énergétique dans les administrations, les établissements publics et les Collectivités locales à<br />
travers une Circulaire du Premier Ministre en préparation et qui vise :<br />
La Généralisation des Lampes à Basse Consommation (LBC) ;<br />
La Généralisation des systèmes solaires de production d’eau chaude sanitaire (chauffeeau<br />
solaires) dans les établissements hospitaliers, internats, cités universitaires,<br />
établissements scolaires, centres sociaux et centres pénitenciers ;<br />
L’Intégration de l’efficacité énergétique dans les standards de construction ;<br />
L’intégration des énergies renouvelables dans les secteurs industriel et agricole<br />
(production d’électricité par énergies renouvelables, pompage par les petits<br />
aérogénérateurs, etc..) ;<br />
Le recours à l’installation d’équipements permettant de réaliser des économies d’énergie<br />
au niveau de l’éclairage public.<br />
2.2.3 La promotion de la qualité des équipements et des services<br />
La notion de la qualité du produit, de ses performances et des services y afférents est un<br />
élément essentiel dans l’approche promotionnelle des énergies renouvelables et de<br />
l’efficacité énergétique. Parmi les outils « qualité globale » sur lesquels travaille le Maroc à<br />
travers le CDER, il y lieu de citer en particulier :<br />
Les normes pour le CES et celles en développement pour les systèmes PV ;<br />
Les bancs de test mis en place dans les laboratoires du CDER pour certifier le respect<br />
des normes par les équipements disponibles sur le marché marocain ;<br />
Les formations pratiques portant sur la mise en œuvre d’installations ER et Efficacité<br />
Energétique (conception, dimensionnement, installation, maintenance), également celles<br />
portant sur le renforcement des capacités nationales dans ce domaine (architectes,<br />
bureaux d’études techniques, installateurs) ;<br />
La diffusion de manuels techniques et didactiques appropriés ;<br />
La mise en place d’un système d’agrément des installateurs ;<br />
La Garantie des Résultats, obligatoire pour les installations collectives, est un<br />
engagement conjoint et solidaire des intervenants dans un projet: le prestataire de service<br />
concerné, le bureau d’études, le fabricant, l’installateur, qui assurent contractuellement au<br />
client, la production (ou l’économie), par l’installation qu’il a acquise, d’une quantité<br />
d’énergie annuelle minimale.<br />
2.2.4 Les aspects financiers<br />
La transformation des marchés des ER et de l’EE dans une approche intégrée de service<br />
nécessite l’introduction de techniques de financement novatrices et complémentaires<br />
permettant la gestion optimale et la sécurisation des risques et facilitant par conséquent
MAROC - Etude Nationale<br />
l’implication des différentes catégories d’agents économiques et des institutions financières<br />
de la place intéressées.<br />
En plus des investissements pris en charge directement par des budgets relevant du secteur<br />
public (ONE, CDER, ONEP,..) ou réalisés dans le cadre de concessions (parc éolien), il y a<br />
lieu de noter les mécanismes suivants :<br />
L’aide aux partenariats commerciaux pour encourager le développement des réseaux de<br />
services et de distribution des équipements est mise en place au profit des professionnels<br />
du solaire thermique pour la prise en charge d’une partie des coûts de formation, de<br />
marketing ou encore de communication. Cette aide pourrait être généralisée aux autres<br />
intervenants EnR et EE compte tenu des résultats positifs obtenus et des perspectives<br />
d’instauration d’incitations financières en application de la loi cadre sur les Enr et<br />
l’Efficacité Energétique ;<br />
Le Fonds de Garantie des Efficacités Energétiques et des EnR (FOGEER) mis en place<br />
en 2007 (voir étude de cas PROMASOL), également pour le solaire thermique à titre<br />
pilote. Ce fonds accompagne gratuitement, en termes d'ingénierie technique et financière,<br />
la réalisation des projets. Il couvre, à hauteur de 70 %, les risques sur investissements<br />
réalisés, dans un premier temps au profit d’opérations de « leasing » d’installations<br />
collectives de chauffage solaire d’eau sanitaire. Il bonifie enfin de 1.5 % les financements<br />
y afférents. Le FOGEER garantit en fait la réalisation d’investissements économiquement<br />
viables, financés sur les budgets de fonctionnement (soit sur les économies d’énergie) ;<br />
L’approche participative du Programme d’Electrification Rurale Global (PERG) qui facilite<br />
l’accès au service électrique à l’ensemble des populations rurales, par souci d’équité<br />
sociale, avec un coût partagé entre l’opérateur national (ONE), les collectivités locales, les<br />
usagers et l’ensemble des bénéficiaires du réseaux électrique national (Voir PERG & 2.4<br />
ci-après).<br />
2.2.5 Mesures fiscales (REF 11):<br />
Réduction du taux de la TVA sur les chauffes eau solaires de 20% à 14% au titre de la loi<br />
de finances 2007 et proposition de sa suppression en 2008 ;<br />
Exonération des taxes, impôts et droits de douanes appliqués aux équipements des<br />
énergies renouvelables et d’efficacité énergétique proposée dans le cadre de loi de<br />
finances 2008.<br />
2.2.6 L’expertise de proximité : la Maison de l’Energie<br />
La Maison énergie est une micro entreprise conçue pour offrir des services énergétiques de<br />
proximité de conseil, d’assistance et des prestations techniques et commerciales. Deux<br />
cents jeunes promoteurs sont opérationnels en milieu rural et en milieu urbain, dans des<br />
activités liées essentiellement à la commercialisation des équipements énergétiques et leurs<br />
accessoires aux fins d’éclairage, de pompage d’eau, de cuisson et de chauffage ainsi qu’à<br />
l’installation, l’entretien et la maintenance de ces équipements et la distribution du gaz<br />
butane.<br />
Le CDER et le PNUD ont lancé dans le cadre d’une large base partenariale, publique et<br />
privée, ce programme qui vise l’implantation de 1000 Maisons de l’énergie et qui s’articule<br />
autour d’un processus et de critères incluant une étape de pré sélection des jeunes<br />
promoteurs, la réalisation de l’étude de faisabilité pour leur implantation et l’implication des<br />
partenaires locaux pour un encadrement de proximité.<br />
2.2.7 La tarification de l’Energie<br />
Véritable outil de gestion de la demande énergétique, les pouvoir publics ont mis en place<br />
entre 1994 et 1996 une tarification permettant l’indexation des coûts des produits pétroliers<br />
sur les prix internationaux ainsi qu’une tarification par tranches pour l’électricité BT et tri<br />
horaire pour la MT et la HT. Avec l’envolée des prix de l’énergie, la sensibilité des<br />
institutionnels, des opérateurs économiques et des consommateurs aux questions<br />
énergétiques est devenue très forte et leur comportement en témoigne : recours plus<br />
accentué aux lampes basse consommation (marché actuel supérieur à 1 million d’unités par<br />
an), optimisation de la facture électrique avec effacement de certaines catégories<br />
485
486<br />
ENERGIE ET DEVELOPPEMENT DURABLE EN MEDITERRANEE<br />
d’industriels et d’agriculteurs aux heures de pointe, intérêt pour les énergies renouvelables et<br />
l’Efficacité énergétique.<br />
Par contre, la subvention accordée au Gaz butane et au diesel aggrave les distorsions en<br />
orientant de plus en plus de consommateurs vers ces énergies.<br />
2.3 Evo l u tion de l’intensité énergé ti que – découplage<br />
En 30 ans, l’intensité énergétique primaire « est stable à parité de pouvoir d’achat », aux<br />
alentours de 0.1 tep/1000 US $.<br />
tep/1000 US$95<br />
0,3<br />
0,25<br />
0,2<br />
0,15<br />
0,1<br />
0,05<br />
0<br />
1971<br />
Figure 4 Intensité énergétique primaire (REF. 1)<br />
1973<br />
1975<br />
Intensité énergétique primaire<br />
PIB en US$ constant à ppa PIB en US$ à ppa<br />
1977<br />
1979<br />
1981<br />
1983<br />
1985<br />
Le scénario « Efficacité Energétique renforcée » développé par l’étude Banque mondiale –<br />
MEM (REF. 1) prévoit un potentiel d’économie d’énergie de 13 % et de 23 % respectivement<br />
pour 2010 et 2020 par rapport à un scénario de consommation dit « fil de l’eau (voir Chapitre<br />
I, paragraphe 2).<br />
Ainsi l’intensité énergétique pourrait baisser de 1.7 % par an, si les dispositions nécessaires<br />
sont prises pour mobiliser ce potentiel. Elle atteindrait en 2020 la valeur de 0.06 kep / US $<br />
ppa.<br />
Le secteur de l’industrie présente le potentiel le plus élevé avec 48% suivi des secteurs des<br />
transports (23 %), du résidentiel (19%) et des services (10%).<br />
2.4 Evo l u tion des éne rgi es re n ouve lables<br />
Les énergies renouvelables contribuent à hauteur de 4% au bilan énergétique national (hors<br />
biomasse) et sont à l’origine de la production de près de 10% de l’énergie électrique, grâce à<br />
l’effort important de mobilisation de la ressource hydraulique ainsi qu’à l’effort d’implantation<br />
de premiers parcs éoliens (124 MW installés, 140 MW en construction au Nord du pays<br />
auxquels s’ajoutent 200 à 300 autres MW en cours). Il y a lieu de noter que de manière<br />
général les énergies renouvelables font l’objet d’un portefeuille de projets diversifié (centrale<br />
thermo solaire, station de pompage turbinage hydraulique, valorisation énergétique des<br />
déchets, pompage de l’eau, dessalement de l’eau de mer, climatisation et chauffage solaire<br />
de l’eau sanitaire,….) s’impliquant ainsi dans divers programmes économiques et sociaux<br />
comme c’est le cas du programme d’électrification rural dont les objectifs sont pris en charge<br />
à hauteur de 7% par les systèmes solaires photovoltaïques individuels.<br />
Les ressources sont importantes avec en particulier une estimation pour l’éolien de plusieurs<br />
GW, un marché potentiel du solaire thermique de plus d’un million de M², et des possibilités<br />
importantes de valorisation de la biomasse (9 millions ha de forêts et vocation agricole du<br />
pays). En terme de tendance, les attentes vis-à-vis de ces filières sont importantes de la part<br />
des institutionnels, des opérateurs économiques ou tout simplement des consommateurs.<br />
Malheureusement la croissance des marchés reste faible en raison des contraintes qui sont<br />
traitées ci-dessous.<br />
1987<br />
1989<br />
1991<br />
1993<br />
1995<br />
1997<br />
1999<br />
2001<br />
2003
2.4.1 Développement des parcs éoliens<br />
Parcs Eoliens Application Mise en<br />
service<br />
MAROC - Etude Nationale<br />
Tableau 6 Un portefeuille de projets diversifié<br />
Puissance<br />
MW<br />
Economie fuel<br />
T/an<br />
CO2 évité T/an<br />
A. Torres Parc ONE 2000 50.4 56 000 233 000 (*)<br />
Bel Mogdol<br />
Essaouira<br />
Parc ONE 2007 60 48 000 156 000 (*)<br />
Tanger Parc ONE 2009 140 120 000 470 000<br />
ONEP Dessalem. 2008<br />
5.6<br />
18 850<br />
Tan Tan<br />
2015<br />
11.2<br />
Lafarge Tétouan Auto product. 2006 10 30 000 (*)<br />
(*) Enregistrés comme projets MDP<br />
Les projets de parcs éoliens développés ou en développement au Maroc relèvent d’un<br />
portefeuille très diversifié dans la mesure où les applications visées concernent des<br />
centrales électriques intégrées dans le parc de production de l’Office National d’électricité,<br />
des projets privés d’auto production d’industriels ou encore des systèmes d’alimentation<br />
électrique d’unités de dessalement d’eau de mer.<br />
Les contraintes au développement massif de l’éolien au Maroc restent nombreuses (REF. 2):<br />
La connaissance précise de la ressource reste limitée. Une erreur de 10% sur l’évaluation<br />
de la vitesse des vents induit une erreur de 33 % au niveau de la puissance productible.<br />
Toutefois, un programme de plus de 1000 MW est envisageable compte tenu de la qualité<br />
de la ressource notamment au niveau des sites du Nord et du Sud ;<br />
Les fluctuations de la production éolienne ne permettent pas de garantir une puissance,<br />
dès le lancement d’un programme éolien ambitieux. L’absence de recul suffisant quant au<br />
productible des premiers parcs ne permet pas de prendre en considération un<br />
foisonnement minimum de ceux-ci. Ces fluctuations nécessitent également une maîtrise<br />
de la conduite à distance des parcs éoliens au niveau du dispatching ;<br />
Le profil du parc électrique national n’offre pas une souplesse d’adaptation suffisante<br />
(modularité limitée des centrales thermiques) aux fluctuations des parcs éoliens de nature<br />
modulable ;<br />
La capacité d’accueil du réseau estimée à 25% de la puissance électrique totale installée<br />
constitue une autre limitation bien que relative en raison de la forte croissance de la<br />
demande électrique enregistrée (8 % à 9 % annuellement) ;<br />
La production électrique en BOT à plus de 70% (charbon et gaz naturel) suivant le<br />
principe de « Take or pay » a limité considérablement le rôle de l’éolien dans le bouquet<br />
énergétique national ;<br />
La situation de monopôle de l’opérateur national réduit l’intervention du secteur privé aux<br />
seuls initiatives des auto – producteurs ;<br />
Enfin, la volonté affichée des pouvoirs publics et de l’opérateur national de l’électricité<br />
coïncide, malheureusement avec un contexte mondial de forte demande en éoliennes et<br />
par conséquent d’une limitation de l’offre accompagnée d’une tendance de croissance<br />
inquiétante des coûts à l’investissement.<br />
Le Programme Eolien 2008 – 2012 : Initiative 1000 MW<br />
Le Gouvernement Marocain a décidé en octobre 2006 de porter la contribution des Enr à<br />
hauteur de 20 % dans le bilan électrique national. A cet effet l’initiative 1000 MW est lancée.<br />
Sa mise en œuvre prévoit en particulier la réalisation des parcs suivants :<br />
Tarfaya au Sud : 200 à 300 MW<br />
Touahar Taza au Centre : 100 MW<br />
Laâyoune au Sud: 240 MW<br />
Foum El oued au Sud : 200 MW<br />
Tanger Sendouk : 60 MW<br />
487
488<br />
ENERGIE ET DEVELOPPEMENT DURABLE EN MEDITERRANEE<br />
2.4.2 La mobilisation de la ressource solaire<br />
Production d’électricité de puissance par énergie solaire<br />
Une Centrale Thermo Solaire de 20 MW, couplée à une Centrale CGGN de près de 400 Mw<br />
sera construite dans le nord est du pays (Ain Béni Mathar) avec le soutien du GEF (43<br />
millions US $).<br />
L’Electrification Rurale Décentralisée par système photovoltaïque autonome<br />
Dans le cadre du PERG, 150.000 Foyers ruraux (1 000 000 d’habitants environ) sont<br />
concernés par l’Electrification Rurale Décentralisée (Cf. étude de cas ci-après)<br />
essentiellement par systèmes solaires individuels. Quatre opérateurs privés sont impliqués<br />
et plus de 50 000 systèmes (2000 villages) ont été installés.<br />
Cette variante de l’électrification rurale vient consolider le concept de l’ERD développé au<br />
Maroc au niveau des projets pilotes réalisés entre 1988 et 1994 au profit de quelques 5000<br />
foyers.<br />
La Promotion du chauffe eau solaire dans une approche d’efficacité énergétique<br />
Les Perspectives de marché des Chauffes Eau Solaires (CES) sont estimées, à l‘horizon<br />
2012, à 400 000m² et plus d’un million de m² à l’Horizon 2020. Cette filière connaît un essor<br />
réel depuis la mise en place du Promasol, le programme marocain de promotion des CES<br />
avec le soutien du PNUD et du Fonds Global pour l’Environnement – GEF (voir étude de<br />
cas ci-après).<br />
Le PROMASOL est un programme de développement du marché des chauffe-eau solaires<br />
(CES) Grâce aux mesures techniques, financières et promotionnelles prises par ce<br />
programme, l’offre se développe qualitativement et quantitativement, ce qui permettra de<br />
dépasser une capacité de production à 40 000 m² par an. Doté d’un budget de 4,2 Millions<br />
US $ il a bénéficié du soutient du PNUD et du GEF.<br />
surface en m²<br />
Figure 5 Surfaces installées des chauffe-eau solaires au Maroc (en m 2 )<br />
35000<br />
30000<br />
25000<br />
20000<br />
15000<br />
10000<br />
5000<br />
0<br />
Surfaces installées des chauffe-eau solaires au Maroc en (m²)<br />
Initiation des activités CES<br />
1994<br />
3460<br />
1996<br />
4600<br />
6100<br />
1500<br />
4600<br />
1998<br />
Initiation des activités<br />
PROMASOL<br />
1664<br />
La Capacité installée cumulée à ce jour est d’environ 200 000M². Elle concerne dans 90%<br />
des cas des applications individuelles et 10% d’applications collectives.<br />
Le marché évolue annuellement à plus de 30 000 m² (données 2006) et le volume d’affaire<br />
annuel est supérieur à 15 000 000 Euro.<br />
Contraintes : offre d’équipement et de service de qualité limitée, coût à l’investissement<br />
élevé (500 Euro par m²), information et sensibilisation insuffisantes, compétition du Gaz de<br />
Pétrole Liquéfié fortement subventionné<br />
Il existe au Maroc près de 15 fournisseurs dont un Fabricant qui commercialisent à 90 % des<br />
systèmes individuels thermosiphons (150 l/j et 300 l/J), le reste concerne les systèmes en<br />
circulation forcée pour les applications collectives<br />
2000<br />
10226<br />
8562<br />
3790<br />
12230<br />
2002<br />
8440<br />
3400<br />
22600<br />
19200<br />
2004<br />
6600<br />
30000<br />
23400<br />
2006
MAROC - Etude Nationale<br />
Le Réseau de distribution est constitué de près de 100 points de vente pour l’ensemble du<br />
pays.<br />
A travers le Promasol (voir étude de cas ci-après), les pouvoirs publics soutiennent l’offre par<br />
des actions d’accompagnement des opérateurs dans le développement de leurs réseaux de<br />
distribution (agrément installateurs, formation en marketing, communication, logistique,..) et<br />
d’accompagnement des industriels pour la mise en place unité de fabrication (80% des frais<br />
d’approche, jusqu’à 25% de l’investissement dans l’outil de production)<br />
L’implication du secteur financier local est également encouragée pour le déploiement par<br />
les banques locales de crédits à la consommation (financement de systèmes individuels) et<br />
du leasing pour les applications collectives.<br />
Afin de poursuivre ce développement, il est nécessaire de proposer des produits répondant à<br />
la norme marocaine et dont les coûts seraient plus abordables (inférieur à 250 euros /m²),<br />
d’améliorer les services des distributeurs en particulier pour les applications collectives, de<br />
mobiliser davantage le secteur financier local, de renforcer les professionnels de l’industrie<br />
solaire marocaine, d’intensifier la mobilisation des acteurs concernés au niveau des<br />
départements institutionnels utilisateurs potentiels (santé, habitat, tourisme, industrie,<br />
finances…) et de concrétiser l’investissement dans la fabrication locale.<br />
2.4.3 La biomasse : un potentiel global très important à mobiliser et priorité à<br />
la préservation de la ressource bois de feu<br />
La biomasse présente, au Maroc, un potentiel de valorisation considérable grâce à un<br />
domaine forestier de plus de 5 350 000 ha, d’étendues de Halfa de près de 3 300000 ha,<br />
d’une surface agricole de près de 9 000 000 ha et d’un cheptel (Bovins, ovins, caprins,..) très<br />
diversifié avoisinant 7 000 000 d’unités grand bétail (UGB).<br />
En terme de valorisation énergétique de la biomasse, seule la ressource bois est aujourd’hui<br />
mobilisée. La consommation y afférente correspond à 25 % de la consommation énergétique<br />
commerciale primaire, l’équivalent de 30 000 ha par an, bien au-delà du productible<br />
renouvelable.<br />
Ainsi l’approvisionnement énergétique en milieu rural pour les besoins de cuisson du pain et<br />
des repas, de chauffage d’eau et des locaux reste assuré très fortement par le bois de feu.<br />
Cet usage représente 88 % de la consommation totale de bois de feu.<br />
En milieu urbain, la consommation de bois de feu est réservée aux établissements socioéconomiques<br />
tels que les Hammams, les fours à pain collectifs traditionnels et les fours de<br />
poteries. Cet usage se caractérise par un recours à des technologies parfois ancestrales<br />
ayant des rendements de combustion très faibles (15 % à 28 %)<br />
Les efforts consentis par le Maroc dans ce domaine ont visé essentiellement la prospection<br />
de possibilités de substitution du bois de feu par d’autres ressources et l’introduction de<br />
technologies améliorées permettant de réduire drastiquement les consommations initiales<br />
(Voir étude de cas Programme bois de Feu).<br />
Les autres formes de valorisation de la biomasse ne connaissent pas encore de<br />
développement significatif au Maroc. La production de biogaz à grande échelle, tout comme<br />
celle de biofuel restent au stade d’études d’approche, en particulier de la part d’investisseurs<br />
privés.<br />
Contraintes au développement de la filière<br />
Les contraintes au développement de la filière restent nombreuses et diverses :<br />
Réduction de la ressource hydrique ;<br />
Faible dynamique de mise en place des nouvelles technologies de la biomasse ; Offre<br />
d’équipements et de services encore très limitée ;<br />
Absence d’incitations à l’auto –production d’énergie électrique ;<br />
Retard dans l’expérimentation des cultures énergétiques, manque en expertise de<br />
proximité, expérience malheureuse avec le biogaz familial ;<br />
489
490<br />
ENERGIE ET DEVELOPPEMENT DURABLE EN MEDITERRANEE<br />
Nombre très limité des stations d’épuration d’eaux usées lié aux délais de Mise en œuvre<br />
du programme national d’assainissement liquide ;<br />
Délais de mise en œuvre réelle du programme national des déchets ménagers en<br />
application de la loi sur les déchets et le développement des décharges contrôlées ;<br />
Faible mobilisation d’acteurs et partenaires locaux dans le domaine ;<br />
Coûts d’investissements encore élevés.<br />
2.4.4 L’énergie hydraulique<br />
Un effort considérable de construction de barrages pour garantir l’approvisionnement du<br />
pays en eau (potable et irrigation) a permis d’atteindre une capacité totale de stockage d’eau<br />
de 15 Milliards de m 3 et a permis, par la même occasion, la mise en place d’un parc hydro<br />
électrique important qui a évolué de 317 MW en 1956 à 1265 MW en 2005 (REF 5) auquel<br />
s’ajoute la STEP d’Afourer (463 MW).<br />
Cependant, en raison d’une pluviométrie en constante baisse, la réduction des ressources<br />
hydriques les quarante dernières années est de 25% et la part de cette forme d’énergie dans<br />
la production nationale d’électricité est passée de 21 % en 1956 à moins de 5 % en 2005<br />
(965 GWh).<br />
Contribution à la<br />
production d'électricité (%)<br />
25<br />
20<br />
15<br />
10<br />
5<br />
0<br />
Figure 6 L’hydro-électricité au Maroc<br />
L'hydro électricité au Maroc<br />
1950 1960 1970 1980 1990 2000 2010<br />
Années<br />
Série1<br />
La mise en place d’une première station de pompage turbinage (STEP) de 400 MW (barrage<br />
Bine El Ouidanes) mobilise dorénavant l’énergie hydro électrique dans le cadre des actions<br />
de gestion de la demande d’énergie électrique en heures de pointes (production de la<br />
STEP : 690 GWH en 2006).<br />
2.5 Evo l u tion de l’efficacité énergé tique ,<br />
2.5.1 Une voie pour découpler croissance économique et croissance de la<br />
demande énergétique,<br />
L’expérience en matière d’efficacité énergétique est aussi diversifiée que celle des énergies<br />
renouvelables. Elle s’est articulée autour de projets de renforcement de capacité et de<br />
développement d’expertise nationale (bureaux d’études spécialisés), de mise à niveau<br />
énergétique et environnementale d’unités industrielles ou tertiaires, d’actions pilotes et<br />
d’accompagnement technique et financier pour la réalisation des recommandations des<br />
audits. La visibilité et l’impact de ces actions restent limités en raison de l’approche projet<br />
adoptée au détriment de l’approche programme global et pérenne.<br />
Cette expérience a porté sur le bâtiment, l’industrie et la préservation de ressources (ex bois<br />
de feu).<br />
Globalement le potentiel d’économie d’énergie est supérieur à 15%. D’après le Projet<br />
IZDIHAR dans le secteur industriel, ce potentiel est de 17% avec un temps de retour moyen<br />
sur investissement de 18 mois). Le potentiel de la Cogénération est évalué à 400 MW (REF<br />
18) :
MAROC - Etude Nationale<br />
2.5.2 Programme d’efficacité énergétique dans le bâtiment (CDER)<br />
Les projets d’efficacité énergétiques en milieu professionnel, le PROMASOL, programme de<br />
transformation du marché des chauffe-eau solaires (CES), le programme de mise à niveau<br />
énergétique des hammams et fours boulangeries par la diffusion de technologies améliorées<br />
d’économie de bois, la promotion d’expertise et de services énergétiques de proximité,<br />
permettent aujourd’hui au Centre de Développement des énergies renouvelables (CDER) le<br />
développement conceptuel du programme d’efficacité énergétique dans le bâtiment<br />
collectif suivant un processus de capitalisation des mécanismes promotionnels, de<br />
consolidation des partenariats et d’accompagnement des chantiers stratégiques de<br />
construction d’infrastructures relevant ses secteurs de la Santé, l’Habitat, l’éducation<br />
nationale, l’Hôtellerie et les Collectivités Locales.<br />
Il s’agit d’une intégration horizontale des préoccupations énergétiques dans l’acte de bâtir<br />
englobant la réglementation thermique du bâtiment, la normalisation et la labellisation<br />
(conception architecturale, matériaux de construction, équipements énergétiques), le<br />
développement normatif et de guides techniques pour les professionnels, le renforcement de<br />
capacité des intervenants publics et privés, la réalisation d’un programme pilote touchant les<br />
secteurs clés mentionnés, le financement durable à travers les ressources budgétaires des<br />
établissements.<br />
Le programme résulte d’une maturation conjointe de l’approche chez les partenaires<br />
convaincus de la nécessité d’œuvrer ensemble pour répondre aux besoins et à l’exigence de<br />
confort croissante en contribuant à la maîtrise la demande énergétique du pays, à la<br />
préservation de l’environnement et à l’optimisation de la gestion budgétaire des<br />
établissements (Voir ANNEXE : fiche projet « code efficacité énergétique dans le<br />
bâtiment »).<br />
2.5.3 Programme d’efficacité énergétique dans le secteur de la santé<br />
Le Programme d’efficacité énergétique dans le secteur de la santé est réalisé dans le cadre<br />
d’un partenariat entre la Ministère de la Santé et le CDER. Il comprend divers composantes<br />
telles que :<br />
La réalisation de 20 diagnostics énergétiques dans les hôpitaux et identification d’un<br />
potentiel d’économie sur la facture électrique de 20 % environ ;<br />
L’Installation de capteurs solaires thermiques pour la production d’eau chaude sanitaire<br />
dans 8 hôpitaux totalisant 363 m², 23 500 litres et 300000kWh / an ;<br />
L’Équipement de 32 Centres de santé et Maisons d’accouchement avec des CES<br />
individuels ;<br />
La Diffusion de Lampes à basse consommation ;<br />
L’Installation de Systèmes solaire photovoltaïques au profit de 17 formations sanitaires<br />
rurales (30 autres sont programmées) ;<br />
La Mise à Niveau énergétique du CHU de Casablanca ;<br />
Le Projet pilote de climatisation solaire hôpital My Youssef (Casablanca) ;<br />
Le renforcement des compétences humaines en gestion de l’énergie.<br />
2.5.4 <strong>Plan</strong> d'action de maîtrise de la demande "Demand Side Management"<br />
L’Office National de l’Electricité a lancé en 2007 un plan d’action de Maîtrise de la demande.<br />
Ce programme propose :<br />
L’accompagnement des industriels en terme de diagnostics énergétiques visant<br />
l’optimisation des factures électriques (signature d’une convention de partenariat dans ce<br />
sens avec l’Agence Nationale de Promotion des Petites et moyennes entreprises) ;<br />
L’incitation à la généralisation des lampes basse consommation ;<br />
La mise à niveau de gestion de l’éclairage public dans les zones d’intervention de l’ONE ;<br />
Une tarification à postes horaires pour les abonnés BT patentés ou gros consommateurs ;<br />
La réduction des pertes dans les réseaux de transport ;<br />
491
492<br />
ENERGIE ET DEVELOPPEMENT DURABLE EN MEDITERRANEE<br />
Tableau 7 Impacts prévus des action DSM e développement<br />
Gain Puis. Appelée (MW) Economie Energie (GWH/an) Gain Fioul (1000 T/an)<br />
Horaire GMT+1 90 a 150 .70 à 130 20 à 35<br />
LBC (6 millions) 200 300<br />
Eclairage Public 54 MW<br />
2.5.5 Projet de “mise à niveau” énergétique et environnementale dans une<br />
zone industrielle à Casablanca<br />
C’est un projet de l’Association Izdihar des industriels de Sidi Bernoussi (Casablanca) qui<br />
regroupe plus de 500 adhérents. Ce projet soutenu par le GEF et ESMAP (Banque<br />
Mondiale) présente les résultats suivants :<br />
56 diagnostics réalisés : Agroalimentaire, Textile et Habillement, Chimie et Parachimie,<br />
Mécanique, Métallurgique, Électrique et Électronique ;<br />
462 recommandations de réduction de la facture énergétique et/ou de réduction de la<br />
pollution ;<br />
63.397.525 DH de gains escomptés, soit 7.700.000 DH/an sur la base d’une facture<br />
énergie - eau de 380.391.300 DH ;<br />
89.792.000 DH d’investissement, temps de retour brut de 17 mois ;<br />
Économie globale par rapport à la facture initiale de l’ordre de 17%.<br />
2.6 Les effe ts et bé né fices observés ou atte ndus des ER et de<br />
l ’URE<br />
Au Maroc, Les créneaux d’application des EnR et de l’EE s’étendent progressivement. Les<br />
secteurs tertiaires, de l’industrie et des collectivités locales s’y intéressent grâce à une<br />
pratique réelle de projets ayant confirmé les apports de ces technologies propres. Si le bilan<br />
actuel reste modeste, les effets et bénéfices attendus sont importants en terme de<br />
contribution au développement des services énergétiques durables par leurs apports à :<br />
La diversification des sources d’approvisionnement (10% en 2012) ;<br />
La sécurisation de l’approvisionnement (pays non producteur d’énergies fossiles) ;<br />
Développement humain durable : accès généralisé à l’énergie en particulier en milieu<br />
rural et péri urbain, préservation de la santé des populations, soutien d’actions locales de<br />
lutte contre la pauvreté et génératrices de revenus ;<br />
La maîtrise des coûts des services énergétiques essentielle pour la compétitivité<br />
industrielle, agricole et des services du Maroc qui a opté pour l’ouverture économique à<br />
travers différents accords régionaux et internationaux de libre échange (USA, UE, Tunisie-<br />
Egypte-Jordanie, Turquie,…) ;<br />
L’optimisation de la courbe de charge électrique, écrasement du pic de demande ;<br />
La protection de l’environnement (maîtrise de la croissance des émissions de GES, près<br />
de 24 millions Tonnes CO2 évitées par an en 2015 (REF. 2 et 3) ;<br />
La Préservation des ressources naturelles : eaux et forêts ;<br />
La promotion Economique avec des opportunités investissements (Plus de 4 milliards<br />
d’Euros à l’horizon 2020) et la création d’emplois (23000 nouveaux emplois en 2020) ;<br />
L’Essor Industriel avec l’émergence de nouvelles filières notamment dans le cadre de<br />
Partenariats et de Joint Venture internationaux. Le programme « Emergence » de<br />
développement industriel du Maroc, n’a pas retenu pour l’heure ces nouvelles filières. Le<br />
nouvel objectif de 10% de contribution des EnR au bilan énergétique national en 2012<br />
changera certainement la donne. Le CDER travaille d’ailleurs dans cette direction,<br />
notamment avec quelques régions du Maroc qui souhaitent encourager l’investissement<br />
industriel dans les filières ER sur leur territoire (Grand Casablanca, Rabat, Souss Massa,<br />
Meknes Tafilalet) ;<br />
La mobilisation accrue de la coopération internationale et le renforcement du<br />
positionnement régional du Maroc (Euro méditerranéen, africain, Arabe). Le<br />
développement de concepts promotionnels propres au Maroc (ERD, Eolien, CES, Bois de<br />
Feu, ..) a bénéficié du soutien de la coopération internationale tant en bilatéral (France,<br />
Espagne, Italie, Allemagne, USA, Canada,…), qu’en multilatéral (Agences des Nations
MAROC - Etude Nationale<br />
Unies, Commission Européenne), bien que l’essentiel des investissements ait été<br />
supporté par le consommateur.<br />
Les perspectives d’un encadrement réglementaire plus ciblé, d’une organisation<br />
institutionnelle plus adaptée et la fixation d’objectifs quantitatifs précis permettront aux ER et<br />
à l’EE d’être porteurs de coopérations techniques et de partenariats commerciaux, voir<br />
industriels, plus ambitieux.<br />
3. Exemples de bonnes pratiques - Etudes de Cas<br />
Trois études de cas sont proposées dans le cadre de cette étude pour présenter de manière<br />
plus détaillée des programmes intégrés de développement de marché de systèmes Enr ou<br />
EE, réalisés pour répondre à des besoins et des problématiques spécifiques :<br />
Promotion des systèmes solaires de chauffage d’eau ;<br />
Généralisation de l’électrification rurale décentralisée ;<br />
Préservation de la ressource Bois de Feu.<br />
3.1 Progra mme de Dé ve loppeme nt du Ma rché d e s CES<br />
P RO M AS O L<br />
Le Maroc développe, depuis 2001 le Promasol, programme national de promotion et de<br />
transformation du marché des chauffes eau solaire au Maroc. Les Activités menées par le<br />
Centre de Développement des Energies Renouvelables (CDER), Agence d’Exécution du<br />
Programme, s’articulent autour des axes suivants :<br />
1) Qualité des équipements et de services : élaboration de normes marocaines<br />
spécifiques pour les chauffes eau solaire thermiques, certification des équipements<br />
disponibles sur le marché et labellisation (une dizaine de produits), agrément des<br />
installateurs (+ de 100 techniciens agrées), adaptation et promotion du concept de<br />
garantie des résultats solaires pour les applications collectives (30 projets pilotes).<br />
Figure 7 Macarons de labélisation du Promasol<br />
2) Accès aux équipements et services liées aux chauffes eau solaires :<br />
Réduction de la TVA de 20% à 14% et suppression ou atténuation probablement à 7%<br />
en 2008),<br />
Mobilisation des sociétés financières locales pour l’octroie de crédits (chauffe eau<br />
individuel) et de financements leasing (systèmes collectifs) d’installations solaires.<br />
Mise en place d’un fonds de garantie pour faciliter l’accessibilité aux équipements et<br />
services de qualité à travers la location-vente comme mode de financement approprié<br />
pour l’acquisition des CES par les différentes catégories d’agents économiques<br />
marocains. Ce Fonds de garantie est dotée d’une enveloppe initiale de 10 Millions Dh et<br />
garantit les investissements à hauteur de 70 % (70 projets prévus totalisant 20.000 m²).<br />
Le fonds apporte un soutien direct aux projets par l’accompagnement technique et<br />
l’ingénierie financière gratuits (10 % coût investissement) et la bonification des charges<br />
financières de 1.5 %.<br />
Soutien aux opérateurs privés pour le renforcement de leurs réseaux de distribution et le<br />
développement de partenariats commerciaux Promotion (opération diffusion 1000<br />
chauffe eau) pour faire connaître le produit et modérer les coûts (centrale d’achat),<br />
3) Mobilisation des Institutionnels pour donner l’exemple (ministères de la Santé, de<br />
l’éducation nationale, de l’entraide nationale, du tourisme,…), réalisation de programmes<br />
493
494<br />
ENERGIE ET DEVELOPPEMENT DURABLE EN MEDITERRANEE<br />
sectoriels (par institution), préparation d’une circulaire du premier ministre visant la<br />
généralisation du chauffage d’eau solaire au niveau des bâtiments publics.<br />
4) Sensibilisation de l’opinion publique via la presse, la radio et la télévision (passage<br />
de spots publicitaires), organisation de séminaires ciblés (architectes, bureaux d’études,<br />
hôteliers, industriels, …).<br />
Quelques enseignements du Promasol<br />
Au niveau individuel, 90% des installations concernent des maisons individuelles, 45% de<br />
nouvelles constructions et 52% se substituent au chauffe eau à gaz. Les taux de satisfaction<br />
élevés dépassent 90%.<br />
Au niveau collectif, sur près de 30 projets réalisés par le Promasol, totalisant plus de 2000<br />
M² de capteurs installés, les ratios de consommation type par secteur en eau chaude se<br />
présentent comme suit :<br />
30 litres/personne/jour pour hôpitaux et internats<br />
70 litres/personne/jour pour clubs<br />
40 litres/personne/jour pour maisons de bienfaisance<br />
La réussite d’un projet passe par un bon pré diagnostic énergétique de l’établissement<br />
bénéficiaire, l’accompagnement de l’installation des systèmes solaires par la rénovation du<br />
réseau de distribution et d’utilisation d’eau chaude et la mise en place de contrats d’entretien<br />
avec des jeunes promoteurs « agrées » pour garantir la durabilité du service eau chaude.<br />
Les temps de retour sur investissement varient de 3 à 6 ans suivant la configuration du<br />
système, et la nature de l’énergie substituée (électricité, fuel ou gaz propane).<br />
3.2 Progra mme Na t ional d’ U tilisation Rati onnelle du Bois de<br />
F eu au Maroc<br />
L’approvisionnement énergétique en milieu rural pour les besoins de cuisson du pain et des<br />
repas, de chauffage d’eau et des locaux reste assuré très fortement par le bois de feu. Cet<br />
usage représente 88 % de la consommation totale de bois de feu.<br />
Une étude récente du CDER, en cours de publication, conforte les données avancées par<br />
l’Administration des Eaux et Forêts dès 1994, avec des consommations moyennes<br />
journalières, par foyer, variant entre 17 KG, en zones arides, à 51,5 KG en zones<br />
montagneuses où la ressource reste encore quelque peu disponible.<br />
Tableau 8 Récapitulatif des consommations dans 5 zones pilote de l’étude (REF. 11)<br />
Région Consom.<br />
Kg/foyer/j<br />
Cuisson<br />
pain (%)<br />
Cuisson<br />
repas (%)<br />
Chauff.<br />
(%)<br />
Chauffage<br />
locaux (%)<br />
Ifrane 51,5 16 11 7 66<br />
Khénifra 44,3 20 13 8 59<br />
Chefchaouen 40,5 18 2 7 73<br />
Taounat 16 11 5 11 73<br />
Taroudant 17 38 30 19 10<br />
En milieu urbain, la consommation de bois de feu est réservée aux établissements socioéconomiques<br />
tels que les Hammams, les fours à pain collectifs traditionnels et les fours de<br />
poteries. Cet usage se caractérise par un recours à des technologies parfois ancestrales<br />
ayant des rendements de combustion très faibles (15 % à 28 % seulement)
MAROC - Etude Nationale<br />
Tableau 9 Présentation des établissements sociaux économiques<br />
SECTEURS Nombre unités Consommation Rendement<br />
moyenne énergétique<br />
Hammams ~5000 800 (kg/j) 28%<br />
Ferranes ~5500 150 – 200 (kg/j) ~20%<br />
Fours à<br />
poteries<br />
~13000 700-1000 par fournée 15 à 20%<br />
Les efforts consentis par le Maroc dans ce domaine ont visé essentiellement la prospection<br />
de possibilités de substitution du bois de feu par d’autres ressources et l’introduction de<br />
technologies améliorées permettant de réduire drastiquement les consommations initiales<br />
(jusqu’à 50%).<br />
3.2.1 Le programme d’utilisation rationnelle du bois de Feu<br />
L’objectif de ce Programme mis en place en 2003, par le CDER et le Ministère de l’Energie<br />
et des Mines est de préserver les massifs forestiers en Intervenant sur la demande de bois<br />
de feu en vue de son optimisation, par la Promotion et la diffusion de technologies<br />
améliorées économes de bois de feu.<br />
Le montant global du projet est de 4 millions d’Euros dont, 1.5 millions d’Euros du Fonds<br />
Français pour l’Environnement (FFEM), le reste étant réparti entre la contribution du CDER<br />
et celle des bénéficiaires propriétaires et/ou exploitants de Hammams.<br />
Le volet urbain a porté sur le recensement des hammams (Wilaya du Grand Casablanca),<br />
la réalisation de diagnostics énergétiques, l’accompagnement des propriétaires et exploitants<br />
dans l’équipement de leurs établissements (140 unités pilotes), la formation de<br />
chaudronniers (40) à la fabrication de chaudières améliorées, le marketing de la chaudière,<br />
la communication auprès des institutionnels concernés, la formations d’experts en<br />
diagnostics énergétiques et en contrôle qualité des chaudières améliorées, la sensibilisation<br />
des professionnels.<br />
Le volet rural a concerné l’Etude du profile de consommation de bois de feu en milieu rural ;<br />
la mise à niveau de Hammams rurbains; l’Introduction de hammams collectifs en milieux<br />
rural ; le Développement de Fours boulangeries ayant des rendements énergétiques plus<br />
intéressants.<br />
Présentation de la chaudière améliorée objet du programme promotionnel :<br />
La conception de la nouvelle chaudière permet ;<br />
L’Intégration de la chambre de combustion dans la cuve d’eau (meilleur transfert de<br />
chaleur à l’eau) ;<br />
L’Amélioration de la conception de la chambre de combustion ;<br />
La fixation de la porte, de la grille, des portes d’apport d’air primaire et secondaire et des<br />
ailettes par soudure sur le contour extérieur ;<br />
L’isolation de l’ensemble de la chaudière ;<br />
Un Cloisonnement spécifique divisant la cuve en deux compartiments assurant<br />
l’alimentation du hammam en eau chaude de manière alternative.<br />
495
3.2.2 Résultats et enseignements<br />
496<br />
3,20<br />
ENERGIE ET DEVELOPPEMENT DURABLE EN MEDITERRANEE<br />
Figure 8 Schéma de principe de la Chaudière<br />
23<br />
1,87<br />
80<br />
1,10<br />
42<br />
32<br />
60<br />
72<br />
33<br />
35<br />
2,20<br />
1,00<br />
27<br />
L’Économie de Bois est supérieure à 50% ;<br />
Le rendement énergétique sur eau est passé de 28-40% à 64-76°C ;<br />
La T°C des Fumées rejetées est passée de 170-300 à 120 à 180°C ;<br />
La concentration en CO dans les fumées rejetées est passée en moyenne de 4500 à<br />
2300PPM ;<br />
La quantité de CO2 évitée, par l’amélioration d’un hammam est en moyenne de 285 T/an ;<br />
Gain moyen annuel 10 000 $ US, 175 tonnes bois/an et par hammam, soit un potentiel<br />
d’économie de 875000 tonnes bois pour 5000 hammams.<br />
3.3 L’électrificati o n Rurale Dé centr alisée au Maroc : un<br />
c om plément à l’exte nsion du réseau<br />
La Royaume du Maroc a décidé, en 1995, de généraliser l’accès à l’électricité dans le milieu<br />
rural par la mise en œuvre du PERG, Programme d’électrification rurale globale. Cet objectif<br />
arrêté initialement pour 2010 a été ramené à 2007, 93% à travers l’extension du réseau et 7<br />
% à travers l'électrification décentralisée<br />
Le PERG est un programme participatif dont le Financement est assuré par les collectivités<br />
locales (20%), les bénéficiaires eux-mêmes (25 %), et l’Office National de l’Electricité (55%<br />
incluant les peines et soins de ce dernier et la participation, par solidarité, de l’ensemble de<br />
ses abonnés, soit 2.5 % de la facture électrique totale).
100%<br />
80%<br />
60%<br />
40%<br />
20%<br />
0%<br />
1995<br />
MAROC - Etude Nationale<br />
Figure 9 Accès à l’électricité dans le milieu rural. 1995-2007<br />
18%<br />
1996<br />
1997<br />
1998<br />
1999<br />
2000<br />
2001<br />
Le PERG a visé la généralisation de l’électrification au coût moyen optimisé de 1000 US $<br />
par foyer, malgré une configuration géographique souvent contraignante et une population<br />
rurale fort dispersée. L’effet d’échelle dans les réalisations et le choix de standards et de<br />
spécifications techniques plus adaptés ont permis de contenir les investissements à des<br />
niveaux raisonnables.<br />
3.3.1 Développement de l’ERD<br />
Il s’agit d’une approche globale basée sur la caractérisation précise des besoins et<br />
proposition d’un service électrique adéquat, garanti (éclairage, TV, Réfrigération,..) continu et<br />
pérenne (disponibilité SAV), selon une configuration technique, financière et de gestion<br />
intégrée.<br />
Différentes solutions techniques possibles ont été développées telles que les bornes<br />
fontaines électriques, les kits solaires PV individuels, les micro - réseaux locaux alimentés<br />
par petites centrales hydro-électrique ou groupes électrogènes, …<br />
Il mérite d’être mentionné que les acteurs locaux sont mobilisés à travers un partenariat<br />
Public Privé optimal.<br />
Plusieurs projets pilotes d’ERD ont précédé la généralisation du PERG en testant différentes<br />
configurations telles que :<br />
Le principe du « revolving fund » qui s’est avéré non adapté à un projet à caractère social<br />
(projet PSE 1990-1994 en coopération avec la GTZ) ;<br />
La subvention totale qui ne permet pas la pérennité du service (projet PPER réalisé avec<br />
le soutien de la coopération française, 1500 foyers concernés).<br />
3.3.2 Principe du FEE FOR SERVICE<br />
Le Principe du « Fee For Service » est retenu comme la solution de mise en œuvre d’une<br />
logique de programme ERD à l’échelle nationale, avec intégration des technologies EnR<br />
dans le processus du Programme d’Electrification Rural Global sur la base des acquis des<br />
projets pilotes réalisés. Le Fee for Service se présente comme suit :<br />
l’Opérateur Electrique : Pré-définition de la zone d’action, Mise à disposition d’une<br />
subvention, définition des niveaux d’équipements ;<br />
l’Opérateur Privé: promotion de l’offre solaire, contractualisation (signature des contrats<br />
d'abonnement avec les clients intéressés), fourniture et 'installation des kits, recouvrement<br />
des redevances mensuelles auprès des clients ; maintenance et renouvellement des<br />
composants (batterie, régulateur, ampoules et dépannage avec engagement<br />
d’intervention en moins de 2 jours), le recyclage des batteries, la gestion du programme ;<br />
les Usagers : remboursement des redevances mensuelles.<br />
2002<br />
2003<br />
72%<br />
2004<br />
2005<br />
88%<br />
2006<br />
2007<br />
98%<br />
497
498<br />
ENERGIE ET DEVELOPPEMENT DURABLE EN MEDITERRANEE<br />
Les contributions des foyers bénéficiaires pour un service moyen (6 points lumineux, 75 Wc)<br />
sont de 1800 Dhs à régler lors de l’abonnement avec une mensualité sur 10 ans de 96 Dhs /<br />
mois.<br />
Le concept de l’ERD est porteur d’efforts d’innovations techniques, d’organisation et de<br />
financement introduites au niveau de programmes pilotes intégrés d'ERD réalisés sur des<br />
échelles « vraie grandeur » (quelques 5000 foyers ruraux bénéficiaires en 1995).<br />
Si l’ERD par systèmes solaires photovoltaïques est aujourd’hui intégrée à grande échelle au<br />
niveau du PERG, son développement continue pour étendre son application à l’ensemble<br />
des services sociaux de base (santé, eau potable, éducation, …) ainsi que pour élargir sa<br />
base technologique (micro centrales hydro-électriques, petites éoliennes, systèmes<br />
hybrides, …).<br />
3.3.3 Quelques Enseignements liés au développement de l’ERD<br />
L’ERD est une solution appropriée pour l’extension de la couverture en électricité en<br />
milieu rural enclavé ;<br />
Les solutions EnR sont des solutions matures et adaptées ;<br />
L’approche FFS est une alternative pour le développement durable du concept de l’ERD ;<br />
La mise en place d’un cadre institutionnel favorable pour la massification de l‘ERD<br />
(Concession géographique …) est nécessaire.<br />
4. Pistes de réflexion pour un scénario de Développement Energétique<br />
plus durable<br />
4.1 Syn t h è se sur les pote n tialités d’URE et d’ER<br />
4.1.1 Energie Eolienne<br />
Avec 3500 km de côtes, un relief (chaînes montagneuses du Rif et de l’Atlas) et un régime<br />
des vents favorables, le Maroc dispose d’un potentiel réalisable (REF. 3) d’énergie éolienne<br />
considérable évaluer à 1065 MW à l’horizon 2012 (3.4 TWH) et à 3260 MW en 2020 (9.9<br />
TWH) avec une hypothèse de croissance annuelle de cette filière de 15%.<br />
Si un système incitatif adéquat est mis en place, ce potentiel pourrait atteindre en 2020,<br />
8700 MW (26.2 TWH, soit près de la moitié de la demande en énergie électrique en 2020),<br />
ce qui correspond à une croissance annuelle moyenne de 30%, équivalente à celle<br />
enregistrée en RFA. Ce potentiel n’est cependant réalisable que dans le cadre d’une<br />
stratégie d’exportation d’énergie verte avec les renforcements de réseau nécessaires. A<br />
noter que dans cette situation la rentabilité des investissements dépendra des conditions de<br />
valorisation des excédents à l‘étranger en heures creuses.<br />
Ce Potentiel de plusieurs milliers de MW (offshore non inclus) est localisé essentiellement<br />
dans les zones Nord avoisinant le Détroit du Gibraltar, les vallées intérieures d’orientation<br />
Ouest Est, les zones côtières d’ El Jadida à Cap Ghir et de Tarfaya à Dakhla.<br />
Depuis 1991, plus d’une cinquantaine de stations de mesure ont été installées par le CDER.<br />
Les résultats de ces mesures sont publiés dans l’Atlas Éolien du Maroc dont la dernière<br />
actualisation date de 2007.<br />
L’analyse de la ressource a permis l’identification de plusieurs sites très ventés. Les vitesses<br />
moyennes annuelles du vent à 40 mètres de hauteur sont de 9 à 11 m/s dans les régions de<br />
Tanger, Tétouan et Essaouira. Elles varient entre 7.5 et 8.5 m/s dans les régions de Dakhla,<br />
Tarfaya et Taza.<br />
La viabilité économique des Parcs éoliens implantés sur ces sites est très intéressante.<br />
L’étude CDER-IMET (Ministère Italien de l’Environnement) réalisée en 2005 évalue les coûts<br />
du KWH électrique produit dans une fourchette de 3.31 et 6.65 Euro Cent la première année<br />
d’exploitation.
4.1.2 Energie solaire<br />
MAROC - Etude Nationale<br />
Avec un rayonnement solaire annuel moyen de près 2 000 kWh/m² (REF. 3) le potentiel de<br />
mobilisation de cette ressource est aussi très important en particulier pour les applications<br />
basse températures (de 315 GWH en 2010 à 1360 GWH en 2020) et les applications<br />
photovoltaïques (80 MW en 2010 jusqu’à 2000 MW en 2020. La concrétisation de ces<br />
potentiels reste conditionnée par bon nombre de mesures nécessaires qui sont discutées ciaprès.<br />
4.1.3 Biomasse<br />
Par ailleurs, il ressort de l’étude « cadre réglementaire des ER au Maroc », en cours de<br />
finalisation par le CDER et la GTZ, un potentiel de biomasse très élevé et d’importance<br />
équivalente à celle de l’éolien grâce à la maturité des technologies de biogaz, au<br />
développement des cultures énergétiques et à la demande croissante des biocarburants.<br />
De manière synthétique, le tableau ci-dessous (REF. 3), présente les données rapportées<br />
par cette étude quant au potentiel « réalisable » pour les différents sous-produits biomasse.<br />
2010 2020<br />
Nature biomasse (GWH) (GWH)<br />
Purin (biogaz) 810 1190<br />
Abats (biogaz) 5.4 5.4<br />
<strong>Plan</strong>tes énergétiques (biogaz) 6224<br />
Gaz boues épuration (biogaz) 20 1166<br />
Gaz des décharges (biogaz) 620 1394<br />
Déchets biogènes 2251<br />
Déchets agricoles 1150<br />
<strong>Plan</strong>tes énergétiques (biodiesel) 9167<br />
4.1.4 Autres formes d’énergies renouvelables<br />
Grâce à une géologie considérée exceptionnelle (REF 16), le Maroc dispose de potentialités<br />
en géothermie basse température encore inexplorées, en particulier au niveau du Maroc<br />
nord (du Moyen Atlas à l’est du Rif oriental) et des bassins sédimentaires du Sahara (flux de<br />
chaleur élevé des îles Canaries au bassin de Tindouf).<br />
Aucune exploitation de cette forme d’énergie n’est encore pratiquée au Maroc bien que de<br />
nombreuses applications peuvent être envisagées telles le chauffage des serres dans le<br />
secteur de l’agriculture ou la climatisation des bâtiments collectifs.<br />
4.1.5 Potentiel d’efficacité énergétique<br />
Le potentiel d’efficacité énergétique est aussi considérable. La figure ci-dessous présente les<br />
estimations rapportées par l’Etude Banque Mondiale – MEM (REF. 1) et révèle des<br />
possibilités d’économie d’énergie de 23% à l‘horizon 2020 par rapport à un scénario dit « au<br />
fil de l’eau).<br />
Figure 10Estimations du potentiel d’efficacité énergétique - Economie d’énergie à l‘horizon 2020<br />
économie en Millions TEP<br />
5<br />
4<br />
3<br />
2<br />
1<br />
0<br />
Economie d'énergie<br />
industrie transport résidentiel tertiaire agriculture<br />
Source : Etude Banque Mondiale<br />
secteurs<br />
1990<br />
2000<br />
2010<br />
2020<br />
499
500<br />
ENERGIE ET DEVELOPPEMENT DURABLE EN MEDITERRANEE<br />
4.2 Propositions pour un scéna rio éne rgé ti q ue durable<br />
Les différentes études menées récemment mettent en exergue la faisabilité de promotion<br />
des Enr à grande échelle au Maroc, au-delà même du seuil de 10% retenu à l’horizon 2012.<br />
Le tableau ci-dessous présente un extrait de ces projections à l’horizon 2020 (REF.3) et<br />
illustre 2 niveaux d’ambition et par conséquent de soutien financier nécessaire pour 2<br />
scénarios particulièrement intéressants :<br />
Scénario 1 dit « portefeuille équilibré » considère l’ensemble des filières prometteuses à<br />
moyen terme : Eolien, Biogaz, Thermo solaires hautes températures, biodiesel ;<br />
Scénario 2 dit « solaire » intègre de manière plus prononcée encore les filières solaires<br />
thermiques et photovoltaïques pour la production d’électricité.<br />
Projection<br />
2020<br />
Production Coûts externes<br />
évités Millions<br />
€/an<br />
Coûts CO2 évité<br />
Millions €/an<br />
Coûts transfert (*)<br />
Millions €/an<br />
Emplois<br />
Scénario 1 4462 MW<br />
17.9 TWh/an<br />
318 140 132 12529<br />
Scénario 2 22.4 399 180 451 16818<br />
(*) Coûts de promotion par soutien financier<br />
Le Maroc gagnera à situer ses efforts, pour le moyen et le long terme, selon ces scénarios<br />
pour positionnement industriel effectif en la matière.<br />
Ainsi, la dynamique que connaît le secteur actuellement est confortée par le dispositif<br />
judicieux prévu par les pouvoirs publics pour la promotion des ER et de l’EE. Il est important<br />
pour une réelle concrétisation des orientations ainsi retenues de disposer au niveau des<br />
réformes envisagées:<br />
D’un système réglementaire plus intégré (énergie, industrie, environnement,<br />
aménagement du territoire,…), mobilisant l’ensemble des départements et organismes<br />
concernés en terme de planification ; Ce système devra être tourné vers l’opérationnel et<br />
décliné en décrets d’application précis ;<br />
D’une organisation institutionnelle (départements et organismes) forte et efficiente à<br />
même de répondre aux attentes d’animation du secteur (coordination, planification,<br />
incitation, régulation, contrôle, arbitrage,..), de promotion des filières notamment au sein<br />
des programmes économiques et sociaux stratégiques de développement du pays, de<br />
renforcement de capacité et d’encadrement des intervenants, d’accompagnement des<br />
investisseurs potentiels,… ;<br />
D’une stratégie de mobilisation des investisseurs potentiels nationaux et internationaux<br />
agissant dans ce domaine en levant les barrières à la participation des entreprises privées<br />
dans l’effort de promotion des ER et de l’EE (rupture du monopole de production, accès<br />
au réseau électrique, cadre approprié d’intervention de compagnies de services<br />
énergétiques ou ESCOs,..) ;<br />
D’une stratégie de mobilisation des opérateurs privés pour une disponibilité d’offres<br />
d’équipements de services de qualités, de modes de financements adaptés et de<br />
mécanismes assurant une bonne articulation entre les interventions des différents<br />
acteurs, notamment au moyen d’une base partenariale (publique & privé) novatrice<br />
oeuvrant pour un positionnement national voir régional des opérateurs ;<br />
De dispositions fiscales plus favorables aux ER et à l’EE, réduisant en particulier les<br />
distorsions créées par les subventions aux gaz butane et au diesel (intégration réelle des<br />
ER et de l’EE dans la stratégie de développement du secteur énergétique) ;<br />
De dispositions financières spécifiques aux projets du secteur public (santé, éducation,<br />
collectivités locales,..) par l’adaptation, au niveau des lois de finances, des ressources à la<br />
nature de tels projets (exemple de financement en leasing sur les budgets de<br />
fonctionnement). Ces dispositions sont, par ailleurs, de nature à contribuer à l’émergence<br />
d’un marché durable des ER et de l’EE ;<br />
De dispositions financières permettant la prise en charge par la collectivité des coûts des<br />
transferts technologiques pour la concrétisation du potentiel de contribution des ER et de
MAROC - Etude Nationale<br />
l’EE au soutien à l’économie (compétitivité, investissements industriels, emplois), à la<br />
préservation de l’environnement ;<br />
D’une base normative large, obligatoire promue au moyen de labellisation progressive de<br />
l’ensemble des équipements et services liés aux ER et a l’EE ;<br />
Des moyens d’accompagnement et de contrôle nécessaires souvent parents pauvres de<br />
politiques ER et EE ;<br />
D’une stratégie de renforcement des capacités (recherche et développement,<br />
programmes de formation académique et continue) et de sensibilisation pour l’émergence<br />
d’une culture ER et EE au niveau du grand public.<br />
501
5. Bibliographie<br />
502<br />
ENERGIE ET DEVELOPPEMENT DURABLE EN MEDITERRANEE<br />
(REF. 1) Politique, programmes et instruments pour un <strong>Plan</strong> National d'efficacité énergétique (Banque Mondiale,<br />
ICE-Burgeap, décembre 2006)<br />
(REF. 2) Etude du Cadre Réglementaire de l’Eolien au Maroc (Banque Mondiale – MEM, mars 2007)<br />
(REF. 3) Etude sur la cadre organisationnel et législatif pour la promotion des ER (CDER – GTZ, juillet 2007<br />
(REF. 4) Mécanismes Financiers pour le Développement des Energies Renouvelables et de l’Efficacité<br />
Energétique dans les Pays en voie de Développement (BEI, rapport intermédiaire, Septembre 2006)<br />
(REF. 5) Développement énergétique au Maroc depuis 1955 ; perspectives 2025 (Mounir Debbagh, 2005)<br />
(REF. 6) Energies, Perspective 2030 : haut commissariat au plan (juillet 2007)<br />
(REF. 7) Conseil National de l’Environnement (mai 2007)<br />
(REF. 8) CDER, Atlas Eolien (2007)<br />
(REF. 9) Technical and economical feasibility study of wind farms in Morocco (CDER – IMET 2005)<br />
(REF. 10) CDER, Rapport d’Activités Promasol (2006-2007)<br />
(REF. 11) CDER, Rapport d’Activité Programme Bois de Feu (2006)<br />
(REF. 12) Rapport d’Activité Programme Maison Energie (2006)<br />
(REF. 13) Communication MEM (juillet 2007)<br />
(REF. 14) Communications ONE (octobre 2006, juillet 2007)<br />
(REF. 15) Etude du marché de l'environnement au Maroc Analyse et perspectives (MATEE, mars 2007)<br />
(REF. 16) Communications M. Jacques Varet BRGM, (Casablanca, juin 2006)<br />
(REF. 17) Pétrole et pays importateurs en Développment : Cas du Maroc (IEPF, liaison énergie, 1ier trimestre<br />
2006, A. Bencheqroun, A. Haddouche)<br />
(REF. 18) Analyse du potentiel de Cogénération dans l’industrie marocaine (MEM - IDAE, 2001)<br />
(REF. 19) Journée Débat National sur l’Energie, Problèmatique d’approvisionnement, Mr Said El Oufir, Directeur<br />
des Combustibles et des Carburants, Rabat, 3O octobre 2006<br />
(REF. 20) Journée Débat National sur l’Energie, Programme National de Développement des Energies<br />
Renouvelables et de l’Efficacité Energétique, Mme Amal Haddouche, DG du CDER, Rabat, 3O octobre 2006<br />
(REF. 21) Journée Débat National sur l’Energie, L’Energie au Rendez vous du Développement, Mr Younes<br />
Maamar, DG de l’ONE, Rabat, 3O octobre 2006<br />
(REF. 22) Energy Efficiency Codes in Residential Buildings and Energy Efficiency, CDER & UNDP project<br />
document, Juillet 2007<br />
(REF. 23) Prêt de Politique de Développement du Secteur de l’Energie au Maroc, juillet 2007<br />
(REF. 24) Journée Débat National sur l’Energie, Bilan et perspective de la Recherche pétrolière au Maroc, Mr<br />
M’hammed El Mostaine, ONHYM, Rabat, 3O octobre 2006<br />
(REF. 25) Journée Débat National sur l’Energie, Libéralisation et modernisation du Secteur de l’électricité au<br />
Maroc, Mr Abderrahim El Hafidi, Directeur de l’Electricité et des Energies Renouvelables, Rabat, 3O octobre<br />
2006
6. Table des illustrations<br />
MAROC - Etude Nationale<br />
Figure 1 Dépendance par rapport aux Produits Pétroliers ........................................................................................................... 475<br />
Figure 2 Dépendance par rapport au charbon ............................................................................................................................ 476<br />
Figure 3 Consommation butane ................................................................................................................................................ 480<br />
Figure 4 Intensité énergétique primaire (REF. 1) ........................................................................................................................ 486<br />
Figure 5 Surfaces installées des chauffe-eau solaires au Maroc (en m 2) ..................................................................................... 488<br />
Figure 6 L’hydro-électricité au Maroc ................................................................................................................................ 490<br />
Figure 7 Macarons de labélisation du Promasol ......................................................................................................................... 493<br />
Figure 8 Schéma de principe de la Chaudière ............................................................................................................................ 496<br />
Figure 9 Accès à l’électricité dans le milieu rural. 1995-2007 .................................................................................................... 497<br />
Figure 10Estimations du potentiel d’efficacité énergétique - Economie d’énergie à l‘horizon 2020 ............................................. 499<br />
Figure 11 Prix moyen d’achat du pétrole brut ............................................................................................................................. 504<br />
Figure 12 Evolution de la Facture pétrolière ............................................................................................................................... 504<br />
Figure 13 Evolution de la croissance de la demande d’énergie électrique ................................................................................... 507<br />
Figure 14 Courbe de Charge journalière .................................................................................................................................... 507<br />
Figure 15 Evolution projetée de la capacité du parc de production électrique ............................................................................. 508<br />
Tableau 1 Consommation d’Energie Primaire (extrait REF. 3) ..................................................................................................... 478<br />
Tableau 2 Parc de production .................................................................................................................................................... 478<br />
Tableau 3 Production d’électricité (Extrait REF. 3) ...................................................................................................................... 479<br />
Tableau 4 Achat d’électricité ..................................................................................................................................................... 479<br />
Tableau 5 Distribution d’électricité ............................................................................................................................................ 479<br />
Tableau 6 Un portefeuille de projets diversifié ........................................................................................................................... 487<br />
Tableau 7 Impacts prévus des action DSM e développement ...................................................................................................... 492<br />
Tableau 8 Récapitulatif des consommations dans 5 zones pilote de l’étude (REF. 11)................................................................. 494<br />
Tableau 9 Présentation des établissements sociaux économiques ............................................................................................. 495<br />
Tableau 10 Programme d’équipement de l’ONE ......................................................................................................................... 508<br />
503
Annexe 1<br />
504<br />
ENERGIE ET DEVELOPPEMENT DURABLE EN MEDITERRANEE<br />
Evolution de la facture pétrolière du Maroc (REF 17)<br />
Figure 11 Prix moyen d’achat du pétrole brut<br />
Figure 12 Evolution de la Facture pétrolière
Annexe 2<br />
MAROC - Etude Nationale<br />
Evolutions des Production, importation et consommation d’Energie au Maroc (REF 6)<br />
RUBRIQUES 1980 1985 1990 1995 2000 2001 2002 2003 2004 2005<br />
PRODUCTION 824,60 652,50 668,90 539,20 271,1 328,3 320,5 475,7 522,8 466,2<br />
Electricité hydraulique 397,20 126,30 317,10 159,60 187,2 226,9 221,6 378,0 416,0 367,6<br />
Electricité Eolienne - - - - 16,6 53,3 50,4 52,8 51,7 53,6<br />
Charbon 380,80 433,70 294,60 363,80 17,3 1,1 0,2 0.1 0 0<br />
Pétrole brut 12,80 20,70 13,90 4,80 12,1 9,4 11,9 9,7 10,1 6,7<br />
Gaz naturel 51,80 71,80 43,30 11,00 37,9 37,6 36,4 35,1 42,5 38,3<br />
IMPORTATION 3 889,90 4 959,10 6 541,40 8 433,70 11 056,7 12 225,4 11 337,0 11 125,9 12034,6 13258,2<br />
Electricité - - - 63,10 614,4 406,6 362,0 373.9 399,1 211,6<br />
Charbon 18,90 295,80 809,10 1 274,70 2 614,9 3 389,1 3 360,9 3227.2 3657,4 3812,9<br />
Pétrole brut 3 708,80 4 440,80 5 283,30 5 931,50 6 373,3 6 750,9 5 942,3 4290.9 5671,1 6561,7<br />
Produits pétroliers 162,20 222,50 449,00 1 617,80 1 454,1 1 678,8 1 671,8 3233.9 2307,0 2672,0<br />
CONSOMMATION 4 686,00 5 156,40 6 486,00 8 012,30 9 775,2 10 361,8 10 509,1 10 793,3 11516,0 12316,8<br />
Electricité (1) 397,20 126,30 317,10 223,80 818,2 686,8 634,0 804.7 866,8 632,80<br />
Charbon 371,20 662,50 1 095,60 1 633,40 2 684,5 3 472,5 3 398,9 3272.6 3620,0 3716,0<br />
Produits pétroliers 3 865,80 4 295,80 5 030,00 6 144,10 6 234,6 6 164,9 6 444,7 6680.9 6984,2 7582,0<br />
Gaz naturel 51,80 71,80 43,30 11,00 37,9 37,6 36,4 35.1 42,0 386,0<br />
(1) Hydraulique + éolienne<br />
505
Annexe 3<br />
506<br />
ENERGIE ET DEVELOPPEMENT DURABLE EN MEDITERRANEE<br />
Fiche Projet « Code Efficacité Energétique dans le Bâtiment » (REF 22)<br />
Contexte<br />
Absence de considérations énergétiques dans la conception, la construction, l’équipement<br />
et la gestion des bâtiments collectifs<br />
Augmentation sensible des dépenses énergétiques suite à des attentes de qualité de<br />
service et de confort social de la part des usagers.<br />
Objectifs<br />
Intégration des considérations énergétiques dans trois secteurs clefs de la politique de<br />
développement du Maroc (Santé, Hôtellerie et Logements collectifs)<br />
Effort d’efficacité énergétique concentré sur trois axes :<br />
la conception des bâtiments<br />
le fonctionnement des équipements<br />
la gestion énergétique dans les bâtiments.<br />
Grands volets du projet<br />
Élaboration et mise en place d’un code de réglementation thermique du bâtiment et des<br />
normes techniques pour professionnels du bâtiment (plans de conception, exposition au<br />
soleil, enveloppe de construction, matériaux de construction et d’isolation, systèmes<br />
électromécaniques de chauffage et de climatisation, etc..)<br />
Levée des contraintes et promotion d’initiatives multisectorielles<br />
Mise en place d’une stratégie de mobilisation, sensibilisation et promotion des<br />
investissements en efficacité énergétique dans le secteur du Bâtiment<br />
Réalisation d’un portefeuille de 50 projets de démonstration.<br />
<strong>Plan</strong> de financement<br />
Source de financement Phase préparatoire Phase exécutoire<br />
PNUD-FEM 275,000 US$ 3.000.000 US$<br />
UNDP-Rabat 50.000 US$<br />
CDER 26.000 US$<br />
IMET (Italie) 1.200.000 US$<br />
FFEM (France) 1.000.000 US$<br />
Ministère Santé 2.000.000 US$<br />
Secteur de l’Habitat 6.000.000 US$<br />
Secteur Hôtellerie 2.000.000 US$<br />
TOTAL 351.000 US$ 15.000.000 US$
Annexe 4<br />
MAROC - Etude Nationale<br />
Figure 13 Evolution de la croissance de la demande d’énergie électrique<br />
Figure 14 Courbe de Charge journalière<br />
507
Annexe 5<br />
508<br />
ENERGIE ET DEVELOPPEMENT DURABLE EN MEDITERRANEE<br />
Tableau 10 Programme d’équipement de l’ONE<br />
Ouvrages hydroélectriques 440 MW 3,2 milliards dh<br />
Turbines à gaz et<br />
groupes diesel<br />
Centrale thermosolaire<br />
Ain Béni Mathar<br />
(gaz naturel)<br />
700 MW 3,9 milliards dh<br />
472 MW 5,0 milliards dh<br />
Parcs Eoliens 1000 MW 13,8 milliards dh<br />
Centrale à charbon 1.320 MW 21,6 milliards dh<br />
Figure 15 Evolution projetée de la capacité du parc de production électrique<br />
15 000 MW<br />
12 500<br />
10 000<br />
7 500<br />
5 000<br />
2 500<br />
0<br />
5 312 5 352<br />
6 524<br />
7 364<br />
7 964<br />
9 284<br />
10 484<br />
11 284<br />
12 604<br />
2007 2008 2009 2010 2011 2012 2013 2014 2015
SYRIA<br />
Eng. Ashraf Kraidy, National Energy Research Center<br />
TABLE OF CONTENTS<br />
I. Summary ........................................................................................................................ 511<br />
1. Challenges and energy sustainability.................................................................................................... 511<br />
2. Indicators ................................................................................................................................................... 512<br />
3. The currently established policies in terms of RE and RUE ............................................................... 512<br />
4. Difficulties, possible solutions, needed reforms ................................................................................. 512<br />
5. Success story............................................................................................................................................. 512<br />
II. Résumé ......................................................................................................................... 513<br />
1. Défis et durabilité ..................................................................................................................................... 513<br />
2. Indicateurs ................................................................................................................................................. 514<br />
3. Les politiques d’ER et d’URE actuellement en place .......................................................................... 514<br />
4. Blocages, solutions possibles, réformes nécessaires ........................................................................ 514<br />
5. Les Success stories .................................................................................................................................. 515<br />
III. National study .............................................................................................................. 517<br />
Introduction .................................................................................................................................................... 517<br />
1. The country's energy situation: indicators & basic data .................................................................... 517<br />
2. Rational Energy Use (RUE) - Renewable Energies (RE): (policies, tools, progress, resulting<br />
effects, case studies) .................................................................................................................................... 538<br />
3. Examples of good practice, case studies ............................................................................................. 562<br />
4. Proposals for more sustainable energy development ........................................................................ 566<br />
5. List of illustrations .................................................................................................................................... 570
I. SUMMARY<br />
SYRIA - Summary<br />
1. Challenges and energy sustainability<br />
The following table illustrates energy demand in 2005 and some related indicators:<br />
Indicator<br />
Population<br />
Total Energy Demand<br />
Average energy demand growth rate 1990- 2005<br />
Oil Derivatives<br />
Natural Gas<br />
Hydropower<br />
Biomass<br />
Electrical power produced<br />
GDP<br />
Energy Intensity<br />
Per Capita Share of All Energy resources<br />
Per Capita Share of Electrical Energy<br />
The proportion of the contribution of electric energy in energy balance<br />
Energy Dependency<br />
Value<br />
18.5<br />
20.96<br />
5.4<br />
14.202<br />
5.4<br />
0.758<br />
0.6<br />
34.935<br />
30<br />
907<br />
1133<br />
1886<br />
39.4<br />
Unit<br />
Million inhabitants<br />
Million TOE<br />
%<br />
Million TOE<br />
Million TOE<br />
Million TOE<br />
Million TOE<br />
Billion KWh<br />
Billion Euro<br />
KgOE/1000$<br />
KgOE/year<br />
KWh/year<br />
1995 2000 2005 2010 2015 2020<br />
Domestic supply (MTOE) 34.67 33.57 28.26 26.7 24.9 23.7<br />
Domestic demand (MTOE) 12.34 15.75 21.07 26.47 34.59 45.21<br />
Energy dependency rate % - 181 - 113 - 34 - 8 28 47.5<br />
Regarding the Environmental challenges connected with energy issues the total CO2<br />
emissions caused by energy sector is about 18.528 million tones which be as 45% of the<br />
total CO2 emissions in Syria, there are many procedure done to decrease GHG emissions<br />
including regulations, frameworks, obligations.<br />
Recognizing the importance of Kyoto Protocol in GHG Reduction, Syria certified the protocol<br />
in the mid of 2005.<br />
The Sustainable Development Criteria for CDM projects in Syria include the following:<br />
1) Conformity to political and legal dispositions<br />
2) Contribution to:<br />
a) Technology Autonomy.<br />
b) Sustainable use of Natural Resources.<br />
c) Social Criteria (Improve Quality of Life and Equity, Alleviate Poverty).<br />
d) Economic criteria (Provide Financial returns to Local Entities, Transfer of New<br />
Technology).<br />
e) Environmental Criteria (Mitigation of Global Climate Change, Reduce GHG,<br />
Conserve Local Resources).<br />
Regarding the degree of the sustainability and the awareness about energy issues and<br />
climate change from decision-makers and citizens in your country, it became very high in the<br />
governmental level (decision-makers) the last few years, which lead to create programmes,<br />
frameworks, regulations, and legislations concerning GHG effects and energy demand as<br />
mentioned in the study.<br />
The public awareness is growing in sequence with improving the magnesium of the related<br />
programmes.<br />
%<br />
511
2. Indicators<br />
512<br />
ENERGY AND SUSTAINABLE DEVELOPMENT IN THE MEDITERRANEAN<br />
Regarding the share of renewable energy observed in the country, the only renewable<br />
energies that affect the energy share in Syria are just the Hydropower and biomass, the<br />
following table illustrates the share of renewable energy in the total energy produced in Syria:<br />
Energy (million TOE) 2000 2001 2002 2003 2004 2005<br />
Total 16.19 16.54 17.76 18.41 20.08 20.85<br />
Hydro 0.63 0.53 0.55 0.62 0.93 0.76<br />
Biomass 0.6 0.6 0.6 0.6 0.6 0.6<br />
Ratio of RE % 7.6 6.8 6.5 6.6 7.6 6.5<br />
The planned is to raise the percentage of RE of the total energy production to 7.5% in 2020<br />
through activating solar and wind energies in all sectors.<br />
Regarding Energy efficiency observed in the country the “Energy efficiency law” which will be<br />
issuance within 2007 will regulate the procedures of EE in all sectors<br />
The following table illustrates the estimated EE potential saving of the total energy demand in 2020<br />
Activity Ratio<br />
Energy Efficient Building 2,5%<br />
Efficient Home Appliances 2%<br />
Electrical Grid Efficiency Improvement 2%<br />
Energy Auditing 2%<br />
Total 16 %<br />
3. The currently established policies in terms of RE and RUE<br />
Working on national strategies, legislations, incentives, tools and actions regarding RE&RUE<br />
in Syria is in progress, for instance three new legislations will be issuance within 2007<br />
“Energy Efficiency Law”, “Energy efficiency Home appliances Labels and Standards”,<br />
“Building Thermal Insulation code” which include many types of incentives, this will lead to a<br />
good level of organized implementation of the RE&RUE projects and technologies transfer.<br />
The main objectives are decreasing the fossil fuel demand and climate changes issues.<br />
4. Difficulties, possible solutions, needed reforms<br />
As in many MENA countries there are such a difficulties related to RE&RUE implementation,<br />
but many of these difficulties are related to the socio-economic situation as energy prices<br />
and subsidies, lack of public awareness, regulatory framework, and financial support.<br />
Nowadays many improving steps carried out towards RE&RUE widespread in Syria,<br />
overcoming many obstacles, but also facing some difficult situations that need to be solved<br />
at the national high level.<br />
5. Success story<br />
Many years ago the directions was to widespread solar water heaters in all sectors in Syria,<br />
this year many actions have been made to generalize using this technology.<br />
Many meetings were held with all related organizations, associations and local<br />
manufacturers to improve solar water heating technology in the fields of researches,<br />
productions, and awareness.<br />
All that actions resulted the following:<br />
1) Execution many pilot projects in all sectors accompany with programmes to widespread<br />
the technology.<br />
2) Develop the accredit standards regarding solar water heating systems.<br />
Adopt installation solar water heating systems in all governmental buildings.
II. RÉSUMÉ<br />
1. Défis et durabilité<br />
SYRIA - Résumé<br />
Le tableau ci-dessous présente les évolutions de la demande en énergie en 2005 ainsi que<br />
plusieurs indicateurs afférents.<br />
Indicateur<br />
Population<br />
Demande totale d’énergie<br />
Taux de Croissance moyen de la demande en énergie entre<br />
1990 et 2005<br />
Dérivés hydrocarbures<br />
Gaz Naturel<br />
Hydroélectricité<br />
Biomasse<br />
Electricité produite<br />
PIB<br />
Intensité Energétique<br />
Total des ressources énergétiques par habitant<br />
Total électricité par habitant<br />
Pourcentage de la contribution de l’énergie électrique au<br />
bilan énergétique national<br />
Dépendance énergétique<br />
Valeur<br />
18.5<br />
20.96<br />
5.4<br />
14.202<br />
5.4<br />
0.758<br />
0.6<br />
34.935<br />
30<br />
907<br />
1133<br />
1886<br />
39.4<br />
Unité de référence<br />
Million d’Habitants<br />
Million Tep<br />
%<br />
Million Tep<br />
Million Tep<br />
Million Tep<br />
Million Tep<br />
Milliard KWh<br />
Milliard Euro<br />
KgOE/1000$<br />
Kgep/an<br />
KWh/an<br />
1995 2000 2005 2010 2015 2020<br />
Ressources nationales (MTep) 34.67 33.57 28.26 26.7 24.9 23.7<br />
Demande nationale (MTep) 12.34 15.75 21.07 26.47 34.59 45.21<br />
Taux de dépendance énergétique % - 181 - 113 - 34 - 8 28 47.5<br />
Le total des émissions de CO2 du secteur énergétique, un des enjeux environnementaux<br />
majeurs, représentent environ 18 528 tonnes, soit 45% du total des émissions nationales. Le<br />
pays s’est doté de nombreuses procédures de réduction des émissions de gaz à effets de<br />
serre telles que réglementations, cadre législatif, obligations...<br />
Consciente de l’importance du Protocole de Kyoto en matière de réduction des gaz à effets<br />
de serre, la Syrie a approuvé l’accord relatif au protocole en 2005.<br />
En ce qui concerne les projets MDP, la Syrie a choisi d’appliquer les critères de<br />
développement durable suivants :<br />
1) Conformité aux dispositions légales et politiques.<br />
2) Contributions à :<br />
f) Indépendance technologique<br />
g) Utilisation durable des ressources naturelles<br />
h) Critères sociaux (amélioration de la qualité de la vie, équité sociale, lutte contre<br />
la pauvreté)<br />
i) Critères économiques (bénéfices financiers aux entités locales, transfert de<br />
nouvelles technologies)<br />
j) Critères Environnementaux (atténuation du changement climatique, réduction<br />
des gaz à effets de serre, protection des ressources nationales).<br />
Ces dernières années, les décideurs et citoyens du pays sont de plus en plus sensibilisés<br />
aux questions énergétiques et du changement climatique. Depuis quelques années, le<br />
gouvernement travaille à élaborer les programmes et les cadres législatifs et réglementaires<br />
%<br />
513
514<br />
ENERGY AND SUSTAINABLE DEVELOPMENT IN THE MEDITERRANEAN<br />
applicables aux gaz à effets de serre et à la demande en énergie, comme cela a été indiqué<br />
dans l’étude effectuée.<br />
Le grand public est de plus en plus sensibilisé à son tour.<br />
La sensibilisation du public s’accroît en conséquence permettant ainsi l’amélioration des<br />
programmes qui y sont liés.<br />
2. Indicateurs<br />
En Syrie, les seules énergies renouvelables qui contribuent significativement à la part du<br />
secteur énergétique sont l’hydro-énergie et la biomasse. Le tableau ci-dessous présente la<br />
part des ER dans la production nationale totale d’énergie.<br />
Energie (en million tep) 2000 2001 2002 2003 2004 2005<br />
Total 16.19 16.54 17.76 18.41 20.08 20.85<br />
Hydro 0.63 0.53 0.55 0.62 0.93 0.76<br />
Biomasse 0.6 0.6 0.6 0.6 0.6 0.6<br />
Ratio des ER % 7.6 6.8 6.5 6.6 7.6 6.5<br />
Il est prévu d’augmenter la part des ER à 7,5% de la production énergétique totale d’ici 2020,<br />
par l’utilisation généralisée de l’énergie solaire et éolienne.<br />
Une loi spécifique à l’efficacité énergétique sera promulguée courant 2007, portant sur les<br />
procédures règlementaires dans ce domaine.<br />
Le tableau ci-dessous présente le potentiel d’économies dans la demande totale en énergie<br />
d’ici 2020.<br />
Secteur d’activité Ratio<br />
Efficacité énergétique dans le bâtiment 2,5%<br />
Equipements énergétiques des logements 2%<br />
Amélioration de l’efficacité du réseau électrique national 2%<br />
Audits énergétiques 2%<br />
Total 16 %<br />
3. Les politiques d’ER et d’URE actuellement en place<br />
La Syrie élabore actuellement les stratégies nationales, le cadre législatif, les mesures<br />
incitatives ainsi que les outils de promotion et les plans d’action dans le domaine des ER et<br />
de l’URE. C’est ainsi que trois nouvelles lois verront le jour en 2007, portant sur l’efficacité<br />
énergétique, les normes et labels relatifs aux équipements dans les logements, ainsi que le<br />
code de l’isolation thermique dans les bâtiments. Elles incluent plusieurs types d’incitations.<br />
Ces initiatives permettront une meilleure mise en oeuvre des projets ER et URE et des<br />
transferts de technologie.<br />
Les objectifs principaux de la Syrie visent la réduction de la demande en énergies fossiles et<br />
les questions du changement climatique.<br />
4. Blocages, solutions possibles, réformes nécessaires<br />
La Syrie, comme de nombreux pays de la zone MENA (pays arabes d’Afrique du Nord et du<br />
Moyen-Orient), rencontre des difficultés dans la mise en oeuvre des politiques ER et URE.<br />
Ces difficultés sont liées le plus souvent à des facteurs socio-économiques, tels que la<br />
tarification et les subventions, le manque de sensibilisation du public, de cadre règlementaire<br />
et de soutien financier.<br />
De nombreux projets sont en cours pour diffuser largement les ER et l’URE en Syrie ; ils<br />
permettent de juguler ces difficultés, mais il est essentiel de trouver des solutions au plus<br />
haut niveau national.
5. Les Success stories<br />
SYRIA - Résumé<br />
Depuis longtemps, la Syrie s’oriente vers l’utilisation généralisée des chauffe-eau solaires et<br />
met en œuvre actuellement les plans d’action nécessaires à sa mise en œuvre.<br />
De nombreuses réunions ont été organisées avec les organismes locaux, les associations et<br />
les industriels afin de promouvoir l’utilisation de la technologie solaire dans les domaines de<br />
la recherche, de la fabrication et de la sensibilisation.<br />
Les résultats de ces approches sont les suivants :<br />
1) La mise en œuvre de projets sectoriels et de campagnes de promotion des technologies<br />
ER et URE.<br />
2) L’élaboration de normes applicables aux chauffe-eau solaires.<br />
L’installation dans tous les bâtiments officiels de chauffe-eau solaire.<br />
515
III. NATIONAL STUDY<br />
Introduction<br />
SYRIA - National study<br />
The Syrian Arab Republic lies on the eastern coast of the <strong>Mediterranean</strong> Sea, bounded by<br />
Turkey to the north, Iraq to the east, Palestine & Jordan from the south and by Lebanon &<br />
The <strong>Mediterranean</strong> Sea to the west.<br />
The total area of SAR is 18517971 hectares of which 6 million hectares are cultivated land &<br />
the remained is desert and Rocky Mountains. The Syrian Desert is suitable for grass growing<br />
& is used as pastures during sufficient rainfall.<br />
The climate of the <strong>Mediterranean</strong> Sea generally prevails in Syria, this climate may be<br />
characterized by rainy winter & a dry hot summer separated by two short transitional<br />
seasons. The coastal region is characterized by heavy rainfall in winter & moderate<br />
temperature & high relative humidity in summer .The interior is characterized by a rainy<br />
winter season and a hot dry season during summer, the area in the mountains with an<br />
altitude of 1000 meters or more characterized by rainy winter where rainfall may exceed<br />
1000 mm & moderate climate in summer.<br />
1. The country's energy situation: indicators & basic data<br />
1.1 Share of t he Energy S ecto r and Insti tu ti onal Specificities<br />
The sectors economic weight:<br />
Energy share in the GDP (%)<br />
The Syrian population was about 18.269 Million at mid 2005, of which 9.197 Million was<br />
considered as "urban." According to the population census, the average annual growth rate<br />
was 2.45 during nineteenth of 20 th century. The GDP share illustrated in the following table:<br />
Table 1 Basic data on the economic structure of Syria<br />
Years 2000 2001 2002 2003<br />
GDP (Billion SP) 903.9 950.24<br />
5<br />
1006.431<br />
1105.582<br />
1155.386<br />
Population (thousand) 16320 16720 17130 17550 17921 18269<br />
GDP per capita (SP per year) 61692<br />
GDP distributed as follows:<br />
Agriculture (%) 25 25 23 24<br />
Mining & Manufacturing 30 27<br />
Building & construction (%) 3 3 3 3<br />
Wholesale & retail trade (%) 15 7 18<br />
Transport & communication (%) 13 13 13 11 3<br />
Finance & insurance (%) 4 3 3 4<br />
Social & Personal services (%) 2 2 3 3 2<br />
Government services (%) 8 8 10 9<br />
Private non- Profit services 0 0 0 0 0 0<br />
Customs duties 0 0 0 0 2 2<br />
Value of imputed monetary 0 0 0 0 -1 -1<br />
Total (%) 100 100 100 100 100 100<br />
517
518<br />
ENERGY AND SUSTAINABLE DEVELOPMENT IN THE MEDITERRANEAN<br />
As shown from the previous table, the energy share in the GDP (%) decreased from 30%<br />
down to 24%, which reflects that Syrian economy become less dependent on energy sector<br />
as main producer for GDP.<br />
Table 2 Energy shares in export and import (absolute value and percentage of the total) per type of<br />
energy (oil, gas, coal, electricity, other)<br />
Years 1990 1991 1992 1993 1994<br />
Label Export Import Export Import Export Import Export Import Export Import<br />
Oil & OP 1754 45 1687 29 1983 48 1934 149 703 23<br />
% of total<br />
exports &<br />
imports in<br />
Syria<br />
45.19% 0.20% 53.36% 1.15% 69.58% 1.48% 66.71% 3.91% 56.23% 1.18%<br />
NG & LPG 0 20 0 30 0 31 0 16 0 8<br />
% of total<br />
exports &<br />
imports in<br />
Syria<br />
0.00% 0.09% 0.00% 1.19% 0.00% 0.96% 0.00% 0.42% 0.00% 0.43%<br />
Electricity 0 0 0 0 0 0 0 0 0 0<br />
% of total<br />
exports &<br />
imports in<br />
Syria<br />
Total<br />
value of<br />
energy<br />
exports &<br />
imports<br />
% of total<br />
exports &<br />
imports in<br />
Syria<br />
Total<br />
value of<br />
exports &<br />
imports in<br />
Syria<br />
US$<br />
exchange<br />
rate (SP)<br />
0.00% 0.00% 0.00% 0.00% 0.00% 0.00% 0.00% 0.00% 0.00% 0.00%<br />
1754 66 1687 60 1983 78 1934 165 703 31<br />
45.19% 0.30% 53.36% 2.34% 69.58% 2.44% 66.71% 4.32% 56.23% 1.62%<br />
3882 22115 3161 2551 2851 3217 2900 3815 1249 1926<br />
12.18 12.18 12.18 12.18 31.87<br />
Unit: Million US$ (note: see below US$ exchange rate (SP))<br />
Years 1995 1996 1997 1998 1999<br />
Label Export Import Export Import Export Import Export Import Export Import<br />
Oil & OP 818 9 896 24 650 33 420 27 562 13<br />
% of total<br />
exports &<br />
imports in<br />
Syria<br />
62.53% 0.60% 68.42% 1.34% 63.58% 3.16% 43.48% 2.83% 67.16% 1.42%<br />
NG & LPG 0 7 0 8 0 11 0 11 0 13<br />
% of total<br />
exports &<br />
imports in<br />
Syria<br />
0.00% 0.46% 0.00% 0.43% 0.00% 1.05% 0.00% 1.13% 0.00% 1.38%<br />
Electricity 19 0 61 0 32 0 30 0 45 0<br />
% of total<br />
exports &<br />
imports in<br />
Syria<br />
1.43% 0.00% 4.63% 0.00% 3.09% 0.00% 3.06% 0.00% 5.43% 0.00%
SYRIA - National study<br />
Years 1995 1996 1997 1998 1999<br />
Label Export Import Export Import Export Import Export Import Export Import<br />
Total<br />
value of<br />
energy<br />
exports &<br />
imports<br />
% of total<br />
exports &<br />
imports in<br />
Syria<br />
Total<br />
value of<br />
exports &<br />
imports in<br />
Syria<br />
US$<br />
exchange<br />
rate (SP)<br />
837 16 956 31 681 44 449 38 607 26<br />
63.96% 1.06% 73.05% 1.77% 66.68% 4.21% 46.54% 3.96% 72.59% 2.80%<br />
1308 1552 1309 1761 1022 1051 966 961 836 925<br />
34.06 34.29 43.01 45.51 46.5<br />
Years 2000 2001 2002 2003 2004 2005<br />
Label Export Import Export Import Export Import Export Import Export Import Export Import<br />
Oil & OP 3505 152 4003 188 4811 125 4066 185 3472 466 4363 2522<br />
% of total<br />
exports &<br />
imports in<br />
Syria<br />
NG &<br />
LPG<br />
% of total<br />
exports &<br />
imports in<br />
Syria<br />
75.39% 3.77% 76.56% 3.97% 70.82% 2.47% 71.35% 3.63% 67.62% 6.91% 49.87<br />
%<br />
0 61 0 7 6 39 0 0 0 33 4 28<br />
24.34<br />
%<br />
0.00% 1.50% 0.00% 0.15% 0.09% 0.78% 0.00% 0.00% 0.00% 0.50% 0.04% 0.27%<br />
Electricity 101 0 77 0 44 0 21 0 48 0 89 0<br />
% of total<br />
exports &<br />
imports in<br />
Syria<br />
Total<br />
value of<br />
energy<br />
exports &<br />
imports<br />
% of total<br />
exports &<br />
imports in<br />
Syria<br />
Total<br />
value of<br />
exports &<br />
imports in<br />
Syria<br />
US$<br />
exchange<br />
rate (SP)<br />
2.17% 0.00% 1.47% 0.00% 0.65% 0.00% 0.37% 0.00% 0.93% 0.00% 1.02% 0.00%<br />
3606 213 4080 195 4861 164 4087 185 3520 499 4456 2549<br />
77.56% 5.27% 78.03% 4.11% 71.56% 3.24% 71.71% 3.63% 68.55% 7.41% 50.93<br />
%<br />
4649 4033 5229 4747 6794 5070 5700 5092 5134 6743 8748 10358<br />
46.5 46.5 46.5 46.5 48.5 48.5<br />
As shown in the previous tables, we can say that the share of energy value exported in 2004<br />
& 2005 is decreasing due to the reduction of crude oil production from 600000 b/day, down<br />
to 425000 b/day.<br />
24.61<br />
%<br />
519
520<br />
ENERGY AND SUSTAINABLE DEVELOPMENT IN THE MEDITERRANEAN<br />
The amount of some oil products imports such as (diesel oil & LPG) is increasing gradually<br />
due to insufficient of refineries capacities in Syria, (only two refineries exists in Syria,<br />
The value of such imports becomes a heavy burden on Syrian economy and it shares about<br />
25% of total imports value in 2005 while it didn’t exceed 5% before 2000.<br />
Table 3 Employment in the energy sector (absolute value, percentage of the total)<br />
Years 1990 1991 1992 1993 1994 1995 1996 1997 1998 1999<br />
Ministry of petroleum<br />
(workers)<br />
2843<br />
0<br />
2911<br />
7<br />
3005<br />
0<br />
3027<br />
5<br />
3117<br />
2<br />
3171<br />
2<br />
3290<br />
2<br />
2811<br />
3<br />
3662<br />
3<br />
36645<br />
% of total 4.2% 4.2% 4.2% 4.2% 4.2% 4.2% 4.2% 3.5% 4.4% 4.2%<br />
Ministry of electricity<br />
(workers)<br />
1990<br />
1<br />
2017<br />
8<br />
2138<br />
8<br />
2169<br />
1<br />
2398<br />
5<br />
2483<br />
7<br />
2587<br />
8<br />
2691<br />
4<br />
2867<br />
6<br />
29564<br />
% of total 2.9% 2.9% 3.0% 3.0% 3.3% 3.3% 3.3% 3.3% 3.4% 3.4%<br />
Total workers number<br />
of energy sector in<br />
Syria<br />
Energy sector share of<br />
total man power in<br />
Syria<br />
Total man power in<br />
Syria*<br />
4833<br />
1<br />
4929<br />
5<br />
5143<br />
8<br />
5196<br />
6<br />
5515<br />
7<br />
5654<br />
9<br />
5878<br />
0<br />
5502<br />
7<br />
6529<br />
9<br />
66209<br />
7.1% 7.0% 7.2% 7.1% 7.5% 7.4% 7.5% 6.8% 7.8% 7.7%<br />
68139<br />
3<br />
70051<br />
7<br />
71738<br />
7<br />
72894<br />
4<br />
73679<br />
2<br />
76077<br />
3<br />
78838<br />
8<br />
80442<br />
2<br />
83398<br />
1<br />
Years 2000 2003 2004 2005 2006<br />
Ministry of petroleum (workers) 37528 38070 41635 43386 37528<br />
% of total 4.3% 3.9% 4.2% 4.2% 4.3%<br />
Ministry of electricity (workers) 30022 35375 36713 40305 30022<br />
% of total 3.5% 3.6% 3.7% 3.9% 3.5%<br />
Total workers number of energy sector in<br />
Syria<br />
Energy sector share of total man power in<br />
Syria<br />
67550 73445 78348 83691 67550<br />
7.8% 7.5% 7.9% 8.1% 7.8%<br />
Total man power in Syria* 867394 983476 986467 1031688 867394<br />
* Note: Total manpower in Syria only include public sector.<br />
863778<br />
As shown from the previous, the share of total workers number of energy sector in Syria is<br />
almost around 8% of total Syrian workers all over the period 1990 – 2005. Which mean that<br />
energy sector in Syria affords wide job opportunities for Syrian citizens.<br />
Table 4Relative importance of the energy sector within the State budget<br />
Years 1990 1992 1993 1994 1995 1996 1997 1998 1999<br />
Mining &<br />
quarrying<br />
2525 2684 3197<br />
3160.1<br />
86<br />
5099 5856 8471 8965 8635<br />
% of total 4.1% 2.9% 2.6% 2.2% 3.1% 3.1% 4.0% 3.8% 3.4%<br />
Electricity, gas<br />
& water<br />
3166<br />
4934.7<br />
18<br />
12671 15969 17814 24056 27004 25168 23539<br />
% of total 5.1% 5.3% 10.3% 11.1% 11.0% 12.8% 12.8% 10.6% 9.2%<br />
Total energy<br />
sector budget<br />
Energy sector<br />
share of the<br />
Syrian budget<br />
Syrian<br />
consolidated<br />
budget<br />
5692 7618 15868 19129 22913 29912 35475 34133 32174<br />
9.2% 8.2% 12.9% 13.3% 14.1% 15.9% 16.8% 14.4% 12.6%<br />
61875 93042 123018 144162 162040 188050 211125 237300<br />
25530<br />
0<br />
US$ exchange 12.18 12.18 12.18 31.87 34.06 34.29 43.01 45.51 46.50
ate (SP)<br />
SYRIA - National study<br />
Unit: Million SP (note: see below US$ exchange rate (SP))<br />
Years 2000 2001 2002 2003 2004<br />
Mining & quarrying 10277 11449 14606 16490 16416<br />
% of total 3.7% 3.6% 4.1% 3.9% 3.7%<br />
Electricity, gas & water 25685 30667 32421 32645 35395.46<br />
% of total 9.3% 9.5% 9.1% 7.8% 7.9%<br />
Energy sector share of the budget 35961 42116 47027 49134 51812<br />
Syrian consolidated budget 275400 322000 356389 420000 449500<br />
US$ exchange rate (SP) 46.50 46.50 46.50 46.50 48.50<br />
Unit: Million SP (note: see below US$ exchange rate (SP))<br />
As shown in the previous table, the share of investments in energy sector within the State<br />
budget is around 9%, the rate was higher about 16% during the period 1994-1999 due to<br />
significant investments which had invested in electrical sector to built new power plants and<br />
transmission & distribution lines.<br />
Table 5 Investment in the energy sector<br />
Years 1992 1993 1994 1995 1996 1997 1998 1999<br />
Mining & quarrying<br />
& gas<br />
4965 4567 5625 7060 8778 14479 17213 11664<br />
% of total 13.7% 7.4% 8.3% 9.5% 9.6% 13.3% 14.4% 9.6%<br />
Electricity 1296 3459 20598 16543 18493 18697 15207 11209<br />
% of total 3.6% 5.6% 30.3% 22.3% 20.2 17.2% 12.7% 9.2%<br />
Energy sector<br />
share of<br />
investments<br />
Total investment in<br />
Syria<br />
US$ exchange rate<br />
(SP)<br />
17.3% 13% 38.6% 31.8% 29.8% 30.5% 27.1% 18.8%<br />
36250 61750 67964 74099 91473 108700 119600 121800<br />
12.18 12.18 31.87 34.06 34.29 43.01 45.51 46.50<br />
Unit: Million SP (note: see below US$ exchange rate (SP))<br />
Table 6 Infrastructures: number of refineries, power stations, length of the electricity network…<br />
Years 2000 2001 2002 2003 2004 2005<br />
Mining & quarrying &<br />
gas<br />
12012 9133 13292 10950 15153 14407<br />
% of total 9.1% 5.7% 7.2% 5.2% 6.6% 5.8%<br />
Electricity 14294 12251 15306 18261 26673 23972<br />
% of total 10.8% 7.6% 8.3% 8.7% 11.6% 9.6<br />
Energy sector share of<br />
investments<br />
Total investment in<br />
Syria<br />
US$ exchange rate<br />
(SP)<br />
19.9% 13.3% 15.5% 13.9% - -<br />
132000 161000 184000 211000 230000 250000<br />
46.50 46.50 46.50 46.50 48.50 48.50<br />
521
522<br />
MINISTRY OF<br />
IRRIGATION<br />
Public Establishment of<br />
Euphrates Dam:<br />
* Thawra hydro-electric<br />
power plant<br />
* Baeth hydro-electric<br />
power plant<br />
* Tishreen hydro-electric<br />
power plant<br />
1) Electricity<br />
ENERGY AND SUSTAINABLE DEVELOPMENT IN THE MEDITERRANEAN<br />
Table 7 Organization structure of the Syrian energy sector<br />
National Energy<br />
Research Center<br />
OFFICE OF PRIME MINISTER<br />
MINISTRY OF ELECTRICITY<br />
Public Establishment for Distribution &<br />
Exploitation of Electrical Energy<br />
(PEDEEE)<br />
-The Public Companies of :<br />
- Damascus Governorate<br />
- Rural Damascus Governorate<br />
- Aleppo Governorate<br />
- Hama Governorate<br />
- Homs Governorate<br />
- Tartous Governorate<br />
- Lattakia Governorate<br />
- Idleb Governorate<br />
- Raqa Governorate<br />
- Der-zor Governorate<br />
- Hassakeh Governorate<br />
- Sweda Governorate<br />
- Dera`a Governorate<br />
-Quneitra governorate<br />
Public Establishment for Electricity<br />
Generation & Transmission<br />
(PEEGT)<br />
-The General Companies for:<br />
- Banias generation<br />
- Mehardeh generation<br />
- Tishreen generation<br />
- Qatineh generation<br />
- Jandar generation<br />
- Nasrieh generation<br />
- Zayzzon generation<br />
- Swedieh power plant<br />
- Tayem power plant<br />
- Al-Zara power plant<br />
- Aleppo power plant<br />
- Power Transmission<br />
Directorate<br />
MINISTRY OF PETROLEUM<br />
& MINING RESOURCES<br />
Public<br />
establishment for<br />
Geology and<br />
Mining resources<br />
Mining and<br />
Phosphat<br />
company<br />
- Syrian Petroleum Company<br />
( SPC )<br />
- Syrian Gas Company (SGC)<br />
- Syrian Oil Transport Comapny<br />
- Banias Refinery Company<br />
- Homs Refinery Company<br />
- Syrian Oil Products<br />
Distribution Company<br />
- Gas Distribution Comapny<br />
Two main operating entities operate under the Ministry of Electricity: PEEGT (Public<br />
establishment for electricity generation and transmission) and PEDEEE (Public<br />
establishment for distribution and exploitation of electrical energy). The two entities have the<br />
autonomy on operational decisions. Regulation is carried out through the Ministry as the<br />
regulatory body in cooperation with the two entities. Within PEEGT and PEDEEE there are<br />
individual generating and distribution companies. These operating companies could in<br />
principle form the basis of industry, but transmission would need to be placed in a separate<br />
company from generation. There are still extensive subsidies to electricity prices for all<br />
classes of consumers, although recently the level of subsidy was much reduced.
SYRIA - National study<br />
Table 8 Nominal & Actual capacity of power plants in Syrian power system by turbine type & subsidiary<br />
at the end of 2006<br />
Total Under Construction (Power plants up gradations) 1100 MW<br />
Combined Cycle 800 MW<br />
Converting GT to Combined Cycle 300MW<br />
2) Renewable energy & rational use of energy<br />
National Energy Research Center in Syria was created (mid of 2003) in order to supervise<br />
the energy efficiency improvements studies & facilitate the renewable energies usage in<br />
Syria.<br />
3) Natural gas<br />
There has been some loosening of the vertical integration, but the sector remains firmly in<br />
state hands. The Syrian Petroleum Company (SPC) owns the natural gas reserves on behalf<br />
of the Ministry of Petroleum and Mineral Resources. Until recently it was also the owner and<br />
operator of all pipelines.<br />
In February 2003 the Syrian Gas Company was created by Presidential Decree under the<br />
Ministry, and charged to plan for the exploitation and marketing of gas and to contract gas<br />
from domestic and foreign sources to meet the national needs. A second company, the<br />
Syrian Gas Distribution Company, was established in April 2003 with the duty to develop,<br />
operate and maintain the networks for distributing gas to residential consumers. It is intended<br />
to supply initially the cities of Damascus, Homs, Hama, Lattakya and Aleppo. These steps<br />
are welcome, but much more remains to be done before such a market would be consistent<br />
with competitive wholesale supply.<br />
4) Upstream hydrocarbons<br />
The regime of regulation for upstream hydrocarbons lacks many of the features desirable in<br />
a liberal system. The Ministry of Petroleum and Mineral Resources licenses all acreage to<br />
523
524<br />
ENERGY AND SUSTAINABLE DEVELOPMENT IN THE MEDITERRANEAN<br />
the Syrian Petroleum Company (SPC), which then sub-contracts by negotiation to<br />
international oil companies through a PSC for the exploration and production activities. The<br />
SPC forms a joint operating company with the IOC's for the execution of the PSC and<br />
manages the relationship with the contractors. The Ministry of Petroleum and Mineral<br />
Resources, or an independent body, should be assigned these licensing and regulatory<br />
functions. The fiscal regime for hydrocarbons also has some undesirable features. It is based<br />
upon a PSC with a negotiable royalty and features other non-transparent negotiable terms<br />
for profit sharing and non cost-recoverable bonuses. A review of the whole fiscal structure<br />
including the role and rights of the foreign investor and the distribution of income between the<br />
parties is required to determine the changes required to encourage investment.<br />
5) Refineries & oil transportation<br />
Both existing refineries are state owned and the Syria Company controls pipelines for Oil<br />
Transport. Distribution is the responsibility of the Syrian Company for the Storage and<br />
Distribution of Petroleum Products. Provision needs to be made for the entry of competing<br />
firms and access to strategic assets. Petroleum products are lower than in the EU and the<br />
refineries in their present configuration are not capable of meeting EU specifications.<br />
Petroleum product prices are heavily subsidized and controlled by government and there are<br />
no published ex-refinery prices. The pricing system needs to be made more transparent and<br />
needs to allow profitable operation by private companies. The refineries produce relatively<br />
low yields of light products.
Lable<br />
Installed<br />
Total installed capacity<br />
available<br />
Installed<br />
Steam tubine<br />
available<br />
Installed<br />
Gas turbine<br />
available<br />
Installed<br />
Hydro turbine<br />
available<br />
Installed<br />
Combined cycle<br />
available<br />
Installed<br />
Diesel oil<br />
available<br />
Substations 400/230 kV<br />
Substations 230/66/20 kV<br />
Substations 66/20 kV<br />
Substations 20/0.4 kV<br />
Length of transmisson lines 400 kV<br />
Length of transmisson lines 230 kV<br />
Length of transmisson lines 66 kV<br />
Length of transmisson lines 20 kV<br />
Length of transmisson lines 0.4 kV<br />
Number of consumers<br />
Number of electrified villages<br />
Percentage of pepole with access to grid %<br />
Number of employees at electricity sector No.<br />
Total electricity gross generation by Fuel Type:<br />
Hydro<br />
Gas<br />
Fuel oil<br />
Diesel<br />
Wind turbine<br />
Total electricity gross generation by sources:<br />
Ministry of electricity<br />
Ministry of Petroleum<br />
Ministry of irrigation<br />
Annual peak demand<br />
Date of annual peak<br />
Annual load factor<br />
Unit<br />
No. / MVA<br />
No. / MVA<br />
No. / MVA<br />
No.<br />
km<br />
km<br />
km<br />
km<br />
km<br />
Consumers<br />
No.<br />
Gwh<br />
Gwh<br />
Gwh<br />
Gwh<br />
Gwh<br />
Gwh<br />
Gwh<br />
Gwh<br />
MW<br />
%<br />
MW<br />
MW<br />
MW<br />
MW<br />
MW<br />
MW<br />
SYRIA - National study<br />
Table 9 Main key figures of Syrian Power System<br />
1992<br />
3198<br />
2886<br />
1500<br />
1291<br />
0<br />
219<br />
820<br />
477<br />
0<br />
0<br />
340<br />
126<br />
0/0<br />
29/3580<br />
122/3911<br />
23861<br />
167<br />
3602<br />
4413<br />
37715<br />
54365<br />
2314000<br />
م.غ<br />
م.غ<br />
0.94<br />
21216<br />
م.غ<br />
12392.3<br />
1512<br />
2051<br />
8177<br />
585<br />
0<br />
67<br />
10186<br />
699<br />
1440<br />
226700%<br />
1993<br />
3398<br />
3024<br />
1750<br />
1225<br />
0<br />
240<br />
898<br />
453<br />
0<br />
0<br />
340<br />
116<br />
0/0<br />
29/3580<br />
126/4061<br />
24638<br />
167<br />
3654<br />
4603<br />
38335<br />
55411<br />
2391000<br />
م.غ<br />
م.غ<br />
0.94<br />
21691<br />
م.غ<br />
12510.3<br />
1538<br />
2123<br />
8301<br />
503<br />
0<br />
45<br />
10226<br />
755<br />
1484<br />
222500%<br />
1994<br />
3998<br />
3624<br />
2031<br />
1473<br />
570<br />
232<br />
898<br />
475<br />
200<br />
200<br />
340<br />
124<br />
2/1000<br />
30/3980<br />
132/4286<br />
25466<br />
167<br />
3776<br />
4795<br />
39128<br />
56528<br />
2523000<br />
7765<br />
م.غ<br />
0.95<br />
23874<br />
م.غ<br />
14700.3<br />
2459<br />
2272<br />
9760<br />
209<br />
0<br />
0<br />
11570<br />
709<br />
2421<br />
247400%<br />
1995<br />
4698<br />
4234<br />
1976<br />
1586<br />
860<br />
604<br />
898<br />
718<br />
600<br />
600<br />
364<br />
10<br />
3/1500<br />
30/3980<br />
138/4436<br />
26313<br />
170<br />
3781<br />
4883<br />
40294<br />
58097<br />
2523379<br />
7988<br />
411600%<br />
0.96<br />
24748<br />
1946<br />
16631<br />
2800<br />
7356<br />
6455<br />
20<br />
0<br />
0<br />
12789<br />
1076<br />
2766<br />
284700%<br />
1996<br />
4998<br />
4534<br />
1976<br />
1715<br />
1160<br />
740<br />
898<br />
500<br />
600<br />
600<br />
364<br />
55<br />
4/1800<br />
34/4290<br />
142/4586<br />
27641<br />
322<br />
3885<br />
5077<br />
41800<br />
58891<br />
2655915<br />
8227<br />
387700%<br />
0.96<br />
25838<br />
2008<br />
18342<br />
3549<br />
9432<br />
5352<br />
9<br />
0<br />
0<br />
13747<br />
1064<br />
3531<br />
294400%<br />
1997<br />
6028<br />
5564<br />
2976<br />
2685<br />
1160<br />
1140<br />
898<br />
752<br />
600<br />
600<br />
394<br />
90<br />
4/1800<br />
36/4920<br />
151/5036<br />
29060<br />
322<br />
4045<br />
5154<br />
34060<br />
61714<br />
2793452<br />
8443<br />
366100%<br />
0.96<br />
26870<br />
2153<br />
19513<br />
3535<br />
10437<br />
5535<br />
6<br />
0<br />
0<br />
14791<br />
1205<br />
3517<br />
327100%<br />
1998<br />
6028<br />
5534<br />
2976<br />
2660<br />
1160<br />
1140<br />
898<br />
752<br />
600<br />
600<br />
394<br />
90<br />
4/1800<br />
38/5510<br />
158/5998<br />
29989<br />
322<br />
4176<br />
5348<br />
44892<br />
63953<br />
2944641<br />
8736<br />
336900%<br />
0.96<br />
28666<br />
2318<br />
21161<br />
3481<br />
11023<br />
6652<br />
5<br />
0<br />
0<br />
16421<br />
1279<br />
3461<br />
358000%<br />
1999<br />
6133<br />
5569<br />
2976<br />
2635<br />
1160<br />
1140<br />
1213<br />
857<br />
600<br />
600<br />
394<br />
90<br />
4/1800<br />
41/5940<br />
165/6322<br />
32291<br />
478<br />
4333<br />
5466<br />
46292<br />
68391<br />
3080877<br />
10169<br />
306000%<br />
0.96<br />
29705<br />
2372<br />
22820<br />
2103<br />
10718<br />
9988<br />
11<br />
0<br />
0<br />
19517<br />
1203<br />
2100<br />
389100%<br />
525
526<br />
Total installed capacity<br />
Steam tubine<br />
Gas turbine<br />
Hydro turbine<br />
Installed<br />
available<br />
Installed<br />
available<br />
Installed<br />
available<br />
Installed<br />
available<br />
ENERGY AND SUSTAINABLE DEVELOPMENT IN THE MEDITERRANEAN<br />
Unit<br />
Installed<br />
Combined cycle MW<br />
available<br />
Diesel oil<br />
Substations 400/230 kV<br />
Substations 230/66/20 kV<br />
Substations 66/20 kV<br />
Substations 20/0.4 kV<br />
Length of transmisson lines 400 kV<br />
Length of transmisson lines 230 kV<br />
Length of transmisson lines 66 kV<br />
Length of transmisson lines 20 kV<br />
Length of transmisson lines 0.4 kV<br />
Number of consumers<br />
Number of electrified villages<br />
Installed<br />
available<br />
Percentage of pepole with access to grid %<br />
Number of employees at electricity sector No.<br />
Total electricity gross generation by Fuel Type:<br />
Hydro<br />
Gas<br />
Fuel oil<br />
Diesel<br />
Wind turbine<br />
Total electricity gross generation by sources:<br />
Ministry of electricity<br />
Ministry of Petroleum<br />
Ministry of irrigation<br />
Annual peak demand<br />
Date of annual peak<br />
Annual load factor<br />
Lable<br />
No. / MVA<br />
No. / MVA<br />
No. / MVA<br />
No.<br />
km<br />
km<br />
km<br />
km<br />
km<br />
Consumers<br />
No.<br />
Gwh<br />
Gwh<br />
Gwh<br />
Gwh<br />
Gwh<br />
Gwh<br />
Gwh<br />
Gwh<br />
MW<br />
%<br />
MW<br />
MW<br />
MW<br />
MW<br />
MW<br />
2000<br />
6699<br />
6145<br />
3636<br />
3050<br />
1160<br />
1140<br />
1213<br />
962<br />
600<br />
600<br />
394<br />
90<br />
6/2700<br />
43/6430<br />
169/6482<br />
33946<br />
678<br />
4421<br />
5496<br />
48089<br />
70989<br />
3198000<br />
10434<br />
97%<br />
31791<br />
25227<br />
2503<br />
11224<br />
11489<br />
7.8<br />
3.09<br />
25227<br />
21493<br />
1233<br />
2501<br />
4128<br />
23 Dec.<br />
70%<br />
2001<br />
6804<br />
6250<br />
3636<br />
3355<br />
1160<br />
1140<br />
1318<br />
1170<br />
600<br />
600<br />
394<br />
90<br />
6/2700<br />
44/6880<br />
170/6662<br />
35384<br />
678<br />
4518<br />
5599<br />
50821<br />
71542<br />
3327000<br />
10774<br />
98%<br />
32667<br />
26715<br />
2119<br />
11915<br />
12677<br />
1.9<br />
1.71<br />
26715<br />
23428<br />
1171<br />
2116<br />
4565<br />
24 Dec.<br />
67%<br />
2002<br />
7014<br />
6450<br />
3701<br />
3355<br />
1160<br />
1140<br />
1528<br />
1380<br />
600<br />
600<br />
394<br />
90<br />
6/3000<br />
47/7935<br />
173/7136<br />
38343<br />
738<br />
4756<br />
5881<br />
52725<br />
74968<br />
3494000<br />
11042<br />
98%<br />
33822<br />
28014<br />
2501<br />
15015<br />
10396<br />
102<br />
0.16<br />
28014<br />
24450<br />
1067<br />
2497<br />
4791<br />
16 Dec.<br />
67%<br />
2003<br />
7014<br />
6450<br />
3701<br />
3355<br />
1250<br />
1140<br />
1528<br />
1380<br />
600<br />
600<br />
394<br />
90<br />
7/3600<br />
49/8765<br />
203/8616<br />
40808<br />
738<br />
4985<br />
6047<br />
55046<br />
79263<br />
3680000<br />
11901<br />
99%<br />
35390<br />
29533<br />
2804<br />
15579<br />
11148<br />
1.4<br />
0.29<br />
29533<br />
25548<br />
1224<br />
2761<br />
5081<br />
24 Dec.<br />
66%<br />
2004<br />
7014<br />
6450<br />
3701<br />
3355<br />
1250<br />
1140<br />
1528<br />
1380<br />
600<br />
600<br />
394<br />
90<br />
7/3600<br />
49/9030<br />
218/9156<br />
43597<br />
738<br />
5000<br />
6502<br />
57547<br />
82243<br />
3902000<br />
12326<br />
99%<br />
36755<br />
32077<br />
4247<br />
14062<br />
13766<br />
1.8<br />
0.20<br />
32077<br />
26770<br />
1083<br />
4224<br />
5770<br />
20 Dec.<br />
63%<br />
2005<br />
7057<br />
6008<br />
3547<br />
2995<br />
1342<br />
1172<br />
1528<br />
1201<br />
640<br />
640<br />
394<br />
0<br />
8/3600<br />
53/10510<br />
229/9606<br />
45109<br />
760<br />
5046<br />
6773<br />
59963<br />
85910<br />
4133000<br />
12871<br />
99%<br />
37827<br />
34935<br />
3445<br />
13642<br />
17846<br />
1.3<br />
0.3<br />
34935<br />
30455<br />
1035<br />
3445<br />
6008<br />
27 Dec.<br />
66%
SYRIA - National study<br />
National energy resources and potential saving<br />
Fossil energy resources<br />
Table 10 Main indicators of oil and gas sector in 2005<br />
Indicator Oil Unit Gas* Unit<br />
Geological assured reserve Milliard barrels Milliard m 3<br />
Producible reserve Milliard barrels Milliard m 3<br />
Cumulative production Milliard barrels Milliard m 3<br />
Residual and producible reserve Milliard barrels Milliard m 3<br />
Domestic production level Thousand barrel /day Million m 3 /day<br />
Domestic internal consumption level Thousand barrel /day Million m 3 /day<br />
* the current consumption of gas concludes the gas re-injected into oil wells to increase their efficiency<br />
Potentials of renewable energies:<br />
The hydro energy is a significant factor in the electricity generation system. There are three<br />
large hydroelectric power stations in operation on the Euphrates River. In 2003 the installed<br />
capacity of hydro plants was 1528 MW. The installed capacity of hydro plants is going to<br />
increase by 0,88 GW in the decade 2010-20.<br />
Ministry of electricity in cooperation with UN DESA in the year 2002 has lunched a master<br />
plan for development of the usage of RES.<br />
RES Master <strong>Plan</strong> presented, delineates sub-plans to be carried out for giving a major thrust<br />
to renewable energy development in Syria. Recommended program initiatives are outlined<br />
including specific plans to be taken up for mainstreaming renewable energy in the national<br />
energy balance. Research, Development and Demonstration projects for technology<br />
development, Pilot projects for technology demonstration as well as investment-worthy<br />
projects covering different forms of renewable energy on the basis of existing data have also<br />
been identified based on national level consultations and the extensive analytical work<br />
The National Renewable Energy Master <strong>Plan</strong> (REMP) consists of a set of actionable<br />
recommendations and proposals for renewable energy systems development along with the<br />
accompanying measures to facilitate this energy development. The master plan proposals<br />
have been formulated assuming that,<br />
The implementation period of the master plan will extend over a period of 10 years, from<br />
2002 to 2011;<br />
The development of energy systems contributes to meeting the primary energy demand<br />
in the country. By progressively increasing the contribution of renewable energy in the<br />
total energy mix trough planned efforts, the country would be able to reduce the burden of<br />
dependence on hydrocarbon sources such as gas based electricity, gasoline generators,<br />
diesel heaters and butane lamps;<br />
The accompanying measures such as the establishment of institutions, conducting<br />
studies and surveys and training and capacity building efforts would be put in place in<br />
order to facilitate implementation of the proposed plan.<br />
Government commitment to the master plan will result in adequate resource allocation<br />
and establishment of Institutional Framework.<br />
In 2011 the final year of the master plan the contribution by renewable energy<br />
technologies is estimated at 1012 kTOE, which will represent 4.31% of the primary<br />
energy demand.<br />
527
528<br />
Bio<br />
25.84%<br />
ENERGY AND SUSTAINABLE DEVELOPMENT IN THE MEDITERRANEAN<br />
Figure 1 Share of different renewable energy technologies<br />
Wind<br />
50.23%<br />
Hydro<br />
3.41% Hybrid<br />
3.62%<br />
PV<br />
0.30%<br />
Solar Thermal<br />
16.61%<br />
Note: the Hydro share indicated didn’t include the big hydro electrical power plants.<br />
Institutional specificities and energy policies<br />
We can summarize the main points in energy policies as follows:<br />
Giving long-term loans to purchase efficient appliances.<br />
Giving non-interest loans to purchase efficient appliances.<br />
Reducing taxes and the charge dues.<br />
Repaying rate of costs.<br />
Sealing energy efficient appliances by soft installment plan.<br />
Securing suitable financing & funds, for private individual engineering offices (ESCOs<br />
core) to purchase energy audits equipments (power analyzers, flue gas analyzers, noncontact<br />
stroboscopic tachometer, light meter…).<br />
1.2 Energy S u pply, Dema n d and Produc ti o n: evo luti on and<br />
s tr uc tu re<br />
Electricity Access<br />
ENE_C10: Share of the population with no access to electrification<br />
The share of the population with access to electrification for the whole country equals 99,7%<br />
of the total population; the population with no access to electrification equals 0,3%, all of<br />
them are small villages and individual farms.<br />
The main problem facing the electricity sector is the average population annual growth rate<br />
which equals 2.45%, which mean an annual increment of electricity demand, besides the<br />
electricity low prices due to the government subsidies.<br />
Evolution and structure of the energy demand and production<br />
Security of Energy Supply<br />
Syrian energy policy takes into consideration the following matters:<br />
To expand the gas usage.<br />
To sustain the oil production.<br />
To develop the country’s power capacity.<br />
To promote the energy efficiency and the use of renewable energy resources.
SYRIA - National study<br />
Table 11 Energy Balance in Syria (million TOE)<br />
Years 1990 1991 1992 1993<br />
Oil products 7.73 8.20 9.24 9.35<br />
Natural gas 0.77 0.86 1.12 1.27<br />
Hydro-electricity 0.33 0.33 0.38 0.39<br />
Total Energy Demand 8.83 9.39 10.74 11.01<br />
Annual growth rate % 6.35% 14.37% 2.53%<br />
Average annual growth rate<br />
%<br />
7.64%<br />
Years 1994 1995 1996 1997 1998 1999<br />
Oil products 8.76 8.88 8.64 9.25 9.68 10.16<br />
Natural gas 1.84 2.52 2.99 3.51 3.84 3.94<br />
Hydro-electricity 0.61 0.70 0.88 0.88 0.86 0.53<br />
Total Energy Demand 11.21 12.10 12.51 13.64 14.38 14.63<br />
Annual growth rate % 1.83% 7.91% 3.43% 8.98% 5.46% 1.70%<br />
Average annual growth rate<br />
%<br />
5.46%<br />
Years 2000 2001 2002 2003 2004 2005<br />
Oil products 11.13 11.30 11.73 12.31 14.73<br />
Natural gas 3.83 4.11 4.88 4.88 4.76<br />
Hydro-electricity 0.63 0.53 0.55 2 0.76<br />
Total Energy Demand 15.5 15.94 17.81 20.25<br />
Annual growth rate % 6.56 2.25 7.65 3.78 9.37 3.95<br />
Average annual growth rate<br />
5.36%<br />
%<br />
Average annual growth rate % all over the period 1990 – 2005 is about 5.69 %.<br />
Note: In addition to mentioned above energy resources consumption values, wood-fuel amount is estimated about<br />
600-700 kTOE annually.<br />
General Electricity Profile:<br />
Table 12 Primary energy future demand (Million toe)<br />
Years 2007 2010 2015 2020<br />
Oil products 18.70 20.66 25.36 32.43<br />
Natural gas 3.22 5.18 8.60 12.15<br />
Hydro-electricity 0.625 0.625 0.625 0.625<br />
Total Energy Demand 22.54 26.47 34.59 45.21<br />
The production of electricity reached TWh in 200 whiles the installed capacity almost 7<br />
GW. With Syrian electric power demand growing rapidly, adding electricity supply capacity is<br />
an important national priority.<br />
Table 13 Distribution of gross electricity generation in Syrian power system by fuel sources & turbine:<br />
Label<br />
1- Total gross generation<br />
1-1- Hydro electricity production<br />
(GWh)<br />
529
1-2- Thermal electricity production<br />
(GWh) of it:<br />
* Steam turbine (GWh)<br />
* Gas turbine (GWh)<br />
* Combined cycle (GWh)<br />
2- Electricity generation by fuel<br />
sources:<br />
2-1- Electricity generation by HFO<br />
530<br />
2-2- Electricity generation by NG<br />
Label<br />
ENERGY AND SUSTAINABLE DEVELOPMENT IN THE MEDITERRANEAN<br />
Table 14 Peak load demand & minimum load in Syrian power system:<br />
1- Peak load demand (MW)<br />
1-1- Peak load for internal demand (MW)<br />
1-2- Exported capacity (MW)<br />
2- Minimum load demand (MW)<br />
Table 15 Distribution of electricity generation by Facilities:<br />
2000 2001 2002 2003 2004 2005<br />
1- Ministry of electricity (% of total) 85.2% 87.7% 87.3% 86.5% 83.5% 87.2%<br />
1-1- Public establishment for electrical energy<br />
generation & transmission (PEEGT)<br />
1-2- Public establishment for distribution &<br />
exploitation of electrical energy (PEDEEE)<br />
21471 23421 24445 25506 26746 30454<br />
7 5 5 43 25 22<br />
2- Ministry of Irrigation (% of total) 9.9% 7.9% 8.9% 9.3% 13.2% 9.8%<br />
Public establishment for Euphrates dam<br />
(Hydroelectric).<br />
3- Ministry of petroleum & mineral resources<br />
2501 2116 2496 2761 4223 3425<br />
(% of total) 4.9% 4.4% 3.8% 4.1% 3.4% 3.0%<br />
3-1- Syrian petroleum company (SPC) 689 655 550 702 557 561<br />
3-2- General company of Homs refinery 371 356 326 354 339 292<br />
3-3- General company of Banias refinery 173 160 192 168 187 182<br />
Grand total 25212 26713 28014 29533 32077 34935<br />
Year Gross electricity<br />
demand<br />
Table 16 Electricity future demand & needed fuel for electricity sector by fuel type:<br />
HFO demand for power plants Natural gas minimum demand for power plants<br />
GWh ton/day ton/year toe/year thousands<br />
m 3 /day<br />
thousands<br />
m 3 /year<br />
toe/year<br />
2007 40753 13390 4887350 4691856 9788 3572778 3215500<br />
2010 51337 15033 5487045 5267563 15768 5755278 5179750<br />
2015 72000 15033 5487045 5267563 26189 9559011 8603110<br />
2020 96356 15033 5487045 5267563 36995 13503278 12152950
SYRIA - National study<br />
Electricity<br />
Table 17 Electricity<br />
Tariffs<br />
tariff<br />
Effective<br />
effective between<br />
1988 -<br />
1988-2005<br />
2005 (S.Piaster/KWh)<br />
(S.Piaster/kWh)<br />
Item Consumption Voltage Level From 1988 to 1990 From 1991 to 31/5/2002 From 1/6/2002<br />
1- 230 KV 34 75 170<br />
2- 66 KV 36 80 180<br />
3- 20 KV 42 90 200<br />
4- 20/0.4 KV<br />
4-1- Industrial 43 120 240<br />
4-2- Commercial 43 125 240<br />
4-3- Agriculture ( all crops ) 25 80 180<br />
5- 0.4 KV<br />
5-1- Residential<br />
1-50 kWh/month 19 25 25<br />
51-100 kWh/month 24 35 35<br />
101-200 kWh/month 35 50 50<br />
201-300 kWh/month 35 75 75<br />
301-400 kWh/month 55 150 250<br />
400 and above kWh/month 75 150 250<br />
5-2- Commercial 75 150 250<br />
5-3- Small Scale Artisan 75 140 250<br />
5-4- Street Lighting 15 75 150<br />
5-5- Government Offices<br />
1-50 kWh/month 19 75 200<br />
51-100 kWh/month 24 75 200<br />
101and above kWh/month 35 75 200<br />
5-6- Religious Buildings<br />
Note: 1 S.Pound = 100 S.Piaster = 0.02 US$<br />
Taxes collected for other Ministries<br />
Free of Charge<br />
* Note 1: / 10% / of 0.4 kV sales for Ministry of Local Administration & Environment.<br />
** Note 2: / 12.5% / of Total Electricity Sales for Ministry of Finance<br />
*** Note 3: / 50 SP / . Electric Meter Charge per cycle per Single Phase Meter.<br />
**** Note 4: / 150 SP / . Electric Meter Charge per cycle per Three Phase Meter.<br />
***** Cycle = two months. Peak starts from sunset for 4 hours<br />
Night starts from end of peak for 8 hours, the rest is day time<br />
Power Factor correction (Penalty & Bonus):<br />
(0.9-0.93) = (0.9/Costomer PF)-1 (penalty tariff)<br />
More than 0.93 = (Customer PF/0.93)-1 (bonus tariff)<br />
Table 18 Electricity Consumption & losses - Distribution by voltage level & consumption categories<br />
(GWh)<br />
Label 2000 2001 2002 2003 2004 2005<br />
Electricity gross generation 25217 26712 28014 29533 32077 34935<br />
Auxiliary consumption 1065 1163 1162 1233 1268 1437<br />
Special consumption in other public 754 790 827 816 860 872<br />
sector facilities<br />
Net generation 23398 24759 26025 27484 29949 32626<br />
Export 1418 1271 692 249 548 843<br />
Technical losses of 230 kV 665 793 845 966 921 944<br />
Sales of 230 kV customers 327 298 325 307 342 380<br />
Total electricity flow at 66 kV 20988 22397 24163 25962 28138 30460<br />
531
532<br />
ENERGY AND SUSTAINABLE DEVELOPMENT IN THE MEDITERRANEAN<br />
Label 2000 2001 2002 2003 2004 2005<br />
Motive power<br />
consumption<br />
Lighting consumption<br />
66 kV 1605 1802 1898 1900 1926 2073<br />
20 kV 1214 1271 1285 1417 1648 1743<br />
20/0.4 kV 2838 3092 3195 3575 3904 4293<br />
0.4 kV 313 306 349 314 329 341<br />
Total motive power 5970 6471 6727 7206 7807 8450<br />
consumption<br />
Residential 7244 7604 8139 8885 9940 10993<br />
Commercial 1289 1308 1460 1464 1617 1699<br />
Government directorates 227 234 297 379 362 404<br />
Street lighting 364 440 490 530 700 666<br />
Religious building 354 342 371 296 337 386<br />
MOE subsidiary<br />
92 104 106 98 138 98<br />
directorates<br />
Total lighting consumption 9570 10032 10863 11652 13094 14246<br />
Total consumption on 66 kV & down 15540 16503 17590 18858 20901 22696<br />
Total Losses on 66 kV & down 5448 5894 6573 7104 7237 7764<br />
Total losses in Syrian power system 6113 6687 7418 8070 8158 8708<br />
Total losses rate 26% 27% 29% 29% 27% 27%<br />
Table 19 Distribution of Primary Energy Demand in Syria By Fuel & Sector for year 2005:<br />
By Fuel 20247 kTOE By Sector 100%<br />
Oil Products 14732 = Industry 10%<br />
Natural Gas 4757 = Residential 16%<br />
Hydro-Electricity 758 = Electricity<br />
Generation<br />
Wood-Fuel 700 = Oil & Gas Facilities 8%<br />
Household<br />
49%<br />
35%<br />
Agriculture 5%<br />
Transport 20%<br />
Electrical energy demand for each Building sector & in 2005<br />
Construction &<br />
Commercial<br />
Figure 2 Electricity demand by sector in 2005:<br />
Governmental<br />
Buildings<br />
6%<br />
Agriculture<br />
6%<br />
Future aspects of electric sector in Syria concentrate on the following:<br />
Rehabilitation of old generating units.<br />
6%<br />
Commercial<br />
8%<br />
Industry<br />
31%
SYRIA - National study<br />
Convert existing single gas turbine to combined cycle. Expansion<br />
dependency on natural gas. Decrease total electrical losses in Syrian power<br />
system. Improve billing & electric meter reading system in distribution<br />
networks. Decrease specific consumption of HFO & NG down to 174<br />
goe/kWh in 2020, throw economic operation of existing PP. Improve technical<br />
qualification of working manpower in ministry of electricity. Improve power<br />
system’s load factor by applying DSM procedures. Construct pumping<br />
storage hydro-electric power plant on Euphrates river. Provide all existing<br />
power plants with EMS & MMS.<br />
Expansion dependency on renewable energies (solar, wind, biomass)<br />
Improve & enhance power systems interconnections with Arabic countries &<br />
Turkey.Impacts a nd r isks of t he observed and f o recast<br />
e vo l u tions<br />
Energy dependence and Energy bill, reduction in export capacities<br />
ENE_C01: External Energy Dependency<br />
1995 1996 1997 1998 1999 2000 2001 2002 2003 2004 2005<br />
Domestic<br />
supply (MTOE) 34.67 34.89 34.85 35.11 35.07 33.57 35.45 38.70 37.47 29.46 28.26<br />
Domestic<br />
demand<br />
(MTOE) 12.34 12.57 13.75 14.27 14.92 15.75 16.02 16.61 16.59 18.55 21.07<br />
Energy<br />
dependency<br />
rate % -181 -178 -154 -146 -135 -113 -121 -133 -126 -59 -34<br />
ENE_PO3: Greenhouse gas effect emission; CO2 emitted from energy production and use.<br />
Years 1990 1991 1992 1993 1994 1995 1996 1997<br />
CO2 emission by oil products<br />
(mton CO2 equivalent)<br />
CO2 emission by natural gas<br />
(mton CO2 equivalent)<br />
Total (mton CO2 equivalent)<br />
23.18 24.58<br />
27.7<br />
1<br />
28.07 26.27 26.63 25.90 27.74<br />
1.79 2.00 2.62 2.96 4.29 5.88 6.97 8.17<br />
24.97 26.59<br />
30.3<br />
3<br />
31.03 30.56 32.51 32.88 35.91<br />
1998 1999 2000 2001 2002 2003 2004 2005<br />
29.02 30.48<br />
33.3<br />
8<br />
33.90 35.20 33.28 39.25 45.61<br />
8.94 9.18 8.92 9.57 11.36 11.07 10.85 11.08<br />
37.97 39.66<br />
42.2<br />
9<br />
Review about the National Environmental Policy<br />
43.47 46.56 44.35 50.11 56.69<br />
The total CO2 emissions are 42.29 m ton (the energy sector are approximately 18.528 million<br />
tones) in year 2000. The application of RES is modest, mainly due to the low (subsidized)<br />
energy and electricity prices. Syria’s potential to utilize solar energy is very large. Despite,<br />
the high solar energy potential, solar heaters and photovoltaic systems are not extensively<br />
used. Wind is another source of high potential in Syria although it is not sufficiently exploited.<br />
CO2 equivalent emissions per capita are approximately 2.6 tones / capita.<br />
Hot spots of environmental impact / environmental problems are air-borne emissions caused by transportation<br />
intercity, by space and water heating using DO in residential sector, refineries, textile, chemical and cement<br />
factories. Emissions to water and soil, not mentioned.<br />
Environment in the ninth five years plan in Syria (Strategic goals)<br />
Realization sustainable development and natural resources & environmental balance<br />
conservation.<br />
533
534<br />
ENERGY AND SUSTAINABLE DEVELOPMENT IN THE MEDITERRANEAN<br />
Limit environmental decline, & define existing environmental problems.<br />
Incorporate environmental activities in development plans.<br />
Development of human beings capabilities & improve skills in environmental field.<br />
Develop & construct national environmental protectorate.<br />
Promote environmental awareness in the Syrian society.<br />
Environment policy & measures:<br />
Issue of environment protection law (2002).<br />
Establish permanent pollution monitoring stations in various regions in the country.<br />
Obtainment of developed laboratories for pollution measurements, and continuing<br />
equipping the Syrian environmental & scientific research center.<br />
Conduct environmental & scientific conferences & training workshops on environment<br />
protection aspects.<br />
Continuing creation of environmental departments in Syrian governorates.<br />
Construct central & sub branches environmental laboratories.<br />
Cooperation with local & international environmental agencies.<br />
Creation in the Syrian central bank account of “Fund for support & environment<br />
protection”.<br />
Direct & indirect instruments (some of punishments):<br />
Punished by penalty from 100.000 to 2.000.000 Sp (2000-40.000 $) any industrial,<br />
commercial, services facility to get rid of any (sold, liquid wastes, gas emissions) cased<br />
any damage for environment. And in case of repetition to be imprisoned for one month at<br />
least in addition to mentioned penalty.<br />
Punished by penalty from 10.000 to 1.000.000 Sp (200-20.000 $) any industrial,<br />
commercial, services facility to be breached the Syrian environment’s low And in case of<br />
repetition to be double and in case of third repetition imprisoned for two months to two<br />
years in addition to mentioned doubled penalty.<br />
Remove of the breach directly or closing the facility, and in case of delay in removing the<br />
breach it will pay (5000 – 10.000 SP) per each day.<br />
Obligate all the facilities that pollute the environment by effluence, to install suitable<br />
metering systems.<br />
Sulfur dioxide SO2:<br />
Margin of tolerance<br />
none<br />
150 μg/m 3 (43 % of limit value )<br />
none<br />
none<br />
Table 20 Overview about National Ambient Air Quality Standards<br />
Number of polluting<br />
events<br />
none<br />
24 times a year<br />
none<br />
3 times a year<br />
Limit value<br />
ppm<br />
0.188<br />
0.132<br />
0.047<br />
0.019<br />
μg/m 3<br />
To be measured in sequence through three hours 500 μg/m 3 is the threshold of SO2<br />
Nitrogen dioxide NO2:<br />
Margin of tolerance<br />
Number of polluting<br />
events<br />
Limit value<br />
ppm<br />
500<br />
350<br />
125<br />
50<br />
μg/m 3<br />
Averaging Period<br />
10 minutes<br />
1 hour<br />
24 hours<br />
1 year<br />
Averaging<br />
Period
100 μg/m 3 (50 % of limit value)<br />
20 μg/m 3 50 % of limit value )<br />
18 times a year<br />
none<br />
SYRIA - National study<br />
0.105<br />
0.021<br />
To be measured in sequence through three hours 400 μg/m 3 is the threshold of NO2<br />
Ozone O3:<br />
Limit value<br />
ppm<br />
0.08<br />
0.06<br />
μg/m 3<br />
160<br />
120<br />
Carbon monoxide CO:<br />
Limit value<br />
ppm<br />
51.5<br />
25.8<br />
8.6<br />
Lead Pb:<br />
Limit value<br />
μg/m 3<br />
1<br />
mg/m 3<br />
60<br />
30<br />
10<br />
Averaging Period<br />
Annual average<br />
Total Suspended Particulate TSP<br />
Limit value μg/m 3<br />
240<br />
150<br />
Averaging Period<br />
1 hour<br />
8 hours<br />
Averaging Period<br />
30 minutes<br />
1 hour<br />
8 hours<br />
Averaging period<br />
Average 24 hours<br />
Annual average<br />
PM-10 Micro Suspended Particulate<br />
Limit value<br />
μg/m 3<br />
100<br />
50<br />
Benzene, C6H6<br />
Limit value μg/m 3<br />
20<br />
Averaging period<br />
Average 24 hours<br />
Annual average<br />
Averaging period<br />
Annual average<br />
Table 21 Maximum permitted limits for air pollutants near effluence sources<br />
1<br />
2<br />
3<br />
4<br />
5<br />
6<br />
7<br />
8<br />
9<br />
Max limit<br />
250-500<br />
300-3000<br />
1000-3000<br />
50-150<br />
50-250<br />
2-20<br />
1-10<br />
1-10<br />
1-5<br />
Unit<br />
mg/m 3<br />
mg/m 3<br />
mg/m 3<br />
mg/m 3<br />
mg/m 3<br />
mg/m 3<br />
mg/m 3<br />
mg/m 3<br />
mg/m 3<br />
Polluter<br />
CO<br />
NOx<br />
SO2<br />
SO3<br />
TSP<br />
Pb<br />
Sb<br />
As<br />
Cd<br />
200<br />
40<br />
1 hour<br />
1 year<br />
535
536<br />
10<br />
11<br />
12<br />
13<br />
14<br />
15<br />
16<br />
17<br />
18<br />
19<br />
Max limit<br />
5-20<br />
0.5-5<br />
1-5<br />
5-20<br />
5-10<br />
5-20<br />
10-100<br />
1-20<br />
2-20<br />
50-250<br />
ENERGY AND SUSTAINABLE DEVELOPMENT IN THE MEDITERRANEAN<br />
Unit<br />
mg/m 3<br />
mg/m 3<br />
mg/m 3<br />
mg/m 3<br />
mg/m 3<br />
mg/m 3<br />
mg/m 3<br />
mg/m 3<br />
mg/m 3<br />
mg/m 3<br />
Polluter<br />
Cu<br />
Hg<br />
Ni<br />
Total value for heavy metals**<br />
H2S<br />
CL2<br />
HCL<br />
F<br />
CH2O<br />
20 10<br />
SiF4<br />
* The small number indicates the minimum limit of the emission and the big number indicates the maximum limit<br />
of the emission ; ** The heavy metals include: Pb ,Sb ,As, Cd ,Cu , Hg, Ni.<br />
The maximum limit of noise (dB)<br />
90<br />
80<br />
65<br />
70<br />
60<br />
The max limits<br />
night<br />
-<br />
-<br />
-<br />
-<br />
-<br />
afternoon<br />
-<br />
-<br />
-<br />
-<br />
-<br />
mg/m 3<br />
Table 22 The limitation of the noise in production areas<br />
The production activity<br />
C<br />
Places of 8 hours shift and the purpose is to reduce the noise bad effects<br />
Places where it is necessary to hear voice signals and oral instructions<br />
Operation control and measurements places<br />
Computer and typing rooms.<br />
Places where concentrating is required<br />
Table 23 The maximum limit of noise admissible<br />
day<br />
55-65<br />
-<br />
-<br />
-<br />
-<br />
Area<br />
The center of the city and the commercial, administration areas<br />
The residential areas with some workshops or next to a main street.<br />
Residential areas in the city<br />
Country side, Hospitals and gardens<br />
Industrial areas.<br />
ENE_C04: Number of energy infrastructures in coastal areas<br />
There are two energy infrastructure in the caostal area:<br />
1) Bnias power plant<br />
2) Banias refinery<br />
Statistical Survey for Non Electrified Communities in Three Syrian Governorates<br />
(Homs, Hamah, Al-hassakeh):<br />
During 2003-2004 Ministry of Electricity in cooperation with central bureau of statistics and<br />
UNDP office in Damascus. implemented a survey about energy consumption in the non<br />
electrified communities in three Governorates, Homs, Hama, Al-hassakeh as an essential<br />
approach in order to launch overall survey in all Syrian remote areas.<br />
Results analysis:<br />
Since it was discovered, Electricity has been considered a key factor for development in all<br />
fields of life, so the electric system has to be expanded in order to meet the demand.<br />
International researches show that it is not economically feasible to connect remote area to<br />
the main grid , especially in the case of scattered small villages.<br />
The development of renewable energy especially solar, wind, and biomass energy, gives the<br />
economic solution to electrify remote area.
SYRIA - National study<br />
In Syria renewable energy has been used in different fields, such as wind mill in the past Al-<br />
Qalamon region), and hydroelectric and biomass residents in present.<br />
No doubt that renewable energy which is formed basically of wind, solar and biomass<br />
energy, could be essentially contribute in the national energy balance; and the Master <strong>Plan</strong><br />
of renewable energy in Syria which has been prepared and published by Ministry of<br />
Electricity financed by UNDP, has enhanced our understanding of the current situation and<br />
future possibility for the renewable energy in S.A.R.<br />
As a continuation of the Master plan and for the purpose of rural area developing, a survey<br />
was executed in cooperation with Central Bureau of Statistics and financed by UNDP. The<br />
survey discover the energy use in remote non electrified area in three Governorates, Homs,<br />
Hama, & Al-Hassakeh as an essential approach in order to lunch overall survey in the whole<br />
country and hereunder a brief summary of survey’s result.<br />
General data about communities:<br />
The results show some unoccupied communities though it is mentioned in the<br />
administration division and in the schedules of electricity distribution company for non<br />
electrified communities, The number of the unoccupied communities is 14 while the total<br />
number of communities is 510 in the three Governorates.<br />
28% of studied communities are less than 1000 meters far from nearest electrified<br />
communities, so they are candidates for detailed study to connect them to the main grid,<br />
while 72% of the communities are more than 1000 meters far away, and this mean trying<br />
to find other way for energy than main grid.<br />
Usually these communities obtain drink water by two ways, even from nearby wells, as<br />
wells not far than 1 km counted 196, or by containers from faraway area. Total number of<br />
wells is 245, of which 64 of it owned by the state and the rest by residents of<br />
communities. with noting that deep of water in 83 wells reaches no more than 100<br />
meters, which gives a good possibility to use pumps operates by PV cells .<br />
Total number of families in the studied communities 5036 families. 210 families live<br />
seasonally in the communities. The population in the communities was 43 181<br />
inhabitants, Average size of family is 8.6 person per family.<br />
Total number of houses is 5759 including tents. 1781 houses are build by blocks and<br />
cement, the rest are build by stone and wood and mud. Occupied houses are 4752 and<br />
98.76% of which are heated.<br />
Data about energy resources and uses within communities:<br />
The results shows considerable quantities of consumed oil products for purpose of<br />
lighting, cooking, water and space heating; which indicates to inefficient use of these<br />
sources. Besides number of small and medium size batteries used annually reaches<br />
1031203, analyzing these data will help within feasibility studies for energy substitution<br />
studies. As well as people of communities used 4770 of chemical batteries (car batteries)<br />
to operate TVs.<br />
Total annual amount of consumed DO within the communities is 5719 thousand liters per<br />
year. Average amount for each family is 1135 liters per family per year, knowing that<br />
average amount for rural family according to previous survey is 771 liters per family per<br />
year. 60.87% of the total amount is used for space heating, 23.38% is used for lighting,<br />
0.45% is used for water heating and 15.3% is used to operate cars or tractors. Average<br />
price of DO is (7.5) S.P per liter.<br />
Total annual amount of consumed LPG 134030 Bottiles, which equal to 1608 ton, and the<br />
average is 26.6 Bottiles per family per year, - knowing that the average in the previous<br />
survey for electrified rural area was 17.9 Bottiles per family per year - 18.32% of total<br />
amount used for lighting, 81.62% is used for cooking and water heating, 0.06% is used<br />
for space heating Cost of cylinder is 175 S.P.<br />
537
538<br />
ENERGY AND SUSTAINABLE DEVELOPMENT IN THE MEDITERRANEAN<br />
Total amount of kerosene consumed annually within the communities is 601 thousand<br />
liters, the average is 119.6 liter per family per year - knowing that the average in the<br />
previous mentioned survey was 40 liter per family per year - 55.88% of total amount is<br />
used for lighting, 44.4% is used for cooking and water heating, 0.08% is used for space<br />
heating. The cost of kerosene is 21 S.P per liter.<br />
Total annual amount of animal residue is 2011 tons, 2.84% of the total amount is used for<br />
space heating, 97.16% is used for cooking and water heating. Knowing that a lot of<br />
animal residues don’t collected and left in the ground, there is a possibility to use this<br />
amount of residues to produce biogas as an alternative of LPG.<br />
Total annual amount of agricultural residues is 8641 tons, including 3544 tons of<br />
purchased wood which cost between 1000 and 3000 S.P. per ton, 8.74% of total amount<br />
is used for space heating and the rest for cooking and water heating. When asking<br />
people about the way of how they get red off the plant residue the answer was 50.98%<br />
answered they use it to feed animals, 18.96% answered they just leave it on the ground<br />
or burn it, so this indicate that there is a possibility to obtain biogas from those residue.<br />
Data about facilities exist within the communities:<br />
The results show that there is about 34 schools within the communities and 3 veterinary<br />
clinic located in Homs desert, besides 6 small commercial shops. The annual number of<br />
small and medium consumed batteries was 929 batteries, and the annual amount of<br />
consumed light oil was 44.6 thousand liters, 83.74% of it was used for space heating, and<br />
the rest for lighting. Total annual amount of consumed LPG was 221 Bottiles which equal to<br />
2.6 tons, 34.39% of it is used for lighting, 57,47% is used for cooking and water heating, the<br />
rest is used for space heating.<br />
While total annual amount of kerosene consumed was 380 liters, 73.68% of it was used for<br />
lighting, the rest for cooking and water heating, there was no notice for any use of biomass<br />
residue within the facilities.<br />
Conclusion:<br />
3) Total amount of fossil fuel (DO, kerosene and LPG) consumed is about 2200 tons, the<br />
average is 436 tons per family, and this costs every family about 5000 S.P according to<br />
the local prices and 150$ according to the international prices, in addition the total<br />
number of consumed small and medium batteries was more than one million batteries,<br />
this means that the average is 200 batteries for each family, as well as every family use<br />
at least one chemical batteries, and this increase the lighting cost about 2000 S.P. So it is<br />
very feasible to find alternative source of energy for those poor families who pay too<br />
much according to their ability to get low level of lighting.<br />
4) Total annual amount of fossil fuel (kerosene and LPG) used for cooking is about 1200<br />
tons, lead to average of 240 kg per family, with cost 3000 S.P per family per year,<br />
besides the cost of wood used for cooking. This means that encouraging the use of solar<br />
cooker will help to raise the standard of living for those families who substitute to such<br />
device.<br />
5) In order to achieve the goals of this study, we suggest to choose some of mentioned<br />
above studied communities according to certain criteria to prepare a feasibility study for<br />
using renewable energy.<br />
2. Rational Energy Use (RUE) - Renewable Energies (RE): (policies, tools,<br />
progress, resulting effects, case studies)<br />
2.1 RUE and RE Policies<br />
2.1.1 Rational energy use (RUE) policies<br />
Working in RUE started since 1998 through Supply Side and Energy Efficiency Conservation<br />
and <strong>Plan</strong>ning Project (SSEECP) financed by UNDP, GEF, OPEC Fund. The primary<br />
objective of the "Syrian Energy Conservation and <strong>Plan</strong>ning Project” was to improve demandside<br />
energy through the creation of a multi-purpose Syrian Energy Services Centre (SECS)
SYRIA - National study<br />
and a National Energy Efficiency Program (NEEP). The activities of the project focused on<br />
the greatest opportunities for improving electrical energy efficiency and reducing growth rate<br />
of electric power demand while slowing the growth of greenhouse gases emission from<br />
industrial and other use. The work included also the strengthening of institutional capacity of<br />
the Ministry of Electricity to implement and sustain long-term, sound energy measures that<br />
have a measurable, documented impact on the economic, environmental and social well<br />
being of the Syrian people. In a fast-changing economy, there are new measures through<br />
which these types of activities can be profitable and therefore lead to job creation while<br />
assuring improved efficiency and affordable energy resources to the people of Syria.<br />
The main activities of the SSEECP project were:<br />
Conduct preliminary (walk throw) energy audit studies for 200 industrial, commercial, &<br />
services facilities in Syria.<br />
Conduct 50 detailed energy audit studies from the above-mentioned facilities.<br />
Conduct 20 feasibility studies from the above-mentioned facilities, in order to find<br />
financing to implement recommendations & improvements of energy audits in 10<br />
industrial, commercial, & services facilities in Syria.<br />
A full demand side management assessment of energy/electricity use in Syria, designee<br />
DSM pilot project<br />
Launch & designee energy efficiency and standards program and their adoption initiated,<br />
for residential electric appliances (refrigerators, washing machines, air conditions).<br />
Launch & initiation of The National Energy Efficiency Program, designee and analyze<br />
energy policy initiatives.<br />
Launch a cross sectoral information dissemination and promotion program for energy<br />
efficiency (issue brochures, TV & newspapers advertisements, Hotline…)<br />
The SSEECP project launched in 1998 and continued till 2006.<br />
One of the main objectives of the SSEECP project was establishing the national energy<br />
research centre (NERC) which was created in 2003 to carry out the energy efficiency and<br />
renewable energy R&D in Syria.<br />
The accredit document which concern the strategies in all sectors is the five years plan which<br />
put by the Syrian State <strong>Plan</strong>ning Commission.<br />
The five years plan 2000-2005 mentioned the energy efficiency issues in a very simple,<br />
limited term, concentrated on encouraging adopting energy efficiency applications to<br />
decrease energy demand.<br />
The five years plan 2006-2010 which has been put in 2006 included in the long term view<br />
specific procedures for decreasing energy demand through adopting energy efficiency as the<br />
following:<br />
Improve energy efficiency in production side and reduce the grid losses.<br />
Increase the reliability in production and distribution systems.<br />
Implementing demand side management strategies through concentrating on the<br />
benchmarked indicators.<br />
Implementing integrated resource planning strategies targeted to enlarge the electrical<br />
system to achieve the sustainable development.<br />
Create new policies for energy pricing aiming to improve energy efficiency and demand<br />
management in residential, industrial, commercial sectors.<br />
Issuance encouragements procedures to adopt building thermal insulation.<br />
539
540<br />
ENERGY AND SUSTAINABLE DEVELOPMENT IN THE MEDITERRANEAN<br />
Regarding the strategies in the five years plan 2006-2010 mentioned above, (NERC)<br />
shouldered implementing them through preparing “Energy Conservation Law” which<br />
determined the regulating mechanism for RUE in the national level through:<br />
Legalizing all action and activities related to energy conservations issues.<br />
Exchanging the unsustainable patterns used in energy production and consumption.<br />
Executing energy efficiency procedures in all sectors.<br />
Increase the availability of the national existing fossil fuel resources and reservation.<br />
Greenhouse gases reduction.<br />
Activating the public participation in the national socio-economic support.<br />
Developing the national abilities and raise the general awareness about RUE for the<br />
sustainable development objectives and environment protection.<br />
As a result of the mentioned points, NERC steps forward in determining definite procedures<br />
regarding RUE as follows:<br />
In the residential sector:<br />
1) Working on improving energy efficiency for home appliances through execute Standards<br />
and Labels programme, starting with refrigeration systems since 2003, and expanding it<br />
to include cooling systems in 2007, and washing machines, lighting sets till the end of<br />
2010.<br />
2) Preparing the first version of “Building Thermal Insulation Code” in 2006 which aimed to<br />
improve thermal behaviour in buildings to reduce traditional energy used for cooling and<br />
heating systems, the code planned to be set as an obligatory document in 2007.<br />
3) Demand side projects:<br />
The first project years were dedicated mainly on integrated resource planning. IRP plan<br />
has been developed with the support of international consultant.<br />
DSM assessment was initiated only in 2001 and the study was completed in 2003. The<br />
electricity demand forecast study showed that residential sector and industry electricity<br />
consumption are with contributing most to the overall growth in the country electricity<br />
demand. Based on the data collected during the household survey as well as the<br />
information gathered during the demand forecast, some 18 end-use electricity saving<br />
measures have been identified. From these three pilot programs were chosen for further<br />
development of pre-feasibility studies - time of use metering, industrial motors and motor<br />
systems and building envelope improvement<br />
In the industrial sector:<br />
1) Energy audits – the SSEECP project team developed by NERC, and the governorate<br />
distribution companies' energy efficiency units with cooperation of the Ministry of Industry<br />
and University of Damascus have performed 250 walk through audits in different<br />
industrial sites, more than 100 detailed audits covering boilers, steam systems and<br />
electrical systems for 50 plants. Detailed design and feasibility studies have been<br />
developed with the support of Greek international consultants for 20 investment projects.<br />
2) NERC will execute the saving opportunities declared in the detailed audits performed (in<br />
2007 NERC started implementing energy efficiency project to improve power factor in<br />
many industrial establishments).<br />
In Electrical Generation Side:<br />
Rehabilitation of Banias Thermal Power Station – The Syrian government and SSEECP<br />
project performed a rehabilitation of Banias thermal power station, the rehabilitation conclude<br />
the following:<br />
Rehabilitation of units 1 and 2 of installed capacity of 170 MVA for each.<br />
Conversion these two units to work on natural gas instead of heavy fuel oil.
SYRIA - National study<br />
Installation a Condition Monitoring System (CMS) works in online term for the four units in<br />
the station, this system to be applied in all power plants.<br />
Using Maintenance Management System (MMS) to appropriate the targets of reliability<br />
selected, and to achieve fully functional MMS installed.<br />
541
In Electrical Distribution Side:<br />
542<br />
ENERGY AND SUSTAINABLE DEVELOPMENT IN THE MEDITERRANEAN<br />
The Public Establishment for Distribution and Exploitation of Electrical Energy (PEDEEE)<br />
adopted power factor correction project for distribution substations since 2004 and the<br />
installed capacity equals 1400 MVAR till now and the project still in progress.<br />
Regarding the institutional structure the “Energy Conservation Law” directed to create energy<br />
conservation unites in all governmental associations which will be NERC’s representative in<br />
their associations to collect data regarding energy consumption and determine the saving<br />
opportunities to be implemented in cooperation with NERC in all sectors.<br />
2.1.2 Renewable Energy (RE) policies<br />
The objective of the Syrian Renewable Energy strategies is to ensure an increasing<br />
contribution of RE applications to meet Syria's Primary Energy Demand. This is expected to<br />
result in a decreasing dependence on hydrocarbon energy sources and an environmentally<br />
sound and sustainable development.<br />
There have already been efforts by the Syrian Government and the industrial sector to utilise<br />
renewable energy sources in the past. These initiatives have not had any significant impact<br />
on the energy scenario partly because of a non-coordinated approach and lack of planning.<br />
The Government of Syria recognised that for renewable energy resources to play a greater<br />
role, a planned and co-ordinated approach is required. This recognition was reflected in the<br />
European Union -Syria Energy Policy Dialogue during 1998 1 - In the UNDP/UN-DESA project<br />
The need of Sustainable Energy in the Arab States and emerged as the key<br />
recommendation 2 . Thereafter joint efforts by the Syrian Government, UN-DESA and UNDP<br />
led to Syria Renewable Energy Master <strong>Plan</strong> 3 project. The project under UNDP funding was<br />
implemented by UN-DESA and co-ordinated by the Ministry of Electricity. The National<br />
Renewable Energy Master <strong>Plan</strong> for Syria performed in 2004.<br />
After that the National Energy Research Centre carried out renewable energy actions in<br />
Syria through many practical projects regarding solar, wind, and biomass energies.<br />
Strategies for RE has been illustrated (at national level) in the five year plan 2006-2010 as<br />
the following:<br />
Get the maximum advantage of RE sources in Syria as the hydropower and wind energy,<br />
besides solar thermal energy applications, and any RE sources available.<br />
Contribute photovoltaic and wind energy in electricity produced into the grid, to reduce<br />
the oil and gas used for that purpose.<br />
Divide RE needs according to areas requirements, for example using wind energy in<br />
electricity supply for regions that has a suitable average of wind speed, or using biomass<br />
energy for thermal purposes in the rural areas.<br />
Government Incentives for using RE applications as solar thermal in residential sector,<br />
and manufacturing wind turbines, photovoltaic cells, solar thermal sets.<br />
Government Institutions and Co-ordinating Authorities<br />
The State <strong>Plan</strong>ning Commission acts as the co-ordinator for planning in all sectors of the<br />
Syrian economy. In the energy sector, several entities / government ministries are involved<br />
with energy - planning based on the resources at their disposal. Resource and energy<br />
planning in Syria are organised by the Higher <strong>Plan</strong>ning Council (HPC) and by the Supreme<br />
Energy Committee (SEC). In addition to managing the present energy resources, the HPC<br />
and SEC also examines the potential of renewable energy (RE) as an alternative to fossil<br />
fuels.<br />
Since 1998, some of activities in the field of renewable energy were attached to the Atomic<br />
Energy Commission (AEC). This succeeded an earlier arrangement where a Renewable<br />
1<br />
A workshop on Syrian Institutional Framework for Renewable Energy was organised in Damascus under the EU-Syria<br />
dialogue co-ordinated by the DG XVII of EC in Nov1998.<br />
2<br />
As an outcome of the Renewable Energy Entrepreneur Development Workshop held in Damascus in 2000<br />
3 SYR/99/001/08
SYRIA - National study<br />
Energy Office was attached to the Prime Minister’s Office. This change was seen as the first<br />
step towards establishing an autonomous Renewable Energy Authority. Recommendations<br />
for an institutional framework for renewable energy, proposed in a EU financed study 4 in<br />
December 1998, proposed the establishment of a Renewable Energy Authority, under the<br />
authority of the Ministry of Electricity 5 .<br />
Renewable energy activities and projects have been carried out by several Government of<br />
Syria entities, such as the Scientific Studies and Research Centre, Atomic Energy<br />
Commission, Universities, the Ministry of Electricity, Ministry of Environment, Ministry of<br />
Irrigation, Ministry of Agriculture and Agrarian Reform, Ministry of Industry, Ministry of<br />
Petroleum and Mining Resources. These activities have been carried out with little coordination<br />
among the implementing ministries. Some examples of such instances are:<br />
1) Ministry of Agriculture and Agrarian Reforms have been implementing renewable energy<br />
programmes involving water pumping using wind electric generators, use of biogas<br />
digesters and biomass burners for tobacco drying. There have also been efforts to<br />
involve the Food and Agriculture Organisation in a project dealing with renewable energy<br />
for the Bedouins in the Badia;<br />
2) Ministry of Industry established a Solar Hot Water Systems manufacturing facility in 1982<br />
and the General Company for Batteries and Liquid Gases in Aleppo has been involved in<br />
renewable energy storage systems;<br />
3) The Ministry of Environment under its greenhouse gas abatement strategy is planning<br />
renewable energy projects involving biogas, solar hot water systems for domestic and<br />
industrial purposes, PV electricity generation and wind energy;<br />
4) There are villages and farms that have not been electrified in Homs region (Palmyra),<br />
such as Alkoum, Alfasdeh, Alfourglos and Job-Aljarrah. The Public Establishment for<br />
Electricity Distribution (PEDEE) of the Ministry of Electricity is considering some of these<br />
villages and farms as candidates for renewable energy based micro-grids.<br />
The lack of a coordinating establishment, with the specific objective of facilitating the accelerated development<br />
of renewable energy resources is considered a major barrier.<br />
Renewable Energy Sector Policies<br />
Syrian energy policy has three main priorities: to expand the gas market; to sustain oil<br />
production; and to develop the country’s power capacity. As Syria hasn’t enough natural gas<br />
to meet domestic consumption and making oil available for export, the dependency focused<br />
on the Arab gas line. The current policy aims to increase the use of natural gas in thermal<br />
power stations, replacing HFO and thus prolonging the availability of reserves. In addition,<br />
the policy encourages investment in oil exploration and the greater use of modern technology<br />
for the purpose. The refining policy objective is to align with the world regulations on quality<br />
of petroleum products. The private sector is being brought in to engage in the distribution of<br />
oil products. The government aims to reduce the state monopoly over the power sector.<br />
There are many ongoing efforts to reinforce the transmission and distribution of networks,<br />
and to improve the quality of customer services 6 .<br />
Within this global policy, energy from renewable resources is not a priority. A national target<br />
has been proposed to replace approximately 5 % of energy produced from fossil fuels by that<br />
produced from renewable resources by 2010 7 , which consider a very optimistic scenario.<br />
This inconsistency between the current global policy and the national strategy is also<br />
illustrated by an Integrated Resource <strong>Plan</strong>, prepared by Stockholm Environmental and Tellus<br />
Institutes in 1999 in association with the Ministry of Electricity, which projects that 5 % levels<br />
of penetration from solar and wind resources may not be realistically achieved before 2020,<br />
with most growth after 2010 8 .<br />
There are presently very few specific policies, which specifically cover renewable energy.<br />
Policy for projects revolves recently for the most part around Investment Promotion Law No 8<br />
4 Carried out by Hagler Bailly Consulting Ltd and Partex CE<br />
5 Source Reference: Institutional framework for Renewable energy, December 1998<br />
6 Extract from the International Energy Data Report:1998.<br />
7 Information source: Renewable Energy Country Profile. Sept 2000<br />
8 Initial Application of Integrated Resource <strong>Plan</strong>ning: 1998/99 UN DESA IRP Training project. Volume I.<br />
543
544<br />
ENERGY AND SUSTAINABLE DEVELOPMENT IN THE MEDITERRANEAN<br />
of 2007. This law governs capital investments in development projects by all parties, whether<br />
resident, non-resident, Syrian or foreign, and applies to approved economic and social<br />
development projects in Energy, Industry, Transport or any other sector which the Supreme<br />
Investment Council deems within the scope of the Investment law. Key criteria for approval of<br />
projects under this Law comprise:<br />
1) Compliance with State development plan,<br />
2) Focus upon locally available resources,<br />
3) Increased employment opportunities,<br />
4) State of the art technology transfer.<br />
The low is a development of the old investment low No.10 issued in 1991 and presents many<br />
facilities to the investors, for example the permission to own the required land for the project<br />
by the investor, and to transfer all foreign currency out of Syria, etc.<br />
1) Solar Thermal Energy:<br />
Solar thermal applications are the most common in Syria for many reasons:<br />
a) There are many manufacturers of water heating solar systems.<br />
b) Prices of water heating solar systems is nearly reasonable comparing with other<br />
RE applications.<br />
c) The average solar radiation is about 5 kWh/m 2 /day which present high output of<br />
these systems.<br />
d) Solar water heating systems are easy to install and enough experience is<br />
available.<br />
e) Savings appear directly especially in the governmental side because the<br />
government buys the diesel oil and electricity (energy carriers used in water<br />
heating) in international prices and sell them to the end consumer in subsidy<br />
prices.<br />
Therefore the national strategies focused on solar thermal application especially for<br />
residential and commercial sectors, through identify a national target of installing 200000 m 2<br />
annually that will encourage the national solar thermal systems manufacturing in quality and<br />
quantity by expanding its markets.<br />
NERC <strong>Action</strong>s:<br />
The national project for residential solar thermal water heating sets by the cooperation<br />
with the industrial bank, Agency for Combating Unemployment, and local manufacturers.<br />
The project based In the payment in instalment solar thermal sets to all governmental<br />
employees, the project aimed to increase the installed areas of solar collectors, but it<br />
didn’t succeed as expected because the low income of the employees and the energy<br />
low prices. The project result to install just 2800 m 2 of solar collectors, which equal about<br />
7% of the expected area installed.<br />
As a result of the mentioned project NERC suggested a new policy for solar thermal<br />
applications in residential sector, this policy concentrated on the government subsidy to<br />
expand solar applications through paying a percentage of 50% of the total price of the<br />
solar collectors and the rest to be paid from the user as a 5 years loan without any<br />
interests. This suggestion approved by the governmental highest economic committee<br />
and it is now in progress.<br />
NERC started execution many pilot projects in this field by the cooperation with the<br />
Ministry of Electricity in all generation and substations where hot water is needed besides<br />
employees dormitories which belong to the ministry, and Ministry of Health to install solar<br />
thermal collectors in all governmental hospitals. The pilot project started in November<br />
2006 by one hospital, and performed successfully. NERC is planning to implement 28<br />
hospitals and all electrical substations in 2007 the project is expected to be achieved in<br />
2008.
SYRIA - National study<br />
Besides “Energy Conservation Law” obligate all engineering offices which design and<br />
construct new building or establishment to install solar water heating systems with identified<br />
incentives.<br />
Solar thermal applications in Syria are limited in water heating projects currently, the<br />
applications regarding heating and cooling purposes will be taken into consideration in R&D<br />
issues in NERC and other related associations, in addition to NERC partnership in<br />
SOLATERM project financed by EU and coordinated by GTZ, this project launched in<br />
November 2006 and will go on till the end of 2008.<br />
SOLATERM project objectives are:<br />
a) Widespread application of a new generation of solar systems for hot water,<br />
heating and cooling in the <strong>Mediterranean</strong> partner countries (MPC).<br />
b) To transfer technological know-how on solar thermal and cooling systems to the<br />
MPC and adapt new technologies to the specific needs of MPC<br />
c) To broaden the spectrum of solar thermal and cooling applications in the MPC<br />
through the promotion of cost-effective solutions.<br />
d) To support the R&D and application of solar thermal and cooling systems in the<br />
MPC with political measures.<br />
2) Photovoltaic Systems:<br />
The five years plan 2006-2010 put in the main national objectives aspects using solar energy<br />
to produce electricity especially for no electrified areas.<br />
The photovoltaic industry in Syria consists of a module assembly unit in the PV Lab, run by<br />
the Scientific Studies and Research Centre (SSRC). This is an R&D cum module production<br />
facility with an annual production capacity of 250 kWp and was established in 1998. The<br />
facility produced 15 kWp of modules in 1999 - representing a capacity utilization of only 6 %<br />
and approximately 0.01 % of world production in that year.<br />
The facility was set up under technology transferred from Central Electronics Limited (CEL)<br />
in India and apart from module assembly has the capability to manufacture balance-ofsystems<br />
components such as charge regulators, inverters and electronic ballasts. SSRC also<br />
co-operates with a public factory producing SLI 9 batteries to produce solar batteries. There<br />
are other private sector distributors that are involved in supplying professional PV systems to<br />
the industrial and commercial sector.<br />
About 90 kWp of solar PV systems are installed in the entire country, and most of this has<br />
been financed through bi-lateral and multi-lateral aid programs. Approximately 10 kWp have<br />
been installed in a commercial context, mostly for telecommunications and beacon lighting.<br />
Japanese International Co-operation Agency (JICA) has committed 10 million US$ to solar<br />
electrification, pumping and desalination. The project was executed jointly by JICA study<br />
team and PV Lab. team/SSRC to electrify approximately 100 households. The project<br />
installed approximately 65 kWp of PV systems on a non-commercial basis.<br />
Several commercial sources for PV products are available such as Alia Company in<br />
Damascus and Hamatis and Soukkar companies in Aleppo.<br />
Till now there is no specific policy for photovoltaic applications for many reasons:<br />
No specific incentives from the government.<br />
The available systems are only off grid systems.<br />
High prices of photovoltaic cells and its accessories.<br />
Lack in experience in photovoltaic applications.<br />
In spite of all above-mentioned barriers, there are R&D associations still focusing in this kind<br />
of RE illustrated in the following table:<br />
9 Staring, Lighting and Ignition batteries, these are also known as car batteries.<br />
545
546<br />
ENERGY AND SUSTAINABLE DEVELOPMENT IN THE MEDITERRANEAN<br />
Table 24 R&D associations still focusing in RE<br />
Association Structure Activities<br />
Photovoltaic<br />
transmission laboratory<br />
(SSRC)<br />
Atomic Energy<br />
Commission (AECS)<br />
- PV cells manufacturing.<br />
-Testing photovoltaic instruments and<br />
accessories.<br />
Laboratory equipments to develop<br />
PV cells.<br />
NERC Renewable energy applications R&D<br />
and pilot project execution.<br />
250 kW of PV cells annually, besides<br />
electronic accessories since 1990.<br />
Specify and preparation PV cells.<br />
Researches in widespread PV<br />
systems.<br />
Damascus University laboratories PV specification and testing.<br />
Aleppo university PV energy research laboratories Electronic researches in PV control<br />
Albaath University laboratories PV layers and films deposition.<br />
General Commission for<br />
Environmental Affairs -----<br />
International cooperation for<br />
sustainable development and CO2<br />
trade.<br />
Overall, achieve the national objective in increasing the contribution of PV will focus on two<br />
main items the first is lighting the no electrified areas and the second is water pumping,<br />
which mean using PV in areas far of the electrical grid to avoid electrical transmission and<br />
transforming equipment costs, that’s will approximately make using PV is a semi feasible<br />
application.<br />
3) Wind Energy:<br />
Mechanical windpumps had been popular in Syria and there was an active wind-pumping<br />
industry that installed over 4,000 windpumps in Syria. The market for windpumps has been<br />
severely affected by the precipitation levels and increasing depth of the water table stretching<br />
the limits of the technology.<br />
The Company Systèms d'Avant-Garde (SAG) is an indigenous private company that started<br />
operations in 1990 and manufactures small wind electric generators in the range of 750 W to<br />
50 kW and a frost defender with a rated capacity of 10 HP. The company has so far supplied<br />
systems totalling 650 kW, since its inception. SAG has also exported samples of their<br />
equipment to Japan, Jordan, Lebanon, Macedonia and Spain.<br />
The largest wind turbine in Syria is a 150 kW Nordex machine installed at Qunaitera as a<br />
UNDP demonstration in 1994. This is the only grid-connected machine in the country,<br />
contributing 300 MWh/year.<br />
There are estimated to be 1000 multi-bladed windmills currently operating out of the 4000<br />
installed over a forty-year period. Sizes range from 3-5 meter rotor diameters and from 10-15<br />
meter hub heights. Current costs range between 75 000 Syrian Pounds and 140 000 Syrian<br />
Pounds per unit (1500 USD – 3000 USD). Current domestic annual production does not<br />
exceed 20 machines per year. In this sector, commercialization is competing against the<br />
growing availability of electrical pumps, the availability of grid electricity and decreasing<br />
levels of water tables.<br />
Approximately 650 kW of locally manufactured wind turbines have been used for power<br />
generation, frost prevention and battery charging. Production capacity at the abovementioned<br />
manufacturing facility is approximately 600 kW/year. On account of low capacity<br />
utilization and slow commercialization, SAG is finding the business prospects unattractive.<br />
The Ministry of Agriculture is currently evaluating the performance of the installed wind<br />
turbines. The study should provide good indicators for further commercialization. In addition<br />
to the domestic consumption, a few frost protection turbines have been exported to several<br />
countries, mainly Lebanon. The export market could also contribute to better capacity<br />
factors.<br />
In addition to domestic manufacture mentioned above, the Ministry of Electricity has received<br />
proposals from foreign developers to install and operate wind farms to tap the available wind
SYRIA - National study<br />
resources. A proposal from several investors for a 100-500 MW farm is currently under<br />
consideration by the Ministry of Electricity.<br />
Several of the potential sites which have been identified by the Ministry of Electricity under a<br />
wind resource assessment program 10 are located where infrastructure to transport and erect<br />
wind turbines and the infrastructure to evacuate the electricity produced by the wind farms<br />
exist.<br />
In the end of 2002 the Wind Resource Assessment Project has been started in cooperation<br />
with decon (Deutsche Energie-Consult), the project is aiming at identifying and promoting an<br />
appropriate contribution of wind energy use to the power generation mix in Syria.<br />
By means of the project activities the basis for a cost effective and environmentally<br />
sustainable wind power generation in Syria shall be created in terms of:<br />
Improved information on the spatial distribution of the wind energy resources.<br />
Pre-visibility level evaluations of potential win park sites.<br />
Recommendations for the further wind park development program in Syria.<br />
On the job training of local staff.<br />
The project obtained the permits from the local authorities for the erection of the 20<br />
measurement stations. So far, for ten potential win park sites a one-year measurement cycle<br />
has been completed and the data evaluated.<br />
The so called Wind Atlas model as developed by RIS (Danish National Research<br />
laboratories) was applied for analyzes of the wind conditions, that allows to determine the<br />
detailed wind conditions in the wider surroundings of the measurements mast and thus to<br />
select the optimal micro-sites and to develop a detailed lay-out of a wind park.<br />
Five of the investigated sites proposals for which the calculated dynamic generation cost<br />
range between 4,5 and 5,5 €cent per kWh are considered worth for further investigation and<br />
project realization.<br />
If we assume that areas for wind farms are totally available we could install about 140 MW<br />
wind energy capacity till 2010.<br />
Nowadays, NERC is executing the first wind farm in Sindianah after the required<br />
measurements had been taken and evaluated, the project is financed by the Spanish<br />
government, and with total capacity of 6 MW, the announcement for the invitation for tenders<br />
or bids will be at the end of February 2007.<br />
4) Biomass Energy:<br />
Agriculture is the primary sector having the highest percentage of contribution (33%) to GDP<br />
in Syria during 1998. The popular crops raised include wheat and barley, cotton, olives,<br />
sugar beet, tobacco and fruit.<br />
Approximately 49% of the Syrian populations live in rural areas and a considerable number<br />
of these people continue to use biomass in the form of animal and agricultural wastes for<br />
their energy needs such as lighting, heating, hot water production and cooking. The quantity<br />
of biomass used in the domestic sector has decreased over the last twenty years with the<br />
spread of oil and gas stoves and electrification. In 1996, wood consumption in Syria was<br />
estimated to be 500 thousand toe 11 .<br />
Other combustion of biomass for energy includes heat generated from burning olive leaves<br />
which is used for heating greenhouses and poultry farms, or drying tobacco<br />
In addition to direct combustion of biomass there is the following use of biomass in Syria 12 :<br />
10 Assessment carried out by the Meteorology Department and Risø National labs in Denmark.<br />
11 National consultant responses<br />
12 ibid<br />
547
548<br />
ENERGY AND SUSTAINABLE DEVELOPMENT IN THE MEDITERRANEAN<br />
Two biogas plants (20m 3 and 100 m 3 ) 13 owned by the Ministry of Agriculture for cow<br />
waste at Gotta, near Damascus;<br />
Two biogas plants (12 m 3 and 35 m 3 ) in Ezraa village, Daraa. The daily output of the<br />
larger unit is 8 m 3 ;<br />
Two biogas plants of 12 m 3 in Der Alfradese, Hama;<br />
Two family biogas plants of 12 m 3 and 14 m 3 are planned to provide gas to 13 families;<br />
Four biogas digesters were transferred from India and tested in Damascus. There are<br />
plans to construct four plants in the south of Syria under the supervision of the Ministry of<br />
Agriculture.<br />
Under the <strong>Mediterranean</strong> Environment Technical Assistance Programme (METAP), the City<br />
of Aleppo commissioned a feasibility study with grant assistance from the European<br />
Investment Bank (EIB) for a solid waste management project. The study 14 had three<br />
elements:<br />
Assessment of the current municipal waste handling and disposal arrangements, and the<br />
institutional framework;<br />
Preparation of a solid waste management plan with a 15 year horizon plus separate<br />
provision for inert and construction waste;<br />
Definition of similar surveys and waste management plans in locations with industrial and<br />
hazardous waste.<br />
The study completed in 2001, is expected to result in Syria's first urban waste-to-energy<br />
power plant.<br />
Some of the lessons that are relevant to Syria from the global developments in bio-energy<br />
technologies are:<br />
Biomass could be an important source for providing heat and power to the Syrian energy<br />
sector and potential of this sector needs to be explored further. More demonstration and<br />
pilot projects need to be promoted using biomass technologies;<br />
Although there has been some experience with biological conversion of biomass to<br />
energy through the biogas route in Syria. The thermo-chemical route has not been<br />
pursued so far in Syria. There is scope for more incineration and pyrolysis projects in<br />
Syria;<br />
Syria may proceed and set up a urban waste based power plant in one of the major cities<br />
and could start with Aleppo where the process has already begun.<br />
NERC is now responsible to widespread using biomass energy through special directory<br />
specialized in Biomass energy developments needs, tools, projects, and researches. The<br />
aim now is to find a financing organization to support R&D and executive projects regarding<br />
CDM in rural areas.<br />
5) Urban Waste Resources<br />
Over 50 % of the Syrian populations live in urban areas and approximately 47 % of the<br />
populations live in Aleppo and Damascus. Since there is a concentration of a large<br />
percentage of population in the major cities, there appears to be opportunity to use the<br />
municipal waste for energy purposes.<br />
The solid waste generated in the cities at Damascus and Aleppo are over 1000 tones per<br />
day 15 . Currently the urban waste in Damascus is collected and transported to a treatment<br />
plan at Najha where it is converted to fertilizer. The next table shows the production of<br />
domestic waste from the main cities of Syria. 7797 tones of waste are produced per day.<br />
13 Digester volume<br />
14 undertaken by Cowiconsult<br />
15 Present status and policy on the development of renewable energy sources in the Syrian Arab Republic, draft, Abed-el-hadi<br />
Zein.
SYRIA - National study<br />
Table 25 Production of Domestic Waste in Syrian Cities (1998)<br />
City Population in Thousand<br />
Damascus 1513 766<br />
Suburb of Damascus 1934 967<br />
Aleppo 3385 1692.2<br />
Homs 1373 686<br />
Hama 1232 616.1<br />
Lattakia 827 413.3<br />
Deir-ezzor 827 413.3<br />
Edlib 1029 514.7<br />
Al-Hasakeh 1169 577<br />
Al-Raqua 624 311.9<br />
Al-Sweida 296 148.2<br />
Deraa 702 350.9<br />
Tartous 639 319.7<br />
Al-Qunaitera 62 31.2<br />
Total 15 5997 7 797<br />
Production of Solid Waste<br />
Tons/day<br />
The liquid waste from the main cities equals 1,154,000 m 3 per day with 85 % of the<br />
contribution from five cities, Damascus, Aleppo, Homs, Hama and Lattakia 16 . The Damascus<br />
city waste water is collected in a water treatment plant linked to a co-generation plant of 2<br />
MW.<br />
There was a feasibility study carried out by COWI Consulting Engineers for the City of<br />
Aleppo financed by the European Investment Bank. The study was carried out during the<br />
period 1998 to 2000. The study found that the quantities of wastes generated in Aleppo in<br />
1999 were over half a million tones annually which was projected to grow to about a million in<br />
2015. It is envisaged that this project will be implemented soon.<br />
The summary of the urban wastes and assessments in Syria are:<br />
The cities of Aleppo, Damascus 17 , Homs and Hama present good prospects for waste-toenergy<br />
plants in Syria;<br />
The COWI consult study has also found that the annual growth rates in wastes are<br />
almost 5% for domestic waste and about 4% for commercial, public facility, health care<br />
and demolition wastes. Such annual growth rates presents a problem for waste handling<br />
as well as an opportunity for waste to energy generation.<br />
2.2 Ins tr ume n ts and measures to be taken in fa vo u r of R UE and<br />
RE<br />
2.2.1 Tools and measures in favour of rational energy use (RUE):<br />
Incentive methods:<br />
“Energy Conservation Law” includes a list of governmental incentives for RUE projects and<br />
actions to encourage people, organizations and manufacturers to adopt RUE aspects, these<br />
incentives are illustrated as follows:<br />
Exemption the imported raw and manufactured materials used in building insulation from<br />
all taxes.<br />
Exemption imported materials (raw, semi manufactured, manufactured) regarding saving<br />
energy tools, instruments, and high efficiency appliances and equipments.<br />
16 National experts consultation – May 2001<br />
17 including it's suburbs<br />
549
550<br />
ENERGY AND SUSTAINABLE DEVELOPMENT IN THE MEDITERRANEAN<br />
Put low fees for testing and elaborating energy efficiency instruments and equipments<br />
which consume energy for the purpose of improving its efficiency.<br />
Grant all researchers and inventions regarding RUE special remunerations.<br />
Grant all the associations, organizations, building, and establishments which carry out<br />
“Energy Efficiency Law” special remunerations.<br />
Carbon and energy audits:<br />
As mentioned in paragraph Rational energy use (RUE) policies in the industrial sector the<br />
SSEECP project performed more than 100 detailed audits covering boilers, steam<br />
systems and electrical systems for 50 plants. These audits illustrated that the savings in<br />
CO2 are about 100 000 ton/year distributed in many regions in Syria.<br />
Rehabilitation of Banias thermal power station contributed to reduce about 300000 ton<br />
CO2 per year.<br />
The initial studies regarding home appliances energy efficiency labels and standards for<br />
refrigerators illustrated that the average energy consumption of the refrigerator in Syria is<br />
about 850 kWh/year, about 100000 new refrigerators sold annually, if the program as<br />
expected and calculated will due to reduce the average energy consumption to 650<br />
kWh/year that’s mean the annual savings in CO2 will be in the next year after the program<br />
launched 15 000 ton CO2 per year, after ten years as a cumulative calculation the CO2<br />
savings will reach 825000 ton, and if the program will include air-conditioning residential<br />
system, washing machines, and lighting systems as mentioned above the expected CO2<br />
saving could reach in 2017 about 2,5 Million ton.<br />
The PEDEEE power factor correction project which results till now to install 1400 MVAR<br />
contribute in CO2 savings about 30000 ton/year, whereas the project in continued and<br />
the expected MVAR installed will reach 5000 MVAR till 2010, so the CO2 savings<br />
expected will be about 220000 ton CO2.<br />
Apply “Building Thermal Insulation Code” on the new buildings regarding that 130000<br />
new buildings established yearly in Syria will result a CO2 savings about 200000 ton CO2<br />
per year, after 10 years the cumulative calculations of CO2 savings will be 2.9 million ton<br />
of CO2, whereas the residential sector is the highest energy consumer and its percentage<br />
of the total consumption is about 48%.<br />
Evolution of R&D and training programmes:<br />
In SSEECP project many of training programmes and seminars and workshops performed,<br />
the local training programmes included more than 800 participants from Ministry of<br />
Electricity, Ministry of Industry, Ministry of Health, Engineers syndicate, and universities. The<br />
training axes focused on about 12 different fields in energy efficiency regarding thermal and<br />
electrical systems efficiency in buildings and factories.<br />
The training program aimed to create certificated energy auditors in all sectors.<br />
The trainers were many of international and national experts.<br />
The global training vary in its fields and trained associations and institute and also focused<br />
on the implementation of energy efficiency and energy savings opportunities execution, and<br />
it was in Egypt, Germany, Jordan, Greece, Spain, Finland, Armenia, China, Japan, India.<br />
NERC nowadays is concentrating on creating cooperation phases with global and local<br />
organizations for development R&D investments regarding RUE in Syria.<br />
Till now no R&D real work has been performed, but it is in progress with high levels of efforts<br />
done and still to achieve the required sustainable development regarding RUE.<br />
Awareness-raising campaigns:<br />
After searching for local associations interested in RUE awareness campaigns, I found that<br />
the only who did that was SSEECP project because it was part of the TOR put by the funded<br />
sides.
SYRIA - National study<br />
SSEECP project had a cooperation agreement with Ministry of Education for RUE<br />
awareness campaign in schools curriculum in different grades and stages, besides many of<br />
brochures about special applications for saving energy in homes like how to use home<br />
appliances in efficient ways, and a lot of seminars and conferences gathered the industrial<br />
associations to direct them to adopt efficient procedures in the productions lines especially<br />
boilers, steam and air networks, motors, electrical systems, and lighting.<br />
SSEECP project participated in many exhibitions regarding power and energy presenting<br />
samples of green buildings and distributing many kinds of brochures.<br />
2.2.2 Tools and measures in favour of rational energy use (RE)<br />
Incentive methods<br />
“Energy Conservation Law” includes a list of governmental incentives for RE projects and<br />
actions to encourage people, organizations and manufacturers to adopt RE aspects, these<br />
incentives are illustrated as follows:<br />
Exemption the imported raw and manufactured materials used in RE applications from all<br />
taxes.<br />
Exemption RE projects from all usual projects taxes and grant the required<br />
encouragements to invest in RE to produce electricity, the encouragements are that the<br />
Ministry of Electricity is ready to buy all produced electricity and connect it to the grid,<br />
besides the facilities presented by the government for all investors cleared in Decree<br />
number /8/ issued by the Syrian president in 2007.<br />
Government subsidy to expand solar water heating applications through paying a<br />
percentage of 50% of the total price of the solar collectors and the rest to be paid from<br />
the user as a 5 years loan without any interests.<br />
In general the government through Ministry of Electricity and NERC are ready to support<br />
any RE investment in Syria as an essential orientation.<br />
Carbon reductions<br />
Wind farm of 6 MW in Sindianah after being put in service at the end of 2007 will<br />
contribute to reduce about 20000 ton CO2 per year.<br />
We expect to install about 500 MW of wind turbines in the near future that will lead to<br />
reduce about 1.6 Million ton CO2 per year.<br />
NERC is planning to install about 200000 m 2 of solar collectors yearly that will lead to<br />
reduce about 25000 ton CO2 per year, after 10 years the cumulative calculations of CO2<br />
savings will be 1,4 million ton of CO2.<br />
Evolution of R&D and training programmes<br />
Research, Development and Demonstration (RD&D) has been conducted by several<br />
institutes and dates back more than 20 years to the mid-1980s. RD&D efforts have focused<br />
upon the techno-economic evaluation and potential of solar and wind resources and<br />
technologies.<br />
Expenditure on RD & D has been modest to date in the four Syrian universities: Damascus,<br />
Aleppo. Al-Baath and Tishreen. The universities, as well as the Higher Institute of Applied<br />
Science and Technology (HIAST), Ministry of Electricity, the Atomic Energy Commission and<br />
the SSRC have research and development capacity from technician level to PhD. The SSRC<br />
is considered the best-equipped centre in Syria, with technical capacity and equipment that<br />
the four Syrian universities do not possess. RD&D output from the four Universities in Syria<br />
is limited, mostly because facilities are not adequately equipped and institutes have little or<br />
no budgetary provision.<br />
More specific to the renewable energy research, there is an absence of a concerted and<br />
targeted RD&D action program, with the exception of the activities conducted through SSRC.<br />
The situation is aggravated by the lack of budgetary provision from the Government of<br />
551
552<br />
ENERGY AND SUSTAINABLE DEVELOPMENT IN THE MEDITERRANEAN<br />
Syria 18 for RD&D work. Given the low levels of experience and activity in a demonstration<br />
context, substantial governmental support is required to trigger applied RD&D. Research<br />
and Development activities in renewable energy undertaken and in progress are summarized<br />
below:<br />
1) In the mid 1980s, SSRC/HIAST erected an outdoor liquid flat plate collector test facility<br />
and several years later a similar facility for air collectors. A number of test stations were<br />
established with the objective of introducing quality control of industrially produced<br />
equipment;<br />
2) PV Lab./SSRC activities include monitoring and performance analysis of PV systems<br />
installed through JICA project. Development of a charge regulator for a PV system, such<br />
as PWM in use in Kalif village 19 . It extended this activity to include development of an<br />
inverter and other balance of systems (BOS) components for PV systems;<br />
3) Some research on photovoltaic cells has been conducted by the Atomic Energy<br />
Commission;<br />
4) The PV Lab./SSRC is currently adapting 20 battery technology for solar applications. With<br />
initial guidance from Chloride Technical Training, UK, it is associated with the General<br />
Company for Batteries and Liquid Gases in Aleppo in this endeavour;<br />
5) Performance testing of PV and solar thermal systems has been conducted by SSRC and<br />
deemed to have reached a state of maturity. In testing solar thermal systems, these<br />
include collectors, water heating systems, drying and desalination plants;<br />
6) Research on frost protection wind machines by the only private sector manufacturer of<br />
this technology in Syria 21 .<br />
Demonstration activities undertaken and in progress are summarized below:<br />
7) Equipping some households with PV power in 2 villages near Damascus in 1994 and<br />
setting up performance monitoring facilities (6 kWp total);<br />
8) Setting up PV stand-alone and central PV power plants in 4 villages, plus fresh water<br />
pumping and brackish water desalination units at one location, (67 kWp total);<br />
9) Technology transfer of a 250 kWp single crystalline R&D and limited production facility,<br />
complete with indoor simulator. 15 kWp of cells/modules were produced in 1999;<br />
10) The Ministry of Electricity set up a 150 kW wind turbine demonstration project in 1994.<br />
Since installation the site has been regularly monitored and maintained by the Ministry;<br />
11) The Ministry of Agriculture and Agrarian Reform (MAAR) installed 4 solar home systems<br />
in Bedouin settlements in 1998. PV module of one unit was damaged with the first four<br />
months of installation. Users of the remaining systems have expressed satisfaction and<br />
have evinced interest in purchasing additional SHS. Lanterns were also demonstrated<br />
and market value assessed. Subsequently 4 solar lanterns and 2 solar<br />
refrigerator/lighting systems were procured, installed and feedback obtained. Their<br />
successful deployment triggered procurement of 2 further systems and 24 more lanterns.<br />
The systems work well and no problems were faced during the three years of operation.<br />
No new systems were added 22 ;<br />
12) The largest demonstration project in the PV sector, initiated in 1995 was jointly executed<br />
by JICA and SSRC. The programme worth 10 million USD brings electricity to four pilot<br />
villages (Zarzita, Fedre, Katoura and Rasem Al Shikh Kalif) near Aleppo, good quality<br />
drinking water through water pumping and desalination and develops local cottage<br />
industries. The project also includes socio-environmental studies and an analysis of<br />
behavioural patterns in pilot villages. Three of the four pilot villages were equipped in<br />
1997 with stand alone solar home systems, whilst the fourth (Zarzita) is equipped with a<br />
35 kWp centralised PV micro-grid system. The electricity provides power for lighting,<br />
radios, TV and refrigerators and washing machines in Zarzita where the central plant is<br />
installed. Later the JICA study team investigated the degree of satisfaction of the<br />
residents of the four villages with the overall performance of the systems. The results<br />
were as follows: irrespective of generation, a little over 60 % indicated satisfaction. About<br />
18 Source Ref: Present Status and Policy on the development of RE sources in the Syrian Arab Republic, P8.<br />
19 Source Ref: Study for introduction of integrated PV systems into Syrian Arab Republic, Section 12.5<br />
20 With support from UNDP experts<br />
21 SAG company<br />
22 National consultant responses
SYRIA - National study<br />
25 % were fairly satisfied and less than 9 % were dissatisfied. The Ministry of Electricity<br />
with support from PV Lab. is responsible for establishment and operation of a private<br />
institutional, management and financial system in the pilot villages. This includes billing<br />
end users and ensuring electricity services are available. From this pilot investment the<br />
Government of Syria is expected to finance the extension of supply and services to other<br />
villages.<br />
Other activities include a proposal of co-operation with the member States of ESCWA<br />
including provision for a training component on the testing of RE components and systems in<br />
various applications. This activity is currently in the planning phase.<br />
The draft proposal for establishing a National Renewable Energy Centre includes a strong<br />
focus on RD&D, which would extend substantially beyond technology development. The<br />
general mandate of RD&D proposed would include: 1) Policy and strategic research, 2)<br />
economic of technology research, 3) demonstration projects in field environment, 4) supply<br />
and demand side energy efficiency research, and 5) collaborative research.<br />
Also there are some separated activities as follows:<br />
In SSEECP project many of training programmes and seminars and workshops<br />
performed.<br />
NERC nowadays is concentrating on creating cooperation phases with global and local<br />
organizations for development R&D investments regarding RE in Syria, find a financing<br />
organization to support R&D and executive CDM projects.<br />
Awareness-raising campaigns<br />
There have been no visible efforts from the government to generically promote renewable<br />
energy systems or specific technologies. However the government has been engaged in<br />
other promotion, such as of agriculture, through print and electronic media.<br />
Efforts to build awareness about the prospects of renewable energy sources have been<br />
limited to activities undertaken by the state owned and private sector manufacturers and<br />
suppliers. The manufacturers of wind energy equipment, SHWS and PV systems use<br />
attractive product and corporate brochures to promote the products. There have also been<br />
advertisements by the renewable energy equipment manufacturers in the newspapers to<br />
promote their products.<br />
One major avenue for renewable energy systems promotion is via the Trade Fairs and<br />
Exhibitions, which are held in different parts of the country. The Damascus International Fair<br />
held annually in August is one such event that could be used as a vehicle to promote<br />
renewable energy technology. There was also an Energy Equipment Exhibition in Damascus<br />
during October 2000 where SHWS and wind energy equipment were exhibited.<br />
Also SSEECP project participated in many exhibitions regarding power and energy<br />
presenting samples of green buildings and distributing many kinds of brochures.<br />
Indicators<br />
ENE_C08: Expenditures in RE and RUE: RE and RUE programmes share in energy<br />
investments and R&D expenses:<br />
The Expenditures in RE and RUE ratio of the total expenditure in the energy sector between<br />
2000-2005 was about 1.5%.<br />
The RE & RUE investments ratio of the total energy sector investments in energy sector<br />
between 2006-2010 will be about 4%.<br />
ENE_C05: Final consumer energy price per fuel and per sector:<br />
553
554<br />
ENERGY AND SUSTAINABLE DEVELOPMENT IN THE MEDITERRANEAN<br />
Table 26 The prices of energy carrier<br />
Type of energy carrier Previous prices<br />
Recent<br />
Prices<br />
Heavy fuel (industry sector) 26 ($/ton) (till 2004) 120 ($/ton) 100<br />
Light fuel (household sector) 146 ($/ton) (till 2001) 175 ($/ton) 340<br />
Automotive diesel oil (transport sector) 150 ($/ton) (till 2001) 175 ($/ton) 340<br />
Unleaded premium (transport sector) 485 ($/ton) (till 2005) 727 ($/ton) 0<br />
Natural gas (industry sector) 0.1 ($/m 3 ) 200<br />
LPG (household sector) 167 ($/ton) (till 2002) 250 ($/ton) 120<br />
Table 27 Electricity Tariff Effective Since 1/6/2002 (US$/KWh)<br />
Ratio of subsidization<br />
for Recent Prices (%)<br />
Item Consumption Voltage Level Peak Day Night Average<br />
1- 230 KV 0.043 0.034 0.030 0.034<br />
2- 66 KV 0.045 0.036 0.032 0.036<br />
3- 20 KV 0.047 0.040 0.034 0.040<br />
4- 20/0.4 KV<br />
4-1- Industrial 0.065 0.048 0.04 0.048<br />
4-2- Commercial 0.065 0.048 0.04 0.048<br />
4-3- Agriculture ( all crops ) 0.045 0.036 0.032 0.036<br />
5- 0.4 KV<br />
5-1- Residential<br />
1-50 kWh/month 0.005<br />
51-100 kWh/month 0.007<br />
101-200 kWh/month 0.01<br />
201-300 kWh/month 0.015<br />
301 and above kWh/month 0.05<br />
5-2- Commercial & Small Workshops 0.05<br />
5-3- Government Offices 0.04<br />
5-4- Street Lighting 0.03<br />
5-5- Religious Building Free of Charge<br />
The average subsidization of electricity prices is about 120%.<br />
ENE_C11: Share of fuel and electricity expenditures in household budgets<br />
As mentioned in the indicators profile the calculation done for two levels of the income as<br />
follows:<br />
The general level which consist about 60% of the Syrian society:<br />
The share of fuel and electricity expenditures in household budgets for this level<br />
is between 7.5 - 6%.<br />
The poor level which consist about 20% of the Syrian society:<br />
The share of fuel and electricity expenditures in household budgets for this level<br />
is between 8%.<br />
This indicator is about the same in these two levels because when the income decreases the<br />
energy usage decreases.<br />
ENE_C06: Existing incentive measures and policies for RE and RUE development at<br />
national level<br />
Till now there aren’t any documented incentives, but the “Energy Conservation Law” is the<br />
main policy result which contains definite incentives, the law arranged to be issuance in<br />
2007.
SYRIA - National study<br />
ENE_C07: Cities/regions/provinces with an existing energy audit and/or a carbon audit<br />
and/or with objectives in terms of RE and RUE:<br />
All energy audits and CO2 emissions savings didn’t related to regions and cities as<br />
mentioned before in the study, but we can make some assumptions regarding the electricity<br />
thermal power plants distributed in whole Syria and have the opportunity to be rehabilitated<br />
to reduce CO2 emissions.<br />
As we mentioned above the rehabilitation, development, and conversion of two units In<br />
Banias thermal power station to work on natural gas instead of heavy fuel oil, will lead to<br />
reduce about one Million of CO2 per year in Banias city.<br />
There are five thermal power plants had been prepared to work on natural gas, but they<br />
currently don’t because of the lack of the produced natural gas, Nowadays there are several<br />
projects to increase gas production, which will lead to supply these stations with enough<br />
natural gas instead of HFO for full production capacity.<br />
In case of all of that, the estimated CO2 reduction illustrated in the following table with clarify<br />
how those stations are distributed in several regions of Syria.<br />
Power<br />
plants<br />
Region-city<br />
Capacity<br />
of generations<br />
(MW)<br />
Produced power<br />
(MWh)<br />
Reduction of CO2<br />
(Ton CO2 / year)<br />
Fuel type<br />
Mehardeh Hama 630 3150000 826875 HFO - NG<br />
Banias Banias 680 3400000 892500 HFO - NG<br />
Tishreen Rural<br />
400 2400000 630000 HFO - NG<br />
Damascus<br />
Aleppo Aleppo 1065 6390000 1677000 HFO - NG<br />
Alzara<br />
Rural Homs<br />
660 3960000 1039500 HFO - NG<br />
Total 3435 19300000 5065875<br />
RE Tradable Green Certificates<br />
The creation of “Tradable Economic Instruments”. In practical terms this means that the<br />
environmental parameters, which policy makers try to control, are represented as tradable<br />
commodities. With the commodity defined, government can then establish demand drivers<br />
for trading and competition, which will drive an economic agenda. The present situation in<br />
Syria lends itself well to the creation of similar tradable instruments as a mechanism for<br />
separating and addressing issues of energy cost and competition with alternative energy<br />
sources of generation and the environmental benefit in the form of a tradable commodity.<br />
One example of such a tradable economic instrument in Europe is called the “Tradable<br />
Green Certificate” (TGC) system. The functions are as follows: An issuing body, which could<br />
be the Apex body, authorizes a registrar, typically a financial institute or broker, to issue<br />
TGC’s to an organization producing a certain quantity of electricity from renewable<br />
resources. The organization producing electricity from renewable energy can then sell the<br />
certificates to a new owner. The new owner would typically be an electricity producer or<br />
supplier that is required to meet a minimum mandatory quota of electricity supply from clean<br />
energy resources, such quotas being stipulated through government regulatory policies. The<br />
new owner would then redeem the TGC with a registrar as evidence of contribution, either<br />
through production or trading of its required quota of electrical energy from clean sources.<br />
TGC’s can be traded between owners, not unlike stocks. TGC’s are uniquely identified by<br />
serial numbers and can only be redeemed once through a registrar, thus avoiding double<br />
counting of green energy production. Registrar’s fees are levied by imposing a financial<br />
spread between the issuing value and redeeming value of the TGC’s.<br />
ENE_P04: total sum of investments made within the Kyoto Protocol’s Flexibility Mechanism<br />
555
556<br />
ENERGY AND SUSTAINABLE DEVELOPMENT IN THE MEDITERRANEAN<br />
Recognizing the importance of Kyoto Protocol in GHG Reduction, Syria certified the protocol<br />
in the mid of 2005.<br />
The Sustainable Development Criteria for CDM projects in Syria include the following:<br />
a. Conformity to political and legal dispositions<br />
b. Contribution to:<br />
i) Technology Autonomy.<br />
ii) Sustainable use of Natural Resources<br />
iii) Social Criteria (Improve Quality of Life and Equity, Alleviate Poverty).<br />
iv) Economic criteria (Provide Financial returns to Local Entities, Transfer of New<br />
Technology).<br />
v) Environmental Criteria (Mitigation of Global Climate Change, Reduce GHG,<br />
Conserve Local Resources).<br />
The Syrian institutional and regulatory framework for the implementation of the CDM:<br />
In accordance with Decision 17/CP.7, Para 29, Syria has designated General<br />
Commission for Environmental Affairs (GCEA) as the national authority for the CDM-<br />
Designated National Authority (DNA).<br />
The DNA main tasks are to provide written approval to the project participants and in<br />
case of a host party, confirm, through written approval, that the CDM project activity<br />
assists it in achieving sustainable development.<br />
Official establishment of the DNA at GCEA by the Minister of state for Environmental<br />
Affairs on March 15, 2003.<br />
GCEA through the National Climate Change Committee is the official focal point for<br />
climate change activities in Syria, including CDM projects.<br />
Promotion of Syrian CDM Projects among the International Investment Community is one of<br />
the priorities of the Syrian CDM-DNA.<br />
The process of Project Evaluation until delivering the Final Approval Letter to the project<br />
promoter by the DNA in Syria is under development in all sectors:<br />
Energy and Industrial Processes (Fuel Switching, Energy efficiency, Cogeneration,<br />
Fertilizer factories, Cement factories ...).<br />
Electricity (Wind Farms, Solar Energy…).<br />
Transportation (Fuel Switching).<br />
Wastes (Landfills, wastewater Treatment Stations).<br />
Agriculture (A forestation, Methane recovery from agricultural wastes …etc).<br />
Taking into account the complex legal, financial and technical issues related to the<br />
implementation of CDM:<br />
Developing countries with limited institutional capacity will face significant challenges.<br />
Syria now is required to establish an operational and efficient setup through which the<br />
national CDM process can function properly.
2.3 Energy E f fi ciency E vo l u ti on<br />
SYRIA - National study<br />
ENE_P01: Total energy intensity and by sector<br />
The illustrated table refers to the energy intensity as a total value according to the national<br />
GDP and by sector, it is clear the increasing of this indicator each year, which explain the<br />
necessity of EE&RE applications in Syria.<br />
In spite of the energy share per capita is low the energy intensity is high which clarify that the<br />
energy used in a non-efficient ways in all sectors especially in residential sector.<br />
ENE_C03: Efficiency of Energy conversion and distribution<br />
The main indicator for the efficiency of the energy conversion and distribution is the grid loss,<br />
which is the difference between the net electrical power sent from the output of the power<br />
plants and the registered electrical energy consumed, with taking in account the necessary<br />
self-consumption of power plants equipments.<br />
The loss in the electrical grid in Syria is:<br />
Technical loss<br />
Commercial loss<br />
Technical Loss:<br />
It’s the electrical power consumed by the grid equipments (lines, transformers, protection<br />
devices, control panels), this kind of loss is unavoidable but, it could be reduced through<br />
improving the efficiency of the system.<br />
Commercial Loss:<br />
It’s the deference between the total loss and the technical loss, the commercial loss caused<br />
by the following reasons:<br />
Inaccurate and broken meters.<br />
Fault readings of the meters.<br />
Illegal consumption.<br />
30.00%<br />
29.00%<br />
28.00%<br />
27.00%<br />
26.00%<br />
25.00%<br />
24.00%<br />
Figure 3 Loss value from 1998-2005:<br />
1998 1999 2000 2001 2002 2003 2004 2005<br />
It is obvious that the total loss increased extremely in 2002-2003, because of in 2002 the<br />
tariff structure changed and the electricity prices became higher, this cause the increasing of<br />
commercial loss especially the illegal consumption in poor areas, this force the Ministry of<br />
Electricity through the electricity companies to find the appropriate solutions to decrease the<br />
loss as in 2004-2005, aiming to reach the optimal case at least for the commercial loss.<br />
557
The main reasons of the grid loss:<br />
558<br />
ENERGY AND SUSTAINABLE DEVELOPMENT IN THE MEDITERRANEAN<br />
Energy demand extremely growth (more than 8% annual).<br />
Electrifying the very far villages and towns.<br />
Not enough generation facilities in some areas.<br />
Increment of illegal residential areas, leaded to illegal electricity consumption.<br />
Random widespread of some residential areas.<br />
Inaccurate meters readings.<br />
Whereas the loss ratio defers from one city to another between less than 20% to higher than<br />
30 %.<br />
Case 1: The following table shows the electricity main parameters till 2020 if nothing done<br />
regarding the grid loss.<br />
Table 28 Energy demand till 2020 at the same grid loss growth ratio<br />
Case 2: In case serious measures will be implemented to reduce the loss for 10% the values<br />
in the last table will be as follows:<br />
Conclusion:<br />
Table 29 Energy demand till 2020 where the grid loss will be 10%<br />
Whereas the investments value needed to achieve loss value 10% is about 1350 million $<br />
and the gross cumulative savings is about 5496 million $ and the NPV is about 1866 million<br />
$.
2.4 Renew able Ene rgy e vo l u ti on<br />
SYRIA - National study<br />
ENE_P02: Renewable energy share in the total energy<br />
The only renewable energies that affect the energy share in Syria are just the Hydropower<br />
and biomass.<br />
Table 30 The share of renewable energy in the total energy produced in Syria<br />
Energy (million TOE) 2000 2001 2002 2003 2004 2005<br />
Total 16.19 16.54 17.76 18.41 20.08 20.85<br />
Hydro 0.63 0.53 0.55 0.62 0.93 0.76<br />
Biomass 0.6 0.6 0.6 0.6 0.6 0.6<br />
Ratio of RE % 7.6 6.8 6.5 6.6 7.6 6.5<br />
The planned is to raise the percentage of RE of the total energy production to 7.5% in 2020<br />
through activating solar and wind energies in all sectors.<br />
ENE_C02: RE capacity installed per inhabitant: wind, photovoltaic and thermal solar<br />
As mentioned before, till now there are no energy produced by wind, photovoltaic, solar<br />
thermal applications that could affect the energy balance in Syria, what we could say that<br />
about 160000 m 2 of solar water heating collectors are installed in the past period, the energy<br />
produced of them are negligible regarding the total energy demand in Syria.<br />
Assessment of Barriers to EE & RE in Syria<br />
Barriers, which have been largely responsible for the relatively limited development and<br />
acceptance of EE&RE programs, in particular pilot and commercial applications, in Syria may<br />
be grouped into:<br />
Absence of an effective organisation which acts as a driving force with clear responsibility<br />
to develop policy, legislation and regulatory evolution within the Government of Syria;<br />
A heavily subsidised conventional energy carriers, with no special incentives in place to<br />
promote EE&RE investment, resulting in a non-level playing field;<br />
A predominant public sector EE&RE industry, with no particular incentives to respond to<br />
market driven demand on one hand and a nascent emerging private sector industry,<br />
being heavily constrained by regulatory restrictions;<br />
Lack of favourable import duties for EE&RE products and components and well as<br />
conducive policies to promote EE&RE developments;<br />
Unavailability of financial mechanisms and instruments encouraging EE&RE manufacture<br />
or use either through Government banks or private lending organisations to provide credit<br />
to consumers, especially rural applications, or even start-up manufacturing ventures;<br />
Limited activities to create awareness of EE&RE potential or opportunities;<br />
Limited scope for RD&D institutions to interface with international bodies and to share<br />
expertise already existing within the sector;<br />
Syria does have a limited fully skilled and experienced human resource base to support<br />
the integration, service and operation of such technologies and does not have a ready<br />
made training infrastructure to rapidly develop this resource.<br />
This is however a changing and evolving situation. A great deal of work and effort is required<br />
to bring about the adjustment of a framework such that EE&RE investments are viewed with<br />
optimism and represent strong business opportunities. The process of liberalization is clearly<br />
assisting this change, but needs support internally through policy and regulatory measures to<br />
stimulate market opportunities and needs support externally to introduce innovative<br />
methodologies, attractive schemes, investment capital, flexible financial mechanisms and<br />
expertise. Syria has relatively few immediate technological or energy resource barriers. For<br />
the most part, technology solutions for a multitude of applications are readily available within<br />
559
560<br />
ENERGY AND SUSTAINABLE DEVELOPMENT IN THE MEDITERRANEAN<br />
other developing country programs, specifically solutions for rural electrification, water<br />
heating, agricultural processing, wind power generation, micro hydro for motive and electrical<br />
power etc.<br />
The energy resource barriers are likewise not acute for the most part. Levels of solar<br />
radiation exceed 5.4 kWh/m 2 /day on a horizontal plane in much of the country throughout<br />
much of the year, wind resources are favourable for both small scale and wind farm<br />
developments in some locations, hydro resources for micro applications are for the most part<br />
unexplored but likely to be available in the mountainous regions with good precipitation.<br />
Whilst bio-energy reserves are scarce throughout much of the arid and semi arid regions of<br />
the country, urban waste is abundant and offers good opportunity for processing.<br />
Establishing an effective apex body with an appropriate mandate and financial/promotional<br />
institutional bodies are both essential and integral components of this process. Today, a<br />
multitude of learning and operational experience is available both in developing and<br />
industrialized nations. Such experience needs to be rigorously examined by the Apex body<br />
through its working groups of experts, to ascertain which of these experiences can be<br />
effectively adopted in Syria and what adaptations are necessary to apply the selected<br />
experiences. This exercise is an important starting point in the process of further evolving<br />
policy and regulatory mechanisms.<br />
2.5 Existing or expecte d effects and bene f its of RE and R UE<br />
Costs and benefits<br />
Costs<br />
For the energy development plan, cost trends for each of the technologies were projected<br />
over the period covered by the study. The projections were made based on existing global<br />
trends in the respective technologies. The following table gives details about the costs<br />
trends, which have been assumed:<br />
Table 31 Assumptions technologies cost trends<br />
Technology Cost in 2005 Cost in 2011 Trend<br />
PV lighting, professional systems 7 $/Wp 5$/Wp Linear<br />
Hybrid Systems 5$/Wp 3$/Wp Linear<br />
PV Pumping 6$/Wp 4$/Wp Linear<br />
Wind Electric 1000$/kW 800$/kW 1000 to 900 in first five<br />
years<br />
900 to 800 in second<br />
five years<br />
Defrosting wind machines 500$/kW 350$/kW Linear<br />
Solar Thermal Systems 200$/m 2 180$/m 2 Linear<br />
Solar Hot Water Systems 5$/lpd capacity 3$/lpd Linear<br />
Small and Micro Hydro 800$/kW 700$/kW Linear<br />
Biogas Digester 1500$/m 3 1800$/m 3 Constant for first 3,<br />
then linear increase<br />
Solid Waste to energy 800$/kW 500$/kW Linear<br />
Efficient lighting 0.35$/W 0.25$/W Linear<br />
Residential high efficiency refrigerators 30$/ft 3 35$/ ft 3 Linear<br />
Building insulation 7$/m 2 5$/m 2 Linear<br />
Efficient widows 100$/m 2 80$/m 2 Linear<br />
For the accompanying measures, costing has been carried out based on the levels of effort<br />
involved in carrying out the assignments/studies, estimates of infrastructure costs (where<br />
physical infrastructure needs to be established or upgraded), salaries, and overheads based<br />
on the current levels in Syria for the operating expenses.
SYRIA - National study<br />
It is assumed that about 88% of the costs of accompanying measures are spent on<br />
institutional development. In the energy developments, RUE accounts for the major share of<br />
40% followed by wind energy, bio energy, solar thermal developments and hybrid systems<br />
with 30, 12, 8 and 6% respectively.<br />
Means<br />
Based on the current trends in development finance to EE&RE, and the past trends of<br />
government, donor and private sector investments in Syrian EE&RE sector, estimates were<br />
made with respect to the financing/contribution possible for the accompanying measures. In<br />
addition to donor trends and past Syrian experience, the current trend in private sector<br />
investments in EE&RE was considered and estimates made on the possible contributions to<br />
the energy developments. Experiences of successful EE&RE developments in Egypt,<br />
Morocco, Tunisia, India and Philippines were studied to model the donor and private sector<br />
participation trends.<br />
In line with these trends, it can be seen from next figure that the majority of the resources of<br />
57% for the study will be leveraged from the government, private sector industry and the<br />
remaining portion contributed by donor assistance.<br />
Figure 4 Resources portions from the government, the private sector industry and the donor assistance<br />
Socio-economics<br />
1) Employment Generation<br />
As a result of the demand for the technical manpower to design, manufacture, integrate,<br />
supply, install, commission, operate and service the EE&RE systems there will be large scale<br />
employment opportunities generated for technicians and engineers. About 6000 technicians<br />
and over 2200 engineers will be required. These employment opportunities are expected to<br />
be generated in existing and future governmental and private sector enterprises and there<br />
will also be a demand to manage these enterprises. This will require financial professionals<br />
involved in financing the developments, marketing personnel who will be involved in<br />
marketing and advertisements and well as managers for manufacturing and assembly units.<br />
So in addition to the technical manpower there will also be a direct need for about 730<br />
managers.<br />
Such large requirements of professionals will place major demands on the Syrian higher<br />
education system for EE&RE engineering and management, for which provision has been<br />
made under the institutional development component of the accompanying measures. There<br />
will be several new courses started and will provide direct employment to about 590<br />
teachers. Apart from the direct requirements for technicians, engineers, managers and<br />
teachers there will also be employment created by the institutional development components,<br />
which will be equal to 168. Therefore, the total number of direct jobs created is 9688. It may<br />
be noted that several indirect jobs will also be created in providing support services to these<br />
new institutions and enterprises, which is not quantified here.<br />
2) Economic Analysis<br />
Detailed economic analysis was carried out for each of the energy technologies, which are<br />
being considered under the study. Since a large number of technologies were being used to<br />
provide heat and power for a variety of applications, no single baseline was found suitable to<br />
561
562<br />
ENERGY AND SUSTAINABLE DEVELOPMENT IN THE MEDITERRANEAN<br />
cover all developments. Therefore five different baselines were used to analyze all energy<br />
system components:<br />
Diesel water heaters were considered as the baseline for technologies involving supply<br />
of hot water such as the domestic and non-domestic solar water heating systems;<br />
Electricity was considered as a baseline for solar thermal technologies for heating and<br />
cooling as well as for industrial process heat;<br />
Butane gas lamps were considered as the baseline for lighting in rural and decentralised<br />
areas, this baseline was used in PV Solar Home Systems for the Bedouins;<br />
Gas based electricity generation and grid extension was used as the baseline in the<br />
analysis of technologies such as wind electric generation, hydro electric, hybrid electric,<br />
solar thermal electric and waste-to energy power plants;<br />
Gasoline generators were used as the baseline for off-grid professional applications of<br />
PV, PV pumping, health and education systems etc.<br />
3. Examples of good practice, case studies<br />
3.1 Case Study 1<br />
Install Hot Water Solar System for IbnAlwaleed Hospital In Homs City<br />
3.1.1 Overview<br />
Following the National Strategies aiming to widespread renewable energy applications,<br />
especially solar hot water systems, the decision had been taken in NERC in cooperation with<br />
Ministry of Health to execute a project to install solar hot water systems in all public hospitals<br />
starting from IbnAlwaleed Hospital in Homs.<br />
A technical committee created to identify the hospital needs of hot water, and the technical<br />
specifications of the system required to cover that need.<br />
The technical committee issuance a Term Of Reference to be announced as a local tender,<br />
this results three offers tow of a private solar systems manufacturers and one of a<br />
governmental manufacturer.<br />
All offers studied technically and financially according the TOR and the decision taken to<br />
choose the governmental manufacturer (Mechanical and Metal Structure Company) for these<br />
reasons:<br />
1) According to test reports asked from the whole offers, the optical efficiency of the<br />
collector of the Mechanical and Metal Structure Company was the best and equals 76%.<br />
2) The company had a good experience to implement central solar water heating projects.<br />
3) The absorber of the collector used from the company is imported from Greece and<br />
painted with selective coating.<br />
4) The financial offer seems reasonable according to other offers.<br />
NERC instructed the company to start installing works in the hospital.<br />
3.1.2 Project Description<br />
The hospital consumption of hot water estimated as 6500 L/day, so the collector area<br />
collected equal to 120 m 2 divided into three groups, each group has a 2200 letter tank<br />
provided with double jacket heat exchanger, and the circuit between collectors and tanks<br />
works with a pump working regarding a deferential controller.<br />
3.1.3 Projects Indicators<br />
Technical Indicators:<br />
Renewable energy delivered (MWh/year): 58.28<br />
Net average GHG reduction (tCO2 /year): 31.37<br />
Solar fraction: 93%
System efficiency: 28%<br />
Specific yield: 462 kWh/m 2 yearly<br />
Financial indicators:<br />
The Project total costs: 32000$<br />
SYRIA - National study<br />
NERC paid for the project 20000$ and the Ministry of Health 12000$.<br />
Project cumulative cash flows according to international energy prices:<br />
Year-to-positive cash flow: 4 years<br />
Internal Recovery Ratio of the project (IRR): 26.7%<br />
Cumulative cash flow: 234000 $<br />
Net present value (NPV): 62000$<br />
Annual life cycle savings: 6400$<br />
The project is in use since the first of 2007.<br />
3.2 Case Study 2<br />
Banias power plant rehabilitation.<br />
3.2.1 Overview<br />
Banias Power <strong>Plan</strong>t Company is located in Banias city at the <strong>Mediterranean</strong> coast; it consists<br />
of four steam turbines (4 x 170 MW) and one gas turbine (35 MW).<br />
The company established into two stages the first was in 1982 and the second in 1989.<br />
Banias power plant rehabilitation project implemented under the framework of SSEECP<br />
financed by the Syrian government, GEF, UNDP and OPEC.<br />
Main Contractor of the project was ABB Utilities GmbH Mannheim, Germany.<br />
3.2.2 Project Description<br />
The Project contained the following:<br />
Rehabilitation of units 1 and 2.<br />
Conversion these two units to work on natural gas in addition to heavy fuel oil.<br />
Installation online Condition Monitoring System (CMS) for the four units.<br />
(CMS) is an online system used as a tool in the hand of operators to optimize the power<br />
plant economical operation and to keep high reliability of equipment.<br />
The main features of the (CMS) system are:<br />
Technical calculations for main parameters and process parts, main process<br />
components and emissions.<br />
Boiler condition oriented advisory for operating the soot blowers.<br />
Advisory system for operating important process conditions.<br />
Installation Maintenance Management System (MMS).<br />
(MMS) contains several functions such as:<br />
<strong>Plan</strong>t Register includes a tree of the power plant (units-systems-equipment-<br />
equipment components).<br />
Preventive Maintenance Activities (all manufacturer maintenance instructions).<br />
Administrate store items (all spare parts registered).<br />
Spare Parts purchase.<br />
563
564<br />
ENERGY AND SUSTAINABLE DEVELOPMENT IN THE MEDITERRANEAN<br />
Follow-up maintenance cost.<br />
Available spare parts.<br />
Equipment documentation.<br />
Throw combination between (CMS) and (MMS) and transferring data from (CMS) to (MMS)<br />
we can provide the basis of Predictive Maintenance which is higher level than Preventive<br />
Maintenance.<br />
The Main Goals of installation of such systems are: Technical, Economical and Environmental.<br />
3.2.3 Projects Indicators<br />
Technical Indicators:<br />
Saving energy (toe/ year): 100000<br />
GHG reduction (tCO2 /year): 300000<br />
Financial indicators:<br />
The Project total costs: 66.6 Million $ , the Syrian government paid 65 million $<br />
for the rehabilitation and the conversion and GEF, UNDP and OPEC 1.8 million $<br />
for (CMS) and (MMS) systems.<br />
Year-to-positive cash flow: 2.5 year<br />
3.3 Case Study 3<br />
Sindianah wind farm.<br />
3.3.1 Overview<br />
In 2003 the Spanish government granted the Syrian government a loan of 7 million euro to<br />
built a wind farm in one of the suitable sites in Syria.<br />
In the end of 2002 the Wind Resource Assessment Project has been started in cooperation<br />
with decon (Deutsche Energie-Consult), the project is aiming at identifying and promoting an<br />
appropriate contribution of wind energy use to the power generation mix in Syria.<br />
The team work chose Sindianah area to built the wind farm.<br />
3.3.2 Site description<br />
The Sindianah site is located some 20 km west of Homs. The surrounding landscape is<br />
characterised by smooth hills of heights up to 700 m height with some villages as well as<br />
scattered farm buildings. The area seems to be mainly used as farmland, no trees or larger<br />
bushes are observed. The surface consists of bare soil or low plants, however, this might<br />
depend on seasons and the agricultural cycles. It is possible that the surface roughness of<br />
the surrounding changes with the seasons.<br />
The selected measurement site is free from all directions without any obstacle to be<br />
considered as having a significant influence on the measurement. There is only one building<br />
about 150 m north to north west of the site, but with a height of about 4 m it is not expected<br />
to influence the measurement. With regards to the wind atlas modelling, the site should be<br />
characterised as slightly complex.<br />
The site is owned by the Homs electricity company, but the exact limitation of the area is not<br />
known.<br />
The position of the Sindianah measurement mast is:<br />
E 265,673 N3844,438 (UTM )<br />
E 36°26.4730' N34°42.9101' (geographic system)<br />
E 377,781 N3844,250 (undefined local Mercator based coordinate system)<br />
Altitude 545 m a.s.l. the monthly average wind speed measured in the site indicated in<br />
the following curve:
[m/s]<br />
12<br />
10<br />
8<br />
6<br />
4<br />
2<br />
0<br />
Technical Indicators:<br />
Grid connection<br />
SYRIA - National study<br />
Figure 5 The monthly average wind speed<br />
Wind speed Sindianah 1<br />
Jan<br />
Feb<br />
Mar<br />
Apr<br />
May<br />
Jun<br />
Total installed capacity 6 MW.<br />
Jul<br />
Month<br />
Aug<br />
Sep<br />
Oct<br />
Nov<br />
Dec<br />
Estimated energy production: 18 million kWh/year.<br />
GHG reduction: 15000 tco2/year<br />
2005 40 m<br />
2006 40 m<br />
2004 10 m<br />
2005 10 m<br />
2006 10 m<br />
A 66 kV line is passing at the south of the project site. The next substation is located at As<br />
Sweri at about 2 km southeast of the Sindianah measurement mast. In this newly<br />
constructed substation cells are already reserved at 20 kV as well as at the 66 kV level. The<br />
grid connection the base case of 6 MW should not pose any problem; however, a more<br />
detailed project study needs to develop the most economic solution.<br />
At the first estimation the grid connection can be efficiently realised as follows:<br />
Each turbine will be equipped with an appropriate LV/20kV transformer station,<br />
either as a turbine integrated or as separated compact station.<br />
All transformers shall be connected to a wind park internal 20 kV feeder, which<br />
shall be underground cable. (In case of the alternative scenario it would 2 main<br />
feeders would be necessary)<br />
Outside the wind park area (at sufficient distance to the turbines) the connection<br />
to the substation is possible via a 20kV overhead line (about 2000 m).<br />
The connection at the station shall be made at the 20 kV level.<br />
The Expected commissioning date: end of 2007<br />
565
566<br />
ENERGY AND SUSTAINABLE DEVELOPMENT IN THE MEDITERRANEAN<br />
4. Proposals for more sustainable energy development<br />
4.1 Sum mary o f unde r expl oi ted RE and RUE<br />
The main actions to improve situation of RE&RUE to be exploited in the next decade could<br />
be illustrated as follows:<br />
1) Issuance energy control laws starting from “Energy Conservation Law”, “Energy<br />
Efficiency Home Appliances Labels and Standards Law” and “Building Thermal<br />
Insulation Code”, and create the suitable mechanisms to apply this laws and their impact<br />
on the General Energy Balance and Primary energy Demand.<br />
2) Establish “National Energy Data Base” directed by specialists in “Demand Side<br />
Managements” and “Integrated Resource <strong>Plan</strong>ning” to monitor the energy demand and<br />
find the optimal solution to face it, using RUE&RE technologies.<br />
3) Execute projects to reduce the electrical grid losses to achieve the international levels<br />
and standards till 2020.<br />
4) Widespread energy saving audits in all sectors by nominate an energy managements<br />
team works in all residential, commercial, industrial and governmental establishments.<br />
5) Develop the institutional framework regarding RUE&RE through making NERC<br />
plenipotentiary in energy evaluation (resources, production, demand) in Syria, with<br />
supervision by the Supreme Energy Committee, and NERC to be responsible to<br />
issuance the “Annual National Energy Report” which indicates the RUE&RE contribution<br />
development in “National Energy Balance” as planned in the five year plan.<br />
6) Obligations of large energy users towards efficient use of energy and tapping the<br />
available Renewable Energy.<br />
7) Obligations of major energy equipment manufacturers and distributors towards<br />
equipment efficiency.<br />
8) Obligations of building designers, developers and operators towards the adoption of<br />
Energy Efficiency and Renewable Energy in new and retrofitted buildings.<br />
9) Obligations of large energy users and power suppliers towards energy conversion and<br />
use of Renewable Energy including Combined Heat & Power generation.<br />
10) Role of local Energy Service Companies (ESCOs).<br />
11) Government incentives for stimulating the Energy Efficiency and Renewable Energy<br />
market in the country.<br />
12) Creation and operation of a Green Fund Account.<br />
13) Procedures for the EE & RE Regulation enforcement.<br />
In case of executing the mentioned actions, the national experts estimate that the ratio of<br />
RUE&RE contribution in energy demand reduction will be in 2020 as the following table:<br />
Table 32 Estimate ratio of RUE&RE contribution in energy demand reduction in 2020<br />
Activity Ratio<br />
Energy Efficient Building 2,5%<br />
Efficient Home Appliances 2%<br />
Electrical Grid Efficiency Improvement 2%<br />
Renewable Energy (including hydro) 7,5%<br />
Energy Auditing 2%<br />
Total 16 %<br />
This scenario is a mid scenario, because it didn’t take into account the gas contribution in<br />
operating power plants.<br />
This ratio of reduction will cause:<br />
1) Reduction about 18 million TCO2 in 2020.<br />
2) Create about 10000 job opportunities in many fields.<br />
3) Reduction in energy investments by executing RUE applications (each 1% reduction in<br />
energy demand by RUE costs ¼ of energy generating investments costs).<br />
4) Improve the socio-economic situation.
SYRIA - National study<br />
5) Decrease the extremely high-energy intensity to be closer to the global levels.<br />
The estimated energy demand in 2020 is about 45 Million TOE so 16% of the total demand<br />
equals 7.2 Million TOE which main a financial savings about 2,6 Billion $ in current energy<br />
prices.<br />
4.2 Proposal for a sustainable energy d e ve l o pme n t<br />
4.2.1 Objectives<br />
The energy statistical calculations in Syria shows that energy situation could face difficulties<br />
regarding decreasing oil reserve and production expected in the next decade, this main issue<br />
directed the recent strategies to avoid these conditions and to achieve the following<br />
objectives:<br />
Energy demand reduction and increase the availability of the existing resources<br />
as much as possible.<br />
Generalize energy efficiency and renewable energy concepts in all sectors.<br />
Increase public awareness regarding energy efficiency and renewable energy<br />
applications.<br />
Greenhouse gases emissions reduction and environment protection.<br />
Achieve sustainable development requirements.<br />
Table 33 Details on the main sectors for which specific targets would be defined, in terms of RE&RUE<br />
No Energy System/Technology 2003 2004 2005 2007 2008 2010 2015 2020<br />
1<br />
3<br />
4<br />
5<br />
6<br />
7<br />
Solar Thermal Space Heating and<br />
cooling Systems (Collector area in<br />
m 2 )<br />
Solar Hot Water Systems<br />
(Collector area in m 2 )<br />
Solar dryers for agriculture (Collector<br />
area in m 2 )<br />
Industrial Process Heat through<br />
Solar Thermal (Collector area in m 2 )<br />
PV Village electrification systems<br />
(kWp)<br />
Solar Electrification for Bedouins<br />
(kWp)<br />
5,000 15,000 35,000<br />
160000 180000 280000 480,000 1,500,000 3,000,000<br />
1000 3000 8000 13000<br />
25,000 75,000 325,000 550,000<br />
120 200 1000 2500<br />
8 12 24 48 68 80 150<br />
8 PV Pumping Systems (kWp) 105 210 392 410<br />
11 Wind electric generation (MW) 6 140 500 1000<br />
12 Wind pumps (no of systems) 15 20 25 35 55<br />
14 Hydro power (MW) 1526 1526 2500 2500<br />
15 Hybrid Systems (kW) 30000 30000<br />
17 Biogas systems (m3 of digester<br />
volume)<br />
12000 20000 37000 52000<br />
19 Urban waste to energy plants (MW) 10 25<br />
20 Thermal insulation (buildings) 50,000 150,000 400,000 650,000<br />
21 Energy efficiency refrigerators (set) 25,000 100,000 500,000 1,000,000<br />
22<br />
23<br />
Energy efficiency air-conditioner<br />
(set)<br />
Energy efficiency washing<br />
machine(set)<br />
10,000 50,000 100,000<br />
25,000 200,000 600,000<br />
24 Energy auditing(TOE) 31,000 100,000 500,000 1,500,000 2,500,000<br />
25<br />
Power factor correction<br />
(MVAR)<br />
1400 5000<br />
567
4.2.2 Main tools<br />
568<br />
ENERGY AND SUSTAINABLE DEVELOPMENT IN THE MEDITERRANEAN<br />
Most of the main tools that would need to be implemented to overcome identified obstacles,<br />
in order to attain the proposed objectives, are as follow:<br />
1) Regarding prices policies: the government is going to raise energy prices for the end<br />
users by reducing the subsidies especially for diesel fuel and electricity, this step needed<br />
to be studied carefully with talking into account the per capita income which till now<br />
couldn’t take the new prices suggested in State <strong>Plan</strong>ning Commission, the decision have<br />
been taken since the first of 2006 to be executed gradually, but it has been not executed<br />
yet because of economical considerations, to overcome this barrier, procedures should<br />
be implemented to increase the citizens ability to face the new energy prices.<br />
2) Regarding raising public awareness: Energy associations and organizations should<br />
shoulder implementing awareness campaigns through TV, radio, newspapers, street<br />
media and brochures. Each of these organizations should reserve in their financial plan<br />
a special budget for awareness campaigns, with talking into account that RE&RUE<br />
public applications couldn’t succeed without this procedure;<br />
Advertisement and Publicity Campaigns will involve development of sector specific<br />
advertisement and publicity campaigns through the print and electronic media 23 . The<br />
activity will involve design of media campaigns by a local media agency based on the<br />
feedback from the market studies. These campaigns will then be implemented through<br />
the appropriate media.<br />
3) Regarding training programmes: Include training programme on RE&RUE planning for<br />
the Ministry of Electricity and NERC planners including exposure to developing country<br />
policy experience through visits. Entrepreneurship Training Programmes to be<br />
conducted for prospective entrepreneurs and private sector in small business<br />
management. Also required are training programmes for NGOs and grass-roots level<br />
organisations on renewable energy technologies and service delivery mechanisms.<br />
4) Regarding green certificates, white certificates:<br />
As we mentioned before, Syria through DNA could achieve CDM projects and inter the<br />
green certificates and white certificates markets in the next few years through<br />
implementing RE&RUE measures.<br />
4.2.3 Costs and Benefits<br />
The total cost of implementing the study components would amount to $3 billion. About 98%<br />
of the resources are required for the energy development plan and the rest for accompanying<br />
measures plan. Institutional developments account.<br />
Based on the international trends in donor assistance and private sector developments and<br />
considering the past and the recent involvement by Syrian government and private sector in<br />
RUE&RE,<br />
There will be a total of about 10000 jobs created for technicians, engineers, and teachers<br />
apart from 168 jobs created in institutions established/upgraded under the accompanying<br />
measures plan. For every government job created 10 jobs will be created in the private<br />
sector. There will also be reduction of 2,604,200 tones/year of CO2, 32,400 tones/year of<br />
SOx, 17,200 tones/year of NOx and 26,300 tones/year of CO in the year 2015. The avoided<br />
societal costs of these emissions annually are quantified at over $351.33 million in the year<br />
2015.<br />
Detailed economic analysis was carried out for each of the energy systems, which are being<br />
considered under energy development plan with an appropriate conventional baseline. The<br />
conventional baselines considered were gas based electricity generation, diesel heaters,<br />
gasoline generators, and butane gas lamps.<br />
4.2.4 Proposed Indicators<br />
1) Share of private sectors in RE&RUE investments (%)<br />
2) Energy demand reduction caused by applies EE&RE measures (TOE).<br />
23 Radio and Television
SYRIA - National study<br />
3) The period that the national oil reserve could cover the energy demand (years).<br />
4) Grid losses reduction (MWH).<br />
5) Energy carriers demand in sectors by each type(TOE)<br />
6) Identify the national benchmark for each sector comparing with the international one<br />
(TOE/unit).<br />
7) Number of employee and workers involved in RUE&RE fields (employee).<br />
8) Number of efficient appliances sold annually (set/year).<br />
9) Energy production investments saved by implementing RUE&RE applications (million $).<br />
10) Share of the income of white and green certificates on GDP (%).<br />
569
5. List of illustrations<br />
570<br />
ENERGY AND SUSTAINABLE DEVELOPMENT IN THE MEDITERRANEAN<br />
Figure 1 Share of different renewable energy technologies ......................................................................................................... 528<br />
Figure 2 Electricity demand by sector in 2005: ........................................................................................................................... 532<br />
Figure 3 Loss value from 1998-2005:........................................................................................................................................ 557<br />
Figure 4 Resources portions from the government, the private sector industry and the donor assistance ...................................... 561<br />
Figure 5 The monthly average wind speed .................................................................................................................................. 565<br />
Table 1 Basic data on the economic structure of Syria ................................................................................................................ 517<br />
Table 2 Energy shares in export and import (absolute value and percentage of the total) per type of energy (oil, gas, coal,<br />
electricity, other) ............................................................................................................................................................. 518<br />
Table 3 Employment in the energy sector (absolute value, percentage of the total) ...................................................................... 520<br />
Table 4Relative importance of the energy sector within the State budget .................................................................................... 520<br />
Table 5 Investment in the energy sector ..................................................................................................................................... 521<br />
Table 6 Infrastructures: number of refineries, power stations, length of the electricity network… .................................................. 521<br />
Table 7 Organization structure of the Syrian energy sector .......................................................................................................... 522<br />
Table 8 Nominal & Actual capacity of power plants in Syrian power system by turbine type & subsidiary at the end of<br />
2006 .............................................................................................................................................................................. 523<br />
Table 9 Main key figures of Syrian Power System ....................................................................................................................... 525<br />
Table 10 Main indicators of oil and gas sector in 2005 .............................................................................................................. 527<br />
Table 11 Energy Balance in Syria (million TOE) ........................................................................................................................... 529<br />
Table 12 Primary energy future demand (Million toe) ................................................................................................................. 529<br />
Table 13 Distribution of gross electricity generation in Syrian power system by fuel sources & turbine: ........................................ 529<br />
Table 14 Peak load demand & minimum load in Syrian power system: ....................................................................................... 530<br />
Table 15 Distribution of electricity generation by Facilities: ........................................................................................................ 530<br />
Table 16 Electricity future demand & needed fuel for electricity sector by fuel type: .................................................................... 530<br />
Table 17 Electricity tariff effective between 1988-2005 (S.Piaster/kWh) .................................................................................... 531<br />
Table 18 Electricity Consumption & losses - Distribution by voltage level & consumption categories (GWh) ................................. 531<br />
Table 19 Distribution of Primary Energy Demand in Syria By Fuel & Sector for year 2005: ........................................................... 532<br />
Table 20 Overview about National Ambient Air Quality Standards ............................................................................................... 534<br />
Table 21 Maximum permitted limits for air pollutants near effluence sources ............................................................................. 535<br />
Table 22 The limitation of the noise in production areas ............................................................................................................. 536<br />
Table 23 The maximum limit of noise admissible ....................................................................................................................... 536<br />
Table 24 R&D associations still focusing in RE .......................................................................................................................... 546<br />
Table 25 Production of Domestic Waste in Syrian Cities (1998) .................................................................................................. 549<br />
Table 26 The prices of energy carrier .......................................................................................................................................... 554<br />
Table 27 Electricity Tariff Effective Since 1/6/2002 (US$/KWh) ................................................................................................ 554<br />
Table 28 Energy demand till 2020 at the same grid loss growth ratio .......................................................................................... 558<br />
Table 29 Energy demand till 2020 where the grid loss will be 10% ............................................................................................. 558<br />
Table 30 The share of renewable energy in the total energy produced in Syria ............................................................................. 559<br />
Table 31 Assumptions technologies cost trends ......................................................................................................................... 560<br />
Table 32 Estimate ratio of RUE&RE contribution in energy demand reduction in 2020 ................................................................ 566<br />
Table 33 Details on the main sectors for which specific targets would be defined, in terms of RE&RUE ........................................ 567
TURKEY<br />
By Pr Ahmet Koyun, Termodinamik Anabilim Dal, Yildiz Teknik Universitesi<br />
TABLE OF CONTENTS<br />
I. Summary ........................................................................................................................ 573<br />
1. Challenges and energy sustainability.................................................................................................... 573<br />
2. The currently established policies in terms of RE and RUE ............................................................... 575<br />
3. Difficulties, possible solutions, needed reforms ................................................................................. 577<br />
II. Résumé ......................................................................................................................... 579<br />
1. Défis et durabilité énergétique............................................................................................................... 579<br />
2. Les politiques d’ER et d’URE actuellement en place .......................................................................... 582<br />
3. Blocages, solutions possibles, réformes nécessaires ........................................................................ 583<br />
III. National Study ............................................................................................................. 585<br />
1. The Country’s Energy Situation .............................................................................................................. 585<br />
2. Rational Energy Use and Renewable Energies .................................................................................... 616<br />
3. Examples of good practice case studies .............................................................................................. 630<br />
4. Proposals for more sustainable energy development ........................................................................ 646<br />
5. Annexes to be attached to the Study .................................................................................................... 648<br />
6. References ................................................................................................................................................ 672<br />
7. Table of illustrations ................................................................................................................................ 678
I. SUMMARY<br />
TURKEY - Summary<br />
1. Challenges and energy sustainability<br />
Turkey is an energy importing country; more than half of the energy requirement has been<br />
supplied by imports. Due to the diversification efforts of energy sources, use of natural gas<br />
that was newly introduced into Turkish economy, has been growing rapidly. On the other<br />
hand, Turkey, with its young population and growing energy demand per person, its fast<br />
growing urbanization, and its economic development, has been one of the fast growing<br />
power markets of the world for the last two decades. Oil has the biggest share in total<br />
primary energy consumption. But it is expected that natural gas consumption will be higher<br />
than oil in future. Table 1 depicts the historical and projected relationship between<br />
population, economic output and energy demand.<br />
Years Population<br />
GNP/capita Total GNP<br />
(000s)<br />
Table 1 Population, economy and energy<br />
Total energy Energy/capita Energy<br />
demand (Mtoe) (Kep) intensity<br />
1973 38,072 1994 75,915,568 24.6 646 81<br />
1990 56,098 2674 150,006,052 53.7 957 50<br />
1995 62,171 2861 177,871,231 64.6 1,039 44<br />
2000 67,618 3303 223,342,254 82.6 1,218 40<br />
2010 78,459 5366 421,010,994 153.9 1,962 35<br />
2020 87,759 9261 812,736,099 282.2 3,216 33<br />
Table 2 The amount of fossil energy resources in Turkey<br />
Sources Apparent Probable Possible Total<br />
Hard coal (million tons) 428 449 249 1126<br />
Lignite (million tons) 7339 626 110 8075<br />
Asphalite (million tons) 45 29 8 82<br />
Bituminous schist (million tons) 555 1086 269 1641<br />
Oil (million tons) 36 36<br />
Natural gas (billion m 3 ) 8,8 8<br />
The main energy resources of Turkey are hard coal, lignite, asphaltite, petroleum, natural<br />
gas, hydroelectric energy, and geothermal energy. Table 2 shows the amount of fossil<br />
energy resources in Turkey.<br />
Turkey‟s renewable energy sources are plentiful and extensive and represent the secondlargest<br />
domestic energy source after coal. Primary renewable energy resources in Turkey<br />
are: hydro, biomass, wind, biogas, geothermal and solar (Table 3).<br />
Similar to other industrializing countries, with the increases in energy consumption and<br />
economical growth, energy related environmental problems are rapidly growing in Turkey. In<br />
2003, it is estimated that 36 % of CO2 emissions occurred due to energy, 34 % due to<br />
industry, 15 % due to transportation and 14 % due to other sectors such as housing,<br />
agriculture and forestry and in 2020 40 % will occur due to energy, 35 % due to industry, 14<br />
% due to transportation and 11 % due to other sectors. To control these problems for<br />
sustainable development, energy related policy should be well determined.<br />
573
574<br />
ENERGY AND SUSTAINABLE DEVELOPMENT IN THE MEDITERRANEAN<br />
Table 3 Turkey’s renewable energy potential<br />
Energy type Usage purpose Natural<br />
capacity<br />
Solar energy Electric (billion Kwh<br />
Thermal (mtoe)<br />
977.000<br />
80.000<br />
Technical Economical<br />
6.105<br />
500<br />
Hydro power Electric (billion kWh) 430 215 124.5<br />
Wind Direct energy (land) Electric (billion kWh) 400 110 50<br />
Direct energy (off shore) Electric (billion kWh)<br />
180<br />
Wave energy<br />
(billion kWh)<br />
150 18<br />
Geothermal energy Electric (10 9 Kwh)<br />
1,4<br />
Thermal (mtoe) 31.500 7.500 2.843<br />
Biomass energy Total (mtoe) 120 50 32<br />
In Turkey, electricity is produced by thermal power plants (TPPs), consuming coal, lignite,<br />
natural gas, fuel oil and geothermal energy, and hydropower plants (HPPs) (Table 4). The<br />
development of nuclear power in Turkey is so new. Present and future total final energy<br />
production and consumption in Turkey are shown in Table 5 and Table 6, respectively.<br />
Long term planning studies indicate a heavy burden of investments between 1996 to 2010,<br />
amounting to some 68 billion US$. Turkey‟s funding needs for the energy sector is the<br />
highest of the southern and eastern <strong>Mediterranean</strong> countries. The needs of each energy<br />
sector are:<br />
Electricity: 56 billion US$ (82%),<br />
Gas: 6 billion US$ (9%),<br />
Oil: 4 billion US$ (6%),<br />
Solid fuels: 1 billion US$ (1%).<br />
In 1996, 5.9 billion US$ were invested in the Turkish economy, 24% of which were in the<br />
energy sector.<br />
Table 4 Electricity production from thermal and hydropower sources according to years in Turkey<br />
Year Thermal<br />
(GWh)<br />
Hydropower<br />
(GWh)<br />
Total<br />
(GWh)<br />
305<br />
25<br />
% of hydropower<br />
1950 759 30 789 3.80<br />
1960 1814 1001 2815 35.55<br />
1970 5590 3033 8623 35.17<br />
1980 11,927 11,348 23,275 48,75<br />
1990 34,395 23,148 57,543 40,22<br />
1995 50,621 35,541 86,153 41,25<br />
1999 81,661 34,678 116,339 29,81<br />
2000 93,934 30,879 124,813 24,74<br />
2001 98,563 24,010 122,573 19,60<br />
2002 71,966 44,034 116,000 38,00<br />
2003 a 104,898 35,324 140,283 25.18
TURKEY - Summary<br />
Table 5 Present and future total final energy production in Turkey (mtoe)<br />
Energy sources 1990 2000 2005 2010 2020 2030<br />
Coal and lignite 12.41 13.29 20.69 26.15 32.36 35.13<br />
Oil 3.61 2.73 1.66 1.13 0.49 0.17<br />
Gas 0.18 0.53 0.16 0.17 0.14 0.10<br />
Com. renewable and 7.21 6.56 5.33 4.42 3.93 3.75<br />
wastes a<br />
Nuclear 7.30 14.60<br />
Hydropower 1.99 2.66 4.16 5.34 10.00 10.00<br />
Geothermal 0.43 0.68 0.70 0.98 1.71 3.64<br />
Solar/wind/other 0.03 0.27 0.22 1.05 2.27 4.28<br />
Total production 25.86 26.71 34.12 39.22 58.20 71.68<br />
a Comprises solid biomass, biogas, industrial waste and municipal waste<br />
Table 6 Present and future total final energy consumption in Turkey (mtoe)<br />
Energy sources 1990 2000 2005 2010 2020 2030<br />
Coal and lignite 16.94 23.32 35.46 39.70 107.57 198.34<br />
Oil 23.61 31.08 40.01 51.17 71.89 102.38<br />
Gas 2.86 12.63 42.21 49.58 74.51 126.25<br />
Com. renewable and 7.21 6.56 5.33 4.42 3.93 3.75<br />
wastes a<br />
Nuclear 7.30 14.60<br />
Hydropower 1.99 2.66 4.16 5.34 10.00 10.00<br />
Geothermal 0.43 0.68 1.89 0.97 1.71 3.64<br />
Solar/wind/other 0.03 0.27 0.22 1.05 2.27 4.28<br />
Total primary energy<br />
consumption<br />
53.01 77.49 129.63 152.22 279.18 463.24<br />
a Comprises solid biomass, biogas, industrial waste and municipal waste<br />
The total investment required for power plants and distribution lines up to 2010 is expected to<br />
be around 45 billion US$, 19 billion of which will be under the build-operate-transfer (BOT)<br />
and build-own-operate (BOO) models. The huge size of this investment makes it impossible<br />
to lay the burden entirely on public finances. Private capital has to be introduced into<br />
Turkey‟s electricity sector to meet these requirements.<br />
Cogeneration, or autoproduction, is known as Combined Heat and Power (CHP), which has<br />
been developed by governmental support to support the continuing need for additional<br />
electricity generation.<br />
Turkey spent a total of US$ 120 million (2005 prices and exchange rates) on government<br />
energy R&D between 1980 and 2005. In this period, 15.6% of its total energy research and<br />
development (R&D) budget (US$ 17.4 million) was allocated to renewable energy.<br />
Among the renewable technologies, geothermal received the most sustained funding over<br />
the past two decades and the highest level of funding, equivalent to US$6.1 million or 37% of<br />
the renewables R&D expenditures between 1980 and 2005. In addition, Turkey participates<br />
in international collaborative R&D in Photovoltaic Power Systems through the IEA<br />
Implementing Agreements.<br />
2. The currently established policies in terms of RE and RUE<br />
2.1 Renew able energy<br />
The real beginning for renewable energy policy was the definition of renewable energy<br />
sources in the decree of the Modification of the License Regulation in the Electricity Market in<br />
2003. Before then, there was no national renewable energy policy and few government<br />
incentives existed to promote market deployment of renewable energy. However, the<br />
Electricity Market Licensing Regulation, in itself, is not expected to be sufficient to overcome<br />
575
576<br />
ENERGY AND SUSTAINABLE DEVELOPMENT IN THE MEDITERRANEAN<br />
the high investment cost, risk and lack of security associated with the entrance of renewable<br />
power plants into the electricity market.<br />
The industrial sector accounted for 40% of total final energy consumption and for 54% of<br />
electricity consumption in 2000, while the agriculture, household and services sectors<br />
together accounted for 40% of final energy consumption and 46% of electricity consumption.<br />
Although all four sectors have important potential for energy conservation, industry has been<br />
targeted as a priority area for energy conservation programmes owing to the projected rapid<br />
expansion of industrial energy demand. On the other hand, the structure of industry in Turkey<br />
is energy intensive.<br />
2.2 Energy e f ficiency<br />
In Turkey, the per capita energy consumption (measured as TPES/population) in 1998 was<br />
equal to 1.11 ton of oil equivalent (toe), much less than the average of 5.10 toe for all IEA<br />
countries, but its growth is much faster than the IEA average and is projected to remain fast<br />
in the coming two decades as the economy develops. Energy intensity (measured as<br />
toe/$1000 GDP at 1990 prices and exchange rates) in 1998 was 0.35 toe, compared with an<br />
IEA average of 0.24 toe, and has increased slowly in recent years. If purchasing power<br />
parities are used, Turkey‟s energy intensity fell well below the IEA average. On the other<br />
hand, the government acknowledges the need to reduce the energy intensity of GDP and to<br />
improve the energy efficiency of the economy. Figure 1 shows mean heating energy and<br />
exergy efficiencies of the industrial sector and its subsectors in 2003 and Figure 2 shows<br />
energy and exergy utilization efficiencies in the Turkish residential–commercial sector for<br />
2002.<br />
Figure 1 Mean heating energy and exergy efficiencies of the industrial sector and its subsectors in 2003
TURKEY - Summary<br />
Figure 2 Energy and exergy utilization efficiencies in the Turkish residential–commercial sector for<br />
2002<br />
According to estimates of the MENR, Turkey has an energy conservation potential equal to<br />
12–14 mtoe/year, or nearly 15–20% of total consumption in 1998, and therefore, $3 billion<br />
could be saved through conservation measures in three main end-use sectors.<br />
3. Difficulties, possible solutions, needed reforms<br />
3.1 The main barriers for de ve lopment re new able energy a re<br />
lack of financial resources and proper lending facilities, particularly for small-scale projects<br />
constitute,<br />
lack of detailed renewable energy resource assessments and data banks pertains to<br />
Turkey like to many other countries.<br />
But, lack of awareness and knowledge is not a big barrier in Turkey. Renewable energy is<br />
recognized as a major potential for indigenous, clean energy production.<br />
The most important handicap for foreign investors is Turkish bureaucracy. The permission for<br />
a foreign investor can be taken through one-year period with applying numerous different<br />
associations. New government had promised to make the permission producer easier.<br />
Hydroelectric generation, biomass combustion, solar energy for agricultural grain drying and<br />
hot water heating, and geothermal energy have been in use in the country for many years.<br />
Domestic water heating is the primary active solar technology. In Turkey, approximately<br />
30,000 solar water heating systems have been installed since the 1980s. This is a minute<br />
fraction of the total potential. About 50% of existing dwellings could be fitted effectively with a<br />
solar water heater. If this potential were extended to 2025, the deployment of approximately<br />
5 million systems (allowing for a rise in the Turkish housing stock) would be required. This<br />
could save an estimated 30 PJ (9.0 TWh) per year of oil, coal and gas and 2.0 TWh per year<br />
of electricity, giving a saving of 5.0 million tonnes of CO2 per year, or just under 1% of current<br />
Turkey CO2 production.<br />
Agricultural residues have a high potential to take the place of the lignite (40 million tons) and<br />
hard coal (1.3 million tons) used in electricity production.<br />
Biogas systems are considered to be strong alternatives to the traditional space heating<br />
systems (stoves) in rural Turkey. Geothermal heat pumps are a relatively new application of<br />
geothermal energy that has grown rapidly in recent years. On the other hand, the biggest<br />
benefit of geothermal heat pumps is that they use 25-50% less electricity than conventional<br />
heating or cooling systems. Geothermal heat pumps can also reduce energy consumption,<br />
and corresponding air pollution emissions, up to 44% compared to air source heat pumps<br />
577
578<br />
ENERGY AND SUSTAINABLE DEVELOPMENT IN THE MEDITERRANEAN<br />
and up to 72% compared to electric resistance heating with standard air conditioning<br />
equipment.<br />
3.2 Success sto r y<br />
Turkey is among the first five leader countries in its geothermal direct use applications. In<br />
Turkey, the district heating system applications were started with large scale, city based<br />
geothermal district heating systems. The investigations on geothermal energy in the country<br />
gained speed in the 1970s. However, the utilization of geothermal energy could not become<br />
widespread sufficiently due to scaling problems up to the early 1980s. Since then, important<br />
developments have been recorded in geothermal energy utilization. Recently, geothermal<br />
direct use applications have reached up to 52,000 residences equivalence of geothermal<br />
heating, and engineering design of nearly 300,000 residences equivalence geothermal<br />
district heating has been completed.<br />
Parallel to the development of geothermal energy utilization in Turkey, it is projected that by<br />
the years 2010 and 2020, the total installed capacity will increase to 3500 MWt (500,000<br />
residences equivalent, which is about 30% of the total residences in the country) and 8300<br />
MWt (1,250,000 residences equivalent) for space heating and to 500 MWe and 1000 MWe<br />
for power production, respectively.<br />
The investment cost for geothermal district heating systems per residence with a floor area of<br />
100 m2 is about 1500–2500 US$ (excluding heater costs in the residence), while the<br />
payback period varies between 5 and 8 years. About 30–50% of the investment costs has<br />
been paid by consumers as a connection subscription fee, like a capital investment. The<br />
heating fees (2001 heating season) were in the range of 14–29 US$.<br />
3.3 Needed re fo rms<br />
Turkey can not perform a clear strategy concerning the renewable energy sources because<br />
of energy costs and investment costs. The State encouraged the private sector for natural<br />
gas combined circuit plants and guaranteed to buy the generated electricity with a low cost<br />
and with special conditions. State performed the strategy of build, operate and transfer (BOT)<br />
system and succeeded it. The share of the natural gas combined circuit plants increased to<br />
20% in total primary energy supply. The state achieved the sustainability in this wise.<br />
Turkey is interested in renewable energy resources and gives effort to provide the<br />
sustainability of using these energy resources. The state encouraged the municipalities in<br />
respect of the geothermal energy and gave them the permission to behave self-governing.<br />
In Turkey, the efficiency of energy utilization is not as high as Europe yet.<br />
The state leads the private sector to the World Bank‟s credit in all sources of renewable<br />
energy. The State says that it will be the guarantor for the 30-40% of the cost of the private<br />
sector‟s investments which are for their own needs. If the private sector can find buyer, it can<br />
sell the electricity produced in these plants.<br />
The cost of 1 kilowatt (kW) power from a renewable energy resource is 13-15 cent. If the<br />
State buys for example 10% of the generated energy by private sector for this cost, the State<br />
will gain from that too in future.<br />
It is so recently that less energy consuming building projections have taken place. Ground<br />
sourced heating and passive heating systems are not common either.<br />
For a sustainable development of renewable energy resources and settling to the<br />
<strong>Mediterranean</strong> strategy, ground sourced and water sourced heat pump systems, wind and<br />
solar energy power plants have to be kept unobstructed always. The renewable energy<br />
technologies and the energy quantities which are necessary for production per unit have to<br />
be kept always in the journal and policy of the country. Legal regulations have to be<br />
performed and the State has to give effort to make the public assimilate these regulations<br />
highly.
II. RESUME<br />
1. Défis et durabilité énergétique<br />
TURKEY - Résumé<br />
La Turquie affiche une forte dépendance aux importations qui couvrent plus de la moitié de<br />
ses besoins énergétiques. Dans le cadre des efforts de diversification des sources d‟énergie,<br />
l‟exploitation du gaz naturel a été nouvellement introduite et connaît un essor rapide. Depuis<br />
20 ans, la Turquie, où la population est jeune et la demande en énergie par habitant<br />
croissante, où l‟urbanisation et le développement économique sont en expansion, est l‟un<br />
des marchés électriques en plus forte croissance dans le monde. Le pétrole couvre<br />
aujourd‟hui la part la plus importante du total des consommations en énergie primaire, mais<br />
le gaz naturel devrait prendre une part plus importante que lui à l‟avenir. Le tableau 1<br />
explique les relations historiques et futures entre la population, le rendement économique et<br />
la demande en énergie.<br />
Années Population<br />
(000s)<br />
Tableau 1 Population, économie et énergie<br />
PIB/habitant PIB Total<br />
Demande totale<br />
d’Énergie<br />
(Mtep)<br />
Énergie/hab.<br />
(Ktep)<br />
Intensité<br />
Énergétique<br />
1973 38 072 1994 75,915,568 24.6 646 81<br />
1990 56 098 2674 150,006,052 53.7 957 50<br />
1995 62 171 2861 177,871,231 64.6 1,039 44<br />
2000 67 618 3303 223,342,254 82.6 1,218 40<br />
2010 78 459 5366 421,010,994 153.9 1,962 35<br />
2020 87 759 9261 812,736,099 282.2 3,216 33<br />
Tableau 2 Ressources en combustibles fossiles en Turquie<br />
Sources Apparentes Probables Possibles Total<br />
Houille (million de tonnes) 428 449 249 1126<br />
Lignite (million de tonnes 7339 626 110 8075<br />
Asphalite (million de tonnes) 45 29 8 82<br />
Schiste bitumineux (million de 555 1086 269 1641<br />
tonnes<br />
Pétrole (million tons) 36 36<br />
Gaz naturel (billion m 3 ) 8,8 8<br />
Les ressources énergétiques principales en Turquie sont le charbon, le lignite, l‟asphaltite, le<br />
pétrole, le gaz naturel et l‟énergie hydroélectrique et géothermique. Les ressources de la<br />
Turquie en énergies fossiles sont présentées dans le tableau 2.<br />
Les énergies renouvelables (ER) sont en quantité significative et durable et représentent le<br />
potentiel énergétique le plus important après le charbon. Les sources d‟énergies<br />
renouvelables primaires comprennent l‟hydroénergie, la biomasse, l‟éolienne, le biogaz, la<br />
géothermie et le solaire (Tableau 3).<br />
Comme dans tous les pays en voie d‟industrialisation, et sous la pression de la<br />
consommation énergétique et de la croissance économique, les problématiques<br />
environnementales sont de plus en plus nombreuses en Turquie. Selon les estimations de<br />
2003, le secteur énergétique était responsable de 36% des émissions de CO2, l‟industrie de<br />
34%, les transports de 15% et les autres secteurs, tels que le résidentiel, l‟agriculture et la<br />
sylviculture, de 14%. D‟ici 2020, le secteur énergétique devrait représenter 40% des<br />
émissions, l‟industrie 35%, les transports 14% et les autres secteurs 11%. Pour maîtriser ces<br />
problèmes de développement durable, la politique énergétique devrait être forte.<br />
579
Énergie solaire<br />
580<br />
ENERGY AND SUSTAINABLE DEVELOPMENT IN THE MEDITERRANEAN<br />
Tableau 3 Potentiel en énergies renouvelables de la Turquie<br />
Type d’énergie Utilisation Capacité<br />
Électrique (billion<br />
Kwh<br />
Thermique (mtoe)<br />
naturelle<br />
977.000<br />
80.000<br />
Technique Économique<br />
6.105<br />
500<br />
Hydraulique Électrique (billion<br />
kWh)<br />
430 215 124.5<br />
Eolien énergie directe (terre) Électrique (billion<br />
kWh)<br />
400<br />
110 50<br />
énergie directe (off shore) Électrique (billion<br />
kWh)<br />
180<br />
énergie houlomotrice Électrique (billion<br />
kWh)<br />
150<br />
18<br />
Énergie géothermique lectric (10 9 Kwh)<br />
1,4<br />
Thermal (mtoe) 31.500 7.500 2.843<br />
Biomasse Total (mtoe) 120 50 32<br />
En Turquie, l‟électricité est produite par des centrales thermiques fonctionnant au charbon,<br />
au lignite, au gaz naturel, au fuel et à l‟énergie géothermique, et par des centrales<br />
hydroélectriques (Tableau 4). Le développement de l‟énergie nucléaire est très récent. La<br />
production et la consommation énergétiques totales finales actuelles et futures sont<br />
présentées dans les tableaux 5 et 6.<br />
Selon les prévisions à long terme, sur la période 1996 à 2010, de lourds investissements<br />
sont nécessaires, à hauteur d‟environ US$ Md 68, pour couvrir les besoins de financement<br />
du secteur de l‟énergie en Turquie, qui figurent parmi les plus élevés de tous les pays des<br />
rives sud et est de la Méditerranée. Ces besoins se décomposent de la manière suivante :<br />
Électricité : US$ 56 Md (82%),<br />
Gaz : US$ 6 Md (9%),<br />
Produits pétroliers : US$ 4 Md (6%),<br />
Combustibles solides : US$ 1 Md (1%).<br />
En 1996, l‟économie de la Turquie avait bénéficié d‟un investissement de US$ Md 5.9, dont<br />
24% pour le secteur énergétique.<br />
Tableau 4 Production annuelle d’électricité en Turquie par sources thermiques et hydroélectriques<br />
Année Thermique<br />
(GWh)<br />
Hydraulique<br />
(GWh)<br />
Total<br />
(GWh)<br />
305<br />
25<br />
% d’hydraulique<br />
1950 759 30 789 3.80<br />
1960 1814 1001 2815 35.55<br />
1970 5590 3033 8623 35.17<br />
1980 11,927 11,348 23,275 48,75<br />
1990 34,395 23,148 57,543 40,22<br />
1995 50,621 35,541 86,153 41,25<br />
1999 81,661 34,678 116,339 29,81<br />
2000 93,934 30,879 124,813 24,74<br />
2001 98,563 24,010 122,573 19,60<br />
2002 71,966 44,034 116,000 38,00<br />
2003 a 104,898 35,324 140,283 25.18
TURKEY - Résumé<br />
Tableau 5 Production totale d’énergie finale actuelle et future (Mtep)<br />
Sources d’énergie 1990 2000 2005 2010 2020 2030<br />
Charbon et lignite 12.41 13.29 20.69 26.15 32.36 35.13<br />
Pétrole 3.61 2.73 1.66 1.13 0.49 0.17<br />
Gaz<br />
Combustibles<br />
0.18 0.53 0.16 0.17 0.14 0.10<br />
renouvelables et<br />
7.21 6.56 5.33 4.42 3.93 3.75<br />
déchets a<br />
Nucléaire 7.30 14.60<br />
Hydraulique 1.99 2.66 4.16 5.34 10.00 10.00<br />
Géothermique 0.43 0.68 0.70 0.98 1.71 3.64<br />
Solaire/éolien/autre 0.03 0.27 0.22 1.05 2.27 4.28<br />
Production totale 25.86 26.71 34.12 39.22 58.20 71.68<br />
a Y compris la biomasse solide, le biogaz, les déchets industriels et municipaux<br />
Tableau 6 Consommation totale d’énergie finale et future (Mtep)<br />
Sources d’énergie 1990 2000 2005 2010 2020 2030<br />
Charbon et lignite 16.94 23.32 35.46 39.70 107.57 198.34<br />
Pétrole 23.61 31.08 40.01 51.17 71.89 102.38<br />
Gaz<br />
Combustibles<br />
2.86 12.63 42.21 49.58 74.51 126.25<br />
renouvelables et<br />
7.21 6.56 5.33 4.42 3.93 3.75<br />
déchets a<br />
Nucléaire 7.30 14.60<br />
Hydraulique 1.99 2.66 4.16 5.34 10.00 10.00<br />
Géothermique 0.43 0.68 1.89 0.97 1.71 3.64<br />
Solaire/éolien/autre 0.03 0.27 0.22 1.05 2.27 4.28<br />
Consommation totale<br />
d‟énergie primaire<br />
53.01 77.49 129.63 152.22 279.18 463.24<br />
a<br />
Y compris la biomasse solide, le biogaz; les déchets industriels et municipaux.<br />
Les prévisions d‟ici 2010 soulignent un investissement total pour les centrales électriques et<br />
les réseaux de distribution d‟environ US$ Md 45, dont 19 seront selon les formes de<br />
production indépendante BOT (build operate transfer) et BOO (build operate own<br />
construction-possession-exploitation). Ces investissements étant trop élevés pour être pris<br />
en charge exclusivement par les finances publiques, des capitaux privés doivent être sollicité<br />
pour le développement du secteur électrique en Turquie.<br />
La cogénération, ou autoproduction, plus connue sous l‟appellation “cycle combiné énergiechaleur”,<br />
a été développée avec le soutien de l‟état pour répondre aux besoins en production<br />
électrique supplémentaire.<br />
Entre 1980 et 2005, US$ 120 millions (prix et taux de change 2005) ont été investis par le<br />
gouvernement en recherche et développement, dont 15,6% du budget total, soit US$ 17.4<br />
millions, ont été alloués aux ER.<br />
L‟énergie géothermique bénéficie depuis 20 ans des financements les plus réguliers et les<br />
plus importants, à hauteur de US$6.1 million, soit 37% des dépenses en R&D des ER entre<br />
1980 et 2005. De surcroît, la Turquie collabore aux efforts mondiaux en R&D des ER, par sa<br />
contribution aux technologies photovoltaïques dans le cadre des Accords de l‟AIE.<br />
581
582<br />
ENERGY AND SUSTAINABLE DEVELOPMENT IN THE MEDITERRANEAN<br />
2. Les politiques d’ER et d’URE actuellement en place<br />
2.1 Énergie re nouvelable<br />
Le décret de 2003 portant sur les modifications réglementaires applicables au marché de la<br />
production d‟électricité qui définit les sources d‟ER marque le démarrage réel d‟une politique<br />
d‟énergie renouvelable. Auparavant, aucune politique nationale n‟avait été élaborée et il<br />
n‟existait que très peu d‟initiatives gouvernementales pour promouvoir le développement des<br />
ER. Cependant, ce décret (Electricity Market Licencing Regulation) à lui seul ne suffira pas à<br />
circonvenir les coûts d‟investissements élevés, ni à juguler le risque et le manque de sécurité<br />
associés à l‟arrivée sur le marché de l‟électricité de centrales fonctionnant à l‟énergie<br />
renouvelable.<br />
En 2000, le secteur industriel représentait 40% de la consommation totale finale en énergie<br />
et 54% de la consommation électrique, tandis que l‟agriculture, le résidentiel et les autres<br />
secteurs représentaient 40% de la consommation énergétique finale et 46% de la<br />
consommation électrique. Bien que ces 4 secteurs ont un fort potentiel d‟efficacité<br />
énergétique, les programmes d‟économie d‟énergie ont donné la priorité au secteur industriel<br />
du fait des projections de forte hausse de consommation dans ce secteur. Il faut cependant<br />
garder en tête que la structure industrielle de la Turquie est intensive en énergie.<br />
2.2 Efficacité énergétique<br />
En 1998, la consommation par habitant (mesurée sur la base de TPES/population) était de<br />
1,11 Mtep, très inférieure à la moyenne de 5,10 Mtep des autres pays de l‟AIE. Cependant,<br />
les prévisions pour la Turquie soulignent une augmentation de la consommation plus rapide<br />
que dans les autres pays de l‟AIE en fonction de la croissance économique. Pour la même<br />
période, l‟intensité énergétique, mesurée en tep/$1000 PIB (prix et taux de change 1990)<br />
s‟élevait à 0.35 tep contre 0.24 tep de moyenne dans les autres pays de l‟AIE, et est toujours<br />
en augmentation. L‟intensité énergétique de la Turquie s‟avère être bien inférieure à la<br />
moyenne de l‟AIE lorsque la parité du pouvoir d‟achat est prise en compte. Le gouvernement<br />
reconnaît qu‟il est nécessaire de réduire l‟intensité énergétique du PIB et d‟améliorer<br />
l‟efficacité énergétique de l'économie. La figure 1 représente les moyennes des rendements<br />
énergétiques des procédés industriels en 2003 et la Figure 2 montre les rendements<br />
énergétiques des différents équipements des secteurs résidentiel et tertiaire en 2002.<br />
Figure 3 Moyennes des rendements énergétiques de l’industrie primaire et secondaire en 2003
TURKEY - Résumé<br />
Figure 4 Moyenne des rendements énergétiques des secteurs résidentiels et tertiaires en 2002<br />
Selon les estimations du MENR, le potentiel en économies d‟énergie serait de 12 à 14<br />
Mtep/an en Turquie, soit près de 15 à 20% de la consommation totale de 1998. Ceci<br />
représente une économie de US$ 3 milliards dans les trois principaux secteurs de<br />
l‟économie.<br />
3. Blocages, solutions possibles, réformes nécessaires<br />
3.1 Les principa ux obstacles au dé ve l oppe ment des ER sont<br />
essentiellement :<br />
Le manque de ressources financières et de mécanismes de crédit, surtout pour les projets<br />
à petite échelle.<br />
La Turquie souffre, comme de nombreux autres pays méditerranéens, du manque<br />
d‟analyse et d‟évaluation précises des sources d‟ER, ainsi que de données pertinentes.<br />
Le manque de connaissance et de prise de conscience n‟est pas une barrière majeure en<br />
Turquie. L‟énergie renouvelable est reconnue comme une source importante de la<br />
production d‟énergie propre nationale.<br />
Malgré la promesse du nouveau gouvernement de simplifier les procédures, la bureaucratie<br />
ne facilite pas les investissements étrangers : il faut souvent une année entière pour obtenir<br />
une autorisation d‟investissement auprès de nombreux organismes.<br />
La Turquie utilise depuis longtemps l‟énergie hydroélectrique, la biomasse, l‟énergie solaire<br />
(pour le séchage des graines dans l‟agriculture et les chauffe-eau) et l‟énergie géothermique.<br />
Le secteur résidentiel utilise tout particulièrement les chauffe-eau solaires. En Turquie depuis<br />
les années ‟80, seulement 30 000 chauffe-eau solaires ont été installés, ce qui ne représente<br />
qu‟une infime partie du potentiel total, car environ 50% des logements pourraient être dotés<br />
de ce système. D‟ici à 2025, 5 millions de chauffe-eau solaires pourraient être installés, si le<br />
parc immobilier de la Turquie le permet, représentant une économie annuelle de 30 PJ (9,0<br />
TWh) en produits pétroliers, charbon et gaz, et une économie annuelle de 2,0 TWh en<br />
électricité, soit une économie annuelle de 5 millions de tonnes en émissions CO2, soit 1%<br />
des émissions actuelles.<br />
Les déchets agricoles pourraient avantageusement remplacer la lignite (40 millions de<br />
tonnes) et le charbon (1,3 millions de tonnes) dans la production électrique.<br />
Le biogaz est aussi considéré comme une bonne alternative au système de chauffage<br />
traditionnel (poêles) dans les zones rurales. Les pompes à chaleur géothermiques sont<br />
relativement nouvelles mais ont connu un essor rapide ces dernières années, car elles<br />
permettent de réduire la consommation électrique de 25 à 50% par rapport à un système de<br />
583
584<br />
ENERGY AND SUSTAINABLE DEVELOPMENT IN THE MEDITERRANEAN<br />
chauffage ou climatisation conventionnel. Les pompes à chaleur géothermiques réduisant la<br />
consommation, réduisent du même coup les émissions de pollution atmosphérique : jusqu‟à<br />
44% par rapport aux systèmes traditionnels de soufflerie et de 72% par rapport aux<br />
convecteurs et climatiseurs standard.<br />
3.2 Success sto r y<br />
Figurant parmi les 5 pays leaders dans l‟utilisation directe des applications géothermiques, la<br />
Turquie a commencé à développer à grande échelle ces systèmes avec le chauffage collectif<br />
dans les centres urbains. Les études de l‟énergie géothermique se sont multipliées dans les<br />
années 70, mais à cause de problèmes structurels, il fallut attendre le début des années 80<br />
pour que l‟exploitation de cette source d‟énergie soit déployée à grande échelle. Depuis lors,<br />
de multiples avancées ont été effectuées et, récemment, les systèmes géothermiques<br />
d‟utilisation directe ont été installés dans 52 000 logements, et presque 300 000 logements<br />
ont été conçus pour être équipés de systèmes de chauffage central géothermique.<br />
Selon les prévisions, d‟ici à 2010 et 2020, le développement des énergies géothermiques en<br />
Turquie devrait permettre une capacité installée totale de 3 500 MW (500 000 logements,<br />
soit environ 30% du secteur résidentiel national) et de 8 300 MW (1 250 000 logements) en<br />
chauffage central, et de 500 MW et 1 000 MW respectivement pour la production électrique.<br />
L‟investissement en centrales géothermiques de chauffage central représente, pour une<br />
surface au sol de 100 m2, un coût d‟environ US$ 1 500 à 2 500 (hormis les charges de<br />
chauffage habituelles), avec un retour sur investissement de 5 à 8 ans. Environ 30 à 50% de<br />
ces coûts sont supportés par les consommateurs lors de leur abonnement ; les prix du<br />
chauffage pour l‟hiver 2001 se situaient entre 14 et 29 US$.<br />
3.3 Réfo rmes nécessaires<br />
Les coûts de l‟énergie et des investissements requis constituent des obstacles à l‟élaboration<br />
d‟une stratégie claire dans le domaine des ER. L‟état a entrepris des actions promotionnelles<br />
auprès du secteur privé en faveur des centrales à cycle combiné au gaz naturel, en<br />
promettant des tarifs bas et des conditions de rachat spéciales. L‟utilisation réussie du<br />
modèle BOT a permis d‟augmenter de 20% la part des centrales à gaz naturel dans<br />
l‟approvisionnement total en énergie primaire, une approche visant la pérennité de<br />
l‟approvisionnement.<br />
L‟intérêt pour les ER ne s‟est jamais démenti en Turquie, où de nombreuses initiatives en<br />
faveur du développement durable sont encouragées, comme dans le cas de l‟énergie<br />
géothermique dont la gestion de proximité est effectuée par les municipalités.<br />
L‟efficacité énergétique en Turquie n‟a pas encore atteint les niveaux du reste de l‟Europe.<br />
L‟état encourage le secteur privé à se tourner vers les possibilités de crédit offertes par la<br />
Banque Mondiale pour toutes les sources d‟énergie renouvelable, en se portant caution pour<br />
couvrir 30 à 40% des coûts d‟investissement encourus par ce secteur pour répondre à ses<br />
propres besoins. Le secteur privé est autorisé à vendre sa production à tout acheteur.<br />
Le prix du kilowatt produit par les sources d‟ER s‟établit entre 13 et 15 cents. Si l‟Etat achète<br />
par exemple 10% de l‟énergie générée par les secteurs privés à ce prix, l‟Etat sera aussi<br />
bénéficiaire dans le futur.<br />
L‟URE appliquée aux constructions est une approche très récente. Les sources de chauffage<br />
utilisant le sous-sol et les systèmes de chauffage passifs restent limités.<br />
Pour le développement durable des ER ainsi que pour la mise en oeuvre de la stratégie<br />
Méditerranéenne, l‟énergie géothermique (sous-sol) et les systèmes de pompage des<br />
sources d‟eau chaude, les énergies éoliennes et les centrales solaires doivent être<br />
favorisées. Les technologies relatives aux ER et les quantités d‟énergie produite par unité<br />
doivent rester prioritaires dans les programmes nationaux. La législation et la réglementation<br />
doivent être renforcées et des campagnes de sensibilisation doivent être organisées au<br />
niveau national.
III. NATIONAL STUDY<br />
1. The Country’s Energy Situation<br />
TURKEY - National Study<br />
1.1 Share of t he Energy S ecto r and Insti tu ti onal Specificities<br />
Turkey is situated at the meeting point of three continents (Asia, Europe and Africa) and<br />
stands as a bridge between Asia and Europe. The country is located in south-eastern Europe<br />
and south-western Asia. Its size is 779,452 km 2 . Turkey‟s population was 70,712,000 in 2003<br />
(Table 7) [3,4,5,6,7,8,9,10].<br />
Because of social and economic development of the country, the demand for energy and<br />
particularly for electricity is growing rapidly. The main indigenous energy resources are<br />
hydro, mainly in the eastern part of the country, and lignite. Turkey has no big oil and gas<br />
reserves. Almost all oil and natural gas (NG) is imported, as is high quality coal. Turkey also<br />
has a large potential for renewable energies. In Turkey, electricity is produced by thermal<br />
power plants (TPPs), consuming coal, lignite, NG, fuel oil and geothermal energy, and<br />
hydropower plants (HPPs).<br />
Table 7 Energy profile of Turkey in 2003 [3,4,5,6,7,8,9,10]<br />
The Turkish government has developed an energy policy aimed at diversifying energy<br />
sources and suppliers and attracting private capital. Special attention in the government‟s<br />
energy policy is paid to the development of international cooperation. Turkey has developed<br />
and implemented several energy efficiency projects, aiming to increase energy efficiency in<br />
the industry, transport and residential sectors. The relationship among the primary energy<br />
consumption, Gross Domestic Product (GDP), population, electricity production and<br />
consumption in Turkey has been given in Table 8 [11,12]. As shown in the Table, during the<br />
last 10 years, while population increased 1.92%, GDP and Total Primary Energy<br />
Consumption increased 3.03 and 3.38, respectively. Net Electricity Consumption, Net<br />
Electricity Production and Gross Electricity Production increased about 10% during the same<br />
period.<br />
585
586<br />
ENERGY AND SUSTAINABLE DEVELOPMENT IN THE MEDITERRANEAN<br />
Table 8 Primary energy consumption, GDP, population, electricity production and consumption in<br />
Turkey [11,12]<br />
Turkey is relatively well endowed with energy and mineral sources. The extensive<br />
mountainous terrain provides numerous hydroelectric sites, although most are far from the<br />
main population and consumption centres. The country also has substantial exploitable<br />
lignite sources and small reserves of hard coal, petroleum and natural gas. Commercially<br />
exploitable deposits of many minerals have been located, but the territory has been surveyed<br />
only partially. Exploitation of these natural resources has occurred relatively slowly.<br />
Turkey is an energy importing country; more than half of the energy requirement has been<br />
supplied by imports. Due to the diversification efforts of energy sources, use of natural gas<br />
that was newly introduced into Turkish economy, has been growing rapidly. On the other<br />
hand, Turkey, with its young population and growing energy demand per person, its fast<br />
growing urbanization, and its economic development, has been one of the fast growing<br />
power markets of the world for the last two decades. Oil has the biggest share in total<br />
primary energy consumption. But it is expected that natural gas consumption will be higher<br />
than oil in future.<br />
Table 9 depicts the historical and projected relationship between population, economic<br />
output and energy demand. Several relationships are worth highlighting. First, the population
TURKEY - National Study<br />
projections signal the slowing down of population growth. At the same time the GNP is<br />
expected to nearly double every ten years. A similar relationship between population, per<br />
capita energy demand and total energy demand is projected. The implication of these figures<br />
is that energy intensity of the Turkish economy will substantially improve over time, going<br />
from 81 Mtoe/GNP/capita in 1973 to 40 Mtoe/GNP/capita in 2000 to 33 Mtoe/GNP/capita in<br />
2020 (Table 3) [14].<br />
Years<br />
Table 9 Population, economy and energy [14]<br />
Population<br />
Total energy Energy/capita Energy<br />
GNP/capita Total GNP<br />
(000s) demand (Mtoe) (Kep) intensity<br />
1973 38,072 1994 75,915,568 24.6 646 81<br />
1990 56,098 2674 150,006,052 53.7 957 50<br />
1995 62,171 2861 177,871,231 64.6 1,039 44<br />
2000 67,618 3303 223,342,254 82.6 1,218 40<br />
2010 78,459 5366 421,010,994 153.9 1,962 35<br />
2020 87,759 9261 812,736,099 282.2 3,216 33<br />
The main energy resources of Turkey are hard coal, lignite, asphaltite, petroleum, natural<br />
gas, hydroelectric energy, and geothermal energy.<br />
Turkey‟s main energy resource is coal, which has been produced for years domestically, and<br />
its share of the country‟s total energy consumption is about 24 %. It is used mainly for power<br />
generation, cement production, and steel manufacturing [18]. Turkey is one of the biggest<br />
producers of lignite in the world. This comes predominantly from deposits of the Southwest<br />
and the south-eastern Afsin-Elbistan Basin, where 7339 million tons lignite is economically<br />
usable. The biggest lignite deposits (40 % of the total) are in Elbistan [18]. The government<br />
plans to increase the total supply from 20.1 Mtoe in 1999 to 118.4 Mtoe in 2020 [4]. It is<br />
believed that domestic lignite production will be almost tripled. The amount of fossil energy<br />
resources in Turkey is shown in Table 10 [18].<br />
Table 10 The amount of fossil energy resources in Turkey [18]<br />
Turkey‟s natural energy resources are quite miscellaneous, for example, hard coal, lignite,<br />
asphaltite, oil, natural gas, hydro, geothermal, wood, animal and plant wastes, solar and<br />
secondary energy resources, coke and briquettes. These resources are produced and<br />
consumed in the country. Turkey does not own large fossil fuel reserves. In the future, it<br />
seems that it will be very difficult to meet the anticipated demand for oil, natural gas, and<br />
even coal. On the other hand, Turkey has huge reserves of renewable energy sources.<br />
587
588<br />
ENERGY AND SUSTAINABLE DEVELOPMENT IN THE MEDITERRANEAN<br />
Table 11 Turkey’s renewable energy potential [16]<br />
Turkey‟s renewable energy sources are plentiful and extensive. Renewable energy<br />
production makes up approximately 14.4 % of the total primary energy supply (TPES), i.e.<br />
10.10 million tons of oil equivalent (Mtoe) in 1999, and renewable sources represent the<br />
second-largest domestic energy source after coal. Primary renewable energy resources in<br />
Turkey are: hydro, biomass, wind, biogas, geothermal and solar.<br />
Turkey‟s renewable energy potential is given in Table 11 [16]. Considering recent studies,<br />
the usable hydropower potential of Turkey is estimated at 125,000 GWh/year (34,729 MW),<br />
as given in Table 5. 24,010 GWh of this potential was produced in operating hydropower<br />
plants (HPPs) in 2001 [17].<br />
There are 436 sites available for hydroelectric plant construction, distributed on 26 main river<br />
zones. Table 12 [62] gives water and hydroelectric energy potential of selected river basins<br />
in Turkey. The total gross potential and total energy production capacity of these sites are<br />
nearly 50 GW and 112 TWh/yr, respectively, and about 30% of the total gross potential may<br />
be economically exploitable. At present, only 35% of the total hydroelectric power potential is<br />
in operation (Table 13). The national development plan aims to harvest all of the<br />
hydroelectric potential by 2010. The contribution of small hydroelectric plants to total<br />
electricity generation is estimated to be 5-10% [62,109]. The hydroelectric potential of the<br />
world is given in Table 14 [63].<br />
Table 12 Economic hydroelectric potential of selected river basins in Turkey [62]
TURKEY - National Study<br />
Table 13 Distribution of the hydropower potential in Turkey by Project implementation status [62]<br />
Table 14 Hydroelectric potential of the world [63]<br />
Table 15 Turkey’s small hydropower potential [64]<br />
The south-eastern Anatolia Project (GAP) is one of the largest power generating, irrigation,<br />
and development projects of its kind in the world, covering 3 million ha of agricultural land.<br />
This is over 10% of the cultivable land in Turkey; the land to be irrigated is more than half of<br />
the presently irrigated are in Turkey. The GAP project on the Euphrates and Tigris Rivers<br />
encompasses 22 dams and 19 hydroelectric power plants. Once completed, 27 billion kWh<br />
of electricity will be generated and irrigating 1.7 million ha [104]. Table 15 [64] shows<br />
Turkey‟s SHP potential and Table 16 [64] shows the situation of SHP development in Turkey<br />
during 1995–2002.<br />
Among the renewable energy sources, biomass is important because its share of total<br />
energy consumption is still high in Turkey. Since 1980, the contribution of the biomass<br />
resources in the total energy consumption dropped from 20% to 8% in 2005. Biomass in the<br />
forms of fuel-wood and animal wastes is the main fuel for heating and cooking in many urban<br />
and rural areas [110,111]. The total recoverable bio-energy potential is estimated to be about<br />
16.92 Mtoe in 1998 [111]. The estimate is based on the recoverable energy potential from<br />
the main agricultural residues, livestock farming wastes, forestry and wood processing<br />
residues, and municipal wastes [112]. Table 17 [26,27] shows the present and planned<br />
589
590<br />
ENERGY AND SUSTAINABLE DEVELOPMENT IN THE MEDITERRANEAN<br />
biomass energy production in Turkey. As seen in Table 49 [26,27], total biomass production<br />
is 7.3 Mtoe in 2005 and will be 52.5 Mtoe in 2030.<br />
Table 16 Small hydro-power development in Turkey during 1995-2002 [64]<br />
Table 17 Present and planned biomass energy production in Turkey (Ktoe) [26,27]<br />
Turkey‟s forest potential is shown in the Table 18 [66]. The total forest potential of Turkey is<br />
around 935 million m 3 with an annual growth of about 28 million m 3 [23]. The average annual<br />
growth rate of the forests is about 3%. Around 90% of this potential includes highly<br />
productive forests and other woodlands, the others being low productive forests and other<br />
woodlands. Energy forests seem to be the best solution, and it has been estimated that 5<br />
million hectares of productive forestland is available to be used as energy forests in Turkey.<br />
Turkey is a developing country with rich agricultural potential, but the amount of utilization is<br />
very low. In agricultural residues, the total residues amount calculated in dry base has been<br />
measured approximately between 40 and 53 million tons [111,112]. If it is accepted that 80%<br />
of cereal can be used and its average humidity rate is 15%, then the total amount of<br />
agricultural residues used in power plant would be as the average between 27 and 36 million<br />
tons.<br />
Table 18 Turkey’s forest potential [66]<br />
Turkey is one of the countries with significant potential in geothermal energy. Table 19 [23]<br />
shows the total geothermal energy potential of Turkey. Data accumulated since 1962 show<br />
that there may exist about 4500 MW of geothermal energy usable for electrical power<br />
generation in high enthalpy zones. Heating capacity in the country runs at 350 MWt<br />
equivalent to 50,000 households. These numbers can be heightened some sevenfold to<br />
2250.
TURKEY - National Study<br />
Table 19 Turkey’s geothermal energy potential [23]<br />
Table 20 Capacities in geothermal utilization in Turkey (May 2006) [67]<br />
MWt equal to 350,000 households through a proven and exhaustible potential. Turkey must<br />
target 1.3 million house holds equivalent 7700 MWt. Geothermal central heating, which is<br />
less costly than natural gas could be feasible for many regions in the country. In addition<br />
31,000 MW of geothermal energy potential is estimated for direct use in thermal applications.<br />
The total geothermal energy potential of Turkey is about 2268 MW in 1998, but the share of<br />
geothermal energy production, both for electrical and thermal uses is only 1229 MW (Table<br />
20). There are 26 geothermal district heating systems existing now and main city geothermal<br />
district heating systems are Gönen, Simav and Kırşehir cities [74,115]. The contribution of<br />
geothermal to TPES is 162 Ktoe energy included electricity generation.<br />
Turkey lies in a sunny belt between 36º and 42ºN latitudes. The yearly average solar<br />
radiation is 3.6 kWh/m2-day and the total yearly radiation period is approximately 2640 h,<br />
which is sufficient to provide adequate energy for solar thermal applications. Table 21 [26,27]<br />
shows solar energy potential in Turkey. In spite of this high potential, solar energy is not now<br />
widely used, except for flat-plate solar collectors. They are only used for domestic hot water<br />
production, mostly in the sunny coastal regions. In 2004, about 8.0 million m2 solar collectors<br />
were produced and it is predicted that total solar energy production is about 0.290 Mtoe<br />
[26,27]. The global solar radiation incident on horizontal surface and bring sunshine hours<br />
are measured by all recording stations in Turkey.<br />
Table 21 Solar energy potential for seven regions and some cities in Turkey [26,27]<br />
There are a number of cities in Turkey with relatively high wind speeds (Table 22) [26,27].<br />
These have been classified into six wind regions, with a low of about 3.5 m/s and a high of 5<br />
m/s at 10m altitude, corresponding to a theoretical power production between 1000 and 3000<br />
kWh/(m2yr). The most attractive sites are the Marmara Sea region, <strong>Mediterranean</strong> Coast,<br />
Agean Sea Coast, and the Anatolia inland. Turkey‟s first wind farm was commissioned in<br />
1998, and has a capacity of 1.5 MW. Capacity is likely to grow rapidly, as plans have been<br />
submitted for just under a further 600 MW of independent facilities. The majority of proposed<br />
projects are located in the Çeşme, İzmir and Çanakkale regions. Electrical power resources<br />
survey and development administration (EIE) carries out wind measurements at various<br />
location to evaluate wind energy potential over the country, and have started to compile a<br />
wing energy atlas. Approval of independent wind energy projects requires at least a 6<br />
months history of wind measurements [126,128].<br />
591
592<br />
ENERGY AND SUSTAINABLE DEVELOPMENT IN THE MEDITERRANEAN<br />
Energy can also be extracted from the non-tidal surface sea waves. Wind energy is the main<br />
producer of wave energy. The coast length of Turkey is approximately 8210 km. Turkey‟s<br />
wave potential is not sufficient to build small wave energy systems in every coastal region.<br />
One-fifth of the total coast length of Turkey has 18.5 TWh/year wave energy technique<br />
potential. On the other hand, it is estimated that Turkey‟s annual wave energy potential is an<br />
average 140 billion kWh. When we consider the 120 billion kWh annual electricity production<br />
of Turkey in 2000, we may conclude that the wave energy potential of the country should be<br />
used in order to meet Turkey‟s electricity demand [135].<br />
Table 22 Wind characteristics for some selected cities in Turkey [26,27]<br />
Similar to other industrializing countries, with the increases in energy consumption and<br />
economical growth, energy related environmental problems are rapidly growing in Turkey. To<br />
control these problems for sustainable development, energy related policy should be well<br />
determined and to minimize the adverse environmental impacts of energy activities, just as<br />
energy related environmental decisions should take account of the energy consequences.<br />
Turkey is not a party to the UNFCCC or the Kyoto Protocol, meaning the country has no<br />
binding requirements to cut carbon emissions by the 2008-2012 period as most other IEA<br />
countries have. However, it has been rehabilitating the power plants since 1987.<br />
TEAS, Projections by Turkey‟s Electricity Generating and Transmission Corporation, is a<br />
public company that owns and operates 15 thermal and 30 hydroelectric plants. TEAS is<br />
generating 91 % of Turkey‟s electricity. It has been announced that due to the rapid growth in<br />
electricity consumption, as high as 9-10 % per year, this will continue over the next 15 years.<br />
Because of generation and distribution losses as high as 30 %, and partly as a result of<br />
under investment, electricity shortages, brownouts (periods of reduced voltage of electricity<br />
caused especially by high demand and resulting in subnormal illumination), and blackouts<br />
(periods of darkness (as in a city) caused by a failure of electrical power), already commonly<br />
increasing electricity generation capacity therefore is a top priority for Turkish energy<br />
officials. According to the Ministry of energy and Natural Resources (MENR), meeting<br />
Turkey‟s power needs could require investments of $4-$4.5 billion/year, much of which would<br />
need to come from the private sector. Turkey has plans for an additional 23,603 megawatts<br />
(MW) in power generating capacity by 2020, nearly double the country‟s 26,226 MW capacity<br />
in 2005 [167].<br />
Turkey passed the long-expected Electricity Market Law in February 2001, which the<br />
President signed into law in July 2001. This paves the way for a free market in power<br />
generation and distribution. The legislation mainly calls for:<br />
1) TEAS to be broken up into separate generation, distribution, and trade companies;<br />
2) Trade and generation companies to be privatized, while transmission remains in state<br />
hands; and
TURKEY - National Study<br />
3) A new regulatory board to be set up that will oversee the Turkish power market, set<br />
tariffs, issue licences, and prevent uncompetitive practices.<br />
The new law throws into doubt the fate of dozens of BOT and Transfer-of-Operating-Rights<br />
(TOR) power projects. The Energy Ministry put six power plants and nine distribution grids<br />
for sale in May 2002.<br />
In southern Turkey, Germany‟s Siemens AG is leading a corporation of companies in<br />
building a $1.45-billion, 1300-MW, coal-fired power plant near Iskenderun. The plant was<br />
scheduled for completion in 2003, and it is to burn imported coal. In addition to this large<br />
coal-fired process, Turkey is mainly focused on increasing natural gas use for thermal<br />
electric power generation. GE power systems is supplying natural gas-fired turbine<br />
generators worth more than $900 million for three new united cycle power plants as the 770-<br />
MW Adapazari, 1540-MW Gebze, and 152-MW Izmir plants[168].<br />
However, increasing domestically generated electricity through construction of new power<br />
plants, Turkey is also looking outside its borders to help meet the country‟s rapidly growing<br />
power needs.<br />
Turkey imports power from Russia, via Georgia and Iran. Russia signed an agreement with<br />
Turkey to increase its power exports to Turkey through Georgia in October 2000. Besides<br />
direct power purchases from other countries, increased natural gas imports will be used<br />
largely for electricity generation, with new LNG terminals to be attached to Independent<br />
Power Producer (IPP) gas-fired generation facilities. Turkish and Turkmen officials signed an<br />
agreement on power supplies from Turkmenistan in May 1999. In addition to these, Turkey is<br />
also importing around 3 billion kilowatt-hours (bkwh) from Bulgaria per year. In September<br />
2000, Turkey stated its desire to increase its power imports from Bulgaria to 5 bkwh by the<br />
year 2005. Turkey has a memorandum with other Black Sea Economic Cooperation (BSEC)<br />
members to look into creation of a regional power grid.<br />
Turkey has significant hydroelectric power resources such as the Southeast Anatolia<br />
Hydropower and Irrigation Project, which is also known as the GAP Project. It has more than<br />
Table 23 Distribution of hydraulic power potential in Turkey [21]<br />
104 total plants, installed capacity over 10.2 GW, and it is developing a great deal more,<br />
especially as part of the $32-billion project. GAP is such a significant project considered to be<br />
one of the biggest water development projects ever undertaken. It includes 21 dams, 19<br />
hydro plants around 7.5 GW of power generating capacity, and a network of tunnels and<br />
irrigation canals. The distribution of hydroelectric power potential in Turkey is as shown in<br />
Table 23 [21] and the distribution of electrical energy production by resources between 1990<br />
and 2002 is shown in Table 24 [27,52]. By the way, in Turkey the economic performance of<br />
the hydraulic energy does not increase according to the growing amount of rains. Contrarily it<br />
decreases. There is a general decrease in the stream flows too recently.<br />
The main Turkish hydro dams are: Ataturk, 2400 MW capacity; Karakaya, 1800 MW; Ilisu,<br />
1200 MW; Cizre 240 MW; Silvan/Kayseri, 240 MW; Hakkari, 208 MW; Alpaslan II, 200 MW;<br />
Batman, 198 MW; Konaktepe, 180 MW; and Karkamis, 180 MW [168].<br />
The Turkish government decided to cancel a planned and often-delayed $4-billion, 1300-MW<br />
nuclear power plant in July 2000. This involved three international corporations: AECL of<br />
Canada, Westinghouse-Mitsubishi of the United States and Japan, and NPI of France and<br />
593
594<br />
ENERGY AND SUSTAINABLE DEVELOPMENT IN THE MEDITERRANEAN<br />
Germany. They had submitted bids to built the plant, which would have been Turkey‟s first<br />
nuclear plant. The project was on the southern <strong>Mediterranean</strong> coast at Akkuyu. According to<br />
given explanations the plant was cancelled for financial reasons, although there also had<br />
been opposition from environmental and anti-nuclear groups, as well as neighbouring<br />
countries [168].<br />
Table 24 Distribution of electrical energy production by resources between 1990 and 2002 [27, 52]<br />
Turkish officials had long discussed the possibility that nuclear power might help the country<br />
address its energy problems. During the 1980s, the military government drew up a nuclear<br />
energy program and established the Nuclear Power <strong>Plan</strong>ts Division of the Turkish Electricity<br />
Authority to make feasibility studies and to build nuclear plants. Given Turkey's desire to<br />
diversify its energy sources, nuclear power was expected to remain on the agenda. By early<br />
1995, however, no electricity had been generated from nuclear power. Table 25 [53] shows<br />
that in 1970, the total generating capacity was 2.234 GW, 68% TPPs and 32% HPPs. By the<br />
end 1995, it reached 20.951 GW, an annual average increase of 9.4%.<br />
Table 25 Installed capacity of electric power in Turkey (GW) [53]<br />
The Turkish Government has announced plans to build 10 nuclear reactors by 2020. The first<br />
reactor was planned to be built at Akkuyu Bay on the southeast <strong>Mediterranean</strong> coast, and<br />
was scheduled to start operation in 2005 but has not started yet. Three international<br />
consortia are bidding for the contract.<br />
Turkey‟s nuclear program makes it a key country for survival of the nuclear power industry. In<br />
Western Europe and North America, no new reactors are being ordered, while the recent<br />
currency crises have stalled or slowed nuclear construction plans in south and Southeast<br />
Asia. If Turkey‟s plans are realized, it will be one of the few countries in the world, which is<br />
building new reactors, and the only non-nuclear country actively developing a nuclear power<br />
program. It will provide a lifeline for western reactor vendors, and the industry as a whole<br />
[22].<br />
When Turkey first considered nuclear power in 1965, the many problems that have plagued<br />
the industry were not so apparent. Now, three decades later, there can be no doubt that<br />
nuclear power is a dangerous and expensive technology that has had a dreadful impact on<br />
human health and the environment on a global scale. Greenpeace is urging Turkey to learn<br />
from the terrible lessons of the past 50 years and not go down the nuclear road [22].<br />
Turkey, owner of 6 refineries, having capacity of 719,275 bbl/d, at each refinery. Turkey‟s<br />
refining and other downstream operations are operated by partly state owned company<br />
Tupras, which has four major refining complexes. These are Batman in the southeast, Aliaga
TURKEY - National Study<br />
adjacent to Izmir, Izmit adjacent to Istanbul. Izmit refinery is the country‟s largest refinery,<br />
and the Central Anatolian Refinery at Kirikkale near Ankara. Tupras‟ equal parts of the<br />
Turkish fuels and lubricants bazaar was around 78 %, with other main retailers comprising<br />
BP, ExxonMobil, TotalFinaElf, Agip, and ConocoPhillips in 2002 [169].<br />
Tupras is planning to have a fifth refinery, which is a $700-$800 million establishment next to<br />
Yarimca in Northwest of Turkey and will have been built by this year (2007). Tupras is also<br />
planning a renovation program to change products at its refineries into lighter products.<br />
Turkey‟s only private refinery is ATAS, located near Mersin on the <strong>Mediterranean</strong> coast,<br />
which is a partnership of Mobil (51 %), Shell (27 %), BP Amoco (17 %), and the local<br />
company, Marmara Petrol ve Rafineri Isleri AS (5 %) [169].<br />
The Turkish Parliament ratified constitutional amendments by large majorities in August 1999<br />
that will considerably develop trade and investment. In addition to that The Turkish<br />
Parliament ratified a law, which will eventually privatize most of BOTAS, the state-owned<br />
natural gas company in 2001. By the year 2009, the law would separate BOTAS into different<br />
units for gas importation, transport, storage, and distribution. To bring to a conclusion, apart<br />
from transport, all the units would be privatized [20]. Leaving only 20 % at the end, the plan is<br />
to sell off 10 % of the BOTAS market share each year. In March 2001, Turkey‟s Electricity<br />
Market Law came to power. The law orders a free market in power generation and<br />
distribution. The state-owned Turkish Electricity Generation and Transmission Corporation<br />
(TEAS) was split into four separate state-owned companies, these are for electricity<br />
generation (TEUAS), electricity transmission (TEIAS), electricity distribution (TEDAS), and<br />
electricity trade (TETAS), under the law [139,170].<br />
Moreover, the new law assures a new organization, the Energy Market Regulation Agency<br />
(EMRA), which oversees the power and natural gas markets, including setting tariffs, issuing<br />
licenses, and assuring competition. On November 19, 2001, the Energy Market Regulatory<br />
Board was charged to operate the EMRA. The EMRA published drafts of the Energy Market<br />
Licensing Regulation and the Electricity Market Tariffs Regulation, and these regulations<br />
come into power in August 2002 [15]. EMRA has also declared that a 4-level step to a rivalry<br />
electricity market. The first level orders licenses to firms in the electricity and natural gas<br />
markets. The second level ensures large industrial users can choose their electricity provider<br />
and started March 3, 2003 [15]. The third level begins to regulate the Market Financial<br />
Reconciliation Centre for balancing and settlements, and the fourth level makes this Centre<br />
fully operational and functional. Legislation has been requested in the Turkish parliament that<br />
would extend the area of the EMRA to comprise the upstream facilities in the petroleum. This<br />
Petroleum Market Bill is to be considered by the parliament in the near future [170].<br />
Turkey plans a very big improvement in energy supply as its economy develops, particularly<br />
via electricity and natural gas, and has approved a policy of supporting and encouraging<br />
foreign investment in power plants and natural gas pipelines to meet the expected demand.<br />
After 1995, Turkey acknowledged new routes for energy project financing and ownership.<br />
Three models were proposed, such as „„Build-Operate-Transfer‟‟ (BOT), „„Build-Own-<br />
Operate‟‟ (BOO), and „„Transfer of Operating Rights‟‟ (TOR) [15].<br />
MENR, Turkey‟s MENR had planned that foreign developers would construct most of the<br />
new power plants on a BOT basis. According to this model, many private investors would<br />
construct and operate power plants for several years, then eventually ownership would be<br />
transferred back to the state [15]. The electric power generated by these projects could be<br />
sold to the national grid, the state-owned electricity authority, or even a private end user.<br />
The TOR is a similar subject for privatization, usually set via a bidding process, a private<br />
investor or consortium receives a power plant in exchange for a transfer fee [15]. As a next<br />
level, they operate and maintain the facility as required as long as the predetermined transfer<br />
time period. After that, the power plant is transferred back to the state without any cost or<br />
necessity. Many of Turkey‟s existing power plants had been expected to be privatized in this<br />
method, however the IMF is against this because of the time limits imposed on the operating<br />
rights [15]. The IMF approves „„full privatization‟‟. There are only two power plants have been<br />
privatized under the TOR so far. The BOO has been more profitably considered by power<br />
595
596<br />
ENERGY AND SUSTAINABLE DEVELOPMENT IN THE MEDITERRANEAN<br />
investors, as this does not impose any time limits on the project. Moreover, the economics of<br />
power generation is usually more profitable than for the BOT that results in a lower cost of<br />
power production [170].<br />
1.2 Energy S u pply, Dema n d and Produc ti o n<br />
The combined demands of industrialization and urbanization in Turkey nearly tripled energy<br />
consumption in the 1960s and 1970s. An inappropriate pricing policy, especially the subsidy<br />
of petroleum that led to unduly cheap products, was one cause of shifts in the sources of<br />
energy that exacerbated shortages. In 1960 more than half of the primary energy consumed<br />
came from non-commercial sources, mainly firewood but also manure and agricultural<br />
wastes. These non-commercial sources, plus domestic coal and lignite, accounted for more<br />
than 80 percent of all primary energy consumed; oil supplied only 18 percent. Table 26 [20]<br />
shows production and consumption of total primary energy in Turkey from 1973 with<br />
forecasted values until 2020 [166].<br />
By 1980, in contrast, oil supplied about 47% of the primary energy consumed, hard coal and<br />
lignite about 18%, electricity 6%, and non-commercial sources such as firewood and animal<br />
wastes only 28%. Table 27 [21] and Table 28 [21] show primary energy supply and final<br />
energy demand by source, respectively. By 1995, 50.4 percent of final energy came from<br />
petroleum, 17.6% from lignite and hard coal, 11.4% from electricity, 6.1% percent from<br />
natural gas, and 14.5% from other energy sources, including solid fuels, geothermal, solar<br />
power, and wind power (Table 28 [21]. Figure 5 shows Turkey‟s energy production and<br />
demand forecast by sources and Figure 6 shows Turkey‟s energy consumption by sources.
TURKEY - National Study<br />
Table 26 Production and consumption of total primary energy in Turkey, 1973-2020 [20]<br />
597
598<br />
Production (ktoe)<br />
50000<br />
45000<br />
40000<br />
35000<br />
30000<br />
25000<br />
20000<br />
15000<br />
10000<br />
5000<br />
0<br />
ENERGY AND SUSTAINABLE DEVELOPMENT IN THE MEDITERRANEAN<br />
Table 27 Primary energy supply by source (%) [21]<br />
Table 28 Final energy demand by source (%) [21]<br />
Figure 5 Turkey‘s energy production and demand forecast by sources<br />
Coal (H. coal+Lignite)<br />
Oil and Natural Gas<br />
Hydropower<br />
Wood and waste<br />
Geothermal<br />
Nuclear<br />
Solar<br />
Wind<br />
1970 1975 1980 1985 1990 1995 2000 2005 2010 2015 2020 2023 2025<br />
Years
Consumption (ktoe)<br />
70000<br />
60000<br />
50000<br />
40000<br />
30000<br />
20000<br />
10000<br />
0<br />
1970<br />
1973<br />
Hard coal<br />
Lignite<br />
Asphaltite<br />
Oil<br />
Natural Gas<br />
Hy dropower<br />
Geothermal<br />
Wind<br />
Solar<br />
Wood<br />
Ani. and Pla. Rem.<br />
1976<br />
1979<br />
TURKEY - National Study<br />
Figure 6 Turkey’s energy consumption by sources<br />
1982<br />
1985<br />
1988<br />
1991<br />
1994<br />
1997<br />
Years<br />
2000<br />
2003<br />
2006<br />
Table 29 Electricity supply by source (%) [21<br />
During the 1970s, the demand for electricity began to exceed supply, and by the late 1970s<br />
the power gap began to constrain industry. After 1977 rotating blackouts affecting industrial,<br />
commercial, and residential consumers were necessary to meet demand. By 1979 the<br />
shortage of foreign exchange had so restricted imports of crude oil that fuel for cars, trucks,<br />
and tractors had to be rationed [166]. In the mid-1980s, the build, operate, and transfer<br />
(BOT) system was launched in an attempt to deal with the energy shortage, under which<br />
foreign investors would provide the capital and technology to build plants, operate them for a<br />
number of years with guaranteed revenues, and finally transfer the units to the government<br />
when the investment had been fully returned [166]. The Atatürk Dam was a major project<br />
designed to increase electricity output. Its first two power units came on line in 1992.<br />
Electricity supply by source (%) can be seen in Table 29 [21].<br />
2009<br />
2012<br />
2015<br />
2018<br />
599
600<br />
ENERGY AND SUSTAINABLE DEVELOPMENT IN THE MEDITERRANEAN<br />
Table 30 Sectoral distribution of the general energy demand (thousands sons of oil equivalent) [23]<br />
In the 1960s, lignite and water increased in importance as sources of energy, while coal and<br />
diesel oil dropped, but from the 1970s into the early 1980s, the importance of oil increased<br />
relative to other sources. In the 1980s, lignite again came to play an increasing role.<br />
Privatization of state assets has been underway since 1986, and Turkey's electricity sector,<br />
which is over 90% state-owned, is a chief target of this effort. Turkey's Electricity Market Law,<br />
passed in 2001, was a major step in the privatization of the power industry and the creation<br />
of a free market for power production and distribution.<br />
Consumption (ktoe)<br />
350000<br />
300000<br />
250000<br />
200000<br />
150000<br />
100000<br />
50000<br />
0<br />
1970<br />
1973<br />
Household<br />
Industry<br />
Transportation<br />
Agriculture<br />
Total<br />
1976<br />
1979<br />
Figure 7 Total energy consumption in the sectors<br />
1982<br />
Total Energy Consumption in the Sectors<br />
1985<br />
1988<br />
1991<br />
1994<br />
1997<br />
Years<br />
Between 1980 and 1994, Turkish electric power demand grew at an average annual rate of<br />
9.1%, among the highest such rates in the world. Continuing electricity shortages, resulting in<br />
frequent blackouts and brownouts, have made it a priority for Turkey to increase electrical<br />
capacity. As of 2002, the government was planning to nearly double the country's generating<br />
capacity by 2020 by adding more than 23,000 MW in additional power. Geothermal power<br />
could supply up to an estimated 31.5 million kW of additional capacity, but little progress has<br />
been made on exploiting the potential. Sectoral distribution of the general energy demand is<br />
shown in Table 30 [23] and the sectoral total energy consumption is shown in Figure 7.<br />
Because of social and economical development of the country, the demand for energy and<br />
particularly for electricity is growing rapidly. The main indigenous energy sources are hydro,<br />
mainly in the eastern part of the country, and lignite. Turkey has no big oil and gas reserves.<br />
Almost all oil and natural gas (NG) is imported, as is high quality coal. Turkey also has large<br />
potential for renewable energies. In Turkey, electricity is produced by thermal power plants<br />
2000<br />
2003<br />
2006<br />
2009<br />
2012<br />
2015<br />
2018
TURKEY - National Study<br />
(TPPs), consuming coal, lignite, NG, fuel oil and geothermal energy, and hydropower plants<br />
(HPPs). The development of nuclear power in Turkey is so new.<br />
Table 31 Primary energy consumption in Turkey during 1984-1995 (Gigagrams of oil equivalent) [23]<br />
Turkey‟s energy consumption has increased by an average of 4,4 % each year over the past<br />
years and reached 62 million tons of oil equivalents (Mtoe) in 1995 (Table 31) [23]. Domestic<br />
coal, geothermal and hydropower reserves of Turkey are approximately 1 % of the world‟s<br />
total.<br />
Total demand for primary energy resources (TPER) has seen a spectacular development<br />
since the beginning of 1980. In 1995, Turkey‟s consumption of commercial energy was 1.015<br />
toe per capita. This is about 1/4 of the industrialized European countries and 2/3 of the world<br />
average. Domestic energy production met 42 % of TPER in 1995 (Table 31) [23].<br />
Table 32 Present and future total final energy production in Turkey (Mtoe) [25, 26]<br />
In 2005, primary energy production and consumption has reached 34 and 130 million tons of<br />
oil equivalent (Mtoe), respectively (Table 32 and Table 33) [25, 26]. The most significant<br />
developments in production are observed in hydropower, geothermal, solar energy and coal<br />
production. Turkey‟s use of hydropower, geothermal and solar thermal energy has increased<br />
since 1990. However, the total share of renewables in total primary energy supply (TPES)<br />
has declined, owing to the declining use of non-commercial biomass and the growing role of<br />
natural gas in the system. Turkey has recently announced that it will reopen its nuclear<br />
program in order to respond to the growing electricity demand while avoiding increasing<br />
dependence on energy imports. On the other hand, as of the end of 2005, installed capacity<br />
and generation capacity of power plants reached 41,457MW and 176,234GWh, respectively<br />
(Table 34).<br />
601
602<br />
ENERGY AND SUSTAINABLE DEVELOPMENT IN THE MEDITERRANEAN<br />
Table 33 Present and future total final energy consumption in Turkey (Mtoe) [25, 26]<br />
Gas accounted for 38 % of total electricity generation in 2005, coal 28 % and oil at about 7<br />
%. Hydropower is the main indigenous source for electricity production and represented 27<br />
% of total generation in 2005 (Table 34). Hydropower declined significantly relative to 2000<br />
due to lower electricity demand and to take-or-pay contracts in the natural gas market.<br />
According to Turkish statistics, the share of hydropower in electricity generation increased to<br />
26 % in 2002 [25,65].<br />
Table 34 Electric power capacity development in Turkey [26, 27]<br />
The use of oil has been increasing gradually for the last several decades. Especially keeping<br />
with the pace of globalization and the rapid industrial development of the world, this result is<br />
inevitable in Turkey. Oil is the main source of primary energy consumed. Its share in TPER<br />
was 47 % in 1995 (Table 31) [23]. Because of natural gas, this rate has started to decrease.<br />
Indigenous oil production in 1995 met only 15 % of demand, the rest (85 %) being imported.<br />
Turkish oil consumption has increased in recent years, and this is expected to continue, with<br />
growth of 2-3 % annually in coming years. Oil provides nearly half of Turkey‟s total energy<br />
requirements, but its share is declining (as the shares of NG and hydropower rise).<br />
TPAO by itself provides about 80 % of the Turkey‟s total oil input, which is currently around<br />
56,000 bbl/d, down from 90,000 bbl/d in 1991. In general, Turkey has small oil areas. These<br />
are located in different parts of the country. In the southeast area called Hakkari Basin is<br />
Turkey‟s chief oil-producing area. The oil in other areas is very difficult to find and produce.<br />
Apart from the Hakkari Basin, Turkey provides oil from the Black Sea shelf region, and from<br />
other oil basins in southern and south-eastern regions of the country [168].<br />
Imports of petroleum averaged more than 15 million tons per year in the early 1980s and<br />
increased to about 23 million tons in the early 1990s. Most of Turkey's oil fields are located in<br />
south-eastern Anatolia near the borders with Iran, Iraq, and Syria. Because of the country's<br />
fractured substrata, deposits are often contained in small pockets, which makes exploration<br />
and extraction difficult [166].
TURKEY - National Study<br />
The state-owned oil company, Turkish Petroleum Corporation (TPAO), Shell Oil, and Mobil<br />
control most petroleum output, which had climbed gradually to a peak of 3.6 million tons in<br />
1969 but declined to about 2.1 million tons in 1985 as deposits were depleted. By the early<br />
1990s, output had increased once again to nearly 4.4 million tons. The main petroleum<br />
project during the 1980s was an attempt at secondary recovery at the Bati Raman fields in<br />
south-eastern Anatolia, which were expected to produce roughly 1.5 million tons a year over<br />
a twenty-year period [166].<br />
Five refineries with a total capacity of about 713,000 bpd meet most of the country's need for<br />
petroleum products. Until early 1995, about 85 percent of refinery capacity was in public<br />
hands in four refineries located at Aliaga near Izmir (10 million ton per year), Kocaeli (11<br />
million ton per year), Kirikkale (5 million ton per year), and Batman (1,1 million ton per year).<br />
A fifth refinery, jointly owned by Mobil, Shell Oil, British Petroleum, and a Turkish company, is<br />
located at Mersin (4,4 million ton per year) [166].<br />
In early 1995, Turkey's privatization program appeared to be back on track after a period of<br />
wrangling over the legality of the sale of the state refinery company TÜPRAS and the retail<br />
company Petrol Ofisi. The sale of part or all of each company is scheduled to take place<br />
before the end of 1995 [166].<br />
Petrol Ofisi's 4,000 stations control 56 percent of a domestic gasoline market that since 1987<br />
has grown by an average of 5.5 percent a year to 94,000 bpd. Full privatization was<br />
expected by the end of 1995 but the privatization was actualized in 2000 [166].<br />
Natural gas became important in the 1980s. Gas tapped in Thrace (Trakya, European<br />
Turkey) was piped to the Istanbul region and used to produce electricity, thereby reducing<br />
the need for energy imports from Bulgaria. In 1986 Turkey began construction of a pipeline to<br />
carry Soviet natural gas from the Bulgarian border to Ankara; the line was completed in the<br />
late 1980s. In 1990 government officials announced that they also desired to purchase<br />
natural gas from Algeria, a move that would help balance Turkey's large purchases from the<br />
Soviet Union [166].<br />
Figure 8 Natural gas consumption by sector<br />
In 2000, Turkey consumed 15 billion m 3 of natural gas (Figure 8) [28]. Nearly this entire<br />
amount was imported and was approximately 17 % of Turkey‟s total energy consumption for<br />
the year. Owing to severe economic problems in the last few decades, in addition to<br />
fluctuating prices before Turkey‟s recent severe economic matters, the Turkish natural gas<br />
was anticipated to increase excessively rapidly over the next years, with the most important<br />
consumers anticipated to be natural-gas-fired electric power plants and industrial users.<br />
Total natural gas consumption is projected to increase at an annual rate of 9.6% from 15.0 to<br />
169.4 billionm3 (bcm) over 2000–2025 (Figure 8) [28]. Power sector gas demand is one of<br />
the main drivers for this projected growth and will account for 112.8 bcm or 67% of total gas<br />
consumption in 2025 (up from 9.3 bcm in 2000). Industrial demand is the fastest growing<br />
603
604<br />
ENERGY AND SUSTAINABLE DEVELOPMENT IN THE MEDITERRANEAN<br />
market segment (11.5% annually) with gas expanding from 2.5 to 38.4 bcm during 2000–<br />
2025 and eventually accounting for 23% of total gas consumption (Figure 8) [28].<br />
Natural gas is Turkey‟s chosen fuel for new power plant capacity development due to several<br />
requirements. These are firstly for environmental reasons because gas is less polluting than<br />
coal, lignite, or oil; secondly, for geographic reasons because Turkey is close to very large<br />
amounts of gas in the Middle East and Central Asia; and thirdly, for economic reasons<br />
because Turkey could balance part of its energy import bill through transit fees it could<br />
charge for oil and gas shipments across its territory and seas; and lastly, for political reasons<br />
because Turkey is looking to develop strong relations with Caspian and Central Asian<br />
Countries, some of which are naturally very big gas exporters [15].<br />
Table 35 The sectoral natural gas demand in Turkey, 1990-2020 [30]<br />
Turkish natural gas production was 23 Bcf in 2000. This met around 4 % of domestic natural<br />
gas consumption needs [15]. The sectoral natural gas demand is shown in Table 35 [30]<br />
according to years. This table shows that natural gas consumption in industry has increased<br />
from year to year and this increase tends to proceed. Main natural gas producers in Turkey<br />
are Arco, TPAO, and Shell. Marmara Kuzey (known as North Marmara in English), which<br />
founded in May 1997, is the country‟s largest non-associated gas field. Marmara Kuzey is<br />
placed offshore in the Thrace-Gallipoli Basin of Marmara Sea [15].<br />
Policy makers in the early 1970s had targeted lignite as the most abundant domestic source<br />
of hydrocarbons, and production grew rapidly from an average of about 7.9 million tons for<br />
the 1970-75 period to more than 31 million tons in 1985. Mines operated by the state-owned<br />
Turkish Lignite Company are responsible for about two-thirds of output; private firms produce<br />
the remainder [166]. Production of hard coal is entirely controlled by the government-owned<br />
Turkish Coal Company, which suffers from poor management and outmoded technology.<br />
Coal production is also hampered by the great depth of the country's deposits. Hard coal<br />
output fell from around 6.5 million tons in 1976 to about 3.8 million tons in 1983, and unit<br />
costs exceeded those of coal imports. As a result of these trends, Turkey was beginning to<br />
import coal for use in power plants. In 1992 Turkey produced about 12 million tons of coal<br />
and imported a net of about 4.2 million tons. Between 1990 and 2000, the number of workers<br />
in Turkey‟s coal sector fell from 63,993 to 35,665. Turkish coal is generally of lower than<br />
average quality. It is used mainly for power generation [166].<br />
Coal is a major fuel source for Turkey, used primarily for power generation, steel<br />
manufacturing and cement production. Turkish coal consumption has remained roughly
TURKEY - National Study<br />
stable over the past decade and currently accounts for about 24% of the country‟s total<br />
energy consumption [22]. Turkey is a large producer of lignite (brown coal), which comes<br />
predominantly from deposits in the southwest and the south-eastern Afsin-Elbistan basin.<br />
Lignite extraction is expected to increase as the government feels pressure to close down<br />
unprofitable hard coal mines that are geologically difficult, increasing the cost of extraction.<br />
Furthermore, they have a poor safety record. Opposition to any mine closures by coal miners<br />
is expected unless an adequate compensation plan is arranged with the government [22].<br />
Rich lignite deposits are spread all over the country. Total lignite reserves are estimated at<br />
8075 Mtoe, of which 7339 Mtoe (88%) is economically feasible. 34% of the lignite capacity is<br />
being worked, while 3% is being developed. The total potential is estimated at 105 TWh/year.<br />
Turkey‟s coal potential in 1997 is shown in Table 36 [31].<br />
Table 36 Turkey’s coal potential [31]<br />
Turkey imports significant amounts of hard coal, mainly from Australia, the United States,<br />
South Africa and the former Soviet Union. This coal is used largely to supply Ankara and<br />
three other large municipalities, all of which have chosen to use hard coal rather lignite as a<br />
source of heat and power in order to reduce the large amounts of pollution that result from<br />
lignite burning [22].<br />
In Turkey, electricity is produced mostly by thermal power plants (TPPs), and hydropower<br />
plants (HPPs). The Turkish Electricity Authority (Türkiye Elektrik Kurumu--TEK) is<br />
responsible for most electric power generation and distribution. In Adana the Cukurova<br />
Electrical Company produces some electricity privately. In Kepez, a city in Antalya Province,<br />
another private company produces electricity. Upgrading of the national distribution grid<br />
began in the 1980s, and by 1985 about 70 percent of Turkey's villages were receiving<br />
electricity. The Fifth Five-Year <strong>Plan</strong> (1984-89) called for the completion of village<br />
electrification by 1989; by the mid-1990s no village was without electricity.<br />
Table 37 Electricity production from thermal and hydropower sources according to years in Turkey [41]<br />
and [42,43] a<br />
a Refs. [42, 43].<br />
Demand for electricity has increased rapidly, in large part because of the growth of industry<br />
(Figure 9). By 1980 thermal plants produced 51% of total installed capacity while 75% of total<br />
electricity was generated from TTPs in 2003 (Table 31) [41] and [42,43] a ; hydroelectric plants<br />
produced the remainder. During the early 1980s, shortages of electricity had to be covered<br />
with imports from Bulgaria and the Soviet Union. In 1984 Turkey and the Soviet Union<br />
agreed to build a second transmission line that would allow future increases in Soviet<br />
electricity deliveries. Although in the 1990s electricity imports meet less than 1% of Turkey's<br />
605
606<br />
ENERGY AND SUSTAINABLE DEVELOPMENT IN THE MEDITERRANEAN<br />
needs, the Turks want to be independent of supplies from unreliable neighbours. The<br />
installed capacity and electricity generation by the main energy resources of Turkey in 1994<br />
is given in Table 38 [32] and sectoral electrical energy consumption development between<br />
1990 and 2002 is given in Table 39 [27].<br />
Consumption (GWh)<br />
600000<br />
500000<br />
400000<br />
300000<br />
200000<br />
100000<br />
0<br />
Figure 9 Turkey’s electricity consumption and demand forecast by sectors<br />
Industry<br />
Turkey's electricity consumption and demand forecast<br />
Household<br />
Transportation<br />
Agriculture<br />
Total<br />
1970<br />
1973<br />
1976<br />
1979<br />
1982<br />
1985<br />
1988<br />
1991<br />
1994<br />
1997<br />
2000<br />
2003<br />
2006<br />
2009<br />
2012<br />
2015<br />
2018<br />
Years<br />
Turkey's chronic energy shortages make development of hydroelectric power imperative. In<br />
1994 the General Directorate of State Hydraulic Works was building or planning to build<br />
about 300 hydroelectric plants. The centre-piece of Turkey's ambitious hydroelectric<br />
program, the Southeast Anatolia Project, which includes dams on the Tigris and Euphrates<br />
rivers, will increase Turkey's irrigable land about 25 percent and its electricity-generating<br />
capacity about 45 percent. As of early 1987, the first two of the three large dams in the<br />
program (the Keban Dam and the Karakaya Dam, both on the Euphrates, northeast of<br />
Malatya) had been built, and the third, the Atatürk Dam, was under construction, completed<br />
in 1994. The World Bank refused to help finance the construction of the Atatürk Dam<br />
because Turkey had not reached an agreement on sharing the water of the Euphrates River<br />
with Syria and Iraq; Turkey, however, arranged independent financing. An historical<br />
summary of installed energy generating capacity in Turkey is shown in Table 40 [35,36] and<br />
a historical summary of electricity generation and consumption in Turkey is shown in Table<br />
35 [35,36]. MENR has planned for a very large increase in electric generating capacity over<br />
the next 20 years. The largest growth is planned for natural gas-fired generation.
TURKEY - National Study<br />
Table 38 Main energy resources used for electricity generation in Turkey during 1994 [32]<br />
Table 39 Sectoral electrical energy consumption development between 1990 and 2002 [27]<br />
Energy is the basic building block of economic development. Electricity is the most flexible<br />
form of energy that constitutes one of the vital infra-structural inputs in social-economic<br />
development.<br />
Parallel to the Energy Market Licensing Regulation and the Electricity Market Tariffs<br />
Regulation in August 2002 being put into effect, restructuring of the Turkish electricity market<br />
has gained a big importance.<br />
Table 40 Installed energy generation capacity in Turkey between 1990-2001 (in 1000 MW) [35,36]<br />
a combustion properties can be seen in [ 37].<br />
Table 41 Electricity generation and consumption in Turkey, 1990-2001 (in 10 6 kWh) [35,36]<br />
1.3 Impa cts and risks of th e observed and f ore cast evo l u t ions<br />
Turkey has been undergoing major economic changes in the 1990s, market by rapid overall<br />
economic growth and structural changes. However, the share of the informal sector in the<br />
Turkish economy remains high. Turkey‟s population has reached 72 million and remains one<br />
of the fastest growing from 1990 to 2004 in the OECD. Major migrations from rural areas to<br />
607
608<br />
ENERGY AND SUSTAINABLE DEVELOPMENT IN THE MEDITERRANEAN<br />
urban, industrial and tourist areas continue. In this context, Turkey confronts the challenge of<br />
ensuring that economic growth is associated with environmental and social progress, namely<br />
that its development is sustainable [9].<br />
Figure 10 Historical and forecasted values of CO2 emissions by sectors [28]<br />
Turkey ratified the Framework Convention on Climate Change in February 2004 and is<br />
developing its climate change strategy [24]. After that, on May 24, 2004 Turkey became the<br />
189 th party by signing Framework Convention on Climate Changes. In the first 6 months after<br />
Turkey became a party of FCCC, the country is obligated to first national declaration to<br />
United Nations General Secretariat until November 24, 2004. After this stage is completed<br />
Turkey will both have to fulfil new liabilities such as to present national GHG inventories and<br />
national declaration reports to Convention Secretariat regularly, and will also actively<br />
participate in efforts carried on global wide so that convention will achieve its ultimate goal<br />
[24]. In 2003, it is estimated that 36 % of CO2 emissions occurred due to energy, 34 % due to<br />
industry, 15 % due to transportation and 14 % due to other sectors such as housing,<br />
agriculture and forestry and in 2020 40 % will occur due to energy, 35 % due to industry, 14<br />
% due to transportation and 11 % due to other sectors [25, 65]. Figure 10 [28] shows the<br />
historical and forecasted values of CO2 emissions by sectors and Figure 7 shows the total<br />
CO2 emissions.
CO2 Emission (million ton)<br />
1000<br />
900<br />
800<br />
700<br />
600<br />
500<br />
400<br />
300<br />
200<br />
100<br />
0<br />
TURKEY - National Study<br />
Figure 11 Historical and forecasted values of the total CO2 emissions<br />
1970<br />
1973<br />
1976<br />
1979<br />
1982<br />
1985<br />
1988<br />
1991<br />
1994<br />
1997<br />
2000<br />
2003<br />
2006<br />
2009<br />
2012<br />
2015<br />
2018<br />
2021<br />
2024<br />
Years<br />
Turkey‟s demand for energy and electricity is increasing rapidly. Since 1990, energy<br />
consumption has increased at an annual average rate of 4.3% [24]. As would be expected,<br />
the rapid expansion of energy production and consumption has brought with it a wide range<br />
of environmental issues at the local, regional and global levels [28]. With respect to global<br />
environmental issues, Turkey‟s carbon dioxide (CO2) emissions have grown along with its<br />
energy consumption. Emissions in 2000 reached 211 million metric tons [26, 65]. Table 42<br />
shows direct GHG emissions in Turkey by sectors between 1990 and 2010 [54]. Total CO2<br />
emissions increase at an average rate of 5.8%/yr and reach 871 million t/yr by 2025 (Figure<br />
11) [28]. The industrial contribution changes the most noticeably, rising from 31% to 42%<br />
driven by the high growth in industrial final energy as well as the continued reliance on solid<br />
and liquid fuels in this sector [28].<br />
Total national SO2 emissions reach their low point as 1.83 million ton/yr in 2001, but it will be<br />
more than double value to 3.85 million ton/yr in 2025. The majority of the emissions growth<br />
can be attributed to an increase in industrial solid fuel and fuel oil combustion and an<br />
associated rise in SO2 emissions from 566-2411 kt/yr over 2000-2025. By 2025, industry is<br />
expected to be responsible for 63% of turkey‟s SO2 emissions [54]. While in 2004, electricity<br />
generation accounted for 60% of national sulphur emissions, this share will be down to 24%<br />
by 2025. This is in large part because coal generation stays more or less constant while<br />
several new sulphur controls are already commissioned and expected to come on-line in the<br />
very near term.<br />
Air pollution is becoming a great environmental concern in Turkey. Air pollution from energy<br />
utilization in the country is due to the combustion of coal, lignite, petroleum, natural gas,<br />
wood and agricultural and animal wastes. On the other hand, owing mainly to the rapid<br />
growth of primary energy consumption and the increasing use of domestic lignite, SO2<br />
emissions, in particular, have increased rapidly in recent years in Turkey. The major source<br />
of SO2 emissions is the power sector, contributing more than 50% of the total emissions. As<br />
given in the literature [46,57], SO2 concentrations in the flue gas of some lignite fired power<br />
stations are extremely high and differ notably between power plants, owing to the variation of<br />
the sulphur content of the fuels. Although the NO2 emissions are lower than the SO2<br />
emissions in Turkey, they have likewise increased rapidly, following the growth of energy<br />
requirements. Contrary to the development of SO2 emissions, a similar upward trend of NO2<br />
emissions has been observed in many European Community countries as well, resulting<br />
609
610<br />
ENERGY AND SUSTAINABLE DEVELOPMENT IN THE MEDITERRANEAN<br />
mainly from increased traffic density. Also, in Turkey, nearly 50% of the total NO2 emissions<br />
are from the transportation sector, while less than 20% are caused by power generation. Per<br />
capita NO2 emissions are still much lower in Turkey than in the European Community<br />
countries, i.e. less than one-third of these countries average.<br />
Table 42 Direct greenhouse gas emissions in Turkey by sectors between 1990 and 2010 (%) [54]<br />
The main pollutants associated with energy use are sulphur oxides (SOx), nitrogen oxides<br />
(NOx) and total suspended particulates (TSP). In Turkey, these emissions come mostly from<br />
the combustion of coal (especially high sulphur domestic lignite), oil products and fuel-wood.<br />
The latter is especially responsible for indoor air pollution.<br />
SO2 and TSP levels have decreased in some big cities (such as Ankara, Istanbul and Bursa),<br />
thanks to fuel switching from lignite to imported coal or gas for residential uses (Table 43)<br />
[55]. However, overall emissions have grown significantly and many millions of people,<br />
especially in smaller cities where gas distribution networks do not yet exist, remain exposed<br />
to pollutant levels that exceed World Health Organization standards [57]. This causes health<br />
problems, including respiratory diseases, and, hence, increased hospitalization costs,<br />
restricted activity days and shortened life expectation.<br />
In 2000, Turkey emitted 1.98 million tones of SOx, an amount roughly equivalent to that of<br />
1998 [46]. SOx emissions grew about fivefold from 1982 to 1990, but since then, they have<br />
grown at a slower rate. Per capita emissions in 2000 were 30.1 kg, below the OECD average<br />
of 39.3 kg. On the other hand, emissions of NOx totalled about 950 million tones and have<br />
been accelerating since the early 1990s. Per capita emissions (15 kg) are substantially below<br />
the OECD average (40.5 kg).
TURKEY - National Study<br />
Table 43 Winter season air pollution trends in Turkish cities [55]<br />
Coal use in thermal power plants to produce electricity is a significant source of pollution.<br />
The industrial sector is also an important contributor. In 2000, coal and lignite accounted for<br />
about 32% of total electricity production and for 33% of final energy consumption in the<br />
industrial sector. Low quality and high sulphur lignite is used especially in electricity<br />
generation. In 2000, the electricity production sector emitted 1.32 million tones of SO2, 0.19<br />
million tones of NOx and 0.16 million tones of particulates. On the other hand, base case<br />
projections by MENR [103] for electricity demand indicate an increase by a factor of two and<br />
a half by 2012, which will have to be met by 41 GW of new capacity. Of this capacity, 19% is<br />
expected to be fuelled by lignite and another 3% by imported coal for a total of 8.6 GW of<br />
new coal capacity. As current coal fuelled capacity is about 8.36 GW, this would mean nearly<br />
tripling the present use of lignite and hard coal for electricity generation. Over the same<br />
period, consumption of lignite in the industrial sector would increase by about 50% and<br />
consumption of hard coal (mostly imported) by about 160%. If the projected increases in coal<br />
use are not met with adequate investments in SO2, NOx and TSP abatement technologies,<br />
the resulting emissions could more than double [171].<br />
Other significant sources of SOx, NOx and TSP are high sulphur fuel oil use in power<br />
generation and industry and automotive fuel use in transport. The latter, in particular, is<br />
bound to increase rapidly in the next two decades. The transport sector is dominated by road<br />
transport, and vehicle ownership is increasing fast [171]. On the other hand, capacity<br />
utilization of available rail lines for passenger transport is very low for inter-city traffic and<br />
higher for suburban lines, suggesting that the construction of new mass transportation<br />
systems needs to concentrate on large metropolitan areas and take account of consumer<br />
preferences. Although the projected growth of energy demand in transport is not nearly as<br />
fast as that in the power generation and industrial sectors, the growth potential for pollutant<br />
emissions is large. Characteristically, the transport sector produces emissions of lead and<br />
carbon monoxide besides the other usual pollutants [46,103].<br />
Table 44 shows the calculated CO2 and CH4 emissions for the main sectors, such as energy<br />
and cycle, industry, transportation, households and others in Turkey. Table 45 also shows<br />
the total emission estimates with five year intervals in the country.<br />
Table 44 Estimated CO2 and CH4 emissions in different energy-consuming sectors in Turkey<br />
611
612<br />
ENERGY AND SUSTAINABLE DEVELOPMENT IN THE MEDITERRANEAN<br />
Table 45 Total emission estimates with five year intervals in Turkey (Mg/year)<br />
Owing to considerable variation observed in the runoff in terms of seasons, years and<br />
regions, it is absolutely necessary on the major rivers in Turkey to have water storage in<br />
order to ensure the use of the water when it is necessary. Consequently, for these reasons,<br />
priority has always been given to the construction of water storage facilities, and significant<br />
progress has been registered in the construction of dams throughout the 48 years that have<br />
elapsed since the establishment of the State Hydraulic Works (DSI). Table 46 [56] shows<br />
water resources in Turkey. On the other hand, with the projects developed primarily by the<br />
DSI and other institutions engaged in water resource development, actual water consumption<br />
in Turkey as of 2002 reached about 40 km 3 , which corresponds to only 36.3% of the<br />
economically exploitable water potential, of which 29.4 km 3 (75%) has been for irrigation, 5.9<br />
km 3 (16%) for domestic uses and 4.7 km 3 (9%) for industrial uses [56].<br />
The south-eastern Anatolia Project (GAP) is one of the largest power generating, irrigation<br />
and development projects of its kind in the world, covering 3 million ha of agricultural land.<br />
This is over 10% of the cultivable land in Turkey [171]. The land to be irrigated is more than<br />
half of the presently irrigated area in Turkey. GAP is an integrated development project. It is<br />
expected to affect the entire structure of the region in its economic, social and cultural<br />
dimensions through a process of transformations to be triggered by agricultural<br />
modernization. The GAP project on the Euphrates and Tigris Rivers encompasses 22 dams,<br />
and once completed, 1.7 million ha will be irrigated [104]. Table 47 [137] shows the GAP and<br />
Turkey comparative figures for hydropower.<br />
Table 46 Water resources in Turkey [56]
TURKEY - National Study<br />
Table 47 The GAP and Turkey comparative figures for hydropower [137]<br />
Water consumption was 34 billion m3 in 1996 (17% of total freshwater resources), 28 billion<br />
m 3 of which was supplied from surface waters and the remainder from groundwater.<br />
Seventy-six percent of that volume was used for irrigation, followed by drinking water (14%)<br />
and industrial uses (10%). This corresponds to an annual consumption of drinking water of<br />
about 74 m 3 per capita, compared to about 100 m 3 in Europe The overall status of water<br />
supply in Turkey is good. However, access to piped water can be a problem for a particular<br />
segment of the population [171]. Nearly 100% of urban dwellers but only 85% of rural<br />
residents have access to safe drinking water. Moreover, water supply is also a problem for<br />
new residents in peripheral and/or illegally settled areas of Turkey‟s cities [105].<br />
Water demand is expected to increase due to agricultural uses. The DSI estimates that the<br />
amount of water needed in 2010 will be 55 billion m 3 , of which 78% will be for irrigation, 13%<br />
for urban and 9% for industry [171]. For example, 4.5 million ha of agricultural land are<br />
currently irrigated, which is 16% of all agricultural land and 17% of all potentially irrigable<br />
land. It is possible to irrigate about 26 million ha of agricultural land although only 8.5 million<br />
ha of which will be economically viable. Since new investments are being made for irrigation,<br />
drinking water, industry and energy, incentives should be adopted to discourage irrigation in<br />
non-economical land [56].<br />
Table 48 Industrial waste water pollution load in Turkey (1997) [57]<br />
Only 6% of the population is served by sewage treatment compared to an OECD average of<br />
63%. In 1992, industry and manufacturing discharged 843,334,071 m 3 of waste water and<br />
70,350,019 m 3 of sewage. 69% of the waste water was not treated, 18% received some<br />
treatment and 13% received some pre-treatment. With regard to sewage, 58% was<br />
discharged with no treatment. Table 48 [57] gives the pollution load for selected wastes<br />
(biochemical oxygen demand (BOD), chemical oxygen demand (COD), heavy metals) for all<br />
public and private enterprises that did not have treatment facilities. Public enterprises<br />
produced a sizable amount of the waste water pollution load: parastatals generated 57% of<br />
the BOD, 51% of the COD and 42% of heavy metal pollution. Seventy-four percent of<br />
industrial waste water from state enterprises was discharged without any treatment. Another<br />
problem is that waste water treatment facilities are inefficiently managed [171].<br />
Contaminants such as heavy metals have a tendency to accumulate in biota by adsorption or<br />
absorption. In general, heavy metals, such as Fe, Cu, Zn, Co, Mn, Cr, Mo, V, Se and Sn, are<br />
known to be essential for living organisms, but, although suitable concentrations may be<br />
prerequisites for survival, they also form as inhibitors of enzymatic functions when natural<br />
levels are exceeded. Other metals, such as Ag, Hg, Cd and Pb, are toxic and inhibit<br />
enzymatic systems [171]. Heavy metal levels in marine organisms are also a potential<br />
hazard for humans through sea food consumption. On the other hand, heavy metals are<br />
613
614<br />
ENERGY AND SUSTAINABLE DEVELOPMENT IN THE MEDITERRANEAN<br />
introduced through rivers or the direct discharge of industrial waste into the Black Sea. In<br />
addition, heavy metal pollution levels in the Black Sea are exacerbated by oil pollution and<br />
airborne contaminants.<br />
Table 49 Heavy metal concentrations (μgg -1 dry wt) in fish samples [58]<br />
Moreover, especially in the western Black Sea, there is additional pollution from chemical<br />
wastes from the barrels discharged by ships [106].<br />
Table 49 [58] shows that the Turkish Black Sea coast is facing heavy metal pollution. The<br />
metal concentrations in macro-algae, sea snail, mussel and sediment samples are very high.<br />
However, Cd, Pb and Cu concentrations in anchovy fish decreased, while Co, Fe, Zn, Cr, Mn<br />
and Ni contents had changed when compared with previous data. The data for heavy metals<br />
in fish species are presented in Table 49 [58].<br />
1.4 Financ ing and Inve s t ment Needs<br />
In 1996, 5.9 billion US$ were invested in the Turkish economy, 24% of which were in the<br />
energy sector. TEAS had a 51% share in the electricity investment program-719 million US$.<br />
56% of its investment was in generation, 34% in transmission lines and 10 % in other<br />
equipment [22].<br />
Meeting national demand in accordance with Turkey‟s economic targets requires allocating<br />
sufficient finances for investments in the energy sector.<br />
Long term planning studies indicate a heavy burden of investments between 1996 to 2010,<br />
amounting to some 68 billion US$. Turkey‟s funding needs for the energy sector is the<br />
highest of the southern and eastern <strong>Mediterranean</strong> countries. The needs of each energy<br />
sector are [22]:<br />
Electricity: 56 billion US$ (82%),<br />
Gas: 6 billion US$ (9%),<br />
Oil: 4 billion US$ (6%),<br />
Solid fuels: 1 billion US$ (1%).<br />
The total investment required for power plants and distribution lines up to 2010 is expected to<br />
be around 45 billion US$, 19 billion of which will be under the BOT and BOO models [22].<br />
The huge size of this investment makes it impossible to lay the burden entirely on public<br />
finances. Private capital has to be introduced into Turkey‟s electricity sector to meet these<br />
requirements. Table 50 [59,60] shows the unit energy costs of the technological groups in the<br />
years 1995 and 2020 and Table 51 [61] shows net power generating costs of the year 2005.
TURKEY - National Study<br />
Table 50 Unit energy cost (1US$-Є) [59,60]<br />
Of the total hydropower potential of 430 Th/year, 122 Th/year, the economically feasible<br />
potential, is currently used. <strong>Plan</strong>s for the rational use of Turkey‟s hydropower are already<br />
completed, and 55 PPs with a total capacity of 7.1 GW, comprising 20% of the total hydro<br />
power capacity, will soon be tendered under the BOT model.<br />
Table 51 Net power generating cost by energy input [61]<br />
11 GW of capacity, using lignite, NG and hard coal is planned to be constructed by 2010.<br />
Investment needs in the coal sector for the period 1995-2010 will be around 1.2 billion US$.<br />
The two major projects are the extension of the Oal Tees mine and the project at Mugla-<br />
Husamlar. Investment requirements in the oil sector are expected to be around 4.3 billion<br />
US$, 65% for oil pipeline projects and 30% for refining over the same period [22].<br />
The average setup costs for energy sources is given in Table 52 [143] and the marginal<br />
costs for the sources are given in Table 53.<br />
Table 52 Setup costs for the energy sources<br />
615
616<br />
ENERGY AND SUSTAINABLE DEVELOPMENT IN THE MEDITERRANEAN<br />
Table 53 Comparison of marginal costs<br />
2. Rational Energy Use and Renewable Energies<br />
2.1 RUE and RE Policies<br />
The electricity losses come from the transmission and distribution systems. The loss in the<br />
transmission line of Turkey is about 2.5-3%, which is within world standards. However, the<br />
distribution loss is considerably high at 15%. Concerning the TOOR of electricity distribution<br />
facilities to private sector. It is expected that the distribution losses will be reduced.<br />
Cogeneration, or auto-production, is known as Combined Heat and Power (CHP), which has<br />
been developed by governmental support to support the continuing need for additional<br />
electricity generation. There were only for cogeneration plants in operation in 1994, with a<br />
total capacity of only 30 MWe. Since then, incentives were offered by TEDAS in the form of a<br />
100 % tax deduction, duty exemptions for auto-production facilities, and guaranteed<br />
purchasing of any surplus electricity [15]. By mid-2001, this has been improved in Turkey so<br />
much that, there were 90 operating cogeneration plants with a total capacity of 2060 Mwe,<br />
and 153 cogeneration plants representing another 10,400 MWe, under evaluation by the<br />
MENR. These are usually located in the so-called „„Organized Industrial Zones‟‟ or „„OSBs‟‟.<br />
The total installed cogeneration capacity was expected to reach up to 6000 MWe by 2005<br />
[15]. That means it will represent about 20 % of Turkey‟s total installed electricity generating<br />
capacity.<br />
However, the government needs to audit major energy users to discover which could cut<br />
back consumption. In addition, a shift in relative energy prices to reflect long-run costs might<br />
induce industrial restructuring that would take Turkey's energy endowment into account.<br />
Moreover, energy policy makers need to improve management of firewood and agricultural<br />
wastes, which continue to play an important role in the rural energy economy.<br />
In 1995 National Energy Conservation Centre (NECC), with the participation of the European<br />
Union, completed a modelling system to have better forecast consumption in the industry<br />
residential building and transport sectors in order to determine energy savings measures<br />
better. According to results, the NECC estimated that 13.2 Mtoe could be saved annually in<br />
Turkey.<br />
TS 825 is a standard that related with the rules of heat transfer insulation of building is<br />
revised in 1998. So the heat loss came nearly to the same level with European countries not<br />
as low as Germany‟s heat loss level. The number of buildings is nearly 400,000 in 2005 and<br />
the saving energy are totally 1,220,000,000$ after 2000 [165].<br />
Renewable energy supply in Turkey is dominated by hydropower and biomass, but<br />
environmental and scarcity-of-supply concerns have led to a decline in biomass use, mainly<br />
for residential heating. Total renewable energy supply declined from 1990 to 2004, due to a<br />
decrease in biomass supply. As a result, the composition of renewable energy supply has<br />
changed and wind power is beginning to claim market share. As a contributor of air pollution<br />
and deforestation, the share of biomass in the renewable energy share is expected to<br />
decrease with the expansion of other renewable energy sources [25,107].<br />
Turkey spent a total of US$ 120 million (2005 prices and exchange rates) on government<br />
energy RD&D between 1980 and 2005. In this period, 15.6% of its total energy research and<br />
development (R&D) budget (US$ 17.4 million) was allocated to renewable energy.
TURKEY - National Study<br />
Government R&D expenditures for renewables followed the general trend in overall energy<br />
R&D expenditures, rising in the late 1980s and falling in the early 1990s. Public funding<br />
increased substantially in 1997.<br />
Among the renewable technologies, geothermal received the most sustained funding over<br />
the past two decades and the highest level of funding, equivalent to US$6.1 million or 37% of<br />
the renewables R&D expenditures between 1980 and 2005. In addition, Turkey participates<br />
in international collaborative R&D in Photovoltaic Power Systems through the IEA<br />
Implementing Agreements [26,108].<br />
Market deployment policies for renewables started in 1984 with third-party financing, excise<br />
and sales tax exemptions. Capital grants were offered in 2001. The Turkish government‟s<br />
approach to the deployment of renewables reflects its priorities to develop indigenous and<br />
renewable resources in conjunction with the expansion of privately owned and operated<br />
power generation from renewable sources [107].<br />
The build-own-transfer (BOT) and the build-own-operate (BOO) schemes were put it place in<br />
1984 and financed major power projects (not limited to renewables) with the main objective<br />
of attracting private investors [24]. BOT projects were granted a treasury guarantee.<br />
Although BOT and BOO approaches attracted significant investment, they also created large<br />
contingent public obligations with the government covering the market risk through take-orpay<br />
contracts [24]. The economic crisis of 2000 and pressure from the International Monetary<br />
Fund, however, brought an end to the treasury guarantees, except for the 29 BOT projects<br />
whose contracts were already in place. The BOT and BOO financing schemes ended in 2000<br />
and were replaced in 2001 by financial incentives within the framework of electricity Market<br />
Law contains two regulations pertaining to the promotion of the use of renewable energy<br />
[107]:<br />
Entities applying for construction licenses for renewable energy facilities only pay 1% of the<br />
total license fee. In addition, renewable energy generation facilities do not pay annual license<br />
fees for the first 8 yr after the facility completion date specified in the licenses.<br />
The Turkish Electricity Transmission Company (TEIAS) and/or distribution companies are<br />
required to assign priority status for grid connection of renewable generating facilities.<br />
The real beginning for renewable energy policy was the definition of renewable energy<br />
sources in the decree of the Modification of the License Regulation in the Electricity Market in<br />
2003 [24]. Before then, there was no national renewable energy policy and few government<br />
incentives existed to promote market deployment of renewable energy. However, the<br />
Electricity Market Licensing Regulation, in itself, is not expected to be sufficient to overcome<br />
the high investment cost, risk and lack of security associated with the entrance of renewable<br />
power plants into the electricity market [25,107].<br />
Turkey is to be recipient of a US$202 million renewable energy loan provided by the World<br />
Bank to be disbursed as loans via financial intermediaries to interested investors in building<br />
renewable energy sourced electricity generation [24]. These loans are expected to finance<br />
30-40% of associated capital costs. The aim of the Renewable Energy Program is to<br />
increase privately owned and operated power generation from renewable sources within a<br />
market-based framework, which is being implemented in accordance with the Electricity<br />
Market Law and the Electricity Sector Reform Strategy [24]. This program will assist the<br />
Directorate of the Ministry of Energy and Natural Resources (MENR) in the preparation of the<br />
renewable energy law, as well as to define the required changes and modifications related to<br />
legislation such as the Electricity Market Law to better accommodate greater private sector<br />
involvement [26,65].<br />
The loan that mentioned above is open from World Bank side the usage of this credit is like<br />
this. First of all, the investor comes to Ministry of Energy and Natural Resources and take the<br />
license to produce energy with any renewable method. After that if the government gives the<br />
license the investor applies to World Bank Credit Fund. At the same time if the fund gives the<br />
credit the investment is made. But the problem is this the energy prices of 1 kW from natural<br />
gas combined power plant is 7 cent to government. But the cost of 1 kW from renewable<br />
617
618<br />
ENERGY AND SUSTAINABLE DEVELOPMENT IN THE MEDITERRANEAN<br />
energy power plant is 13 or 15 cent. Due to this situation the investor wants from government<br />
to guarantee to buy whole energy produced. The current rules and policies of Ministry of<br />
Energy and Natural Resources are to get cheaper cost the energy. But the government does<br />
not want to get the whole energy produced from the investment. This conflict situation would<br />
be solved in near future.<br />
The MENR, together with the Electrical Power Resources Survey and Development<br />
Administration (EIEI), currently are engaged in the preparation of renewable energy and<br />
energy efficiency laws. The renewable energy law is expected to be adopted by the second<br />
quarter of 2004 [24]. It is anticipated that the law will institute measures such as feed-in tariffs<br />
and investment incentives. On the other hand, there is significant renewable energy<br />
opportunity in Turkey, but few measures have been employed to tap into that potential. Since<br />
the 1980s, Turkey‟s energy policy has concentrated on efforts to stimulate private investment<br />
to meet the increasing internal energy demand [26].<br />
2.2 Ins tr ume n ts and measures to be taken in fa vo u r of R UE and<br />
RE<br />
In Turkey‟s case, where government expenditure has to be tightly controlled, it is important<br />
that the most cost-effective resources to be developed. Therefore, the government should<br />
attempt to develop competitive renewable energy supplies first, and provide base support for<br />
renewable energy, if necessary, on cost-effectiveness.<br />
Turkey‟s renewable energy policies are being improved. Currently, there are a few<br />
Government-backed incentives to promote renewable energy investments. There are also<br />
some non-Ministerial agencies responsible for various aspects of energy policy (Table 54)<br />
[139].<br />
The MENR is preparing a draft legislation which would allow certain renewable energy<br />
projects (mainly geothermal and wind, but also solar, wave, waste and landfill gas only) to be<br />
built and operated by the private sector, and provide incentives for such system. This<br />
legislation would also set the buy-back rates for renewable electricity. MENR has announced<br />
a target for wind energy, namely 2% of the total installed capacity by 2005. There is some<br />
municipal support in the area of geothermal heat as well. Private sector involvement in<br />
renewable energy promotion exists predominantly in the wind energy and small-scale solar<br />
projects [139].<br />
All, the Ministry of Energy and Natural Resources (MENR), the State <strong>Plan</strong>ning Organization<br />
(DPT) and the Electric Power Resources Survey and Development Administration (EIEI) are<br />
involved in renewable energy promotion policies. Some promotions and related policies exist<br />
with respect to the development and implementation of geothermal heat and solar thermal<br />
energy production. Low-interest loans up to 45% of the capital cost are applicable to<br />
appropriate investments [16].
TURKEY - National Study<br />
Table 54 Non-Ministerial agencies responsible for various aspects of energy policy [139]<br />
Until recently, Free Market Law of Electricity, the price of energy was decided as a result of<br />
negotiations between energy production company and the state which is buyer [16]. This was<br />
a kind of incentive. Now, the price of the renewable energy will have to obey the market<br />
conditions.<br />
Financing of R&D projects are offered via national funds by DPT, TUBITAK-TIDEB and<br />
research funds of universities. The budgets are quite small. International co-operation is<br />
sought not only in terms of funds but also in terms of know how exchange [139].<br />
The Technology Monitoring and Evaluation Board (TIDEB) of TUBITAK has R&D assistance<br />
program for industrial companies. This includes a financial contribution by the Scientific and<br />
Technical Research Council of Turkey and by the Undersecretary of Foreign Trade for up to<br />
60% of the total eligible cost incurred over the duration (up to 36 months) of an individual<br />
R&D project [16].<br />
Low-interest loans are provided by the Technology Development Foundation of Turkey<br />
(TTGV) within the scope of the decree.<br />
Two other legal and administrative incentives to promote R&D are: The Decree on<br />
Investment Incentives. The decree covers R&D, environment, quality improvement and small<br />
medium-sized enterprises (SMEs) [16].<br />
A tax credit for R&D expenses that makes it possible to postpone payment of annual<br />
corporate taxes for three years without interest up to an amount equivalent to 20% of R&D<br />
expenses [16]. Another fund for R&D studies are provided by the State <strong>Plan</strong>ning<br />
Organization to relevant university departments for infrastructure developments. Some<br />
support is also provided to industry by Electrical Power Resources Survey and Development<br />
(EIEI).<br />
Technology Monitoring and Evaluation Board (TI˙DEB) of TUBITAK, Electrical Power<br />
Resources Survey and Development (EIEI) and DPT act as implementing agencies. The<br />
applicable ministries have some actions as well. At present, about 15 types of legal and<br />
administrative incentives exist to promote R&D, including above mentioned: The Decree on<br />
Investment Incentives for small and medium-sized industries (SMES‟s), A tax credit for R&D<br />
expenses [16]. The main renewable energy resources being supported are solar,<br />
geothermal, and wind. Other R&D on the demonstration of advanced bio-fuels technology,<br />
such as electricity generation from biomass and liquid bio-fuel production are also underway<br />
[16].<br />
619
620<br />
ENERGY AND SUSTAINABLE DEVELOPMENT IN THE MEDITERRANEAN<br />
Turkey has joined European Community (EU) Sixth Frame project. There are many projects<br />
opportunities in this program about renewable energy. Turkey‟s universities and research<br />
institutes began to offer project proposal.<br />
Until recently, The Government State Owned defined the energy prices. The energyselling<br />
price is much higher than OECD countries [16]. As far as tax is concerned, Turkey seems<br />
one of the leading nations to put higher taxes on electricity bills, petroleum and other energy<br />
types. With recent constitutional and legislative changes, it is expected that energy prices will<br />
be defined naturally in the free market, supervised by the independent regulatory bodies.<br />
Until recently, the price and the amount of the energy, which is produced by the renewable<br />
power plant was negotiated and accepted by the Ministry of Energy and Natural Resources.<br />
With the new Energy Market Law, the price and amount of energy purchased will be defined<br />
under the free electricity market conditions.<br />
The numbers of solar and geothermal thermal energy applications in Turkey have been<br />
increasing in spite of the lack of specific subsidization. The utilization of biomass except<br />
wood is being promoted as well.<br />
2.3 Energy E f fi ciency E vo l u ti on<br />
The industrial sector accounted for 40% of total final energy consumption and for 54% of<br />
electricity consumption in 2000, while the agriculture, household and services sectors<br />
together accounted for 40% of final energy consumption and 46% of electricity consumption.<br />
Although all four sectors have important potential for energy conservation, industry has been<br />
targeted as a priority area for energy conservation programmes owing to the projected rapid<br />
expansion of industrial energy demand. On the other hand, the structure of industry in Turkey<br />
is energy intensive.<br />
In Turkey, the per capita energy consumption (measured as TPES/population) in 1998 was<br />
equal to 1.11 ton of oil equivalent (toe), much less than the average of 5.10 toe for all IEA<br />
countries [103], but its growth is much faster than the IEA average and is projected to remain<br />
fast in the coming two decades as the economy develops. Energy intensity (measured as<br />
toe/$1000 GDP at 1990 prices and exchange rates) in 1998 was 0.35 toe, compared with an<br />
IEA average of 0.24 toe, and has increased slowly in recent years. If purchasing power<br />
parities are used, Turkey‟s energy intensity fell well below the IEA average. On the other<br />
hand, the government acknowledges the need to reduce the energy intensity of GDP and to<br />
improve the energy efficiency of the economy.<br />
According to estimates of the MENR, Turkey has an energy conservation potential equal to<br />
12–14 Mtoe/year, or nearly 15–20% of total consumption in 1998, and therefore, $3 billion<br />
could be saved through conservation measures in three main end-use sectors [45,136].<br />
Within the industrial sector, iron and steel manufacturing (about 35% of industrial energy<br />
use) and cement production (about 20%) are by far the largest energy users. However, the<br />
petrochemical industry, the fertilizer industry, the textile industry, ceramic products and paper<br />
manufacturing, as well as sugar production, are also major users. According to the MENR,<br />
the potential for conservation in these sectors ranges from 20% to 40% in the country.<br />
On the other hand, in 1996, a study of the MENR assessed the potential for energy<br />
conservation in industry at 4.2 million toe (nearly 25% of industrial energy use for that year)<br />
and an approximate cash value of $1 billion/year. The total investment required to achieve<br />
this conservation potential would be close to $2.4 billion. The payback period for these<br />
investments would range from a minimum of one year to a maximum of three years. The<br />
measures required to bring these savings about would include the adoption of various forms<br />
of waste heat recovery, increased use of cogeneration of electricity and heat/steam and the<br />
use of more efficient boilers.<br />
In the residential/commercial sector, more than 70% of the energy consumed is used for<br />
heating. Energy use per unit of building area could be reduced by nearly half through the<br />
application to all buildings of the new Heat Insulation Standards on building envelopes,<br />
issued in 2000 [136]. While existing buildings require 200–250 kWh/m 2 , the new standards
TURKEY - National Study<br />
could bring requirements down to 100–150 kWh/m 2 . At current rates of building stock<br />
turnover, the estimated energy efficiency gains could take several decades to materialise. In<br />
addition, according to a study conducted in the framework of the World Bank‟s ESMAP<br />
programme [103], major efficiency improvements are also possible in power generation by<br />
increasing power plant size from the existing average of 150–340 MW (coal fired units) by<br />
requiring higher efficiency specifications for new plants and by increasing the use of<br />
cogeneration, especially in industry.<br />
Transport energy use can be reduced by improving the efficiency of transportation<br />
technology (e.g. improving automobile fuel economy), shifting to less energy intensive<br />
transport modes (e.g. substitution from passenger cars to mass transit), improving the quality<br />
or changing the mix of fuels used in the transportation system and improving the quality of<br />
the transportation infrastructure.<br />
For all modes of transport, substantial opportunities exist to improve transportation<br />
equipment. The technical savings potential for passenger cars and trucks is estimated at 15–<br />
45% for Turkey. In the transport sector, the energy efficiency is changing from 15% to 20%<br />
[164].<br />
Table 55 Industrial sub-sector energy consumption and the share of the cost of energy production of<br />
Turkey [48]<br />
Turkey has dynamic economic development and rapid population growth. It also has macroeconomic,<br />
and especially monetary, instability. The net effect of these factors is that Turkey‟s<br />
energy demand has grown rapidly almost every year and is expected to continue growing.<br />
The domestic share of total energy consumption is 37%, and between the years 2000 and<br />
2010, the cost for needed energy will be approximately 55 billion US$. The government has<br />
been planning for 81% of this amount as an investment. Considering the country‟s economic<br />
conditions, Turkey must come up the plan which reduces the share of fossil fuels, increases<br />
energy production (including use of more alternative energy sources), and changes the<br />
coarse of long-term energy plans into very effective and applicable solutions.<br />
Although Turkey has made a good start at addressing its energy problems, some analysts<br />
feel that more attention needs to be paid to conservation and pricing policies to limit the<br />
growth of demand. Industry is the major consumer of energy, and industrial consumption is<br />
621
622<br />
ENERGY AND SUSTAINABLE DEVELOPMENT IN THE MEDITERRANEAN<br />
expected to grow rapidly if left unchecked. The most energy-intensive sectors of industry,<br />
such as iron and steel, food processing, textiles, mining and nonferrous metals, chemicals,<br />
cement, and bricks and ceramics, probably could reduce demand significantly if required to<br />
do so.<br />
Table 56 Process heating efficiency data for the industrial sector in Turkey from 1990 to 2003 [140]<br />
η:Energy efficiency<br />
ε1:Exergy efficiency<br />
Figure 12 Mean heating energy and exergy efficiencies of the industrial sector and its sub-sectors in<br />
2003 [140]<br />
According to the studies conducted by Turkish State Statistics Institute (DIE) in 1992 and<br />
1995, on the basis of the results obtained from approximately 1200 of these manufacturers,<br />
their total energy consumption of the places of employment, which annually consume 500<br />
toe or above, constitute 75% of the industrial energy consumption of Turkey. Table 55 [48]<br />
indicates the industrial sub-sectoral energy consumption and the share of the cost of energy<br />
production of Turkey. As can be seen in the table, the iron and steel sectors take a large<br />
share (35%) of this consumption. In this sector, when the cost of the energy is investigated,<br />
this share breaks down into 48% in the iron and steel sector, 32.5% in the ceramics industry<br />
and 55% in the cement industry. On the basis of the cost of the energy, the share of the<br />
metal and soil industry, out of the total value of Turkey ranges from 11% to 55%. Process<br />
heating efficiency data for the industrial sector in Turkey from 1990 to 2003 is given in Table<br />
56 [140] and the graphical representation of the mean heating energy and exergy efficiencies<br />
for the year 2003 is shown in Figure 12 [140]. Overall energy and exergy efficiencies of the<br />
Turkish industrial sector are shown in Figure 13 [140].
TURKEY - National Study<br />
Figure 13 Overall energy and exergy efficiencies of the Turkish industrial sector over the period from<br />
1990 to 2003 [140]<br />
Table 57 Energy and exergy inputs to the Turkish residential–commercial sector during 2002 [27]<br />
a The upper values are conversion factor to tons oil of equivalent (toe), while the lower values are quality factor.<br />
b Source: [27] -exergy values have been calculated in this study.<br />
The values of energy and exergy consumptions for 2002 according to energy carriers are<br />
illustrated in Table 57 [27]. As can be seen in this table, total energy and exergy inputs to the<br />
Turkish sector were 3257.29 and 3212.42 PJ in 2002, respectively. Of the total energy input,<br />
31.30% was produced in 2002, while the rest will be met by imports. In 2002, of the 11<br />
energy sources, petroleum had the largest share with 39.92%, followed by natural gas with<br />
623
624<br />
ENERGY AND SUSTAINABLE DEVELOPMENT IN THE MEDITERRANEAN<br />
20.70%, lignite with 13.86%, and hard coal with 10.77%, and other resources with 14.75%.<br />
Figure 10 shows energy and exergy flows in a macro-system for Turkey‟s whole and Turkish<br />
residential–commercial sector. In 2002, of Turkey‟s total end-use energy, 42% was used by<br />
the industrial sector, followed by the residential–commercial sector at 31%, the transportation<br />
sector at 19%, the agricultural sector at 5% and the non-energy use at 3% [27].<br />
Figure 14 An illustrative presentation of the energy flows in a macro-system and residential–<br />
commercial sector for Turkey<br />
The Turkish residential–commercial sector includes space heating, water heating, cooking<br />
and electrical appliances for energy consumption. In 2002, of Turkey‟s end-use energy, 31%<br />
was used by the residential sector, while the share of this sector in this breakdown is<br />
expected to continue to decrease at approximately 9–12% per year and to reach 20% in<br />
2020. The highest contributions came from renewable resources (including wood) with<br />
38.24%, fuel with 38.45% and electric with 23.31% in 2002, respectively (Table 57) [27]. In<br />
2002, the highest contributions came from wood with 195.80 PJ, while the share of this<br />
resource in this breakdown is expected to continue to decrease at approximately 3–5% per<br />
year and to reach 128.54 PJ in 2020. This is due to the economic development in Turkey.<br />
However, natural gas utilization has continuously increased in the Turkish residential–<br />
commercial sector for space heating, water heating and cooking purposes in several cities.<br />
Figure 15 Distribution of the energy consumption values according to the type of sub-users in the<br />
Turkish residential–commercial sector for 2002<br />
Natural gas constituted 110.69 PJ of the energy used in this sector in 2002 and is projected<br />
to account for 453.68 PJ of that in 2020. In addition, utilization of renewable energy is spread<br />
in the Turkish residential–commercial sector, especially from sunlight for water heating, from<br />
geothermal for water heating and space heating and from bio-waste for general usage.<br />
Figure 11 illustrates the use of energy and exergy as well as the shares of the resources in<br />
this sector for the year of 2002. The share of the energy consumption in the residential–<br />
commercial modes is as follows: space heating with 43%, water heating with 26%, cooking<br />
with 10% and electrical appliances with 21% in the year studied.
TURKEY - National Study<br />
As living standards rise, the use of electrical appliances is increasing fast and boosting<br />
electricity demand. Electrical energy is used for various purposes such as lighting,<br />
refrigeration, television, washing machines, etc. in this sector. Distribution of residences and<br />
efficiencies according to fuel types and components of fuel uses in 2002 in Table 58 and<br />
energy utilization values, saturation values and efficiencies of electrical appliances for the<br />
Turkish residential–commercial sector in 2002 are indicated in Table 59, where the ratio of<br />
saturation is the percentage of residences using electrical appliances, while utilization of<br />
electric represents the percentage of electrical energy in electrical applications.<br />
Table 58 Distribution of residences and efficiencies according to fuel types and components of fuel uses in<br />
2002 (%)<br />
a Source: [50]-exergy efficiency values have been calculated.<br />
ε1 : energy (first law) efficiency (%)<br />
ε2 : exergy (second law) efficiency (%)<br />
Refrigeration requires the largest fraction of electricity with 38% in 2002, followed by lighting<br />
with 35%.<br />
A variation of the overall mean energy and exergy efficiency values for sub-users in the<br />
Turkish residential–commercial sector and Turkey‟s general is shown in Figure 16 [49]. As<br />
can be seen in Figure 16 [49] where a comparison of energy and exergy utilization efficiency<br />
values for the Turkish residential–commercial sector is also illustrated, the energy<br />
efficiencies in 2002 range from 50.14% to 65.87%, while the exergy efficiencies vary from<br />
4.15% to 18.71%. This sector shows considerable important and comparable losses of<br />
energy and exergy. In terms of exergy loses, this sector ranks rather differently, accounting<br />
for about 81–95% of all exergy loses. Figure 16 [49] indicates the need of saving in the use<br />
of energy and to improve habits of energy use in this sector and its sub-sectors. Space<br />
heating constitutes the longest energy loss, followed by water heating and cooking activities<br />
in the Turkish residential–commercial sector. From the evaluation of Figure 16 [49], it may be<br />
concluded that the Turkish residential–commercial sector has about equal and fairly high<br />
energy efficiencies, while it indicates a very poor performance in terms of its exergy<br />
efficiency values. This study indicated that exergy utilization in Turkey was even worse than<br />
energy utilization. In other words, Turkey represents a large potential for increasing the<br />
exergy efficiency. It is clear that a conscious and planned effort is needed to improve exergy<br />
utilization in Turkey.<br />
625
626<br />
ENERGY AND SUSTAINABLE DEVELOPMENT IN THE MEDITERRANEAN<br />
Table 59 Values for energy and energy utilization efficiencies as well as utilization of electric and<br />
saturation values of electrical appliances in 2002<br />
a Source: [51]<br />
ε1: energy (first law) efficiency (%)<br />
ε2 : exergy (second law) efficiency (%)<br />
Figure 16 Energy and exergy utilization efficiencies in the Turkish [49] residential–commercial sector for<br />
2002 [49]<br />
Heat insulation has a big energy saving potential, but in Turkey this saving is so less than<br />
how much it should be. According to the calculations for 400,000 buildings, it was found that<br />
the saving could be 1,220,000,000$ in 2005, considering that the buildings which have taken<br />
licence since 2000 have been built according to the regulations [165].<br />
The energy efficiency of Turkish industrial sector and energy and exergy efficiencies of<br />
Turkish residential-commercial sectors are mentioned above, but it is difficult to find studies<br />
about the energy efficiency of Turkish tertiary sector. The reason of that is that energy<br />
consumption of the tertiary sector is so less than the energy consumption of industrial and<br />
residential sectors.<br />
2.4 Renew able Ene rgy E vo l u ti on<br />
The total renewable energy production and consumption of Turkey are equal to each other,<br />
varying between 9.6 and 10.8 million tons of oil equivalent (toe) each for the 1992-1999<br />
period (Table 60) [141]. Their share in total energy production varies on average between<br />
37% and 43%, while in total consumption, it varies between 15% and 22% for the same<br />
period. Among the production of renewables, biomass that includes wood and dung is the
TURKEY - National Study<br />
highest in 1992, reaching 7.2 million toe. The second highest is hydroelectric production,<br />
which reached 3.5 million toe in 1998. The production of geothermal and solar energy is<br />
negligible compared with biomass and hydroelectric power, varying from 122 to 388<br />
thousand toe between (Table 60) [141]. On the other hand, Turkey‟s first wind farm was<br />
commissioned in 1998 and has a capacity of 1.5 MW. Capacity is likely to grow rapidly, as<br />
plans have been submitted for just under a further 600 MW of independent facilities, of which<br />
57 MW is at an advanced stage in negotiations. The majority of the proposed projects are<br />
located in Çeşme (İzmir) and Çanakkale [142].<br />
Table 60 Primary energy consumption in Turkey 1992-1999 (ktoe) [141]<br />
The role of the government in formulating and implementing favourable policies for<br />
renewable energy development is vital. But the private sector, which has the capacity to<br />
mobilize funds, needs to be involved in renewable energy development [16]. In order to<br />
facilitate rapid replication of renewable technologies, policies should be put in place to<br />
encourage the private sector to consider the technologies and to invest in developing and<br />
implementing renewable projects. Lack of co-ordination and co-operation within and between<br />
various ministries, agencies, institutes and other stakeholders is a major obstacle to further<br />
promotion renewable energy technology. It should be continued and expanded co-operation<br />
with European member countries in all major energy policy areas [16]. The energy supply<br />
and demand should be closely monitored and revised the forecasts to take account of the<br />
progress of liberalization, energy efficiency improvements, structural changes in industry and<br />
other major factors in order to better inform all players‟ investment decisions.<br />
The main barriers for development renewable energy are: lack of financial resources and<br />
proper lending facilities, particularly for small-scale projects constitute, lack of detailed<br />
renewable energy resource assessments and data banks pertains to Turkey like to many<br />
other countries. But, lack of awareness and knowledge is not a big barrier in Turkey [166].<br />
Renewable energy is recognized as a major potential for indigenous, clean energy<br />
production. Awareness rising is still a key to involvement, particularly of community based<br />
and non-governmental organizations.<br />
The process of liberalization, restructuring and privatization in the energy sector is vital. It<br />
should be prevented any delays in the introduction of competition. It should be created a<br />
favourable environment for investment [16].<br />
The most important handicap for foreign investors is Turkish bureaucracy. The permission for<br />
a foreign investor can be taken through one-year period with applying numerous different<br />
associations. New government had promised to make the permission producer easier.<br />
No subsidy policies exist within this frame. Introduction of both subsidies and ways to<br />
overcome commercialization barriers as well as the realization of good practices are of<br />
utmost importance [16]. Technology developed and/or transferred needs standardization and<br />
then replication. There is a need to evaluate applied renewable energy technologies in detail<br />
627
628<br />
ENERGY AND SUSTAINABLE DEVELOPMENT IN THE MEDITERRANEAN<br />
as a precondition for technology transfer. Environmental protection measures need to be<br />
considered in technology development.<br />
High initial capital costs, high operation and management costs must be brought down to<br />
attract private investors and facilitate technology transfer. Local production of renewable<br />
energy technology can reduce the investment costs significantly [16].<br />
It was recognized that markets on biomass fuels already exist, including in rural areas, where<br />
a large number of people generate income through trade of wood and wood residues,<br />
primarily for cooking purposes [16]. But, policy gaps with regards to the supply side of wood<br />
fuels from both forest and non-forest sources need to be reduced.<br />
The energy prices should reflect full costs and eliminate subsidies and cross subsidies, both<br />
direct and indirect. It should be taken measures to increase transparency in energy<br />
regulation and in price setting.<br />
The directive of EC with date of 27 September 2001 and number of 2001/77/EC endorses<br />
member countries to cover 12% of the first energy consumption from the renewable sources<br />
after the year 2010 [16]. The scarcity of renewable energy sources of EC will make the green<br />
electric (electric generated from renewable energy sources) import from other countries as<br />
Turkey. Turkey may export green electric to European countries by improving the renewable<br />
energy sources and by developing the electric interconnection.<br />
In Turkey, natural gas and coal combined cycle power plants with a total capacity of 6000<br />
MW will be in operation till the end of 2003. Besides, it can be seen that there will be an<br />
energy generation surplus till the end of 2006 [16]. The water level in hydroelectric power<br />
plants will be increased. As a result, Turkey will have a new electric distribution system with<br />
voltage and frequency control similar to European standards with 2003. At present, Turkey<br />
can export total 3400 MW energy; 2400 MW energy through Bulgaria line and 1000 MW<br />
through being built Greece line.<br />
In short term, the authority of the determination of valuable geothermal energy generation<br />
areas must be given to Energy and Natural Sources Ministry or a committee that can be<br />
organized for this duty. At first, they must do the arrangements to generate electricity from<br />
these areas. Secondly, the private sector must enter this structure. The experience of The<br />
Directorate-General of Mineral Affairs must be used to determine the geothermal energy<br />
potential of Turkey [16].<br />
2.5 Existing or Ex pecte d Effects and Benefits of RE and R UE<br />
Hydroelectric generation, biomass combustion, solar energy for agricultural grain drying and<br />
hot water heating, and geothermal energy have been in use in the country for many years.<br />
Domestic water heating is the primary active solar technology. In Turkey, approximately 30<br />
000 solar water heating systems have been installed since the 1980s. This is a minute<br />
fraction of the total potential. About 50% of existing dwellings could be fitted effectively with a<br />
solar water heater. If this potential were extended to 2025, the deployment of approximately<br />
5 million systems (allowing for a rise in the Turkish housing stock) would be required. This<br />
could save an estimated 30 PJ (9.0 TWh) per year of oil, coal and gas and 2.0 TWh per year<br />
of electricity, giving a saving of 5.0 million tonnes of CO2 per year, or just under 1% of current<br />
Turkey CO2 production. Detailed energy and economic comparisons of air-to-air heat pumps<br />
and conventional heating systems for the Turkish climate have been reported [10]. This study<br />
demonstrated that the heat pump offers distinct economic advantages over the oil and coalfired<br />
boiler systems, but is not an economic alternative to the gas-fired heating system.<br />
Because the unit price of the gas is almost 4 times less than that for electricity in Turkey, to<br />
become competitive with a gas-fired boiler, either the capital cost of the heat pump must be<br />
substantially reduced or its seasonal COP increased by about 60%. (An alternative is to drive<br />
it with a gas engine rather than an electric engine.)<br />
As the average energy equivalent of agricultural residues is 17.5 MJ/kg [112], then the<br />
annual energy equivalent of agricultural residues is varies from 470 to 620 PJ. So,<br />
agricultural residues have a high potential to take the place of the lignite (40 million tons) and<br />
hard coal (1.3 million tons) used in electricity production.
TURKEY - National Study<br />
Biogas systems are considered to be strong alternatives to the traditional space heating<br />
systems (stoves) in rural Turkey. Geothermal heat pumps are a relatively new application of<br />
geothermal energy that has grown rapidly in recent years. They use the earth as a heat sink<br />
in the summer and a heat source in the winter and, therefore, rely on the relative warmth of<br />
the earth for their heating and cooling production. On the other hand, the biggest benefit of<br />
geothermal heat pumps is that they use 25-50% less electricity than conventional heating or<br />
cooling systems. Geothermal heat pumps can also reduce energy consumption, and<br />
corresponding air pollution emissions, up to 44% compared to air source heat pumps and up<br />
to 72% compared to electric resistance heating with standard air conditioning equipment<br />
[130].<br />
Detailed technical and economic analyses have been performed for geothermal heat pump<br />
district heating systems for Turkey by several researches that are given in the literature<br />
[131,132]. These studies show that there is a good potential for geothermal heat pump<br />
heating and refrigeration applications in the country. A study conducted by Kilkis and Eltez<br />
[130] show that the useful energy extracted from a given geothermal reservoir in a district<br />
can be increased by 70% through a hybrid/integrated system, when compared to a simple<br />
open loop system. Coupled with proper demand side management design, it is projected that<br />
about 115% more customers can be serviced with the same amount of geo-fluid extracted,<br />
without thermal peaking. This also shows that when district heating and cooling is involved in<br />
a geothermal system, heat pumps and hybrid HVAC systems seem to play the key roles.<br />
The efficiency and economics of conventional power plants may be improved by using<br />
energy storage. In solar energy, the application of energy storage is required for a reliable<br />
energy supply. There are three types of thermal energy storage systems: sensible heat,<br />
latent heat and thermo-chemical energy storage. The term sensible heat storage refers to<br />
systems that store thermal energy by increasing the temperature of a medium without phase<br />
change, such as melting, boiling or freezing. Latent heat storage is based on the heat<br />
absorption and release when a storage material undergoes a reversible phase change,<br />
usually from the solid state to the liquid state in the storage charging mode and vice versa in<br />
the storage discharging mode.<br />
Experimental and theoretical studies have been performed by several researchers [133,134]<br />
for solar heat pump combinations in Turkey. Solar energy and heat pump systems are two<br />
promising means of reducing the consumption of fossil fuel resources and, hopefully, the<br />
cost of delivered energy for residential heating. An intelligent extension of each is to try to<br />
combine the two in order to further reduce the cost of delivered energy. Solar heat pump<br />
systems can be classified, according to the source of heat that supplies the evaporator of the<br />
heat pump, as either parallel, series or dual. In parallel systems, the heat pump receives<br />
energy from the outdoor air, and the collected solar energy is supplied directly for either<br />
space heating or for heating water. In the series system, solar energy is supplied to the<br />
evaporator of the heat pump, thereby raising its temperature and increasing the coefficient of<br />
performance. In the dual source configuration, the evaporator is designed so that it can<br />
receive energy from either the outdoor air or from the solar energy store. Our studies show<br />
that there is a great potential for using a solar heat pump combination for domestic<br />
heating/cooling applications in Turkey.<br />
Turkey, currently, does not have an organized photovoltaic (PV) program. Global energy<br />
strategies and policies are laid down in periodic 5 yr development plans. Government has no<br />
intention in PV production. PV cells are produced in various research establishments in order<br />
to study the feasibility of local manufacturing. So far none of these studies yielded a positive<br />
result in order to justify a mass production facility in Turkey. There are more than 30,000<br />
small residential areas where solar powered electricity would likely be more economical than<br />
grid supply. Another potential for PV market is holiday villages at the long coastal areas.<br />
These facilities are frequently far from the main grid nodes and require additional power<br />
when solar insolation is high. Unfortunately energy demand in Turkey is so large that utilities<br />
are concentrating on large conventional power plants and peak load facilities. The newest 5<br />
yr development plan, being prepared, foresees a more ambitious program and estimates<br />
approximately 40 MWp installed power by the year 2010 [16,125,126,127].<br />
629
630<br />
ENERGY AND SUSTAINABLE DEVELOPMENT IN THE MEDITERRANEAN<br />
3. Examples of good practice case studies<br />
Turkey is among the first five leader countries in its geothermal direct use applications. In<br />
Turkey, the district heating system applications were started with large scale, city based<br />
geothermal district heating systems. In this regard, city based geothermal district heating<br />
applications can be categorized in two groups, namely: (a) low temperature applications and<br />
(b) high temperature applications. There is one low temperature large scale city heating<br />
application installed in Kirsehir, while high temperature applications are in larger numbers.<br />
The investigations on geothermal energy in the country gained speed in the 1970s. However,<br />
the utilization of geothermal energy could not become widespread sufficiently due to scaling<br />
problems up to the early 1980s. Since then, important developments have been recorded in<br />
geothermal energy utilization. Recently, geothermal direct use applications have reached up<br />
to 52,000 residences equivalence of geothermal heating, and engineering design of nearly<br />
300,000 residences equivalence geothermal district heating has been completed [69,70,71].<br />
Table 61 Temperature distribution of well outputs by region in Turkey [75]<br />
Taking into consideration the current development of geothermal energy in Turkey, it may be<br />
concluded that the majority of the geothermal energy utilization occurred in direct use<br />
applications (including district heating, thermal facilities and greenhouse heating) with a total<br />
installed capacity of 493 MWt. Besides this, geothermal water has been used in 194 spas for<br />
balneo-logical purposes with a total capacity of 327 MWt. As a result, the total installed<br />
capacity is found to be 820 MWt for direct use and 20.4 MWe for power production obtained<br />
from the only geothermal power plant of Turkey in the Denizli–Kizildere geothermal field. An<br />
annual average growth of 23% of residence connections to geothermal district heating<br />
systems has been achieved since 1983 in the country, representing a decrease of 5% in the<br />
last three years [69,71].<br />
Parallel to the development of geothermal energy utilization in Turkey, it is projected that by<br />
the years 2010 and 2020, the total installed capacity will increase to 3500 MWt (500,000<br />
residences equivalent, which is about 30% of the total residences in the country) and 8300<br />
MWt (1,250,000 residences equivalent) for space heating and to 500 MWe and 1000 MWe for<br />
power production, respectively [69,71,72].<br />
Up to date, all geothermal district heating investments have been done by the government<br />
and municipalities. However, the private sector has expected to realize these investments as<br />
investors with the government and municipalities. Under Turkey‟s conditions, the share of<br />
pipeline network in the geothermal district heating investments is about 70%, followed by<br />
production and re-injection wells at 10%, building adaptation at 10%,heating centre at 5%<br />
and engineering design at 5% [71,73].
TURKEY - National Study<br />
In Turkey, 400 geothermal production wells and 300 gradient wells have been drilled until<br />
now. Of these, 305 wells were drilled by the MTA with a total well depth of nearly 120,000 m.<br />
The regional distribution of the wells drilled by the MTA is as follows [46,73]: 87% in western<br />
Turkey, 11% in middle Anatolian, and 2% in eastern Turkey, while the temperature<br />
distribution is given in Table 61, where most of the high temperature geothermal fluids exist<br />
in the western part of Turkey [75].<br />
In Turkey, the investments in geothermal heating systems have been supported by<br />
consumers due to the tariff on geothermal heat, which is held constant during the entire year.<br />
The investment cost for geothermal district heating systems per residence with a floor area of<br />
100 m 2 is about 1500–2500 US$ (excluding heater costs in the residence), while the payback<br />
period varies between 5 and 8 years. About 30–50% of the investment costs has been paid<br />
by consumers as a connection subscription fee, like a capital investment. The heating fees<br />
(2001 heating season) were in the range of 14–29 US$ [73,129].<br />
Turkish heating systems differ in many respects from those of the developed countries.<br />
Stoves are widely used in single family houses and also apartments. Furthermore, both<br />
single family and multi-family houses are heated by using hydronic systems. In this context,<br />
using geothermal energy obviously will reduce the use of other forms of energy, especially<br />
fossil fuels and, hence, eliminate pollutants such as particulates and greenhouse gases in<br />
the country.<br />
631
632<br />
ENERGY AND SUSTAINABLE DEVELOPMENT IN THE MEDITERRANEAN<br />
3.1 Izmir–Balcova Geothe rmal District Heati ng Sys t e m<br />
Figure 17 Map of Izmir-Balcova Geothermal Field (IBGF) [76]<br />
The Balcova region is ≈ 7 km from the Centrum of the Izmir province, located in the western<br />
part of Turkey, and is endowed with considerably rich geothermal resources. The Izmir–<br />
Balcova geothermal field (IBGF) covers a total area of about 3.5 km2 with an average<br />
thickness of the aquifer horizon of 150 m, as can be seen in Figure 13 [76]. Assuming that no<br />
feeding will occur and 25% of the fluid contained in the reservoir will be utilized, this field has<br />
a maximum yield of 810 m 3 /h at a reservoir temperature of 118 ºC [77].
TURKEY - National Study<br />
Figure 18 A schematic of Balcova-Narlidere-Izmir geothermal district heating system [77]<br />
In the district heating system investigated, there are two systems, namely the Izmir–Balcova<br />
geothermal district heating system (IBGDHS) and the Izmir–Narlidere geothermal district<br />
heating system (INGDHS). The design heating capacity of the IBGDHS is equivalent to 7500<br />
residences. The INGDHS was designed for 1500 residence equivalence but has a sufficient<br />
infrastructure to allow a capacity growth to 5000 residence equivalence. The outdoor and<br />
indoor design temperatures for the two systems are 0 and 22 ºC, respectively. Figure 54 [77]<br />
illustrates a schematic of the IBGF, where the IBGDHS, the INGDHS and hotels and official<br />
buildings heated by geothermal energy were included [77]. The IBGDHS consists mainly of<br />
three cycles, such as: (a) energy production cycle (geothermal well loop and geothermal<br />
heating centre loop), (b) energy distribution cycle (district heating distribution network) and<br />
(c) energy consumption cycle (building substations).<br />
As of the end of 2001, there are 14 wells ranging in depth from 48 to 1100 m in the IBGF. Of<br />
these, seven and six wells are production and re-injection wells, respectively, while one well<br />
is out of operation, as can be seen in Table 56 [78]. The well head temperatures of the<br />
production wells vary from 95 to 140 ºC, with an average value of 118 ºC, while the<br />
volumetric flow rates of the wells range from 30 to 150 m 3 /h. Geothermal fluid, collected from<br />
the seven production wells at an average well head temperature of 118 ºC, is pumped to a<br />
633
634<br />
ENERGY AND SUSTAINABLE DEVELOPMENT IN THE MEDITERRANEAN<br />
mixing chamber, where it is mixed with the reinjection fluid at an average temperature of 60–<br />
62 ºC, cooling the mixture to 98–99 ºC.<br />
Table 62 Some details about geothermal wells in IBGF [78]<br />
This geothermal fluid is then sent to two primary plate type heat exchangers and is cooled to<br />
about 60–62 ºC, as its heat is transferred to the secondary fluid. The geothermal fluid whose<br />
heat is taken at the geothermal centre is reinjected into the reinjection wells, while the<br />
secondary fluid (clean hot water) is transferred to the heating circulation water of the building<br />
by the heat exchangers of the substations. The average conversion temperatures obtained<br />
during the operation of the IBGDHS are, on average, 80/57 ºC for the district heating<br />
distribution network and 65/45 ºC for the building circuit. By using the control valves for flow<br />
rate and temperature at the building substations, the needed amount of water is sent to each<br />
housing unit and the heat balance of the system is achieved [77].<br />
Table 63 Distribution of geothermal district heating system subscribers as of April 2001 [79]<br />
In Turkey, initial studies on the exploitation and exploration of geothermal energy started in<br />
1962 with the inventory of hot water springs. Then, in 1963, the first successful down-hole<br />
heat exchanger was realized at the IBGF, and the real explorations and development of the<br />
geothermal energy potential of Turkey started [80]. The first geothermal heating application<br />
in Turkey was applied to the Izmir–Balcova thermal facilities in 1983, where the first downhole<br />
heat exchanger was also used [81]. As of April 2001, in the IBGF, the number of<br />
geothermal district heating system subscribers has reached 7607 dwelling equivalence, of<br />
which 16.7% are for hotels and official buildings, as given in detail in Table 63 [79].<br />
Benefits of the Izmir–Balcova geothermal district heating system<br />
In order for district heating to become a serious alternative to existing or future individual<br />
heating and/or cooling systems, it must provide significant benefits to both the community in<br />
which it is operated and the consumer who purchases energy from the system. Further, it<br />
must provide major societal benefits if federal, state, or local governments are to offer the<br />
financial and/or institutional support that is required for successful development [82]. In this<br />
regard, the benefits gained from the IBGDHS will be briefly described below from the view of<br />
the customer and environmental points, while they are discussed generally in detail<br />
elsewhere [82].
Customer Benefits<br />
TURKEY - National Study<br />
The cost per kJ (or kWh) of heating with conventional fuels and equipment must be<br />
determined to evaluate the relative attractiveness of district heating [83]. Table 58 shows<br />
typical fuel prices for various types of residential heating systems as of December, 2001. The<br />
prices for fuel are issued monthly in the Turkish Plumbing Magazine [84], which is very<br />
popular in the field of heating, ventilating, and air-conditioning (HVAC) in Turkey. In addition,<br />
the costs of the energy consumption of heat pumps, depending on the outdoor temperature,<br />
are prepared with the help of the Turkish Heating, Refrigeration and Air-conditioning<br />
Manufacturers‟ Association (called ISKID in Turkey) and are also included in this magazine.<br />
The prices are tabulated in the units in which they are normally sold (e.g. cents/kWh for<br />
electricity). For comparison purposes, the prices (tariffs) were converted from Turkish Lira<br />
(TL) to US$ (the exchange rate of 1 US$ was about 1,500,000 TL at that time) and also to<br />
cost per unit of delivered thermal energy taking into account the average efficiency. At this<br />
stage, it is sufficient to say that a variety of tariffs are available in Turkey. Furthermore, the<br />
most expensive one, on the basis of cents/kWh (per unit energy), is electricity, which is about<br />
three times that of natural gas. The energy cost of the geothermal based cost of the domestic<br />
hot water was not taken into account in the remaining heating systems given in Table 58.<br />
However, a connection subscription fee, like a capital investment, of 1250 US$ for the<br />
IBGDHS has been paid by the consumers since 1998, with the fees of 600 and 1000 US$ in<br />
1996 and 1997, respectively. Also, it should be noted that the unit energy price of the ground<br />
source heat pump, also referred to as geothermal heat pump, with a coefficient of<br />
performance of 3.8, is close to that of the geothermal based district heating. Further, the<br />
installation cost of geothermal heat pumps is much higher than that of other heating systems<br />
[85]. Fuel costs are a major factor in calculating the running costs of schemes and the<br />
viability of proposed schemes [86]. For this reason, the prices given in Table 58 can be used<br />
for comparison purposes on the basis of fuel costs.<br />
Environmental benefits<br />
The emissions of air pollutants, including nitrogen oxides, sulphur dioxide and particulates,<br />
will be greatly reduced as a result of the reduced fuel consumption, as will the carbon oxides<br />
emissions. Geothermal emissions of carbon dioxide from high temperature geothermal fields<br />
used for electricity production are in the range of 0.01–0.4 kg/kWh, compared to 0.5–1.1<br />
kg/kWh of carbon dioxide from fossil fuels [87]. The gas emissions from low temperature<br />
resources are normally only a friction of the emissions from the high temperature fields used<br />
for generating electricity [88].<br />
635
636<br />
ENERGY AND SUSTAINABLE DEVELOPMENT IN THE MEDITERRANEAN<br />
Table 64 Energy cost comparisons of different fuels for residential use in Turkey (based on prices of<br />
December 2001)<br />
The real benefit for the environment from the use of geothermal energy in the IBGF can be<br />
quantified by calculating the emissions of the main pollutants characteristic of the substituted<br />
fuels, as given below.<br />
Assumptions:<br />
a) Total dwelling equivalent is taken as 7607, including hotels and official buildings,<br />
as given in Table 63 [79].<br />
b) The share of Diesel oil fired heating systems in total dwelling equivalent is 45%<br />
(3423), followed by coal fired heating systems (stoves and boilers) at 25%<br />
(1902), and furnace-oil-fired heating systems at 30% (2282).<br />
c) The sulphur contents of Diesel oil, furnace oil and coal are taken as 0.7, 1.0 and<br />
1.1 in percent by mass, respectively. The chemical characteristics of the coal to<br />
be used in Izmir are regulated at the beginning of every winter period by the<br />
Local Environment Council to prevent utilization of low grade coals. In this regard,<br />
the limiting values for sulphur in the coal should be a maximum of 0.9% and 1.1%<br />
for domestic and imported coals by mass, respectively [89]. However, the sulphur<br />
contents of Diesel oil, furnace oil and coal ranges, in percent by mass, between<br />
0.7 and 1.2,1.0 and 1.5 and 1.25 and 4.0, respectively [90]. Therefore, it should<br />
be noted that the minimum values for sulphur in the fuels studied were taken into<br />
account. Therefore, this analysis will give emissions at a minimum rate.
TURKEY - National Study<br />
Table 65 Distribution of values for local emissions of sulphur dioxide and carbon dioxide associated<br />
with the fuel combustion<br />
d) The sulphur is completely converted to sulphur dioxide with a value of 1.998 kg<br />
SO2 per kg S, while C is completely converted to carbon dioxide with a figure of<br />
3.664 kg CO2 per kg C [91].<br />
e) The carbon contents for coal, furnace oil, and Diesel oil are, in percent by mass,<br />
60, 85 and 86, respectively [90].<br />
Distribution of values for local emissions of sulphur dioxide and carbon dioxide<br />
associated with the fuel combustion are shown in Table 65.<br />
Using the values of coal, furnace oil and Diesel oil fired systems over the heating season<br />
given in Table 58, the local emissions of sulphur dioxide and carbon dioxide associated<br />
with fuel combustion have been reduced annually by 140.51 metric tons/yr and 20,613.11<br />
metric tons/yr, respectively. This represents the average values per dwelling equivalent of<br />
18.5 kg of SO2 and 2710 kg of CO2, respectively, as given in Table 65.<br />
3.2 Denizli -Kizi lde re Geothermal Pow e r <strong>Plan</strong>t ( DKGPP)<br />
Brief Historical Development of the Denizli-Kizildere Geothermal Power <strong>Plan</strong>t<br />
The Denizli-Kizildere geothermal field (DKGF) is located 30 km away from the province of<br />
Denizli, Western Anatolia, Turkey, as can be seen in Figure 19. This field is the first and only<br />
geothermal field developed in Turkey. The first geological, geochemical, and geophysical<br />
studies were conducted with the support of the United Nations Development Program<br />
(UNDP) in 1966. Two stratigraphically separate zones in the field were initially identified as<br />
first and second reservoirs during the exploration stage. The shallow reservoir has a<br />
temperature of 190–200 ºC, a depth of up to 706 m, a steam fraction of 10% and moderate<br />
permeability. The deeper one has 200–212 ºC temperature, a depth of up to 1241 m, a<br />
steam fraction of 10–12% and a higher permeability. So, the second reservoir was chosen as<br />
the production zone.<br />
637
638<br />
ENERGY AND SUSTAINABLE DEVELOPMENT IN THE MEDITERRANEAN<br />
Figure 19 Location of the Denizli-Kizildere geothermal field<br />
Figure 20 illustrates the well locations of the DKGF [92]. The first well (the so-called KD-1)<br />
was drilled in 1968, and the temperature measured was 198 ºC at a depth of 540 m. total of<br />
14 wells were drilled between 1968 and 1973, while the encountered temperatures were in<br />
the range of 170–212 ºC. A 0.5 MWe pilot plant, which was fed from the KD-13 well, was<br />
installed in 1974 in the field. The electricity generated had met the demand of the villages<br />
around the field for a long time period. The MTA reported that 6 (KD-6, 7, 13, 14, 15, 16) out<br />
of 13 wells were suitable for electricity generation. The DKGPP was installed on February 14,<br />
1984 with an installed capacity of 20.4 MWe. Then, 3 (KD-20, 21, 22) more production wells<br />
were drilled in two years, and the total number of production wells reached 9 [93]. In 1997,<br />
the R-1 well was drilled for injection purposes [94]. A liquid CO2 and dry ice production<br />
process with a capacity of 40,000 tons/yr was built adjacent to the field in 1986. The capacity<br />
of the process was increased to 120,000 tons/yr in 1999. Besides electricity and dry ice<br />
production, the resources of the field have also been used for greenhouse heating and space<br />
heating of offices and staff houses of the plant [95,96]. In Turkey, the first geothermal<br />
greenhouse heating system of 4.5 da was applied in the DKGF in 1985 [97].
TURKEY - National Study<br />
Figure 20 Well locations of the Denizli-Kizildere geothermal field [92]<br />
Currently, the DKGPP employs 98 people including engineers, technicians and workers. The<br />
plant operates 8000 h/yr. The rest of the time is spent for maintenance such as cleaning the<br />
wells and overhaul. Electricity production cost was calculated as 1.75 cents/kWh in 2001.<br />
Denizli-Kizildere Geothermal Field<br />
The main characteristics of the DKGF are given in Table 66 [93,98]. This field is a liquid<br />
dominated system with a steam fraction of 10–12%. The steam field has an area of 550 m<br />
650 m, while the calculated reservoir area is 100 km 2 . The depth of the wells changes from<br />
370 to 2261 m. The reservoir temperature is between 200 and 242 ºC. The estimated<br />
capacity of the field is 200 MWe. The most significant characteristic of the field is the high<br />
amount of non-condensable gases (2.5% in the reservoir, 5% by volume of steam, 10–21%<br />
by weight of steam and average 13% by weight of steam at the turbine inlet) with a CO2<br />
content of 96–99%, H2S content of 100–200 ppm and NH3 content of 72 ppm. A gas analysis<br />
of some production and observation wells is given in Table 67 [98]. The specific steam<br />
consumption of the plant is 10.96 kg/kWh. The first law efficiency of the plant is determined<br />
to be 11.98%.<br />
Table 66 Main characteristics of the Denizli-Kizildere geothermal field [93, 98]<br />
A geothermal power plant can be divided into two sections, namely (a) steam field and (b)<br />
power generation unit including turbine house, cooling tower and related systems.<br />
The major components of a steam field are:<br />
f) The well-bore,<br />
g) The wellhead with its valves,<br />
h) Separators if it is a liquid dominated system,<br />
i) A silencer,<br />
j) A ball check valve,<br />
k) A steam transmission system,<br />
l) A waste water system, and/or<br />
m) An injection system.<br />
639
640<br />
ENERGY AND SUSTAINABLE DEVELOPMENT IN THE MEDITERRANEAN<br />
Table 67 Gas analysis of some production and observation wells [98]<br />
Figure 21 shows the flow diagram of the DKGPP. In addition to the systems above, various<br />
pumps and fans, pipelines in various sizes, numerous valves of different designs and sizes,<br />
instruments to measure and monitor flow, temperature and pressure as well as controls of<br />
valves and pumps etc. are used in the field. The main components of the DKGF are<br />
described below.<br />
(a) Well-bore: The well is the heart of the geothermal energy system. The enthalpy<br />
and mass flow of the produced fluid determine how the fluid will be used. The well is<br />
capped by the casing head flange to which is attached the rest of the wellhead<br />
equipment and wellhead valves. Well-bore characteristics change from field to field<br />
and, in some cases, from well to well.<br />
(b) Wellhead: Geothermal fluid in reservoir conditions is compressed liquid at<br />
elevated temperatures and pressures. As the fluid flows through the well to the<br />
surface, it flashes into steam, and a wellhead quality of 10–12% is obtained.<br />
The service valve is used to regulate the flow, while the master or shut off valve is<br />
used to close the well in or isolate the well for maintenance purposes. A bleed valve<br />
permits the removal of gas or to keep the well hot during shut in conditions, which<br />
avoids thermal cycling of the casing during alternating heating or cooling of the bore.<br />
The wellhead characteristics of production and injection wells are given in Table 4862 and<br />
Table 69, respectively [99]. Wellhead pressures are kept as high as 1.1–1.45 MPa to prevent<br />
precipitation of CaCO3 in the wells.<br />
(c) Separator: The geothermal fluid is sent to the separator, which is located at the<br />
wellhead of each well, to separate the steam and the liquid phases. The separators<br />
used in the DKGF are cyclone type separators with an outlet steam quality greater<br />
than 99% dry. The design and operating pressures of the separators are 1.7 and<br />
0.377 MPa, respectively.
TURKEY - National Study<br />
Figure 21 Flow diagram of the Denizli-Kizildere geothermal power plant<br />
(d) Silencer: This is an atmospheric flasher with steam flashed vertically. With such<br />
a device, the noise is reduced from high to low frequency. The separated liquid is<br />
sent to a silencer, which discharges the wastewater over a measuring weir to<br />
determine the well output characteristics before its disposal to the wastewater<br />
channel. From May to August 2002, two wells were connected to the injection well<br />
for injection trials. So, the silencers are only used to by-pass the well output when it<br />
is necessary.<br />
Table 68 Production well data [99]<br />
Table 69 Injection well data [99]<br />
(e) Ball check valve: The steam from the separator is first sent to a safety unit,<br />
which employs a ball check valve to prevent water entrance to the steam line. If<br />
water moves with the steam, the ball ascends and seals the flow.<br />
(f) Steam transmission system: The wells are connected individually through a<br />
wellhead separator via a steam branch line to the main steam transmission line with<br />
a length of 1171 m to the power plant. The pipeline is insulated to reduce heat loss<br />
and to conserve the enthalpy of the fluid. Condensation traps achieve control of the<br />
641
642<br />
ENERGY AND SUSTAINABLE DEVELOPMENT IN THE MEDITERRANEAN<br />
condensate in the bottom of the pipe, which is caused by heat loss. This also<br />
ensures adequate scrubbing, particularly of the salts, and a clean fluid is presented<br />
to the turbine.<br />
(g) Waste water system: only 10–12% of the brine extracted from the ground turns<br />
into steam after the separation process, while the remainder (88–90%) has been<br />
disposed to the Menderes river through a 1.8-km long channel at an average<br />
temperature of 147 ºC and a total flow rate of 277.7 kg/s since 1984.<br />
(h) Injection system: The commonly acceptable method of dealing with wastewater<br />
is to inject it back into a part of the reservoir.<br />
The first pilot injection test in the DKGF was conducted in 1976 and lasted for 29 weeks. The<br />
water produced from well KD-15 was injected into well KD-1A at an average rate of 23.61<br />
kg/s. The injected water temperature varied from 70 to 80 ºC. Well KD-1, which is 68 m away<br />
from KD-1A, was chosen as an observation well. The cooling effect was encountered at the<br />
observation well. A heat flow model describing the non-isothermal fluid flow in naturally<br />
fractured reservoirs is applied, and the temperature behaviour in the observation well is<br />
predicted.<br />
The second test lasted for 45 days in 1995. The water produced from KD-20 was injected<br />
into well KD-7 by gravity. The wellhead injection temperature was 100 ºC. The decline in<br />
injectivity is related to the possible plugging by scale deposition in the injector. The producer<br />
well KD-20 also served as an observation well for monitoring the produced water<br />
temperature and chloride (Cl) concentration. Some change in the chloride content but no<br />
change in the temperature of the produced water was observed. Because of the limitations in<br />
technical conveniences at that time, the actual reasons for the plugging difficulty have never<br />
been revealed [100].<br />
After those trials, an injection well (TH-2) was designed to drill on the other side of the<br />
Menderes river in the Tekkehamam field, which is 3 km away from the DKGF. The injectivity<br />
of the well was poor, and hence, it was abandoned.<br />
According to the injection program of the MTA, another injection well (R-1) was drilled in the<br />
DKGF boundary in 1997. R-1 indicated that a third reservoir with a temperature range of<br />
235–245 ºC exists in the DKGF. Taking into account the completion test results, it may be<br />
concluded that the well has a high productivity with figures of 103.05 kg/s and 6 MWe with the<br />
highest temperature in the field having a bottom hole temperature of 242 ºC at 2261 m.<br />
Based on the data obtained, the R-1 well was converted to a production well in 2001, and the<br />
production of the plant increased by 6.5%. The production rate of the plant between 1984<br />
and 2001 is illustrated in Figure 22 [99, 101].<br />
Following the R-1 well drilling, the MTA conducted some injection trials at abandoned wells in<br />
the field in 1998–99, but a drastic temperature drop was observed in the production wells. In<br />
2000, a new injection well (R-2) was initiated to drill and was completed in 2001 with a depth<br />
of 1371 m.<br />
Figure 22 Electricity generation of the Denizli-Kizildere geothermal power plant between 1984 and 2001<br />
[99, 101].
TURKEY - National Study<br />
Injection trials in R-2 have been conducted for 3 months from May to August 2002.<br />
Separated liquid from 2 production wells at a flow rate of 55.55 kg/s and a temperature of<br />
125–135 ºC were injected by gravity. The results of the trials have not been reported yet.<br />
Based upon the injection strategy recommended by Serpen and Satman [94], the Kizildere<br />
system would produce from the deeper and hotter third reservoir and inject to the shallow<br />
reservoir. Since the third reservoir produces more steam than the second reservoir, which is<br />
used as a production zone, the amount of water to inject will decrease approximately by half.<br />
Denizli-Kizildere Geothermal Power <strong>Plan</strong>t<br />
The DKGPP is a single flash system with a condensing low pressure double flow turbine.<br />
The plant operates with a 90% load factor. The main characteristics of the DKGPP are given<br />
in Table 70 [93,99,102], while the major components of the power generation unit are as<br />
follows:<br />
(a) Scrubber (main moisture separator),<br />
(b) Turbine-generator unit,<br />
(c) Condenser,<br />
(d) Gas removal system,<br />
(e) Cooling tower,<br />
(f) Auxiliary equipment (parasitic loads).<br />
(a) Scrubber: Outside of the turbine house, the steam enters a scrubber to remove the<br />
impurities and condensate. At the exit of the scrubber, the steam goes to a demister to<br />
remove the moisture and splits into two branches that are sent to the double flow turbine.<br />
(b) Turbine-generator unit: The double flow turbine used in the DKGPP consists of two<br />
turbines on the same shaft with steam flowing in opposite directions. It is preferred because<br />
of its lower capital cost and the balance on the thrust loads. The turbine has seven reaction<br />
stages on both sides. The main characteristics of the turbine-generator system of the<br />
DKGPP are illustrated in Table 65 [93]. The pressure and temperature of the turbine are<br />
0.378 MPa and 147 ºC, respectively. The total steam flow rate, including NCGs, enters the<br />
turbine at a flow rate of 33.34 kg/s, expands to 0.01019 MPa and flows to the condenser. To<br />
protect the leading edge of the last blades of the turbine from erosion and corrosion by water<br />
droplets, satellite erosion shields coat the blades, and to remove the condensate, drain<br />
channels are added. The turbine is protected by safety discs against excess pressure<br />
differentiation during drainage. The turbine-generator efficiency is determined to be 71.2%.<br />
Table 70 Main characteristics of the Denizli-Kizildere geothermal power plant [93,99,102]<br />
643
644<br />
ENERGY AND SUSTAINABLE DEVELOPMENT IN THE MEDITERRANEAN<br />
(c) Condenser: A direct contact condenser with barometric leg, situated under the turbine, is<br />
used in the DKGPP. Direct contact condensers are the least affected condensers from<br />
harmful physical and chemical impacts of the fluid. The heat transfer coefficient is also higher<br />
than with surface type condensers.<br />
Table 71 Main characteristics of turbine-generator unit [93]<br />
The condenser consists of two sections: the first one is a co-current horizontal section where<br />
the cooling water contacts steam, while the second one is a vertical barometric leg where<br />
NCGs and a small fraction of uncondensed steam are accumulated and the condensate<br />
flows down to be pumped to the cooling tower. The cooling water (2375 kg/s) is sucked from<br />
the cooling tower by vacuum in the condenser at 29 ºC temperature and flow rate and then<br />
sprayed over the steam by nozzles. Two centrifugal pumps are used to pump the<br />
condensate with a temperature of 36.6 ºC. The condenser is manufactured of stainless steel<br />
for corrosion protection. To prevent plugging of the nozzles, the nozzle diameters are kept as<br />
wide as 50 mm. The condenser-turbine coupling is made of stainless steel to absorb the<br />
vibration and thermal expansions.<br />
(d) Gas removal system: In the DKGPP, NCGs are extracted from the condenser by a<br />
compressor and passed to the dry ice production plant, which produces dry ice and liquid<br />
CO2 at a rate of 120,000 tons/yr. The capacity of the gas extraction system is 2.38 MWe<br />
(17% of the gross capacity) due to a high NCG content.
TURKEY - National Study<br />
Table 72 Main characteristics of gas compressors in the Denizli-Kizildere geothermal power plant [99]<br />
The general configuration consists of a two body compressor with two inter-coolers. The first<br />
unit rotor (LP) is directly coupled to the turbo-generator and, hence, rotates at 3000 rpm. The<br />
second unit (HP) is driven from the first, via a speed increasing gear and rotates at 3900<br />
rpm. The characteristics of the centrifugal compressor in the plant are given in Table 72 [99].<br />
(e) Cooling tower: A wet mechanical draft cooling tower is used to cool the condensate,<br />
which is used in the condenser as cooling water. The cooling tower employs four motor<br />
driven fans, each consuming 110 kWh. The fans are located at a height of 11.5 m. The<br />
condensate is pumped to a height of 8.5 m, distributed through headers and falls to the<br />
basin. Each cell is a separate unit with its own fan and louvered openings on only two sides.<br />
The cells are arranged side by side in a long row. The cell dimension is 15 m. The width,<br />
length and height of the cooling tower are 15, 60 and 15 m, respectively. Airflow is countercurrent,<br />
and the construction material is concrete. The condensate at 36.6 ºC is cooled to 29<br />
ºC by evaporation. The feed water to substitute for the evaporated water (1.7%) and leakage<br />
losses comes from the Menderes river.<br />
(f) Auxiliary equipment: The parasitic load in the plant accounts for about 20% of its gross<br />
capacity. The highest portion of the parasitic load is the compressor consumption, which<br />
constitutes 83% of the total parasitic load and 17% of gross capacity. The auxiliary<br />
equipment consumption is given in Table 73 [93].<br />
Electric production by the Kızıldere power plant according to years is shown in Table 74<br />
[101].<br />
645
646<br />
ENERGY AND SUSTAINABLE DEVELOPMENT IN THE MEDITERRANEAN<br />
Table 73 Power consumption of auxiliary equipment in the Denizli-Kizildere geothermal power plant [93]<br />
Table 74 Electric production by the Kızıldere power plant [101]<br />
4. Proposals for more sustainable energy development<br />
Turkey cannot perform a clear strategy concerning the renewable energy sources because of<br />
energy costs and investment costs. The State encouraged the private sector for natural gas<br />
combined circuit plants and guaranteed to buy the generated electricity with a low cost and<br />
with special conditions. State performed the strategy of build, operate and transfer (BOT)<br />
system and succeeded it. The share of the natural gas combined circuit plants increased to<br />
20% in total primary energy supply. The state achieved the sustainability in this wise.<br />
The share of the coal did not change in the thermal power plants (TPPs) in recent years and<br />
the energy shortage continued recently. The state wants to wipe out this shortage with<br />
nuclear energy on a large scale and with geothermal energy on a small scale in heating.<br />
Concerning the last year, state did not give any projection and targets like it has given for<br />
natural gas combined circuit plants to the investors which will build up solar energy and wind<br />
energy power plants, because energy costs of these kind of plants are so expensive.<br />
Turkey is interested in renewable energy resources and gives effort to provide the<br />
sustainability of using these energy resources. The state encouraged the municipalities in<br />
respect of the geothermal energy and gave them the permission to behave self-governing.<br />
After that the municipalities started to use geothermal basins one after another for heating of<br />
buildings. The state declared that it will be the guarantor for the credits, which the
TURKEY - National Study<br />
municipalities will take from the national and foreign banks. These shows that the<br />
development in geothermal energy is available with all aspects.<br />
The state obligates the institutions which consumed higher amount of energy than a specific<br />
capacity, to keep energy manager and consultant for the waste energy in the energy plants.<br />
The State tried to stabilize the amounts of produced and consumed energy with this way.<br />
In Turkey, the efficiency of energy utilization is not as high as Europe yet.<br />
The state leads the private sector to the World Bank‟s credit in all sources of renewable<br />
energy. The State says that it will be the guarantor for the 30-40% of the cost of the private<br />
sector‟s investments which are for their own needs. If the private sector can find buyer, it can<br />
sell the electricity produced in these plants.<br />
There is an interconnect system in electric distribution in Turkey. For example, the electrical<br />
power which is generated in Aegean region, is given to the primary network if no buyer is<br />
founded and afterwards this power is distributed to a region where power is needed. This<br />
causes high distribution losses. In addition to this network there is regional distribution<br />
networks too. But the private sector has to appropriate this power for a precisely low cost to<br />
have the opportunity to sell it to the interconnect system of the State. In Turkey power<br />
generation from renewable energy resources can have never been appropriated for low<br />
costs. It may be beneficial if the producers will use these powers for their own needs. But<br />
geothermal energy is very promising for the future.<br />
The cost of 1 kilowatt (kW) power from a renewable energy resource is 13-15 cent. If the<br />
State buys for example 10% of the generated energy by private sector for this cost, the State<br />
will gain from that too in future.<br />
In Turkey, there is not a project about wave energy and solar chimney.<br />
It is so recently that less energy consuming building projections have taken place. Ground<br />
sourced heating and passive heating systems are not common either. The State can have a<br />
consideration such as not to take tax from a building for 3 years for example, which is heated<br />
with ground sourced or passive heating systems. This policy can be beneficial in future but<br />
the State does not have a consideration like that. There is an increasing interest on these<br />
systems in society but it is not enough yet. The awareness and consciousness-raising of<br />
people are on a high level.<br />
The insulation materials and consciousness of insulation are on a developed situation.<br />
There is no a clear strategy like <strong>Mediterranean</strong> strategy in Turkey.<br />
There is a development of energy utilization and energy efficiency in Turkey. The awareness<br />
of industrial institutions is on a good level and it is developing in the public level too. The<br />
Turkish people are in a better situation in these subjects than it is supposed by Europeans.<br />
Turkey has to develop the usage of solar and wind energies because solar energy and wind<br />
energy potentials are good. The usage of ground sourced and water sourced heat pumps in<br />
greenhouse and building heating has to be developed. The usage of geothermal energy has<br />
to grow up rapidly. Energy recovery materials and technology have to be developed to<br />
perform the policy of energy recovery definitely.<br />
The question mark of European Union about the Russian natural gas is current for Turkey<br />
too. It is not clear that this subject will be ballasted.<br />
The actual situation of the petrol apart from the cost may change so seriously. After 2020,<br />
petrol may be used only for production of chemical materials, which have to be produced<br />
from petrol. The most long-term petrol is Iraq petrol, but the situation of that region is not<br />
clear. The new petrol regions have long life too however they are not of high quality.<br />
For a sustainable development of renewable energy resources and settling to the<br />
<strong>Mediterranean</strong> strategy, ground sourced and water sourced heat pump systems, wind and<br />
solar energy power plants have to be kept unobstructed always. It can be useful that the<br />
energy potentialities such as coal gasification and waste gasification will be kept<br />
647
648<br />
ENERGY AND SUSTAINABLE DEVELOPMENT IN THE MEDITERRANEAN<br />
unobstructed. Coal is a polluting energy source but after gasification, there is a possibility for<br />
mixing the coal gas with natural gas and giving the mixture to the system after the mixture is<br />
cleaned. In addition to that, there is the opportunity of emission control in coal gasification<br />
systems. If coal will be used in industry and buildings in a situation of energy crisis,<br />
emissions will be produced in very different points. Instead of that building central gasification<br />
stations with a very good control system and render natural gas + gas systems to a<br />
sustainable situation can be useful and meaningful. This can be unavoidable before<br />
hydrogen and other alternatives. The new and renewable energy technologies will not be in a<br />
highly developed situation yet when the usage of petrol is going to be impossible. In this<br />
situation, countries can lean to the coal if they have coal potentiality. Measures have to be<br />
taken for using coal with a clean method when this tendency is occurred. Biogas, animal and<br />
plant wastes are not so unimportant for energy production, even if they are considered to be<br />
insufficient. Biogas can be obtained from leaves and tree wastes.<br />
The renewable energy technologies and the energy quantities which are necessary for<br />
production per unit have to be kept always in the journal and policy of the country. Legal<br />
regulations have to be performed and the State has to give effort to make the public<br />
assimilate these regulations highly.<br />
In industrial, residential and tertiary sectors, instead of carrying the natural gas with local<br />
networks and pipelines, a regional natural gas combined circuit plants can be built up and<br />
carrying electrical energy into the buildings. Greenhouse systems and heat pump systems<br />
using this electrical energy can be used in buildings for heating. These will provide high<br />
energy efficiency and operational facilities. In addition to these, heat pump systems can be<br />
operated with the waste heat of the circuit plants. The efficiency of combined circuit plants is<br />
54%. The usage of the waste heat in absorptive cooling systems and regional heating can<br />
increase this efficiency. Greenhouse systems can reduce energy consumption to 40% in<br />
buildings. The State has to subsidize the production and selling of solar cells in any case and<br />
encourage the people. The State can perform also a policy like not to take fees for fuels for a<br />
couple of years from people who set up a heat pump system for heating.<br />
5. Annexes to be attached to the Study<br />
There were some difficulties to get the information necessary to produce this study. It was<br />
difficult to get information from the main sources about these subjects. Consequently, I had<br />
to get information from the internet sites of the state and from published articles which are<br />
about the energy subject of Turkey. But sometimes, it had been so difficult to obtain the<br />
information from these sites and articles, which are actually needed.<br />
This study had been analysed from the National standpoint, but it had been so difficult to<br />
analyse it from <strong>Mediterranean</strong> standpoint, because Turkey has a national strategy for<br />
sustainable development but does not have a clear <strong>Mediterranean</strong> strategy for sustainable<br />
development.<br />
Some statistical tables are given below which can be useful for understanding the study<br />
better.<br />
The list of the main references used are given under the tables.
TURKEY - National Study<br />
Table 75 Annual development of installed capacity and generation in Turkey [11]<br />
Table 76 Annual development of electricity generation-consumption and losses in Turkey (GWh) [11]<br />
649
650<br />
ENERGY AND SUSTAINABLE DEVELOPMENT IN THE MEDITERRANEAN<br />
Table 77 Annual development of Turkey’s gross electricity generation by share of primary energy<br />
resources (%) [11]
TURKEY - National Study<br />
Table 78 Breakdown of installed electricity capacity in Turkey (MW) [144]<br />
651
652<br />
ENERGY AND SUSTAINABLE DEVELOPMENT IN THE MEDITERRANEAN<br />
Table 79 Breakdown of electricity generation in Turkey (GWh) [144]
TURKEY - National Study<br />
Table 80 Primary energy production, consumption and the ratio that production meets consumption in<br />
Turkey (x1000 tep) [145]<br />
653
654<br />
ENERGY AND SUSTAINABLE DEVELOPMENT IN THE MEDITERRANEAN<br />
Table 81 Global renewable energy indicators [146]<br />
Table 82 Distribution of licenses by fuel (energy) types as well as the breakdown of 132 autoproducers<br />
by sector (2003) [147]
TURKEY - National Study<br />
Table 83 Performance of Turkey’s conversion sector in 2000 [148]<br />
655
656<br />
ENERGY AND SUSTAINABLE DEVELOPMENT IN THE MEDITERRANEAN<br />
Table 84 Breakdown of Turkey’s electricity installed capacity by utilities and resources in MW [52]
TURKEY - National Study<br />
Table 85 Turkey’s total installed and obtainable power of plants by energy resources in MW [52]<br />
657
658<br />
ENERGY AND SUSTAINABLE DEVELOPMENT IN THE MEDITERRANEAN<br />
Table 86 Wind power plant projects in Turkey [150,151]
TURKEY - National Study<br />
Table 87 Operational and investment performance data sets for thermal power plants [152]<br />
Table 88 Energy and exergy production and consumption values of Turkey in 2001 [153]<br />
659
660<br />
ENERGY AND SUSTAINABLE DEVELOPMENT IN THE MEDITERRANEAN<br />
Table 89 Energy and exergy production values for Turkey’s renewables and total in 2001 [153]<br />
Table 90 Greenhouse gas emissions in Turkey (thousand tons) [111]<br />
Table 91 Turkey’s TPEP and TPEC, 1990–2001, in Quads [154]<br />
Table 92 Petroleum production and consumption in Turkey, 1990–2001, in thousand of barrels per day<br />
[154]<br />
Table 93 Dry natural gas production and consumption in Turkey, 1990–2001, in Tcf [154]
TURKEY - National Study<br />
Table 94 Coal production and consumption in Turkey, 1990–2001, in millions of tons [154]<br />
Table 95 Distribution of under design hydro power plants according to their hydro capacity (2004) [155]<br />
Table 96 Net Electricity Consumption per capita of some countries (kWh/per capita) [144]<br />
661
662<br />
ENERGY AND SUSTAINABLE DEVELOPMENT IN THE MEDITERRANEAN<br />
Table 97 Some SHPs including run of river systems in operation and installed capacity less than 10MW<br />
[156]
TURKEY - National Study<br />
Table 98 Hydroelectric generating plants in Turkey [157]<br />
Table 99 Thermal-electric power plants in Turkey [158]<br />
663
664<br />
ENERGY AND SUSTAINABLE DEVELOPMENT IN THE MEDITERRANEAN<br />
Table 100 Water and energy potential of selected river basins in Turkey [56]<br />
Table 101 Energy and exergy utilization (in 109 MJ).[159]
TURKEY - National Study<br />
Table 102 Energy and exergy production values for Turkey’s renewables and total in 2001[153]<br />
Table 103 Energy and exergy utilization values for Turkey’s renewables by subsector in 2001[153]<br />
Table 104 Utilization of renewables energy and exergy in the conversion sector in 2001 [153]<br />
665
666<br />
ENERGY AND SUSTAINABLE DEVELOPMENT IN THE MEDITERRANEAN<br />
Table 105 Energy and exergy utilization efficiency values for Turkey’s renewables and total in 2001 (%)<br />
[153]<br />
Table 106 Cost parameters of the unit processes [160]
TURKEY - National Study<br />
Table 107 Emission factors [160]<br />
Table 108 Development of energy demands [160]<br />
667
668<br />
ENERGY AND SUSTAINABLE DEVELOPMENT IN THE MEDITERRANEAN<br />
Table 109 Development of fuel, heat and electricity prices [160]<br />
Table 110 Status of geothermal space heating in Turkey (MWt) [101]
TURKEY - National Study<br />
Table 111 Direct use of geothermal energy in Turkey [97]<br />
Table 112 Present and future geothermal heat and electricity generation projections in Turkey [101]<br />
669
670<br />
ENERGY AND SUSTAINABLE DEVELOPMENT IN THE MEDITERRANEAN<br />
Table 113 European OECD countries wind potential [149]<br />
Table 114 Electricity production of Turkey between years 1999 and 2005 [152]<br />
Table 115 Some climatic features and air-to-air heat pump COP values for some cities of Turkey [161]
TURKEY - National Study<br />
Table 116 Predictions of energy forest effects on production and contribution to country’s economy in<br />
Turkey [162]<br />
Table 117 Total recoverable bioenergy potential in Turkey (1998) [163]<br />
671
6. References<br />
672<br />
ENERGY AND SUSTAINABLE DEVELOPMENT IN THE MEDITERRANEAN<br />
[1] Yılmaz A.O, Uslu T. Energy policies of Turkey during the period 1923–2003. Energy Policy 2007; 35: 258<br />
264.<br />
[2] Ozturk H.K, Yilanci A, Atalay O. Past, present and future status of electricity in Turkey and the share of<br />
energy sources. Renewable and Sustainable Energy Reviews 2007; 11: 183–209.<br />
[3] Yılmaz, A.O., 2003. General outlook to Turkish energy sector and the importance of coal in energy<br />
production. In: Turkish Fourth Energy Semposium, Electricity Engineers Chamber of Turkey, Ankara.<br />
[4] Yılmaz, A.O., 2004. Energy Statistics of Turkey, Unpublished Documents, Trabzon.<br />
[5] TEDAS, 2004. Turkish Electricity Distribution Statistics. Turkish Electricity Distribution Co. R & D <strong>Plan</strong>ning<br />
and Foreign Affairs Department, http://www.tedas.gov.tr<br />
[6] TEIAS, 2004. Electricity generation-transmission statistics of Turkey. Turkish Electrıcıty Transmıssıon<br />
Co.General Management Rpc Department., Available from: http://www.teias.gov.tr/ [in Turkish and<br />
English].<br />
[7] Arıoglu, E., Yılmaz, A.O., 1997a. A short statistical evaluation of Turkish lignite sector during 1983–1993.<br />
Istanbul branch of Mining Engineers Chamber of Turkey, Working Report No. 2, Istanbul.<br />
[8] Arıoglu, E., Yılmaz,A.O., 1997b. Turkish economy with macro economic indications and statistical<br />
evaluation of Turkish mining sector. Istanbul Branch of Mining Engineers Chamber of Turkey, Working<br />
Report No. 5, Istanbul.<br />
[9] DIE, 2003. Basic Statistic Indications of Turkey, Available From: http://www.die.gov.tr/ [in Turkish and<br />
English].<br />
[10] EUAS, 2004. Statistic Data, Electricity Generation Co. Inc., http:// www.euas.gov.tr.<br />
[11] IEA. International Energy Agency. Renewables information 2003, International energy agency statistics.<br />
Paris: Head of Publications Service; 2003.<br />
[12] TEIAS. Directorate-general of Turkish electricity transmission. http://www.teias.gov.tr; 2003.<br />
[13] Arsel, M, Kaygusuz, K. Energy Politics and Policy in Turkey.<br />
[14] TÜBITAK, Vizyon (2003). 2023 Teknoloji Öngörüsü Projesi, Enerji Ve Dogal Kaynaklar Paneli, 24<br />
Temmuz, Rapor Ekleri, EK-A, Türkiye, Dünya Ve OECD Verileri<br />
[15] Kilic, F.C, Kaya, D. Energy production, consumption, policies, and recent developments in Turkey.<br />
Renewable and Sustainable Energy Reviews 2007; 11: 1312-1320.<br />
[16] Kaya, D. Renewable energy policies in Turkey. Renewable Sustainable Energy Rev 2006;10:152–63.<br />
[17] http://www.enerji.gov.tr<br />
[18] Akdeniz, F, Caglar A, Gu¨ llu¨ D. Revent energy investigation on fossil and alternative nonfossil resources<br />
in Turkey. Energy Conversion Manage 2002;43:575–89.<br />
[19] Evrendilek F, Ertekin C. Assessing the potential of renewable energy sources in Turkey. Renewable<br />
Energy 2003; 28: 2303-2315.<br />
[20] International Energy Agency (IEA). Energy policies of IEA countries: Turkey 2001 review. Head of<br />
Publications Service. Paris: OECD; 2001.<br />
[21] Salvarlı H. Some aspects on hydraulic energy and environment in Turkey. Energy Policy 2006; 34: 3398-<br />
3401.<br />
[22] Demirbas A. Energy balance, energy sources, energy policy, future developments and energy investments<br />
in Turkey. Energy Conversion and Management 2001; 42: 1239-1258.<br />
[23] WECTNC 1996. Turkey Energy Report-1995. World Energy Council-Turkish National Committee, Ankara,<br />
1996.<br />
[24] Bilgen S, Keles S, Kaygusuz A, Sarı A, Kaygusuz K. Global warming and renewable energy sources for<br />
sustainable development: A case study in Turkey. Renewable and Sustainable Energy Reviews.<br />
[25] International Energy Agency (IEA). Energy policies of IEA countries: Turkey. Paris: IEA; 2005.<br />
[26] Ministry of Energy and Natural ResourcesMENR. Energy report of Turkey. Turkey: Ankara; 2005<br />
(http://www.enerji.gov.tr).<br />
[27] World Energy Council Turkish National Committee (WECTNC). Energy Report of Turkey in 2002. Ankara,<br />
Turkey: WECTNC; 2003 [in Turkish].<br />
[28] Turkey Energy and Environmental Review, Task 7: Energy Sector Modeling, Prepared by Conzelman G,<br />
Koritarov V, Center for Energy, Environmental, and Economic Systems Analysis (CEEESA), Argonne<br />
National Laboratory, 2002.
TURKEY - National Study<br />
[29] Kilic A.M. Turkey‟s natural gas necessity, consumption and future perspectives. Energy Policy 2006; 34:<br />
1928-1934<br />
[30] MENR, 2002. Ministry of Energy Natural Resources. Annual Activation Report of 2002, Ankara.<br />
[31] CIA World Factbook, 1998.<br />
[32] WECTNC 1995. Energy Report-1994. World Energy Council-Turkish National Committee, Ankara, 1995.<br />
[33] Hepbasli A. Development and restructuring of Turkey‟s electricity sector: a review. Renewable and<br />
Sustainable Energy Reviews 2005; 9: 311–343.<br />
[34] Tunc M, Camdali U, Liman T, Deger A. Electrical energy consumption and production of Turkey versus<br />
world. Energy Policy 2006; 34: 3284–3292.<br />
[35] USDOE, US Department of Energy, http://www.energy.com.<br />
[36] EIE, General Directorate of Electrical Power Resources Administration, http://www.eie.gov.tr.<br />
[37] Demirbas, A., 1998. Determination of combustion heat of fuels by using non-calorimetric experimental<br />
data. Energy Ed Science and Technology 1, 7–12.<br />
[38] Yılmaz,_A.O, Uslu, T. The role of coal in energy production-consumption and sustainable development of<br />
Turkey. Energy Policy 2007; 35: 1117–1128.<br />
[39] RWE, 2004. World Energy Report, 2004.<br />
[40] Balat, H. A renewable perspective for sustainable energy development in Turkey: The case of small<br />
h1dropower plants. Renewable and Sustainable Energy Reviews.<br />
[41] Demirbas A, Bakıs R. Turkey‟s water resources and hydropower potential. Energy Exploration Exploitation<br />
2003;21:405–14.<br />
[42] Republic of Turkey, Primary Ministry State Institute of Statistics (SIS), The electricity generation and<br />
distribution quarterly survey, 2003 Fourth Quarter (October–November–December), Necatibey St. No: 114,<br />
Yucetepe, Ankara, Turkey, 2004 (http://www.die.gov.tr).<br />
[43] Balat M, Balat H, Acici N. Thermal- electricity power plants (TPPs) in Turkey. Energy Exploration<br />
Exploitation 2004;22:367–76.<br />
[44] Ocak, M, Ocak, Z, Bilgen, S, Keles, S, Kaygusuz, K. Energy utilization, environmental pollution and<br />
renewable energy sources in Turkey Energy Conversion and Management 2004; 45: 845–864.<br />
[45] Ministry of Energy and Natural Resources (MENR). Energy Report of Turkey, Ankara, Turkey, 2001.<br />
Available from: http://www.menr.gov.tr.<br />
[46] State <strong>Plan</strong>ning Organization (SPO). Eighth Five-Year Development <strong>Plan</strong>. Energy Report of Turkey, DPT,<br />
Ankara, Turkey, 2001.<br />
[47] Hepbasli, A, Ozalp, N. Development of energy efficiency and management implementation in the Turkish<br />
industrial sector. Energy Conversion and Management 2003; 44: 231–249.<br />
[48] The Turkish Scientific and Technologic Research Committee-Turkish Technology Development<br />
Committee, Science Technology-Industry Discussion Platform. Energy Technologies Policies Study Group<br />
Report, Ankara, Turkey, May 1998 [in Turkish].<br />
[49] Utlu, Z, Hepbasli, A. Estimating the energy and exergy utilization efficiencies for the residential–<br />
commercial sector: an application. Energy Policy 2006; 34: 1097–1105<br />
[50] SIS State Institute of Statistics, 2002b. Energy Consumption in Residences in 1998. Prime Ministry of<br />
Turkey, Ankara.<br />
[51] Utlu, Z., Hepbasli, A., 2003. A study on the evaluation of energy utilization efficiency in the Turkish<br />
residential commercial sector using energy and exergy analyses. Energy and Buildings 35 (11), 1145–<br />
1153.<br />
[52] Turkish Electricity Transmission Co. (TEIAS). Short history of electrical energy development in Turkey and<br />
some statistical figures. Available from: http://www.teias.gov.tr/ [in Turkish].<br />
[53] European Commission-Directorate General for Energy (DGXVII), The SYNERGY Program Report, 1997.<br />
[54] Akcasoy K, Onder F, Guven S. Statistical evaluation of greenhouse gas emissions of Turkey between the<br />
years of 1970 and 2010, DIE. Turkey: Ankara; 2000.<br />
[55] State Institute of Statistics (SIS). Statistic Yearbook of Turkey in 2000. Prime Ministry, Republic of Turkey,<br />
Ankara, 2001.<br />
[56] State Water Works (DSI). Statistics in Hydropower, Ankara, Turkey, 2001.<br />
[57] UNDP/World Bank Energy Sector Management Assistance Program (ESMAP): Turkey––Energy and the<br />
Environment, Issues and Options Paper. Report 229, April 2000.<br />
673
674<br />
ENERGY AND SUSTAINABLE DEVELOPMENT IN THE MEDITERRANEAN<br />
[58] Topcuoglu, S, Kırbasoglu, C, Gungor, N. Heavy metals in organisms and sediments from Turkish coast of<br />
the Black Sea, 1997–1998. Environ Int 2002;27:521–6.<br />
[59] Bakıs R, Demirbas A. Sustainable development of small hydropower plants (SHPs). Energy Sources<br />
2004;26:1105–18.<br />
[60] Kueny JL. Part I, Objectives for small hydro technology, Institute National Polytechnique de Grenoble, B.P.<br />
53-38041-Grenoble Cedex 9-France, 2003. p. 1–35 (http://www.small-hydro.com).<br />
[61] TEAS. Turkish Electricity Company. Electricity generation-transmission statistics of Turkey: 1999. Ankara;<br />
2000.<br />
[62] State Water Works (DSI˙). Hydropower potential in Turkey. Turkey: Ankara; 2004.<br />
[63] General Directorate of State Hydraulic Works (DSI), Energy: hydroelectric energy, 2005<br />
(http://www.dsi.gov.tr).<br />
[64] European Small Hydropower Association (ESHA), Small hydropower situation in the new EU member<br />
states candidate countries, thematic network on small hydropower (TNSHP) project, Renewable Energy<br />
House, Rue du Trone 26, 1000 Brussels, Belgium, 2004 (http://www.esha.be).<br />
[65] Greenhouse Gas Mitigation in Energy Sector for Turkey, Working Group Report, MENR Ankara, Turkey,<br />
2005. /www.iklim.cevreorman.gov.trS (accessed on 20.11.05).<br />
[66] Turker, M.F, Ayaz, H, Kaygusuz, K. Forest biomass as a source of renewable energy in Turkey. Energy<br />
Sources 1999; 21: 705-14.<br />
[67] Geothermal energy in Turkey, (www.jeotermaldernegi.org.tr) (accessed on 23.05.06).<br />
[68] Hepbasli, A, Canakcı, C. Geothermal district heating applications in Turkey: a case study of Izmir–Balcova.<br />
Energy Conversion and Management 2003; 44: 1285–1301.<br />
[69] Mertoglu O. Geothermal district heating experience in Turkey. Geo-heat Center Bull 2001;22(2):14–8.<br />
[70] Gunerhan G,Kocar G,Hepbasli A. Geothermal energy utilization in Turkey. Int J Energy Res<br />
2001;25(9):769–84.<br />
[71] Mertoglu O. Geothermal utilization development experience in Turkey. In: Fourth International Thermal<br />
Energy Congress, ITEC 2001,Cesme,Izmir,8–12 July,2001 (unpublished).<br />
[72] Lund JW,Freeston DH. World-wide direct uses of geothermal energy 2000. Geothermics 2001;30:29–68.<br />
[73] Mertoglu O. Applications of geothermal energy in Turkey and its development. In: Proceedings of the<br />
Geothermal Energy in Local Governments and Geotechnical Applications Symposium,Ankara,Turkey, 20–<br />
22 November, 2000. p. 1–7 (in Turkish).<br />
[74] State <strong>Plan</strong>ning Organization (SPO). Seventh five-year development plan. Geothermal Energy Special<br />
Impression Commission Report (in Turkish). Ankara, Turkey: DPT; 1996.<br />
[75] Batik H, Kocak A, Akkus I, Simsek S, Mertoglu O, Bakir N. Geothermal energy utilization development in<br />
Turkey––present geothermal situation and projections. In: Proceedings World Geothermal Congress<br />
2000,Kyushu-Tohuko,Japan,May 28–June 10,2000. p. 85–91.<br />
[76] OGI, Orme Geothermal Inc. Documents on geothermal energy, Ankara, Turkey, 2001.<br />
[77] Canakci C. Energy and Exergy Analysis of the Izmir–Balcova Geothermal District Heating System. M.Sc.<br />
Thesis (supervisor: Hepbasli A),Graduate School of Natural and Applied Science of Ege<br />
University,Izmir,Turkey (in progress and in Turkish).<br />
[78] Karamanderesi IH. Geothermal energy potential and utilization of Turkey. In: Proceedings of IV. Deutsch–<br />
Turkish Energy Symposium, Izmer,Turkey,21–24 June,2001 (in Turkish and in press).<br />
[79] IBGEI, Izmir–Balcova Geothermal Energy Inc., unpublished documents,Izmir,Turkey,2001.<br />
[80] Popovski K,Bascetincelik A,Akkus MF,Aires-Barros LA. Present status and prospectives of geothermal<br />
energy use in agriculture in Turkey. Rural Energy Country Rev. 1988;1:21.<br />
[81] Mertoglu O, Basarir N. Geothermal utilization and applications in Turkey. In: Proceedings of the World<br />
Geothermal Congress,Florence, Italy,18–31 May,1995. p. 345–9.<br />
[82] Bloomquist R,Nimmons J. Geothermal district energy. In: Course on Heating with Geothermal Energy:<br />
Conventional and New Schemes (conveyor: Lienau PJ). WGC2000 Short Courses, Kazuno, Tohoku<br />
District, Japan,8–10 June, 2000. p. 85–136.<br />
[83] Lund JW,Lienau PJ. Geothermal district heating. In: Proceedings of International Course on Geothermal<br />
District Heating Schemes. Cesme, Izmir, Turkey,19–25 October,1997. p. 1–27 [chapter 33].<br />
[84] TY,Teknik Yayincilik Inc. Table showing energy cost comparisons of different fuels for residential use used<br />
in Turkey. Plumbing Mag 2001;72:185–90,in Turkish.
TURKEY - National Study<br />
[85] Hepbasli A, Yilmaz H, Eroglu S. Three case studies of ground source heat pump systems design and<br />
economic feasibility. In: CD-Proceedings of ANNEX 14 Cooling in All Climates with Thermal Energy<br />
Storage Fourth Workshop. International Energy Agency, Istanbul, Turkey, 19 April, 2001.<br />
[86] Eastop TD, Craft DR. Energy efficiency for engineers and technologists. Longman Group UK Limited;<br />
1996.<br />
[87] Barbier E. The status of the world geothermal development. In: The Status of the World Geothermal<br />
Development. International Course on Economy of Integrated Geothermal Systems, Ponta Delgada,<br />
Azores, Portugal,16–18 September,1998. p. 51–8.<br />
[88] Fridleifsson IB. Geothermal energy for the benefit of the people. Renew Sust Energy Rev 2001;5:299–312.<br />
[89] Hepbasli A. Energy conservation studies on residential heating systems: an application for Izmir,Turkey.<br />
Int J Global Energy Issues 2001;15(3–4):247–63.<br />
[90] EIE,General Directorate of Electrical Power Resources Survey Administration. Fundamentals of Industrial<br />
Energy Management,vol. II. Ankara,Turkey. 1997 [chapter 6] (in Turkish).<br />
[91] Sorensen HA. Energy conversion systems. New York,USA: John Wiley; 1983.<br />
[92] Giese LB. Geotechnische und umweltgeologische Aspecte bei der Foerderung und Reinjection von<br />
Thermalfluiden zur Nutzung geothermischer Energie am Beispiel des geothermal feldes Kizildere und des<br />
umfeldes, W-Anatolien/Turkei, Ph.D. Thesis, Free University Berlin Fac. of Geosciences; 1997, 201 p (in<br />
German).<br />
[93] Sarikurt H. Report on the Kizildere Geothermal Power <strong>Plan</strong>t, 1983 (in Turkish).<br />
[94] Serpen U, Satman A. Reassessment of the Kizildere geothermal reservoir. In: CD-Proceedings of World<br />
Geothermal Congress, Kyushu-Tohuku, Japan, May 28–June 10; 2000. p. 2869–74.<br />
[95] Simsek S. Present status and future development of the Denizli-Kizildere geothermal field of Turkey. In:<br />
International Symposium on Geothermal Energy, Geothermal Resources Council, Int. Vol.; 1985; 203–14.<br />
[96] Simsek S, Demirel, Z. Geothermal energy reserves in Turkey. In: K, Popovski, AN, Rodrigues (Eds.),<br />
Proceedings of the International Workshop, Heating Greenhouses with Geothermal Energy, International<br />
Geothermal Days, Azores, Portugal, 1998. p. 355–66.<br />
[97] Gunerhan G, Kocar G, Hepbasli A. Geothermal energy utilization in Turkey. Int J Energy Res<br />
2001;25(9):769–84.<br />
[98] MTA, General Directorate of Mineral Research and Exploration of Turkey. Steam field and power plant<br />
data. Personal communication, 1996 (in Turkish).<br />
[99] TEAS, Turkish Electricity Generation and Transmission Corporation. Personal communications on the<br />
Denizli-Kizildere geothermal power plant, 2002 (in Turkish).<br />
[100] Satman A, Serpen U, Mihcakan M. Assessment of reinjection trials in Kizildere geothermal field. In: CD-<br />
Proceedings of World Geothermal Congress, Kyushu-Tohuku, Japan, May 28–June 10; 2000. p. 1695–1700.<br />
[101] SPO, State <strong>Plan</strong>ning Organization. Eighth Five-Year Development <strong>Plan</strong>. Report of Geothermal Energy<br />
Special Commission. SPO (DPT), Ankara, Turkey, 2001 (in Turkish).<br />
[102] Gunerhan GG. Theoretical and experimental investigations on condensation/boiling modeled heat<br />
exchangers (reboilers) designed for removal of noncondensable gases from geothermal steam. Ph.D.<br />
Thesis, Graduate School of Natural and Applied Science, Branch of Solar Energy Science, Ege University,<br />
Bornova, Izmir, Turkey, 2000 (in Turkish).<br />
[103] MENR/TEAS. Base Case Analysis Of Energy Development and CO2 Emissions in Turkey. Ministry of<br />
Energy and Natural Resources (MENR), Ankara, Turkey, November 2000.<br />
[104] Southeastern Anatolia Project (GAP). The GAP Project. Available from: http://gap.gov.tr/.<br />
[105] Ministry of Environment (ME). Turkish National Environmental <strong>Action</strong> <strong>Plan</strong> (NEAP), ME, Ankara, Turkey,<br />
1998.<br />
[106] United Nations Development Program (UNDP). Black Sea Biological Diversity in Turkey. Turkish National<br />
Report, Black Sea Environmental Series, vol. 9, UN: New York, 1998.<br />
[107] International Energy Agency (IEA). Renewable energy: market and policy trends in IEA countries. Paris:<br />
IEA; 2004.<br />
[108] Kaygusuz K, Sarı A. Renewable energy potential and utilization in Turkey. Energy Convers Manage<br />
2003;44:459–78.<br />
[109] Yuksek O, Komurcu MI, Yuksel I, Kaygusuz K. The role of hydropower meeting the electric energy<br />
demand in Turkey. Energy Policy 2006;34:3093–103.<br />
[110] Tasdemiroglu E. Economics of biogas space heating systems in rural Turkey. Bioresource Technol<br />
1991;36:147–55.<br />
675
676<br />
ENERGY AND SUSTAINABLE DEVELOPMENT IN THE MEDITERRANEAN<br />
[111] Kaygusuz K, Turker MF. Biomass energy potential in Turkey. Renew Energy 2002;26:661–78.<br />
[112] Acaroglu M, Aksoy AS, Ogut H. The potential of biomass and animal waste of Turkey and the possibilities<br />
of these as fuel in thermal generating stations. Energy Sources 1999;21:339–45.<br />
[113] Balat M. Use of biomass sources for energy in Turkey and a view to biomass potential. Biomass Bioenergy<br />
2005;29:32–41.<br />
[114] Kose F, Dincer K. Biogas production from organic wastes (in Turkish). In: Twelth National Heat Science<br />
and Technique Congress, 28–29 February 2000, Sakarya, Turkey. p. 681–86.<br />
[115] Hepbaslı A, Ozgener L. Development of geothermal energy utilization in Turkey: a review. Renew Sustain<br />
Energy Rev 2004;8:433–60.<br />
[116] Tasdemiroglu E, Award M. Technical and economic aspects of solar space heating in Turkey. Energy<br />
1990;15:1035–50.<br />
[117] Tasdemiroglu E, Arınc- F. Comparison of the available solar radiation on flat-plate and concentrating solar<br />
collectors in Turkey. Solar Wind Technol 1990;7:293–7.<br />
[118] State Institute of Statistics (DIE). Statistic yearbook of Turkey in 2002. Ankara, Republic of Turkey: Prime<br />
Ministry; 2003.<br />
[119] Esen M, Ayhan T. Development of a model compatible with solar assisted cylindrical energy storage tank<br />
and variation of stored energy with time for different phase change materials. Energy Convers Manage<br />
1996;37:1775–80.<br />
[120] Sarı A, Kaygusuz K. Thermal energy storage system using stearic acid as a phase change material. Sol<br />
Energy 2001;71:365–76.<br />
[121] Sodha MS, Chandra R. Solar drying systems and their testing procedures: a review. Energy Convers<br />
Manage 1994;35:219–67.<br />
[122] Ekechukwu OV, Norton B. Review of solar-energy drying systems II: an overview of solar drying<br />
technology. Energy Convers Manage 1999;40:615–55.<br />
[123] Ulgen K, Hepbasli A. Solar radiation models. Part 2: solar energy utilization in Turkey. Energy Sources<br />
2004;26:521–32.<br />
[124] Oztekin S, Bascetincelik A, Soysal Y. Crop drying programme in Turkey. Renew Energy 1999;16:789–94.<br />
[125] Kaygusuz K. Renewable and sustainable energy use in Turkey: a review. Renew Sustain Energy Rev<br />
2002;6:339–66.<br />
[126] EIE, Electrical Power Resources Survey and Development Administration. Potential of Turkish Wind and<br />
Solar Power, /www.eie.gov.trS (accessed on 20.05.06).<br />
[127] Alacakır FB. Didim‟de kurulan s-ebeke bag˘ lantılı gu¨ nes- pili sistemi. EIE Dergisi 1997;179:54–60.<br />
[128] Ogulata RT. Energy sector and wind energy potential in Turkey. Renew Sustain Energy Rev 2003;7:469–84.<br />
[129] SPO,State <strong>Plan</strong>ning Organization. Energy. Eighth Five Year Development <strong>Plan</strong>. Report of private<br />
specialization commission. Publication no. 2610,Ankara, Turkey,2001 (in Turkish).<br />
[130] Kilkis IB, Eltez M. Advances in geothermal energy use. ASHRAE J 1996;38:1-7.<br />
[131] US Department of Energy (DOE). Geothermal heat pumps (report), DOE/GO, 1998.<br />
[132] Kececiler A, Acar HI, Dogan A. Thermodynamic analysis of the absorption refrigeration system with<br />
geothermal energy: An experimental study. Energy Convers Mgmt 2000;41:37-48.<br />
[133] International Energy Agency Heat Pump Centre. Heat Pumps: An opportunity for reducing the greenhouse<br />
effect (brochure), The Netherlands, 1997.<br />
[134] Altinisik K, Mahmut DT, Karakoc F, Kaplan Y, Selim I. Design and testing of a solar assisted heat pump.<br />
In: 12th National Heat Science and Technology Congress, 28-29 February, 2000, Sakarya, Turkey, p. 137-<br />
42 [in Turkish].<br />
[135] World Energy Council Turkish National Committee (WECTNC). Turkey Energy Report 2000, Ankara,<br />
Turkey.<br />
[136] OECD/IEA. Energy policies of IEA countries: Turkey. Review, OECD/IEA, Paris, 2001.<br />
[137] Southeastern Anatolia Project (GAP). 2000. energy Production in GAP region. Available from<br />
http://www.gap.gov.tr/enerji.html.<br />
[138] Kaya D. Renewable energy policies in Turkey. Renewable and Sustainable Energy Reviews 2006; 10:<br />
152–163.<br />
[139] Meda Project, Diagnostic Study, Questionnaire, 2002.
TURKEY - National Study<br />
[140] Utlu Z, Hepbasli A. A review and assessment of the energy utilization efficiency in the Turkish industrial<br />
sector using energy and exergy analysis method. Renewable and Sustainable Energy Reviews.<br />
[141] Ministry of Energy and Natural Resources (MENR). Energy Report of Turkey, Ankara, Turkey, 2000.<br />
Available from: http://www.enerji.gov.tr.<br />
[142] Turkish Industrialist‟ and Businessmen‟s Association (TUSİAD). Turkey‟s energy strategy on the brink of<br />
the 21 st century: An overview, This report prepared by Ultanir, M.Ö. İstanbul, Turkey, 1998 [in Turkish].<br />
[143] Electric energy and nuclear energy in Turkey. Available from: .<br />
http://www.emo.org.tr/merkez/dergi/406sayi/enerji.htm.<br />
[144] MENR. The ministry of energy and natural resources of Turkey. Report of long term electric energy<br />
demand study for Turkey; 2004 [in Turkish].<br />
[145] SIS, 2003, 2004. State Institute of Statistics Statistic yearbook of Turkey in 2003, in 2004 Prime Ministry,<br />
Republic of Turkey, Ankara.<br />
[146] Renewables 2005: Global Status report, (www.ren21.net) (accessed on 10.05.06).<br />
[147] Ministry of Energy and Natural Resources of Turkey (MENR). As we leave 2003 behind. Energy<br />
Cogeneration World 2003;22:52–5 [in Turkish and English].<br />
[148] Utlu Z, Hepbasli A. Turkey‟s sectoral energy and exergy analysis between 1999 and 2000. Int J Energy<br />
Res 1999 [in press].<br />
[149] Van Wijk AJM, Coelingh JP. OECD countries wind potential, 93091. Utrect: Utrecht University; 1993 p. 35.<br />
[150] Aras H. Wind energy status and its assessment in Turkey. Renew Energy 2003;28(14):2213–20.<br />
[151] Uyar TS. Türkiye Enerji Sektörunde Karar Verme ve Rüzgar Enerjisinin Entegrasyonu; March 2000.<br />
Available at http://www.egetek.org/pages/news/TanayUyar02.html.<br />
[152] Sarica K, Or I. Efficiency assessment of Turkish power plants using data envelopment analysis. Energy.<br />
[153] Hepbasli A, Utlu Z. Evaluating the energy utilization efficiency of Turkey‟s renewable energy sources<br />
during 2001. Renewable and Sustainable Energy Reviews 2004;8: 237–255.<br />
[154] DOE–EIA Annual Reports, 2003. http://www.energy.com, http://www.eia.gov.<br />
[155] EIE (Electrical Power Resources Survey and Development Administration), 2004. Hydro Electric Power<br />
<strong>Plan</strong>t Projects Carried out by EIE, Ankara, Turkey, pp. 1–45 (in Turkish).<br />
[156] General Directorate Electrical Power Resources Survey and Development Administration (EIE), HPP<br />
Projects: Production Characteristics of the HPPs in Operation, Cankaya, Ankara, Turkey, 2005<br />
(elektriketut@eie.gov.tr).<br />
[157] DSI, General Directorate of State Hydraulic Works, http://www.dsi.gov.tr/.<br />
[158] IEA, 2003. International Energy Agency, Key World Energy Statistics, http://www.iea.org.<br />
[159] Ileri A, Gurer T. Energy and Exergy Utilization and Turkey During 1995. Energy Vol. 23, No. 12, pp. 1099–<br />
1106, 1998.<br />
[160] Ercan Y. Emission-reduction strategies for energy-supply systems near urban areas. Energy 24 (1999)<br />
419–431.<br />
[161] Kaygusuz K, Kaygusuz A. Renewable energy and sustainable development in Turkey Renewable Energy<br />
2002;25: 431–453.<br />
[162] State <strong>Plan</strong>ning Organization (SPO). Eighth Five-Year Development <strong>Plan</strong>. Forestry Special Impression<br />
Commission Report. DPT, Ankara, Turkey, 2001 [in Turkish].<br />
[163] Kaygusuz K. Sustainable development of hydropower and biomass energy in Turkey. Energy Conversion<br />
and Management 2002;43:1099–1120.<br />
[164] EIE, Electrical Power Resources Survey and Development Administration. Solar Energy Activities of EIE.<br />
Available from: http://www.eie.gov.tr.<br />
[165] Türkiye‟de Yalıtım Gerçeği. İZODER Isı Su Ses ve Yangın Yalıtımcıları Derneği. 2006.<br />
[166] http://www.country-studies.com/turkey/energy.html.<br />
[167] http://www.geni.org/globalenergy/library/national_energy_grid/turkey/index.shtml<br />
[168] http://www.nuce.boun.edu.tr/eia.html.<br />
[169] http://www.inogate.org/html/resource/turkey.pdf.<br />
[170] Energy Overview of Turkey (http://www.fe.doe.gov/international/turkover.html (17 of 30)24.06.2004 21:35:37).<br />
[171] Ocak M, Ocak Z, Bilgen S, Keles S, Kaygusuz K. Energy utilization, environmental pollution and<br />
renewable energy sources in Turkey. Energy Conversion and Management 45 (2004) 845–864.<br />
677
7. Table of illustrations<br />
678<br />
ENERGY AND SUSTAINABLE DEVELOPMENT IN THE MEDITERRANEAN<br />
Table 1 Population, economy and energy ................................................................................................................................... 573<br />
Table 2 The amount of fossil energy resources in Turkey ............................................................................................................. 573<br />
Table 3 Turkey’s renewable energy potential .............................................................................................................................. 574<br />
Table 4 Electricity production from thermal and hydropower sources according to years in Turkey................................................ 574<br />
Table 5 Present and future total final energy production in Turkey (mtoe) .................................................................................... 575<br />
Table 6 Present and future total final energy consumption in Turkey (mtoe) ................................................................................. 575<br />
Table 1 Energy profile of Turkey in 2003 [3,4,5,6,7,8,9,10] ....................................................................................................... 585<br />
Table 2 Primary energy consumption, GDP, population, electricity production and consumption in Turkey [11,12] ....................... 586<br />
Table 3 Population, economy and energy [14]............................................................................................................................ 587<br />
Table 4 The amount of fossil energy resources in Turkey [18] ...................................................................................................... 587<br />
Table 5 Turkey’s renewable energy potential [16] ....................................................................................................................... 588<br />
Table 6 Economic hydroelectric potential of selected river basins in Turkey [62] .......................................................................... 588<br />
Table 7 Distribution of the hydropower potential in Turkey by Project implementation status [62] ................................................ 589<br />
Table 8 Hydroelectric potential of the world [63] ........................................................................................................................ 589<br />
Table 9 Turkey’s small hydropower potential [64] ....................................................................................................................... 589<br />
Table 10 Small hydro-power development in Turkey during 1995-2002 [64] .............................................................................. 590<br />
Table 11 Present and planned biomass energy production in Turkey (Ktoe) [26,27] .................................................................... 590<br />
Table 12 Turkey’s forest potential [66] ....................................................................................................................................... 590<br />
Table 13 Turkey’s geothermal energy potential [23] ................................................................................................................... 591<br />
Table 14 Capacities in geothermal utilization in Turkey (May 2006) [67] .................................................................................... 591<br />
Table 15 Solar energy potential for seven regions and some cities in Turkey [26,27] ................................................................... 591<br />
Table 16 Wind characteristics for some selected cities in Turkey [26,27] .................................................................................... 592<br />
Table 17 Distribution of hydraulic power potential in Turkey [21] ................................................................................................ 593<br />
Table 18 Distribution of electrical energy production by resources between 1990 and 2002 [27, 52] .......................................... 594<br />
Table 19 Installed capacity of electric power in Turkey (GW) [53] ................................................................................................ 594<br />
Table 20 Production and consumption of total primary energy in Turkey, 1973-2020 [20] .......................................................... 597<br />
Table 21 Primary energy supply by source (%) [21] ..................................................................................................................... 598<br />
Table 22 Final energy demand by source (%) [21] ...................................................................................................................... 598<br />
Table 23 Electricity supply by source (%) [21 ............................................................................................................................ 599<br />
Table 24 Sectoral distribution of the general energy demand (thousands sons of oil equivalent) [23] .......................................... 600<br />
Table 25 Primary energy consumption in Turkey during 1984-1995 (Gigagrams of oil equivalent) [23] ........................................ 601<br />
Table 26 Present and future total final energy production in Turkey (Mtoe) [25, 26] ..................................................................... 601<br />
Table 27 Present and future total final energy consumption in Turkey (Mtoe) [25, 26] ................................................................. 602<br />
Table 28 Electric power capacity development in Turkey [26, 27] ............................................................................................... 602<br />
Table 29 The sectoral natural gas demand in Turkey, 1990-2020 [30] ....................................................................................... 604<br />
Table 30 Turkey’s coal potential [31] ......................................................................................................................................... 605<br />
Table 31 Electricity production from thermal and hydropower sources according to years in Turkey [41] and [42,43] a .................. 605<br />
Table 32 Main energy resources used for electricity generation in Turkey during 1994 [32] ......................................................... 607<br />
Table 33 Sectoral electrical energy consumption development between 1990 and 2002 [27] .................................................... 607<br />
Table 34 Installed energy generation capacity in Turkey between 1990-2001 (in 1000 MW) [35,36] .......................................... 607<br />
Table 35 Electricity generation and consumption in Turkey, 1990-2001 (in 10 6 kWh) [35,36] ..................................................... 607<br />
Table 36 Direct greenhouse gas emissions in Turkey by sectors between 1990 and 2010 (%) [54] .............................................. 610<br />
Table 37 Winter season air pollution trends in Turkish cities [55] ................................................................................................ 611<br />
Table 38 Estimated CO2 and CH4 emissions in different energy-consuming sectors in Turkey ....................................................... 611<br />
Table 39 Total emission estimates with five year intervals in Turkey (Mg/year) ............................................................................ 612<br />
Table 40 Water resources in Turkey [56] .................................................................................................................................... 612<br />
Table 41 The GAP and Turkey comparative figures for hydropower [137] ..................................................................................... 613<br />
Table 42 Industrial waste water pollution load in Turkey (1997) [57] .......................................................................................... 613<br />
Table 43 Heavy metal concentrations (μgg -1 dry wt) in fish samples [58] ..................................................................................... 614<br />
Table 44 Unit energy cost (1US$-Є) [59,60]............................................................................................................................... 615<br />
Table 45 Net power generating cost by energy input [61] ............................................................................................................ 615<br />
Table 46 Setup costs for the energy sources .............................................................................................................................. 615<br />
Table 47 Comparison of marginal costs ..................................................................................................................................... 616<br />
Table 48 Non-Ministerial agencies responsible for various aspects of energy policy [139] ........................................................... 619<br />
Table 49 Industrial sub-sector energy consumption and the share of the cost of energy production of Turkey [48] ........................ 621<br />
Table 50 Process heating efficiency data for the industrial sector in Turkey from 1990 to 2003 [140] ......................................... 622<br />
Table 51 Energy and exergy inputs to the Turkish residential–commercial sector during 2002 [27] ............................................. 623<br />
Table 52 Distribution of residences and efficiencies according to fuel types and components of fuel uses in 2002 (%) ................ 625
TURKEY - National Study<br />
Table 53 Values for energy and energy utilization efficiencies as well as utilization of electric and saturation values of<br />
electrical appliances in 2002 .......................................................................................................................................... 626<br />
Table 54 Primary energy consumption in Turkey 1992-1999 (ktoe) [141] ................................................................................... 627<br />
Table 55 Temperature distribution of well outputs by region in Turkey [75] .................................................................................. 630<br />
Table 56 Some details about geothermal wells in IBGF [78] ....................................................................................................... 634<br />
Table 57 Distribution of geothermal district heating system subscribers as of April 2001 [79] ..................................................... 634<br />
Table 58 Energy cost comparisons of different fuels for residential use in Turkey (based on prices of December 2001) ................ 636<br />
Table 59 Distribution of values for local emissions of sulphur dioxide and carbon dioxide associated with the fuel<br />
combustion ..................................................................................................................................................................... 637<br />
Table 60 Main characteristics of the Denizli-Kizildere geothermal field [93, 98].......................................................................... 639<br />
Table 61 Gas analysis of some production and observation wells [98] ........................................................................................ 640<br />
Table 62 Production well data [99] ............................................................................................................................................ 641<br />
Table 63 Injection well data [99] ............................................................................................................................................... 641<br />
Table 64 Main characteristics of the Denizli-Kizildere geothermal power plant [93,99,102] ........................................................ 643<br />
Table 65 Main characteristics of turbine-generator unit [93] ...................................................................................................... 644<br />
Table 66 Main characteristics of gas compressors in the Denizli-Kizildere geothermal power plant [99] ...................................... 645<br />
Table 67 Power consumption of auxiliary equipment in the Denizli-Kizildere geothermal power plant [93] ................................... 646<br />
Table 68 Electric production by the Kızıldere power plant [101] .................................................................................................. 646<br />
Table 69 Annual development of installed capacity and generation in Turkey [11]....................................................................... 649<br />
Table 70 Annual development of electricity generation-consumption and losses in Turkey (GWh) [11] ......................................... 649<br />
Table 71 Annual development of Turkey’s gross electricity generation by share of primary energy resources (%) [11] .................... 650<br />
Table 72 Breakdown of installed electricity capacity in Turkey (MW) [144] .................................................................................. 651<br />
Table 73 Breakdown of electricity generation in Turkey (GWh) [144] ........................................................................................... 652<br />
Table 74 Primary energy production, consumption and the ratio that production meets consumption in Turkey (x1000<br />
tep) [145]........................................................................................................................................................................ 653<br />
Table 75 Global renewable energy indicators [146] ................................................................................................................... 654<br />
Table 76 Distribution of licenses by fuel (energy) types as well as the breakdown of 132 autoproducers by sector (2003)<br />
[147] .............................................................................................................................................................................. 654<br />
Table 77 Performance of Turkey’s conversion sector in 2000 [148] ............................................................................................ 655<br />
Table 78 Breakdown of Turkey’s electricity installed capacity by utilities and resources in MW [52] ............................................. 656<br />
Table 79 Turkey’s total installed and obtainable power of plants by energy resources in MW [52] ................................................ 657<br />
Table 80 Wind power plant projects in Turkey [150,151] ............................................................................................................ 658<br />
Table 81 Operational and investment performance data sets for thermal power plants [152] ...................................................... 659<br />
Table 82 Energy and exergy production and consumption values of Turkey in 2001 [153] ........................................................... 659<br />
Table 83 Energy and exergy production values for Turkey’s renewables and total in 2001 [153] .................................................. 660<br />
Table 84 Greenhouse gas emissions in Turkey (thousand tons) [111].......................................................................................... 660<br />
Table 85 Turkey’s TPEP and TPEC, 1990–2001, in Quads [154] ................................................................................................. 660<br />
Table 86 Petroleum production and consumption in Turkey, 1990–2001, in thousand of barrels per day [154] ........................... 660<br />
Table 87 Dry natural gas production and consumption in Turkey, 1990–2001, in Tcf [154] ......................................................... 660<br />
Table 88 Coal production and consumption in Turkey, 1990–2001, in millions of tons [154] ...................................................... 661<br />
Table 89 Distribution of under design hydro power plants according to their hydro capacity (2004) [155] .................................... 661<br />
Table 90 Net Electricity Consumption per capita of some countries (kWh/per capita) [144] ........................................................ 661<br />
Table 91 Some SHPs including run of river systems in operation and installed capacity less than 10MW [156] ............................ 662<br />
Table 92 Hydroelectric generating plants in Turkey [157] ........................................................................................................... 663<br />
Table 93 Thermal-electric power plants in Turkey [158] .............................................................................................................. 663<br />
Table 94 Water and energy potential of selected river basins in Turkey [56] ................................................................................ 664<br />
Table 95 Energy and exergy utilization (in 109 MJ).[159] ............................................................................................................ 664<br />
Table 96 Energy and exergy production values for Turkey’s renewables and total in 2001[153] ................................................... 665<br />
Table 97 Energy and exergy utilization values for Turkey’s renewables by subsector in 2001[153] ............................................... 665<br />
Table 98 Utilization of renewables energy and exergy in the conversion sector in 2001 [153] ...................................................... 665<br />
Table 99 Energy and exergy utilization efficiency values for Turkey’s renewables and total in 2001 (%) [153] ............................... 666<br />
Table 100 Cost parameters of the unit processes [160] ............................................................................................................. 666<br />
Table 101 Emission factors [160] .............................................................................................................................................. 667<br />
Table 102 Development of energy demands [160] ..................................................................................................................... 667<br />
Table 103 Development of fuel, heat and electricity prices [160]................................................................................................ 668<br />
Table 104 Status of geothermal space heating in Turkey (MWt) [101] ......................................................................................... 668<br />
Table 105 Direct use of geothermal energy in Turkey [97] ........................................................................................................... 669<br />
Table 106 Present and future geothermal heat and electricity generation projections in Turkey [101] .......................................... 669<br />
Table 107 European OECD countries wind potential [149] ......................................................................................................... 670<br />
Table 108 Electricity production of Turkey between years 1999 and 2005 [152] ......................................................................... 670<br />
679
680<br />
ENERGY AND SUSTAINABLE DEVELOPMENT IN THE MEDITERRANEAN<br />
Table 109 Some climatic features and air-to-air heat pump COP values for some cities of Turkey [161] ....................................... 670<br />
Table 110 Predictions of energy forest effects on production and contribution to country’s economy in Turkey [162].................... 671<br />
Table 111 Total recoverable bioenergy potential in Turkey (1998) [163] ..................................................................................... 671<br />
Figure 1 Mean heating energy and exergy efficiencies of the industrial sector and its subsectors in 2003 .................................... 576<br />
Figure 2 Energy and exergy utilization efficiencies in the Turkish residential–commercial sector for 2002 ................................... 577<br />
Figure 3 Moyennes des rendements énergétiques de l’industrie primaire et secondaire en 2003 ................................................ 582<br />
Figure 4 Moyenne des rendements énergétiques des secteurs résidentiels et tertiaires en 2002 ................................................. 583<br />
Figure 5 Turkey‘s energy production and demand forecast by sources ......................................................................................... 598<br />
Figure 6 Turkey’s energy consumption by sources ...................................................................................................................... 599<br />
Figure 7 Total energy consumption in the sectors ....................................................................................................................... 600<br />
Figure 8 Natural gas consumption by sector............................................................................................................................... 603<br />
Figure 9 Turkey’s electricity consumption and demand forecast by sectors ................................................................................. 606<br />
Figure 10 Historical and forecasted values of CO2 emissions by sectors [28] ............................................................................... 608<br />
Figure 11 Historical and forecasted values of the total CO2 emissions ........................................................................................ 609<br />
Figure 12 Mean heating energy and exergy efficiencies of the industrial sector and its sub-sectors in 2003 [140] ....................... 622<br />
Figure 13 Overall energy and exergy efficiencies of the Turkish industrial sector over the period from 1990 to 2003 [140] ........... 623<br />
Figure 14 An illustrative presentation of the energy flows in a macro-system and residential–commercial sector for Turkey .......... 624<br />
Figure 15 Distribution of the energy consumption values according to the type of sub-users in the Turkish residential–<br />
commercial sector for 2002 ............................................................................................................................................. 624<br />
Figure 16 Energy and exergy utilization efficiencies in the Turkish [49] residential–commercial sector for 2002 [49] ................... 626<br />
Figure 17 Map of Izmir-Balcova Geothermal Field (IBGF) [76] .................................................................................................... 632<br />
Figure 18 A schematic of Balcova-Narlidere-Izmir geothermal district heating system [77].......................................................... 633<br />
Figure 19 Location of the Denizli-Kizildere geothermal field ....................................................................................................... 638<br />
Figure 20 Well locations of the Denizli-Kizildere geothermal field [92] ........................................................................................ 639<br />
Figure 21 Flow diagram of the Denizli-Kizildere geothermal power plant ..................................................................................... 641<br />
Figure 22 Electricity generation of the Denizli-Kizildere geothermal power plant between 1984 and 2001 [99, 101]. .................. 642
LIST OF MAP TECHNICAL SERIES REPORTS (MTS)<br />
LISTE DES RAPPORTS TECHNIQUES DU PAM<br />
MTS Reports are available from the Documents & Publications section of our web site at www.unepmap.org<br />
MTS 167. UNEP/MAP/BLUE PLAN: Energy and Sustainable Development in the <strong>Mediterranean</strong>: Proceedings of the<br />
Regional Workshop: Monaco, 29 – 30 March 2007. MAP Technical Reports Series No. 167, UNEP/MAP, Athens, 2007.<br />
(English & French).<br />
Energie et développement durable en Méditerranée : Actes de l’atelier régional, Monaco, 29 - 30 mars 2007<br />
MTS 166. UNEP/MAP/MED POL: MED POL Biological Effects Monitoring Programme: Achievements and Future<br />
Orientations: Proceedings of the Workshop (Alessandria, Italy, 20 -21 December 2006). MAP Technical Reports Series No.<br />
166, UNEP/MAP, Athens, 2007. (English).<br />
MTS 165. UNEP/MAP/CP RAC: State of the art of sustainable production in the <strong>Mediterranean</strong>. MAP Technical Reports<br />
Series No. 165, UNEP/MAP, Athens, 2006. (English, French, Spanish).<br />
État de la production durable en Méditerranée.<br />
Estado de la producción sostenible en el Mediterráneo.<br />
MTS 164. PNUE/PAM: Programme d'Aménagement Côtier (PAC) de la "Zone côtière algéroise": Rapport final intégré.<br />
No. 164 de la Série des rapports techniques du PAM, PNUE/PAM, Athènes, 2006. (French only)<br />
MTS 163. UNEP/MAP/MED POL: Sampling And Analysis Techniques for the Eutrophication Monitoring Strategy of MED<br />
POL. MAP Technical Reports Series No. 163. UNEP/MAP, Athens, 2005. (English)<br />
MTS 162. UNEP/MAP: Review And Assessment Of National Strategies For Sustainable Development In The<br />
<strong>Mediterranean</strong> Region. MAP Technical Reports Series No. 162, UNEP/MAP, Athens, 2005. (English, French)<br />
Bilan et évaluation des stratégies nationales de développement durable en méditerranée.<br />
MTS 161. UNEP/MAP/BLUE PLAN: Financing And Cooperation For Sustainable Development In The <strong>Mediterranean</strong>,<br />
Sophia Antipolis, France, 3 – 4 June 2004. Vols. I & II. UNEP/MAP, Athens, 2005.<br />
Financement et Coopération pour le développement durable en méditerranée : Sophia Antipolis, France, 3-4 Juin 2004 :<br />
Tomes I & II.<br />
MTS 160. UNEP/MAP: MAP CAMP Project "Lebanon”: Final Integrated Project Document. UNEP/MAP, Athens, 2005.<br />
(English).<br />
MTS 159. UNEP/MAP/Blue <strong>Plan</strong>: Dossier on Tourism and Sustainable Development in the <strong>Mediterranean</strong>. UNEP/MAP,<br />
Athens, 2005. (English, French).<br />
Dossier sur le tourisme et le développement durable en Méditerranée.<br />
MTS 158. PNUE/PAM/PLANBLEU: L’eau des Méditerranéens : situation et perspectives. PNUE/PAM, Athènes, 2004.<br />
(French).<br />
MTS 157. UNEP/MAP/MED POL/WHO: Municipal wastewater treatment plants in <strong>Mediterranean</strong> coastal cities (II)<br />
UNEP/MAP: Athens, 2004. (English, French).<br />
Stations d'épuration des eaux usées municipales dans les villes côtières de la Méditerranée (II)<br />
MTS 156. UNEP/MAP/MED POL: Inventories of PCBs and nine pesticides. UNEP/MAP: Athens, 2004. (English, French)<br />
Inventaire des PCB et de neuf pesticides.<br />
MTS 155. UNEP/MAP/MED POL: <strong>Plan</strong> for the management PCBs waste and nine pesticides for the <strong>Mediterranean</strong><br />
Region. UNEP/MAP: Athens, 2004. (English, French).<br />
<strong>Plan</strong> de gestion des déchets dangereux, y compris un inventaire des déchets dangereux dans la région<br />
méditerranéenne.<br />
MTS 154. UNEP/MAP/MED POL: Guidelines for the development of ecological status and stress reduction indicators for<br />
the <strong>Mediterranean</strong> Region. UNEP/MAP: Athens, 2004. (English, French).<br />
Lignes directrices pour l'élaboration d'indicateurs d'état écologique et de réduction du stress.<br />
MTS 153. UNEP/MAP/MED POL/WHO: Guidelines for the management of industrial wastewater for the <strong>Mediterranean</strong><br />
Region. UNEP/MAP: Athens, 2004. (English, French).<br />
Lignes directrices pour la gestion des eaux usées industrielles dans la région méditerranéenne.<br />
1
MTS 152. UNEP/MAP/MED POL/WHO: Guidelines on sewage treatment and disposals for the <strong>Mediterranean</strong> Region.<br />
UNEP/MAP: Athens, 2004. (English, French).<br />
Lignes directrices sur le traitement et l'élimination des eaux usées dans la région méditerranéenne.<br />
MTS 151. UNEP/MAP/MED POL: Guidelines for river (including estuaries) pollution monitoring programme for the<br />
<strong>Mediterranean</strong> Region. UNEP/MAP: Athens, 2004. (English, French).<br />
Lignes directrices pour un programme de surveillance continue de la pollution fluviale (estuarienne y comprise) dans la<br />
région méditerranéenne.<br />
MTS 150. UNEP/MAP/MED POL/WHO: Reference handbook on environmental compliance and enforcement in the<br />
<strong>Mediterranean</strong> region. UNEP/MAP: Athens, 2004. (English, French).<br />
Manuel de référence sur le respect et l'application effective des dispositions environnementales dans la région<br />
méditerranéenne.<br />
MTS 149. UNEP/MAP/MED POL/WHO: Guidelines on environmental inspection systems for the <strong>Mediterranean</strong> region.<br />
UNEP/MAP: Athens, 2004. (English, French).<br />
Lignes directrices sur les systèmes d'inspection environnementale pour la région méditerranéenne.<br />
MTS 148. UNEP/MAP/MED POL/WHO: Guidelines on management of coastal litter for the <strong>Mediterranean</strong> region.<br />
UNEP/MAP: Athens, 2004. (English, French).<br />
Lignes directrices sur la gestion des détritus côtiers pour la région méditerranéenne.<br />
MTS 147. UNEP/MAP/MED POL: <strong>Plan</strong> for the management of hazardous waste, including inventory of hazardous waste<br />
in the <strong>Mediterranean</strong> region. UNEP/MAP: Athens, 2004. (English, French).<br />
<strong>Plan</strong> de gestion des déchets dangereux, y compris un inventaire des déchets dangereux dans la région<br />
méditerranéenne.<br />
MTS 146. UNEP/MAP/RAC/CP: Guidelines for the application of Best Available Techniques (BATs), Best Environmental<br />
Practices (BEPs) and Cleaner Technologies (CTs) in industries of the <strong>Mediterranean</strong> countries. UNEP/MAP: Athens,<br />
2004. (English, French).<br />
Lignes directrices sur l'application des meilleures techniques disponibles (MTD), des meilleures pratiques<br />
environnementales (MPE) et des technologies plus propres dans les industries des pays méditerranéens.<br />
MTS 145. UNEP/MAP/RAC/CP: <strong>Plan</strong> for the reduction by 20% by 2010 of the generation of hazardous wastes from<br />
industrial installations for the <strong>Mediterranean</strong> region. UNEP/MAP: Athens, 2004. (English, French).<br />
<strong>Plan</strong> de réduction de 20%, d'ici à 2010, de la génération de déchets dangereux provenant des installations industrielles<br />
dans la région méditerranéenne.<br />
MTS 144. UNEP/MAP/MED POL: <strong>Plan</strong> on reduction of input of BOD by 50% by 2010 from industrial sources for the<br />
<strong>Mediterranean</strong> region. UNEP/MAP: Athens, 2004. (English, French, Arabic).<br />
<strong>Plan</strong> de réduction de 50%, d'ici à 2010, des apports de DBO d'origine industrielle dans la région méditerranéenne.<br />
MTS 143. UNEP/MAP/RAC/CP: Guidelines for the application of Best Environmental Practices (BEPs) for the rational use<br />
of fertilisers and the reduction of nutrient loss from agriculture for the <strong>Mediterranean</strong> region. UNEP/MAP: Athens, 2004.<br />
(English, French, Arabic).<br />
Lignes directrices sur l'application des meilleures pratiques environnementales (MPE) pour l'utilisation des engrais et<br />
la réduction des pertes d'éléments nutritifs dans l'agriculture en région méditerranéenne.<br />
MTS 142. UNEP/MAP/RAC/CP: Guidelines for the application of Best Available Techniques (BATs) and Best Available<br />
Practices (BEPs) in industrial sources of BOD, nutrients and suspended solids for the <strong>Mediterranean</strong> region.<br />
UNEP/MAP: Athens, 2004. (English, French).<br />
Lignes directrices sur l'application des meilleures techniques disponibles (MTD) et des meilleures pratiques<br />
environnementales (MPE) aux sources industrielles de DBO, d'éléments nutritifs et de matières en suspension pour la<br />
région méditerranéenne.<br />
MTS 141. UNEP/MAP/MED POL: Riverine transport of water, sediments and pollutants to the <strong>Mediterranean</strong> Sea.<br />
UNEP/MAP: Athens, 2003. (English).<br />
MTS 140. UNEP/MAP/MED POL: Mariculture in the <strong>Mediterranean</strong>. UNEP/MAP: Athens, 2004. (English).<br />
MTS 139. UNEP/MAP/MED POL: Sea Water Desalination in the <strong>Mediterranean</strong>: Assessment and Guidelines. UNEP/MAP:<br />
Athens, 2003. (English, French)<br />
Dessalement de l’eau de mer en méditerranée: évaluation et lignes directrices.<br />
MTS 138. UNEP/MAP/PAP: MAP CAMP Project "Malta”: Final Integrated Project Document and Selected Thematic<br />
Documents. UNEP/MAP: Athens, 2003. (English).<br />
MTS 137. UNEP/MAP/BLUE PLAN: Free Trade and the Environment in the Euro-<strong>Mediterranean</strong> Context,<br />
Montpellier/Mèze, France, 5 – 8 October 2000: Volume I: Technical Report of the Workshop; Volume II: Regional and<br />
International Studies; Volume III: National Studies; Volume IV: Environmental Aspects of Association Agreements (4 Vols),<br />
UNEP/MAP: Athens, 2002. Libre-échange et environnement dans le contexte euro-méditerranéen : Montpellier/Mèze,<br />
France, 5 – 8 octobre 2000 (Parts in English & French).<br />
2
MTS 136. UNEP/MAP/MED POL: Guidelines for the management of fish waste or organic materials resulting from the<br />
processing of fish and other marine organisms. UNEP/MAP: Athens, 2002. (English, French, Spanish & Arabic).<br />
MTS 135. PNUE/PAM: PAC DU PAM "Zone côtière de Sfax": Synthèse des études du projet, rapport de la<br />
réunion de clôture et autres documents choisis. PNUE/PAM, Athènes, 2001. (French).<br />
MTS 134. UNEP/MAP/PAP: MAP CAMP Project "Israel”: Final Integrated Report and Selected Documents. UNEP/MAP:<br />
Athens, 2001. (English).<br />
MTS 133. UNEP/MAP: Atmospheric Transport and Deposition of Pollutants into the <strong>Mediterranean</strong> Sea: Final Reports<br />
on Research Projects. UNEP/MAP: Athens, 2001. (English).<br />
MTS 132. UNEP/MAP/WHO: Remedial <strong>Action</strong>s for Pollution Mitigation and Rehabilitation in Cases of Non-compliance<br />
with Established Criteria. UNEP/MAP: Athens, 2001. (English).<br />
MTS 131. UNEP/MAP: MAP CAMP Project "Fuka-Matrouh”, Egypt: Final Integrated Report and Selected Documents. (2<br />
Vols.), UNEP/MAP: Athens, 2001. (English).<br />
MTS 130. UNEP/MAP/WMO: Atmospheric Input of Persistent Organic Pollutants to the <strong>Mediterranean</strong> Sea. UNEP/MAP:<br />
Athens, 2001. (English).<br />
MTS 129. UNEP/MAP/MED POL: Guidelines for the Management of Dredged Material. UNEP/MAP: Athens, 2000. (English,<br />
French, Spanish and Arabic).<br />
Lignes Directrices pour la gestion des matériaux de dragage.<br />
Directices para el manejo de los materiales de dragado.<br />
MTS 128. UNEP/MAP/MED POL/WHO: Municipal Wastewater Treatment <strong>Plan</strong>ts in <strong>Mediterranean</strong> Coastal Cities.<br />
UNEP/MAP: Athens, 2000 (English, French).<br />
Les Stations d’épuration des eaux usées municipales dans les villes cotiers de la Méditerranée.<br />
MTS 127. UNEP/MAP/BLUE PLAN: Minutes of the Seminar, Territorial Prospective in the <strong>Mediterranean</strong> and the<br />
Approach by Actors, Sophia Antipolis, France, 7-9 November 1996. UNEP/MAP: Athens, 2000. In French with English<br />
introduction and 1 paper).<br />
Actes du séminaire, La prospective territoriale en Méditerranée et l’approche par acteurs.<br />
MTS 126. UNEP/MAP/MCSD/Blue <strong>Plan</strong>: Report of the Workshop on Tourism and Sustainable Development in the<br />
<strong>Mediterranean</strong>, Antalya, Turkey, 17-19 September 1998. UNEP/MAP: Athens, 1999. (English, French).<br />
Rapport de l'atelier sur le tourisme et le développement durable en Méditerranée, Antalya, Turquie, 17-19 septembre<br />
1998.<br />
MTS 125. UNEP/MAP: Proceedings of the Workshop on Invasive Caulerpa Species in the <strong>Mediterranean</strong>, Heraklion,<br />
Crete, Greece, 18-20 March 1998. UNEP/MAP: Athens, 1999. (English, French). Actes de l'atelier sur les especes Caulerpa<br />
invasives en Méditerranée, Heraklion, Crète, Grèce, 18-20 mars 1998.<br />
MTS 124. UNEP/MAP/WHO: Identification of Priority Hot Spots and Sensitive Areas in the <strong>Mediterranean</strong>. UNEP/MAP:<br />
Athens, 1999. (English, French).<br />
Identification des “Points Chauds” et “Zones Sensibles” de polution prioritaire en Méditerranée.<br />
MTS 123. UNEP/MAP/WMO: MED POL Manual on Sampling and Analysis of Aerosols and Precipitation for Major Ions<br />
and Trace Elements. UNEP/MAP: Athens, 1998. (English).<br />
MTS 122. UNEP/MAP/WMO: Atmospheric Input of Mercury to the <strong>Mediterranean</strong> Sea. UNEP/MAP: Athens, 1998. English).<br />
MTS 121. PNUE: MED POL Phase III. Programme d'évaluation et de maîtrise de la pollution dans la région<br />
Méditerranéenne (1996-2005). UNEP/MAP: Athens, 1998. (In publication)<br />
MTS 120. UNEP/MAP: MED POL Phase III. Programme for the Assessment and Control of Pollution in the <strong>Mediterranean</strong><br />
Region (1996-2005). UNEP/MAP: Athens, 1998.<br />
MTS 119. UNEP/MAP: Strategic <strong>Action</strong> Programme to Address Pollution from Land-Based Activities. UNEP/MAP: Athens,<br />
1998. (English, French)<br />
Programme d'<strong>Action</strong>s Stratégiques visant à combattre la pollution due à des activités menées à terre.<br />
MTS 118. UNEP/MAP/WMO: The Input of Anthropogenic Airborne Nitrogen to the <strong>Mediterranean</strong> Sea through its<br />
Watershed. UNEP/MAP: Athens, 1997 (English).<br />
MTS 117. UNEP/MAP: La Convention de Barcelone pour la protection de la mer Méditerranée contre la pollution et le<br />
développement durable. UNEP/MAP: Athens, 1997 (Français seulement).<br />
3
MTS 116. UNEP/MAP/IAEA: Data Quality Review for MED POL (1994-1995), Evaluation of the analytical performance of<br />
MED POL laboratories during 1994-1995 in IAEA/UNEP laboratory performance studies for the determination of trace<br />
elements and trace organic contaminants in marine biological and sediment samples. UNEP/MAP: Athens, 1997<br />
(English).<br />
MTS 115. UNEP/MAP/BP Methodes et outils pour les études systémiques et prospectives en Méditerranée, PB/RAC,<br />
Sophia Antipolis, 1996. UNEP/MAP/BP: Athens, 1996 (français seulement).<br />
MTS 114. UNEP/MAP: Workshop on policies for sustainable development of <strong>Mediterranean</strong> coastal areas, Santorini<br />
Island, 26-27 April 1996. Presentation by a group of experts. UNEP/MAP: Athens, 1996 (Parts in English or French only).<br />
PNUE: Journées d'étude sur les politiques de développement durable des zones côtières méditerranéennes, Ile de<br />
Santorin, 26-27 avril 1996. Communications par un groupe d'experts. (Parties en anglais ou français seulement).<br />
MTS 113. UNEP/MAP/IOC: Final reports of research projects on transport and dispersion (Research Area II) - Modelling<br />
of eutrophication and algal blooms in the Thermaikos Gulf (Greece) and along the Emilia Romagna Coast (Italy).<br />
UNEP/MAP: Athens, 1996 (English).<br />
MTS 112. UNEP/MAP/WHO: Guidelines for submarine outfall structures for <strong>Mediterranean</strong> small and medium-sized<br />
coastal communities. UNEP/MAP: Athens, 1996 (English, French).<br />
Lignes directrices pour les émissaires de collectivités côtières de petite et moyenne taille en Méditerranée.<br />
MTS 111. UNEP/MAP/WHO: Guidelines for treatment of effluents prior to discharge into the <strong>Mediterranean</strong> Sea.<br />
UNEP/MAP: Athens, 1996 (English).<br />
MTS 110. UNEP/MAP/WHO: Assessment of the state of pollution of the <strong>Mediterranean</strong> Sea by anionic detergents.<br />
UNEP/MAP: Athens, 1996 (English, French). PNUE/OMS: Evaluation de l'état de la pollution de la mer Méditerranée par les<br />
détergents anioniques.<br />
MTS 109. UNEP/MAP/WHO: Survey of pollutants from land-based sources in the <strong>Mediterranean</strong>. UNEP/MAP: Athens,<br />
1996 (English, French).<br />
Evaluation de l'enquête sur les polluants d'origine tellurique en Méditerranée (MED X BIS).<br />
MTS 108. UNEP/MAP/WHO: Assessment of the state of microbiological pollution of the <strong>Mediterranean</strong> Sea. UNEP/MAP:<br />
Athens, 1996 (270 pgs.) (English, French).<br />
Evaluation de l'état de la pollution microbiologique de la mer Méditerranée.<br />
MTS 107. UNEP/MAP/WHO: Guidelines for authorization for the discharge of liquid wastes into the <strong>Mediterranean</strong> Sea.<br />
UNEP/MAP: Athens, 1996 (English, French).<br />
Lignes directrices concernant les autorisations de rejet de déchets liquides en mer Méditerranée.<br />
MTS 106. UNEP/MAP/FAO/WHO: Assessment of the state of eutrophication in the <strong>Mediterranean</strong> Sea. UNEP/MAP:<br />
Athens, 1996 (English, French).<br />
Evaluation de l'état de l'eutrophisation en mer Méditerranée.<br />
MTS 105. UNEP/MAP/FAO/WHO: Assessment of the state of pollution of the <strong>Mediterranean</strong> Sea by zinc, copper and their<br />
compounds. UNEP/MAP: Athens, 1996 (English, French).<br />
Evaluation de l'état de la pollution de la mer Méditerranée par le zinc, le cuivre et leurs composés.<br />
MTS 104. UNEP/MAP/FAO: Final reports on research projects dealing with eutrophication and heavy metal<br />
accumulation. UNEP/MAP: Athens, 1996 (English, French).<br />
Rapports finaux sur les projets de recherche relatifs à l'eutrophisation et à l'accumulation des métaux lourds.<br />
MTS 103. UNEP/MAP/FAO: Final reports on research projects dealing with biological effects (Research Area III).<br />
UNEP/MAP: Athens, 1996 (English, French).<br />
Rapports finaux sur les projets de recherche relatifs aux effets biologiques (Domaine de Recherche III).<br />
MTS 102. UNEP/MAP: Implications of Climate Change for the Coastal Area of Fuka-Matrouh (Egypt). UNEP/MAP: Athens,<br />
1996. (English).<br />
MTS 101. PNUE: État du milieu marin et du littoral de la région méditerranéenne. UNEP/MAP: Athens, 1996 (français<br />
seulement).<br />
MTS 100. UNEP/MAP: State of the Marine and Coastal Environment in the <strong>Mediterranean</strong> Region. UNEP/MAP: Athens,<br />
1996 (English).<br />
MTS 99. UNEP/MAP: Implications of Climate Change for the Sfax Coastal Area (Tunisia). UNEP/MAP: Athens, 1996.<br />
(English, French).<br />
Implications des changements climatiques sur la zone côtière de Sfax.<br />
MTS 98. UNEP/MAP: Implications of Climate Change for the Albanian Coast. UNEP/MAP: Athens, 1996 (English).<br />
4
MTS 97. UNEP/MAP/FAO: Final reports of research projects on effects (Research Area III) - Pollution effects on marine<br />
communities. UNEP/MAP: Athens, 1996 (English, French).<br />
Rapports finaux des projets de recherche sur les effets (Domaine de recherche III) -Effets de la pollution sur les<br />
communautés marines.<br />
MTS 96 UNEP/MAP/FAO: Final reports of research projects on effects (Research Area III) - Pollution effects on plankton<br />
composition and spatial distribution, near the sewage outfall of Athens (Saronikos Gulf, Greece). UNEP/MAP: Athens,<br />
1996 (English).<br />
MTS 95. UNEP/MAP: Common measures for the control of pollution adopted by the Contracting Parties to the<br />
Convention for the Protection of the <strong>Mediterranean</strong> Sea against Pollution. No MTS 9UNEP UNEP/MAP: Athens, 1995<br />
(English, French).<br />
Mesures communes de lutte contre la pollution adoptées par les Parties contractantes à la Convention pour la<br />
protection de la mer Méditerranée contre la pollution.<br />
MTS 94. UNEP/MAP: Proceedings of the Workshop on Application of Integrated Approach to Development, Management<br />
and Use of Water Resources. UNEP/MAP: Athens, 1995. (Parts in English or French only).<br />
Actes de l'Atelier sur l'application d'une approche intégrée au développement, à la gestion et à l'utilisation des<br />
ressources en eau. (parties en anglais ou français seulement).<br />
MTS 93. UNEP/MAP/WHO: Epidemiological studies related to the environmental quality criteria for bathing waters,<br />
shellfish-growing waters and edible marine organisms. UNEP/MAP: Athens, 1995. (English).<br />
MTS 92. UNEP/MAP/WHO: Assessment of the State of Pollution in the <strong>Mediterranean</strong> Sea by Carcinogenic, Mutagenic<br />
and Teratogenic Substances. UNEP/MAP: Athens, 1995. (English).<br />
MTS 91. PNUE: Une contribution de l'écologie à la prospective. Problèmes et acquis. Sophia Antipolis, 1994 (français<br />
seulement).<br />
MTS 90. UNEP/MAP: Iskenderun Bay Project. Volume II. Systemic and Prospective Analysis. Sophia Antipolis, 1994<br />
(Parts in English or French only).<br />
Projet de la Baie d'Iskenderun. Volume II. Analyse systémique et prospective. (parties en anglais ou français seulement).<br />
MTS 89. UNEP/MAP: Iskenderun Bay Project. Volume I. Environmental Management within the Context of<br />
Environment-Development. Blue <strong>Plan</strong> Regional Activity Centre, Sophia Antipolis, 1994. (English).<br />
MTS 88. UNEP/MAP: Proceedings of the Seminar on <strong>Mediterranean</strong> Prospective. Blue <strong>Plan</strong> Regional Activity Centre,<br />
Sophia Antipolis, 1994 (Parts in English or French only).<br />
Actes du Séminaire débat sur la prospective méditerranéenne. (parties en anglais ou français seulement).<br />
MTS 87. UNEP/MAP/WHO: Identification of microbiological components and measurement development and testing of<br />
methodologies of specified contaminants (Area I) - Final reports on selected microbiological projects. UNEP/MAP:<br />
Athens, 1994 (English).<br />
MTS 86. UNEP/MAP: Monitoring Programme of the Eastern Adriatic Coastal Area - Report for 1983 -1991. UNEP/MAP:<br />
Athens, 1994. (English).<br />
MTS 85. UNEP/MAP/WMO: Assessment of Airborne Pollution of the <strong>Mediterranean</strong> Sea by Sulphur and Nitrogen<br />
Compounds and Heavy Metals in 1991. UNEP/MAP: Athens, 1994. (English).<br />
MTS 84. UNEP/MAP: Integrated Management Study for the Area of Izmir. Regional Activity Centre for Priority <strong>Action</strong>s<br />
Programme, Split, 1994. (English).<br />
MTS 83. PNUE/UICN: Les aires protégées en Méditerranée. Essai d'étude analytique de la législation pertinente. Centre<br />
d'activités régionales pour les aires spécialement protégées, Tunis, 1994. (français seulement).<br />
MTS 82. UNEP/MAP/IUCN: Technical report on the State of Cetaceans in the <strong>Mediterranean</strong>. Regional Activity Centre for<br />
Specially Protected Areas, Tunis, 1994. (English).<br />
MTS 81. UNEP/MAP/IAEA: Data quality review for MED POL: Nineteen years of progress. UNEP/MAP: Athens, 1994.<br />
(English).<br />
MTS 80. UNEP/MAP/FAO: Final reports on research projects dealing with the effects of pollutants on marine organisms<br />
and communities. UNEP/MAP: Athens, 1994. (English).<br />
MTS 79. UNEP/MAP/FAO: Final reports on research projects dealing with toxicity of pollutants on marine organisms.<br />
UNEP/MAP: Athens, 1994 (Parts in English or French only).<br />
Rapports finaux sur les projets de recherche traitant de la toxicité des polluants sur les organismes marins.<br />
MTS 78. UNEP/MAP/FAO: Final reports on research projects dealing with eutrophication problems. UNEP/MAP: Athens,<br />
1994 (English).<br />
5
MTS 77. UNEP/MAP/FAO/IAEA: Designing of monitoring programmes and management of data concerning chemical<br />
contaminants in marine organisms. UNEP/MAP: Athens, 1993 (English).<br />
MTS 76. UNEP/MAP/WHO: Biogeochemical Cycles of Specific Pollutants (Activity K): Survival of Pathogens. UNEP/MAP:<br />
Athens, 1993(English, French). Cycles biogéochimiques de polluants spécifiques (Activité K): Survie des pathogènes.<br />
MTS 75. UNEP/MAP/WHO: Development and Testing of Sampling and Analytical Techniques for Monitoring of Marine<br />
Pollutants (Activity A). UNEP/MAP: Athens, 1993 (English).<br />
MTS 74. UNEP/MAP/FIS: Report of the Training Workshop on Aspects of Marine Documentation in the <strong>Mediterranean</strong>.<br />
UNEP/MAP: Athens, 1993 (English).<br />
MTS 73. UNEP/MAP/FAO: Final Reports on Research Projects Dealing with the Effects of Pollutants on Marine<br />
Communities and Organisms. UNEP/MAP: Athens, 1993 (English, French).<br />
Rapports finaux sur les projets de recherche traitant des effets de polluants sur les communautés et les organismes<br />
marins.<br />
MTS 72.UNEP/MAP: Costs and Benefits of Measures for the Reduction of Degradation of the Environment from<br />
Land-based Sources of Pollution in Coastal Areas. A - Case Study of the Bay of Izmir. B - Case Study of the Island of<br />
Rhodes. UNEP/MAP: Athens, 1993 (English).<br />
MTS 71. UNEP/MAP/FAO/IOC: Selected techniques for monitoring biological effects of pollutants in marine organisms.<br />
UNEP/MAP: Athens, 1993 (English).<br />
MTS 70. UNEP/MAP/IAEA/IOC/FAO: Organohalogen Compounds in the Marine Environment: A Review. UNEP/MAP:<br />
Athens, 1992 (English).<br />
MTS 69. UNEP/MAP/FAO/IOC: Proceedings of the FAO/UNEP/IOC Workshop on the Biological Effects of Pollutants on<br />
Marine Organisms (Malta, 10-14 September 1991), edited by G.P. Gabrielides. UNEP/MAP: Athens, 1992 (English).<br />
MTS 68. UNEP/MAP/FAO/IOC: Evaluation of the Training Workshops on the Statistical Treatment and Interpretation of<br />
Marine Community Data. UNEP/MAP: Athens, 1992 (English).<br />
MTS 67. UNEP/MAP/IOC: Applicability of Remote Sensing for Survey of Water Quality Parameters in the <strong>Mediterranean</strong>.<br />
Final Report of the Research Project. UNEP/MAP: Athens, 1992 (English).<br />
MTS 66. UNEP/MAP/CRU: Regional Changes in Climate in the <strong>Mediterranean</strong> Basin Due to Global Greenhouse Gas<br />
Warming. UNEP/MAP: Athens, 1992 (English).<br />
MTS 65. UNEP/MAP: Directory of <strong>Mediterranean</strong> Marine Environmental Centres. UNEP/MAP: Athens, 1992 (English,<br />
French).<br />
Répertoire des centres relatifs au milieu marin en Méditerranée.<br />
MTS 64. UNEP/MAP/WMO: Airborne Pollution of the <strong>Mediterranean</strong> Sea. Report and Proceedings of the Second<br />
WMO/UNEP Workshop. UNEP/MAP: Athens, 1992 (English).<br />
MTS 63. PNUE/OMS: Cycles biogéochimiques de polluants spécifiques (Activité K) - Survie des pathogènes - Rapports<br />
finaux sur les projets de recherche (1989-1991). UNEP/MAP: Athens, 1992 (français seulement).<br />
MTS 62. UNEP/MAP/IAEA: Assessment of the State of Pollution of the <strong>Mediterranean</strong> Sea by Radioactive Substances.<br />
UNEP/MAP: Athens, 1992 (English, French).<br />
Evaluation de l'état de la pollution de la mer Méditerranée par les substances radioactives.<br />
MTS 61. UNEP/MAP Integrated <strong>Plan</strong>ning and Management of the <strong>Mediterranean</strong> Coastal Zones. Documents produced in<br />
the first and second stage of the Priority <strong>Action</strong> (1985-1986)., Priority <strong>Action</strong>s Programme, Regional Activity Centre, Split,<br />
1991 (Parts in English or French only).<br />
<strong>Plan</strong>ification intégrée et gestion des zones côtières méditerranéennes. Textes rédigés au cours de la première et de la<br />
deuxième phase de l'action prioritaire (1985-1986).<br />
MTS 60. UNEP/MAP/WHO: Development and testing of sampling and analytical techniques for monitoring of marine<br />
pollutants (Activity A): Final reports on selected microbiological projects (1987-1990). UNEP/MAP: Athens, 1991. (Parts in<br />
English or French only).<br />
Mise au point et essai des techniques d'échantillonnage et d'analyse pour la surveillance continue des polluants marins<br />
(Activité A): Rapports finaux sur certains projets de nature microbiologique (1987-1990).<br />
MTS 59. UNEP/MAP/FAO/IAEA: Proceedings of the FAO/UNEP/IAEA Consultation Meeting on the Accumulation and<br />
Transformation of Chemical contaminants by Biotic and Abiotic Processes in the Marine Environment (La Spezia, Italy,<br />
24-28 September 1990), edited by G.P. Gabrielides. UNEP/MAP: Athens, 1991. (English).<br />
6
MTS 58. UNEP/MAP/FAO/WHO/IAEA: Assessment of the state of pollution of the <strong>Mediterranean</strong> Sea by<br />
organophosphorus compounds. UNEP/MAP: Athens, 1991. (English, French).<br />
Evaluation de l'état de la pollution de la mer Méditerranée par les composés organophosphorés.<br />
MTS 57. UNEP/MAP/WHO: Research on the toxicity, persistence, bioaccumulation, carcinogenicity and mutagenicity of<br />
selected substances (Activity G): Final reports on projects dealing with carcinogenicity and mutagenicity. UNEP/MAP:<br />
Athens, 1991. (English).<br />
MTS 56. UNEP/MAP/IOC/FAO: Assessment of the state of pollution of the <strong>Mediterranean</strong> Sea by persistent synthetic<br />
materials, which may float, sink or remain in suspension. UNEP/MAP: Athens, 1991. (English, French).<br />
Evaluation de l'état de la pollution de la mer Méditerranée par les matières synthétiques persistantes qui peuvent<br />
flotter, couler ou rester en suspension.<br />
MTS 55. UNEP/MAP/WHO: Biogeochemical cycles of specific pollutants (Activity K): Final report on project on survival<br />
of pathogenic organisms in seawater. UNEP/MAP: Athens, 1991. (English).<br />
MTS 54. UNEP/MAP/WHO: Development and testing of sampling and analytical techniques for monitoring of marine<br />
pollutants (Activity A): Final reports on selected microbiological projects. UNEP/MAP: Athens, 1991. (English).<br />
MTS 53. UNEP/MAP/WHO: Epidemiological studies related to environmental quality criteria for bathing waters,<br />
shellfish-growing waters and edible marine organisms (Activity D). Final report on epidemiological study on bathers<br />
from selected beaches in Malaga, Spain (1988-1989). UNEP/MAP: Athens, 1991. (English).<br />
MTS 52. UNEP/MAP/FAO: Final reports on research projects dealing with bioaccumulation and toxicity of chemical<br />
pollutants. UNEP/MAP: Athens, 1991 (Parts in English or French only).<br />
Rapports finaux sur les projets de recherche traitant de la bioaccumulation et de la toxicité des polluants chimiques.<br />
(parties en anglais ou français seulement).<br />
MTS 51. UNEP/MAP/FAO: Final reports on research projects dealing with mercury, toxicity and analytical techniques.<br />
UNEP/MAP: Athens, 1991 (Parts in English or French only).<br />
Rapports finaux sur les projets de recherche traitant du mercure, de la toxicité et des techniques analytiques.<br />
MTS 50. UNEP/MAP: Bibliography on marine litter. UNEP/MAP: Athens, 1991 (English).<br />
MTS 49. UNEP/MAP/WHO: Biogeochemical cycles of specific pollutants. Survival of pathogens. Final reports on<br />
research projects (Activity K). UNEP/MAP: Athens, 1991 (Parts in English or French only).<br />
Cycles biogéochimiques de polluants spécifiques. Survie des Pathogènes. Rapports finaux sur les projets de<br />
recherche (activité K).<br />
MTS 48. UNEP/MAP/FAO: Final reports on research projects (Activity G). UNEP/MAP: Athens, 1991 (Parts in English or<br />
French only).<br />
Rapports finaux sur les projets de recherche (Activité G).<br />
MTS 47. UNEP/MAP: Jellyfish blooms in the <strong>Mediterranean</strong>. Proceedings of the II workshop on jellyfish in the<br />
<strong>Mediterranean</strong> Sea. UNEP/MAP: Athens, 1991 (Parts in English or French only).<br />
Les proliferation’s de medusas en Méditerannée. Actes des IIèmes journées d'étude sur les méduses en mer<br />
Méditerranée.<br />
MTS 46. UNEP/MAP/WHO: Epidemiological studies related to environmental quality criteria for bathing waters,<br />
shellfish-growing waters and edible marine organisms (Activity D). Final report on project on relationship between<br />
microbial quality of coastal seawater and rotarus-induced gastro-enteritis among bathers (1986-88). UNEP/MAP: Athens,<br />
1991 (English).<br />
MTS 45. UNEP/MAP/IAEA: Transport of pollutants by sedimentation: Collected papers from the first <strong>Mediterranean</strong><br />
Workshop (Villefranche-sur-Mer, France, 10-12 December 1987). UNEP/MAP: Athens, 1990 (English).<br />
MTS 44. UNEP/MAP: Bibliography on aquatic pollution by organophosphorus compounds. UNEP/MAP: Athens, 1990<br />
(English).<br />
MTS 43. PNUE/UICN/GIS: Posidonie: Livre rouge "Gérard Vuignier" des végétaux, peuplements et paysages marins<br />
menacés de Méditerranée. UNEP/MAP: Athens, 1990 (français seulement).<br />
MTS 42. UNEP/MAP/IUCN: Report on the status of <strong>Mediterranean</strong> marine turtles. UNEP/MAP: Athens, 1990 (English,<br />
French).<br />
Rapport sur le statut des tortues marines de Méditerranée.<br />
MTS 41.UNEP/MAP: Wastewater reuse for irrigation in the <strong>Mediterranean</strong> region. Priority <strong>Action</strong>s Programme, Regional<br />
Activity Centre, Split, 1990 (English, French).<br />
Réutilisation agricole des eaux usées dans la région méditerranéenne..<br />
7
MTS 40. UNEP/MAP/FAO: Final reports on research projects (Activities H, I and J). UNEP/MAP: Athens, 1990 (English,<br />
French).<br />
Rapports finaux sur les projets de recherche (Activités H, I et J).<br />
MTS 39. UNEP/MAP/FAO/WHO/IAEA: Assessment of the state of pollution of the <strong>Mediterranean</strong> Sea by organohalogen<br />
compounds. UNEP/MAP: Athens, 1990 (English, French).<br />
Evaluation de l'état de la pollution par les composés organohalogénés.<br />
MTS 38.UNEP/MAP: Common measures adopted by the Contracting Parties to the Convention for the Protection of the<br />
<strong>Mediterranean</strong> Sea against pollution. UNEP/MAP: Athens, 1990 (English, French, Spanish and Arabic).<br />
Mesures communes adoptées par les Parties Contractantes à la Convention pour la protection de la mer Méditerranée<br />
contre la pollution.<br />
Medidas comunes adoptadas por las Partes Contratantes en el convenio para la Proteccion del Mar Mediterraneo<br />
contra la Contaminacion.<br />
MTS 37. UNEP/MAP/FAO: Final reports on research projects dealing with eutrophication and plankton blooms (Activity<br />
H). UNEP/MAP: Athens, 1990 (Parts in English or French only).<br />
Rapports finaux sur les projets de recherché consacrés à l'eutrophisation et aux efflorescences de plancton (Activité<br />
H).<br />
MTS 36. PNUE/UICN: Répertoire des aires marines et côtières protégées de la Méditerranée. Première partie - Sites<br />
d'importance biologique et écologique. UNEP/MAP: Athens, 1990 (français seulement).<br />
MTS 35. UNEP/MAP: Bibliography on marine pollution by organotin compounds. UNEP/MAP: Athens, 1989. (English).<br />
MTS 34. UNEP/MAP/FAO/WHO: Assessment of the state of pollution of the <strong>Mediterranean</strong> Sea by cadmium and<br />
cadmium compounds. UNEP/MAP: Athens, 1989 (English, French).<br />
Evaluation de l'état de la pollution de la mer Méditerranée par le cadmium et les composés de cadmium.<br />
MTS 33. UNEP/MAP/FAO/WHO/IAEA: Assessment of organotin compounds as marine pollutants in the <strong>Mediterranean</strong>.<br />
UNEP/MAP: Athens, 1989 (English, French).<br />
Evaluation des composés organostanniques en tant que polluants du milieu marin en Méditerranée.<br />
MTS 32. UNEP/MAP/FAO: Biogeochemical cycles of specific pollutants (Activity K). UNEP/MAP: Athens, 1989 (Parts in<br />
English or French only).<br />
Cycles biogéochimiques de polluants spécifiques (Activité K).<br />
MTS 31. UNEP/MAP/WMO: Airborne pollution of the <strong>Mediterranean</strong> Sea. Report and proceedings of a WMO/UNEP<br />
Workshop. UNEP/MAP: Athens, 1989 (Parts in English or French only).<br />
Pollution par voie atmosphérique de la mer Méditerranée. Rapport et actes des Journées d'étude OMM/PNUE.<br />
MTS 30. UNEP/MAP: Meteorological and climatological data from surface and upper measurements for the assessment<br />
of atmospheric transport and deposition of pollutants in the <strong>Mediterranean</strong> Basin: A review. UNEP/MAP: Athens, 1989.<br />
(English).<br />
MTS 29.UNEP/MAP: Bibliography on effects of climatic change and related topics. UNEP/MAP: Athens, 1989 (English).<br />
MTS 28. UNEP/MAP: State of the <strong>Mediterranean</strong> marine environment. UNEP/MAP: Athens, 1989 (English).<br />
MTS 27. UNEP/MAP Implications of expected climate changes in the <strong>Mediterranean</strong> Region: An overview. UNEP/MAP:<br />
Athens, 1989 (English).<br />
MTS 26. UNEP/MAP/IUCN: Directory of marine and coastal protected areas in the <strong>Mediterranean</strong> Region. Part I - Sites of<br />
biological and ecological value. UNEP/MAP: Athens, 1989 (English).<br />
MTS 25. UNEP/MAP: The <strong>Mediterranean</strong> <strong>Action</strong> <strong>Plan</strong> in a functional perspective: A quest for law and policy. UNEP/MAP:<br />
Athens, 1988 (English).<br />
MTS 24. UNEP/MAP/FAO: Toxicity, persistence and bioaccumulation of selected substances to marine organisms<br />
(Activity G). UNEP/MAP: Athens, 1988 (Parts in English or French only).<br />
Toxicité, persistance et bio accumulation de certaines substances vis-à-vis des organismes marins (Activité G).<br />
MTS 23. UNEP/MAP: National monitoring programme of Yugoslavia, Report for 1983 -1986. UNEP/MAP: Athens, 1988<br />
(English).<br />
MTS 22. UNEP/MAP/FAO: Study of ecosystem modifications in areas influenced by pollutants (Activity I). UNEP/MAP:<br />
Athens, 1988 (Parts in English or French only).<br />
Etude des modifications de l'écosystème dans les zones soumises à l'influence des polluants (Activité I).<br />
8
MTS 21. UNEP/MAP/UNESCO/FAO: Eutrophication in the <strong>Mediterranean</strong> Sea: Receiving capacity and monitoring of<br />
long-term effects. UNEP/MAP: Athens, 1988 (Parts in English or French only). Eutrophisation dans la mer Méditerranée:<br />
capacité réceptrice et surveillance continue des effets à long terme.<br />
MTS 20. UNEP/MAP/WHO: Epidemiological studies related to environmental quality criteria for bathing waters,<br />
shellfish-growing waters and edible marine organisms (Activity D). Final report on project on relationship between<br />
microbial quality of coastal seawater and health effects (1983-86). UNEP/MAP: Athens, 1988 (English).<br />
MTS 19. UNEP/MAP/IOC: Assessment of the state of pollution of the <strong>Mediterranean</strong> Sea by petroleum hydrocarbons.<br />
UNEP/MAP: Athens, 1988 (English, French).<br />
Evaluation de l'état de la pollution de la mer Méditerranée par les hydrocarbures de pétrole.<br />
MTS 18. UNEP/MAP/FAO/WHO: Assessment of the state of pollution of the <strong>Mediterranean</strong> Sea by mercury and mercury<br />
compounds. UNEP/MAP: Athens, 1987 (English, French).<br />
Evaluation de l'état de la pollution de la mer Méditerranée par le mercure et les composés mercuriels.<br />
MTS 17. UNEP/MAP: Seismic risk reduction in the <strong>Mediterranean</strong> region. Selected studies and documents (1985-1987).,<br />
Priority <strong>Action</strong>s Programme, Regional Activity Centre, Split, 1987 (Parts in English or French only).<br />
Réduction des risques sismiques dans la région méditerranéenne. Documents et études sélectionnés (1985-1987).<br />
MTS 16. UNEP/MAP: Promotion of soil protection as an essential component of environmental protection in<br />
<strong>Mediterranean</strong> coastal zones. Selected documents (1985-1987). Priority <strong>Action</strong>s Programme, Regional Activity Centre, Split,<br />
1987 (Parts in English or French only).<br />
Promotion de la protection des sols comme élément essentiel de la protection de l'environnement dans les zones<br />
côtières méditerranéennes. Documents sélectionnés (1985-1987).<br />
MTS 15. UNEP/MAP: Environmental aspects of aquaculture development in the <strong>Mediterranean</strong> region. Documents<br />
produced in the period 1985-1987. Priority <strong>Action</strong>s Programme, Regional Activity Centre, Split, 1987 (English).<br />
MTS 14. UNEP/MAP: Experience of <strong>Mediterranean</strong> historic towns in the integrated process of rehabilitation of urban and<br />
architectural heritage. Documents produced in the second phase of the Priority <strong>Action</strong> (1986). Priority <strong>Action</strong>s<br />
Programme, Regional Activity Centre, Split, 1987 (Parts in English or French only)<br />
MTS 13. UNEP/MAP: Specific topics related to water resources development of large <strong>Mediterranean</strong> islands. Documents<br />
produced in the second phase of the Priority <strong>Action</strong> (1985-1986). Priority <strong>Action</strong>s Programme, Regional Activity Centre,<br />
Split, 1987 (Parts in English or French only).<br />
Thèmes spécifiques concernant le développement des ressources en eau des grandes îles méditerranéennes. Textes<br />
rédigés au cours de la deuxième phase de l'action prioritaire (1985-1986).<br />
MTS 12. UNEP/MAP: Water resources development of small <strong>Mediterranean</strong> islands and isolated coastal areas.<br />
Documents produced in the first stage of the Priority <strong>Action</strong> (1984-1985). Priority <strong>Action</strong>s Programme, Regional Activity<br />
Centre, Split, 1987 (Parts in English or French only).<br />
Développement des ressources en eau des petites îles et des zones côtières isolées méditerranéennes. Textes rédigés<br />
au cours de la première phase de l'action prioritaire (1984-1985).<br />
MTS 11. UNEP/MAP: Rehabilitation and reconstruction of <strong>Mediterranean</strong> historic settlements. Documents produced in<br />
the first stage of the Priority <strong>Action</strong> (1984-1985). Priority <strong>Action</strong>s Programme, Regional Activity Centre, Split, 1986 (Parts in<br />
English or French only).<br />
Réhabilitation et reconstruction des établissements historiques méditerranéens. Textes rédigés au cours de la<br />
première phase de l'action prioritaire (1984-1985).<br />
MTS 10. UNEP/MAP: Research on the toxicity, persistence, bioaccumulation, carcinogenicity and mutagenicity of<br />
selected substances (Activity G). Final reports on projects dealing with toxicity (1983-85). UNEP/MAP: Athens, 1987<br />
(English).<br />
MTS 9. UNEP/MAP: Co-ordinated <strong>Mediterranean</strong> pollution monitoring and research programme (MED POL - PHASE I).<br />
Final report, 1975-1980. UNEP/MAP: Athens, 1986 (English).<br />
MTS 8. Add. UNEP/MAP: Biogeochemical studies of selected pollutants in the open waters of the <strong>Mediterranean</strong> (MED<br />
POL VIII). Addendum, Greek Oceanographic Cruise 1980. Addendum. UNEP/MAP: Athens, 1986 (English).<br />
MTS 8. UNEP/MAP/IAEA/IOC: Biogeochemical studies of selected pollutants in the open waters of the <strong>Mediterranean</strong><br />
(MED POL VIII). UNEP/MAP: Athens, 1986 (Parts in English or French only).<br />
Etudes bio géochimiques de certains polluants au large de la Méditerranée (MED POL VIII).<br />
MTS 7. UNEP/MAP/WHO: Coastal water quality control (MED POL VII). UNEP/MAP: Athens, 1986 (Parts in English or French<br />
only).<br />
Contrôle de la qualité des eaux côtières (MED POL VII).<br />
MTS 6. UNEP/MAP/IOC: Problems of coastal transport of pollutants (MED POL VI). UNEP/MAP: Athens, 1986 (English).<br />
9
MTS 5. UNEP/MAP/FAO: Research on the effects of pollutants on marine communities and ecosystems (MED POL V).<br />
UNEP/MAP: Athens, 1986 (Parts in English or French only).<br />
Recherche sur les effets des polluants sur les communautés et écosystèmes marins (MED POL V.<br />
MTS 4. UNEP/MAP/FAO: Research on the effects of pollutants on marine organisms and their populations (MED POL IV).<br />
UNEP/MAP: Athens, 1986 (Parts in English, French or Spanish only).<br />
Recherche sur les effets des polluants sur les organismes marins et leurs peuplements (MED POL IV).<br />
MTS 3. UNEP/MAP/FAO: Baseline studies and monitoring of DDT, PCBs and other chlorinated hydrocarbons in marine<br />
organisms (MED POL III). UNEP/MAP: Athens, 1986 (Parts in English, French or Spanish only).<br />
Études de base et surveillance continue du DDT, des PCB et des autres hydrocarbures chlorés contenus dans les<br />
organismes marins (MED POL III).<br />
MTS 2. UNEP/MAP/FAO: Baseline studies and monitoring of metals, particularly mercury and cadmium, in marine<br />
organisms (MED POL II). UNEP/MAP: Athens, 1986 (Parts in English, French or Spanish only).<br />
Etudes de base et surveillance continue des métaux, notamment du mercure et du cadmium, dans les organismes<br />
marins (MED POL II).<br />
MTS 1. UNEP/MAP/IOC/WMO: Baseline studies and monitoring of oil and petroleum hydrocarbons in marine waters.<br />
UNEP/MAP: Athens, 1986 (Parts in English, French or Spanish only).<br />
Etudes de base et surveillance continue du pétrole et des hydrocarbures contenus dans les eaux de la mer.<br />
10