Comparison of RAPD and PCR-RFLP markers for classification and ...
Comparison of RAPD and PCR-RFLP markers for classification and ...
Comparison of RAPD and PCR-RFLP markers for classification and ...

Create successful ePaper yourself
Turn your PDF publications into a flip-book with our unique Google optimized e-Paper software.
Egypt. Acad. J. biolog. Sci., 2 (2): 187-195 (2009)<br />
A. Entomology<br />
Email: egyptianacademic@yahoo.com ISSN: 1687–8809<br />
Received: 30/11/2009 www.eajbs.eg.net<br />
<strong>Comparison</strong> <strong>of</strong> <strong>RAPD</strong> <strong>and</strong> <strong>PCR</strong>-<strong>RFLP</strong> <strong>markers</strong> <strong>for</strong> <strong>classification</strong> <strong>and</strong> taxonomic<br />
studies <strong>of</strong> insects<br />
Fatma H. Galal<br />
Department <strong>of</strong> Entomology, Faculty <strong>of</strong> Science, Cairo University, Giza, Egypt, 12211.<br />
ABSTRACT<br />
Experiments were conducted to assess the efficiency <strong>of</strong> <strong>RAPD</strong> <strong>and</strong> <strong>PCR</strong>-<strong>RFLP</strong><br />
marker systems as molecular tools <strong>for</strong> taxonomy <strong>and</strong> <strong>classification</strong> <strong>of</strong> insects. Three<br />
species <strong>of</strong> adult ants, Camponotus maculatus, Monomorium pharoensis <strong>and</strong><br />
Cataglyphis bicolor, were used in this study. Total genomic DNA was extracted <strong>and</strong><br />
used <strong>for</strong> <strong>PCR</strong> amplification <strong>of</strong> the ITS region. The purified <strong>PCR</strong> products were<br />
subjected to single digestion with EcoRI, MspI, TaqI <strong>and</strong> SacI enzymes <strong>and</strong> visualized<br />
on 2% agarose gel. In addition, 40 arbitrary primers were used to generate <strong>RAPD</strong>-<br />
<strong>PCR</strong> pr<strong>of</strong>iles. Data obtained from <strong>RFLP</strong>, <strong>RAPD</strong> <strong>and</strong> <strong>RFLP</strong>+<strong>RAPD</strong> were statistically<br />
<strong>and</strong> phylogenetically analyzed to determine the level <strong>of</strong> polymorphism in each case.<br />
Intraspecific, interspecific variation levels <strong>and</strong> phylogenetic relationships were<br />
investigated. Results were discussed, comparatively, <strong>and</strong> the final conclusion was: on<br />
the bases <strong>of</strong> ease, cost, technical labor, speed <strong>and</strong> amount <strong>of</strong> DNA needed, the <strong>RAPD</strong><br />
marker system is preferentially used in taxonomic <strong>and</strong> <strong>classification</strong> studies. On the<br />
bases <strong>of</strong> degree <strong>of</strong> polymorphism, precision <strong>of</strong> genetic distance estimates <strong>and</strong> the<br />
statistical power <strong>of</strong> the test, no differences were observed between <strong>RAPD</strong> <strong>and</strong> <strong>PCR</strong>-<br />
<strong>RFLP</strong> tests.<br />
Keywords: <strong>PCR</strong>-<strong>RFLP</strong>, <strong>RFLP</strong>, <strong>RAPD</strong>-<strong>PCR</strong>, <strong>RAPD</strong>, polymerase chain reaction.<br />
INTRODUCTION<br />
The past limitations associated with the pedigree data, morphological,<br />
physiological <strong>and</strong> cytological <strong>markers</strong> <strong>for</strong> assessing genetic diversity in many species<br />
have largely been circumvented by the development <strong>of</strong> DNA <strong>markers</strong> such as<br />
restriction fragment length polymorphisms (<strong>RFLP</strong>s; Botstein et al., 1980) <strong>and</strong> r<strong>and</strong>om<br />
amplified polymorphic DNAs (<strong>RAPD</strong>s; Williams et al., 1990). The detection <strong>and</strong><br />
exploitation <strong>of</strong> naturally occurring DNA sequence polymorphisms are among the<br />
most significant developments in molecular biology. Polymorphic genetic <strong>markers</strong><br />
have wide potential applications in animal <strong>and</strong> plant improvement programmes as a<br />
means <strong>for</strong> varietal <strong>and</strong> parentage identification, evaluation <strong>of</strong> polymorphic genetic loci<br />
affecting quantitative economic traits, <strong>and</strong> genetic mapping (Nagaraju et al., 2001).<br />
Although the discrimination power <strong>of</strong> <strong>RFLP</strong>s in diversity studies has been<br />
well documented (Smith et al., 1990; Dudley et al., 1991; Messmer et al., 1993;<br />
Benchimol et al., 2000), the limitations related to the technical complexity <strong>of</strong><br />
per<strong>for</strong>ming <strong>RFLP</strong> analysis coupled with the widespread use <strong>of</strong> short-lived<br />
radioisotopes <strong>for</strong> detection have prompted researchers to look <strong>for</strong> alternative methods.<br />
The advent <strong>of</strong> the <strong>PCR</strong> has resulted in the development <strong>of</strong> a large number <strong>of</strong><br />
molecular techniques, which <strong>of</strong>fer an effective alternative to the hybridization<br />
methods <strong>of</strong> <strong>RFLP</strong> analysis. <strong>PCR</strong>-based approaches use only small quantities <strong>of</strong> DNA,<br />
avoid DNA blotting <strong>and</strong> use <strong>of</strong> radioactivity, <strong>and</strong> are amenable to automation. The<br />
<strong>RAPD</strong> method described by Williams et al. (1990) <strong>and</strong> Welsh & McClell<strong>and</strong> (1990)
188<br />
Fatma H. Galal<br />
generates <strong>PCR</strong> products by annealing to r<strong>and</strong>omly distributed homologous target sites<br />
<strong>of</strong> the template DNA. This technique mostly generates dominant <strong>markers</strong>, although<br />
length polymorphisms caused by insertions/ deletions can also occur at low<br />
frequencies. Because <strong>of</strong> its relative simplicity, <strong>RAPD</strong> technology is being extensively<br />
used in genetic analysis <strong>of</strong> various plant <strong>and</strong> animal species. However, limitations in<br />
the applications <strong>of</strong> <strong>RAPD</strong>s such as the dominant nature <strong>of</strong> the <strong>markers</strong>, chance comigration<br />
<strong>of</strong> b<strong>and</strong>s at different loci, <strong>and</strong> requirement <strong>for</strong> stringent protocol<br />
st<strong>and</strong>ardization to ensure reproducibility have also been encountered (Black, 1993).<br />
As <strong>PCR</strong> technology finds increased use in genetic analysis, novel variations <strong>of</strong> this<br />
technique are emerging which promise precision, economy <strong>and</strong> speed (Wu et al.,<br />
1994; Zietkiecwicz et al., 1994; Vos et al., 1995).<br />
The aim <strong>of</strong> the present study was to evaluate <strong>RFLP</strong>s <strong>and</strong> <strong>RAPD</strong>-<strong>PCR</strong> assays as<br />
molecular marker systems <strong>for</strong> <strong>classification</strong> <strong>and</strong> taxonomic studies using<br />
representative <strong>for</strong>micid species <strong>of</strong> the order Hymenoptera. This evaluation was based<br />
on terms <strong>of</strong> cost, speed, amount <strong>of</strong> DNA needed, technical labor, degree <strong>of</strong><br />
polymorphism, precision <strong>of</strong> genetic distance estimates <strong>and</strong> the statistical power <strong>of</strong> the<br />
test.<br />
MATERIALS AND METHODS<br />
Insect material <strong>and</strong> DNA extraction<br />
Three species <strong>of</strong> adult ants, Camponotus maculatus, Monomorium pharoensis<br />
<strong>and</strong> Cataglyphis bicolor, were used in the present study. All DNA extractions were<br />
per<strong>for</strong>med using DNeasy tissue kit (QIAGEN, GmbH, Hilden, Germany) following<br />
the manufacturer’s instructions. Individuals from each insect species were pooled to<br />
reach ≈0.1-0.5 g tissue weight <strong>and</strong> homogenized in a sterile 2 ml microcentrifuge tube<br />
<strong>and</strong> incubated in lysis buffer overnight at 60 ◦ C. The lysate <strong>of</strong> the whole insect body<br />
was used to isolate total genomic DNA.<br />
<strong>RAPD</strong> analysis<br />
<strong>RAPD</strong> analyses were per<strong>for</strong>med using 40 primers obtained from Operon<br />
Technologies Inc., Alameda, Calif. (kits A <strong>and</strong> B). Reactions were per<strong>for</strong>med in 25 μl<br />
volumes containing 50 mM Tris, pH 8.5, 1 mM MgC12, 20 mM KC1, 500 mg/ ml<br />
BSA, 2.5 % Ficoll 400, 0.02 % Xylene cyanole, 1 unit Taq polymerase, 50 ng<br />
template DNA, 1 μM primer, <strong>and</strong> 0.2 mM dNTPs. A negative control, containing<br />
water instead <strong>of</strong> template, was included in each reaction set. The amplification<br />
program used was 5 min at 94°C (hot start), 1 min at 94°C, 2 min at 30°C <strong>and</strong> 2 min<br />
at 72°C <strong>for</strong> 40 cycles followed by one cycle <strong>of</strong> 72°C <strong>for</strong> 7 min. <strong>PCR</strong> amplification<br />
was carried out in a DNA thermal cycler (Model 380 A, Applied Biosystems, CA,<br />
USA). Following amplification, the reactions were visualized on 2 % agarose gel<br />
prepared in lx TAE buffer (Sambrook et al., 1989) containing 0.1 μg/ ml <strong>of</strong> ethidium<br />
bromide <strong>and</strong> photographed using gel documentation system.<br />
<strong>PCR</strong>-<strong>RFLP</strong> analysis<br />
The DNA was suspended in 100 µl <strong>of</strong> TE buffer (pH 8.0) <strong>and</strong> used <strong>for</strong> <strong>PCR</strong><br />
amplification <strong>of</strong> the ITS region. The universal primers ITSF <strong>and</strong> ITSR (Collins <strong>and</strong><br />
Paskewitz, 1996) were used <strong>for</strong> the amplification <strong>of</strong> ITS using the <strong>PCR</strong> cycling<br />
parameters as described by Pr<strong>of</strong>t et al. (1999). The <strong>PCR</strong> individual b<strong>and</strong>s <strong>of</strong> ITS<br />
region were visualized <strong>and</strong> eluted from the gel using GenClean Kit (Invitrogen<br />
Corporation, San Diego, CA, USA) as described by the manufacturer. The purified<br />
<strong>PCR</strong> products were subjected to single digestion with EcoRI, MspI, TaqI <strong>and</strong> SacI<br />
enzymes (Promega, Corp. Madison, WI, USA) overnight at 37 ◦C in a 20 μl reaction
<strong>Comparison</strong> <strong>of</strong> <strong>RAPD</strong> <strong>and</strong> <strong>PCR</strong>-<strong>RFLP</strong> <strong>markers</strong> <strong>for</strong> <strong>classification</strong> <strong>and</strong> taxonomic studies 189<br />
volume. The digested fragments were resolved on a 2% agarose gel, visualized <strong>and</strong><br />
photographed using gel documentation system.<br />
Data analysis<br />
In both <strong>RFLP</strong> <strong>and</strong> <strong>RAPD</strong> assays, b<strong>and</strong>ing patterns <strong>of</strong> the samples were scored<br />
<strong>for</strong> the presence (1) or <strong>for</strong> absence (0) <strong>of</strong> each amplified b<strong>and</strong>. All <strong>RAPD</strong> assays were<br />
repeated thrice <strong>and</strong> only the reproducible b<strong>and</strong>s were scored. For considering a marker<br />
as polymorphic, the absence <strong>of</strong> an amplified product in at least one sample was used<br />
as a criterion. For genetic distance analysis, data sets were fed into the clustering<br />
program <strong>of</strong> SPSS (Version 14.0) <strong>and</strong> similarity matrix was determined using Jaccard's<br />
coefficient. Next, distance matrix (distance = 1 - similarity) was calculated. Based on<br />
similarity matrices using the unweighted pair group method analysis, STATISTICA<br />
program <strong>for</strong> Windows, 1995 (StatS<strong>of</strong>t, Inc., USA) was used to generate UPGMA<br />
dendrogram (Norusis, 1994). The Chi-square test was used to analyze the data<br />
obtained <strong>and</strong> differences were considered statistically significant if P< 0.05.<br />
RESULTS<br />
Levels <strong>of</strong> polymorphism<br />
B<strong>and</strong>ing patterns:<br />
Forty <strong>RAPD</strong> primers were used to amplify r<strong>and</strong>om sequences from the total<br />
DNA <strong>of</strong> the three ant species, C. maculatus, M. pharoensis <strong>and</strong> C. bicolor. All the<br />
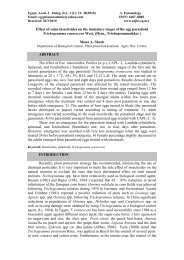
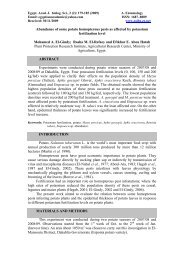
primers gave clear b<strong>and</strong>ing patterns, as shown in Fig. (1).<br />
M 1 2 3 1 2 3 1 2 3 1 2 3 1 2 3<br />
Fig. 1: Representative 2% agarose gels <strong>of</strong> <strong>RAPD</strong>-<strong>PCR</strong> patterns generated from three<br />
ant species, C. maculatus, M. pharoensis <strong>and</strong> C. bicolor using <strong>for</strong>ty arbitrary<br />
primers OPA <strong>and</strong> OPB. Lane M: DNA marker 100 bp Ladder, lane 1: C.<br />
maculatus, lane 2: C. bicolor <strong>and</strong> lane 3: M. pharoensis.<br />
An average <strong>of</strong> 7.5 b<strong>and</strong>s per primer were obtained <strong>for</strong> one amplification <strong>and</strong> a<br />
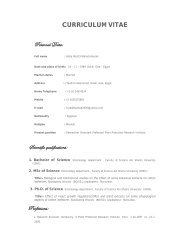
total <strong>of</strong> 100 b<strong>and</strong>s per species were compared among the 3 species. In <strong>RFLP</strong> assay, an<br />
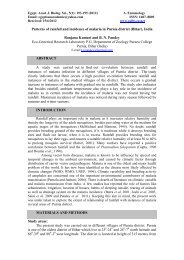
average <strong>of</strong> 5 b<strong>and</strong>s were observed <strong>for</strong> each reaction (Fig. 2) <strong>and</strong> 7 b<strong>and</strong>s per species<br />
were obtained with four restriction enzymes in 36 <strong>RFLP</strong> reactions. <strong>RAPD</strong> analysis<br />
revealed that the highest average percentage <strong>of</strong> common (monomorphic) b<strong>and</strong>s<br />
(78.1%) was observed within C. maculatus. Meanwhile, the highest average<br />
percentage <strong>of</strong> polymorphic b<strong>and</strong>s (45.5%) was observed within M. pharoensis (Table 1).
190<br />
Fatma H. Galal<br />
M 1 2 3 1 2 3 1 2 3 1 2 3 1 2 3<br />
A B C D E<br />
Fig. 2: Representative 2% agarose gels <strong>of</strong> <strong>PCR</strong>-<strong>RFLP</strong> patterns generated from three<br />
ant species, C. maculatus, M. pharoensis <strong>and</strong> C. bicolor using <strong>for</strong>ty arbitrary<br />
primers. Lane M: DNA marker 100 bp Ladder, lane 1: C. maculatus, lane 2: C.<br />
bicolor <strong>and</strong> lane 3: M. pharoensis. A: <strong>PCR</strong> <strong>of</strong> ITS region, B: EcoRI, C: SacI,<br />
D: TaqI <strong>and</strong> E: MspI.<br />
Table 1: Average percentages <strong>of</strong> common <strong>and</strong> polymorphic b<strong>and</strong>s within each species as revealed by<br />
<strong>RAPD</strong> <strong>and</strong> <strong>RFLP</strong> analyses.<br />
Ant species Total no. <strong>of</strong><br />
<strong>RAPD</strong> molecular marker <strong>RFLP</strong> molecular marker<br />
tested b<strong>and</strong>s % Monomorphic % Polymorphic % Monomorphic % Polymorphic<br />
C. maculatus 556 200/256<br />
56/256<br />
164/300<br />
136/300<br />
78.1<br />
21.9<br />
54.7<br />
45.3<br />
M. pharoensis 741 216/396<br />
180/396<br />
250/345<br />
95/345<br />
54.5<br />
45.5<br />
72.5<br />
27.5<br />
C. bicolor 563 187/248<br />
61/248<br />
172/315<br />
143/315<br />
75.4<br />
24.6<br />
54.6<br />
45.4<br />
On the other h<strong>and</strong>, <strong>RFLP</strong> assay clarified that the highest average percentage <strong>of</strong><br />
monomorphic b<strong>and</strong>s (72.5%) was observed within M. pharoensis. Meanwhile, the<br />
highest average percentage <strong>of</strong> polymorphic b<strong>and</strong>s (45.4%) was observed within C.<br />
bicolor (Table1). Furthermore, <strong>RAPD</strong> analysis revealed that the highest average<br />
percentage <strong>of</strong> monomorphic b<strong>and</strong>s (90.7%) was observed between M. pharoensis <strong>and</strong><br />
C. bicolor. Meanwhile, the highest average percentage <strong>of</strong> monomorphic b<strong>and</strong>s<br />
resolved by <strong>RFLP</strong> (94.6%) was observed between C. maculatus <strong>and</strong> C. bicolor (Table<br />
2). On the other h<strong>and</strong>, the highest average percentages <strong>of</strong> polymorphic b<strong>and</strong>s resolved<br />
by <strong>RAPD</strong> <strong>and</strong> <strong>RFLP</strong> (18.4 <strong>and</strong> 15.8%) were observed between M. pharoensis <strong>and</strong> C.<br />
maculatus (Table 2).<br />
Table (2): Average percentages <strong>of</strong> common <strong>and</strong> polymorphic b<strong>and</strong>s between species as revealed by<br />
<strong>RAPD</strong> <strong>and</strong> <strong>RFLP</strong> analyses.<br />
Ant species Total no. <strong>of</strong> tested<br />
b<strong>and</strong>s<br />
<strong>RAPD</strong> molecular marker <strong>RFLP</strong> molecular marker<br />
M. pharoensis <strong>and</strong> C. maculatus 1297<br />
%<br />
Monomorphic<br />
532/652<br />
81.6<br />
M. pharoensis <strong>and</strong> C. bicolor 1304 584/644<br />
90.7<br />
C. maculatus <strong>and</strong> C. bicolor 1119 447/504<br />
88.7<br />
M. pharoensis, C. maculatus <strong>and</strong> C. bicolor 1860 603/900<br />
67.0<br />
%<br />
Polymorphic<br />
120/652<br />
18.4<br />
60/644<br />
9.3<br />
57/504<br />
11.3<br />
297/900<br />
33.0<br />
%<br />
Monomorphic<br />
543/645<br />
84.2<br />
562/660<br />
85.2<br />
582/615<br />
94.6<br />
586/960<br />
61.0<br />
%<br />
Polymorphic<br />
102/645<br />
15.8<br />
98/660<br />
14.8<br />
33/615<br />
5.4<br />
374/960<br />
39.0
<strong>Comparison</strong> <strong>of</strong> <strong>RAPD</strong> <strong>and</strong> <strong>PCR</strong>-<strong>RFLP</strong> <strong>markers</strong> <strong>for</strong> <strong>classification</strong> <strong>and</strong> taxonomic studies 191<br />
Intraspecific variation (within each species):<br />
The average percentages <strong>of</strong> monomorphic b<strong>and</strong>s within each species are<br />
shown in Table (1). Among all species, the average percentages <strong>of</strong> monomorphic<br />
b<strong>and</strong>s were 67.0% <strong>and</strong> 61.0% <strong>for</strong> <strong>RAPD</strong> <strong>and</strong> <strong>RFLP</strong> analyses, respectively (Table 2).<br />
These overall similarity values indicated the detectability <strong>of</strong> polymorphism with the<br />
two kinds <strong>of</strong> molecular marker systems. The intraspecific variation within the three<br />
ant species, C. maculatus, M. pharoensis <strong>and</strong> C. bicolor, was shown in Table (1).<br />
Interspecific variation (between species):<br />
The average percentages <strong>of</strong> monomorphic b<strong>and</strong>s between species are shown in<br />
Table (2). Between all species, the average percentages <strong>of</strong> monomorphic b<strong>and</strong>s were<br />
33.0% <strong>and</strong> 39.0% <strong>for</strong> <strong>RAPD</strong> <strong>and</strong> <strong>RFLP</strong> analyses, respectively (Table 2). The average<br />
percentages <strong>of</strong> polymorphic b<strong>and</strong>s were higher between M. pharoensis <strong>and</strong> C.<br />
maculatus (18.4% <strong>and</strong> 15.8% <strong>for</strong> <strong>RAPD</strong> <strong>and</strong> <strong>RFLP</strong>, respectively) than between M.<br />
pharoensis <strong>and</strong> C. bicolor (9.3% <strong>and</strong> 14.8% <strong>for</strong> <strong>RAPD</strong> <strong>and</strong> <strong>RFLP</strong>, respectively) <strong>and</strong><br />
between C. maculatus <strong>and</strong> C. bicolor (11.3% <strong>and</strong> 5.4% <strong>for</strong> <strong>RAPD</strong> <strong>and</strong> <strong>RFLP</strong>,<br />
respectively) (Table 2). These overall dissimilarity values indicated the detectability<br />
<strong>of</strong> polymorphism with the two kinds <strong>of</strong> molecular marker systems. The interspecific<br />
variation between the three ant species, C. maculatus, M. pharoensis <strong>and</strong> C. bicolor,<br />
was shown in Table (2).<br />
Phylogenetic analyses:<br />
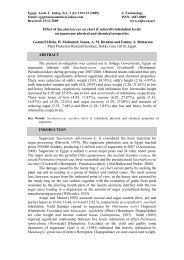
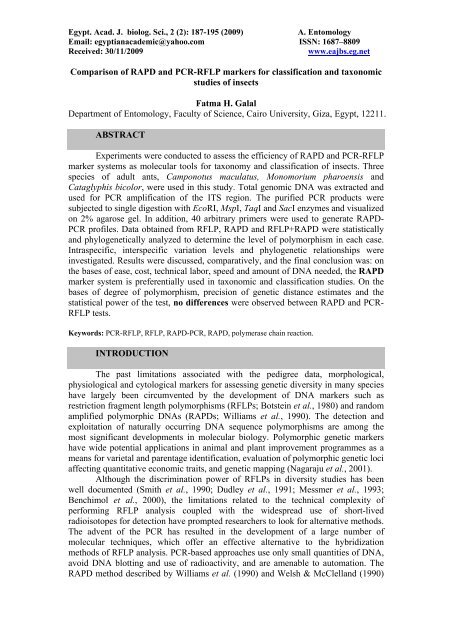
Phylogenetic analyses have been per<strong>for</strong>med on the <strong>RAPD</strong> results <strong>and</strong> <strong>RFLP</strong><br />
results as well as <strong>for</strong> the data <strong>of</strong> <strong>RAPD</strong>+<strong>RFLP</strong> (Fig. 3). <strong>RAPD</strong>, <strong>RFLP</strong> <strong>and</strong><br />
<strong>RAPD</strong>+<strong>RFLP</strong> data.<br />
C. maculatus<br />
M. pharoensis<br />
A<br />
C. bicolor<br />
C. maculatus<br />
C. bicolor<br />
M. pharoensis<br />
C<br />
9 10 11 12 13 14 15 16 17<br />
Linkage Distance<br />
Linkage Distance<br />
Linkage Distance<br />
Fig. 3: Dendrograms constructed on the basis <strong>of</strong> similarity index among three ant species, C.<br />
maculatus, M. pharoensis <strong>and</strong> C. bicolor using data <strong>of</strong> <strong>RAPD</strong>, <strong>PCR</strong>-<strong>RFLP</strong> <strong>and</strong> <strong>RAPD</strong>+<strong>PCR</strong>-<br />
<strong>RFLP</strong>. A: <strong>RAPD</strong>, B: <strong>PCR</strong>-<strong>RFLP</strong> <strong>and</strong> C: <strong>RAPD</strong>+<strong>PCR</strong>-<strong>RFLP</strong>.<br />
Amplification with 40 r<strong>and</strong>om primers generated 603 monomorphic b<strong>and</strong>s <strong>and</strong><br />
297 polymorphic b<strong>and</strong>s in a total <strong>of</strong> 900-b<strong>and</strong>ed <strong>RAPD</strong> patterns. Whenever, <strong>RFLP</strong><br />
C. maculatus<br />
C. bicolor<br />
M. pharoensis<br />
B<br />
9 10 11 12 13 14 15 16 17<br />
9 10 11 12 13 14 15 16 17
192<br />
Fatma H. Galal<br />
generated 586 monomorphic b<strong>and</strong> <strong>and</strong> 374 polymorphic b<strong>and</strong>s in a total <strong>of</strong> 960b<strong>and</strong>ed<br />
<strong>RFLP</strong> patterns. A total <strong>of</strong> 900 (<strong>RAPD</strong>), 960 (<strong>RFLP</strong>) <strong>and</strong> 1860 (<strong>RAPD</strong>+<strong>RFLP</strong>)<br />
distinct b<strong>and</strong>s obtained were used <strong>for</strong> cluster analysis. The three UPGMA<br />
dendrograms revealed that 80% similarity cut-<strong>of</strong>f value gave the same two major<br />
clusters. C. maculatus <strong>and</strong> C. bicolor were clustered in the same genotype while the<br />
M. pharoensis was clustered in a separate genotype (Fig. 3). Chi square <strong>and</strong> Fisher's<br />
tests revealed significant differences between both M. pharoensis <strong>and</strong> C. maculatus<br />
<strong>and</strong> between M. pharoensis <strong>and</strong> C. bicolor. However no significant difference<br />
between C. bicolor <strong>and</strong> C. maculatus was observed in cases <strong>of</strong> <strong>RFLP</strong> <strong>and</strong><br />
<strong>RAPD</strong>+<strong>RFLP</strong> data.<br />
DISCUSSION<br />
Compared to st<strong>and</strong>ard <strong>RFLP</strong> analysis, <strong>PCR</strong>-<strong>RFLP</strong> has many advantages.<br />
However, amplification <strong>of</strong> specific regions requires knowledge <strong>of</strong> the flanking<br />
sequences to obtain the primers needed <strong>for</strong> the reaction (Saiki et al. 1988). <strong>RAPD</strong>-<br />
<strong>PCR</strong> technique does not require knowledge <strong>of</strong> specific sequences, but rather uses<br />
r<strong>and</strong>om 10 base-pair primers. This method has become very useful <strong>for</strong> population<br />
genetic <strong>and</strong> taxonomic studies (Williams et al. 1990; Welsh <strong>and</strong> McClell<strong>and</strong>, 1990).<br />
As reported in this study, after a screen <strong>of</strong> 40 r<strong>and</strong>om primers, 18.4, 9.3, 11.3<br />
<strong>and</strong> 33.0% polymorphic DNA <strong>markers</strong> were obtained between M. pharoensis <strong>and</strong> C.<br />
maculates, M. pharoensis <strong>and</strong> C. bicolor, C. maculates <strong>and</strong> C. bicolor <strong>and</strong> between M.<br />
pharoensis, C. maculates <strong>and</strong> C. bicolor, respectively. Comparable levels <strong>of</strong> genetic<br />
polymorphism were obtained using <strong>RFLP</strong> marker system (15.8, 14.8, 5.4 <strong>and</strong> 39.0%<br />
between M. pharoensis <strong>and</strong> C. maculates, M. pharoensis <strong>and</strong> C. bicolor, C. maculates<br />
<strong>and</strong> C. bicolor <strong>and</strong> between M. pharoensis, C. maculates <strong>and</strong> C. bicolor, respectively).<br />
Interestingly, the phylogenetic <strong>and</strong> statistical analyses <strong>of</strong> the data obtained from<br />
<strong>RAPD</strong>, <strong>RFLP</strong> <strong>and</strong> <strong>RAPD</strong>+<strong>RFLP</strong> marker systems resulted in clustering C. maculatus<br />
<strong>and</strong> C. bicolor in one major genotype <strong>and</strong> M. pharoensis in a separate genotype.<br />
These results suggested that C. maculatus <strong>and</strong> C. bicolor have a common ancestor <strong>and</strong><br />
are genetically closer to each other than to M. pharoensis.<br />
These results clarified that the same results (in terms <strong>of</strong> degree <strong>of</strong><br />
polymorphism, precision <strong>of</strong> genetic distance estimates <strong>and</strong> the statistical power <strong>of</strong> the<br />
test) were obtained using either the data <strong>of</strong> <strong>RAPD</strong> or <strong>RFLP</strong> marker systems. El-Alfy<br />
et al. (2009) assessed genetic variation among nile tilapiine fishes by <strong>RAPD</strong> <strong>markers</strong>.<br />
Alam et al. (2006) used <strong>PCR</strong>-<strong>RFLP</strong> successfully to identify four members <strong>of</strong><br />
Anopheles annularis group <strong>of</strong> mosquitoes. Nagaraju et al. (2001) compared four<br />
marker systems (<strong>RFLP</strong>, <strong>RAPD</strong>, ISSR-<strong>PCR</strong> <strong>and</strong> SSRs) in genetic analysis <strong>of</strong> the<br />
silkworm, Bombyx mori. They concluded that ISSR-<strong>PCR</strong> is best suited <strong>for</strong> generation<br />
<strong>of</strong> the volume <strong>of</strong> in<strong>for</strong>mation required <strong>for</strong> per<strong>for</strong>mance <strong>of</strong> such a task. Chapini et al.<br />
(1999) investigated the genetic relationship between four Anagrus hymenopteran<br />
species using <strong>RAPD</strong> <strong>markers</strong> <strong>and</strong> found that they represent four genetically distinct<br />
species. Aljanabi et al. (1998) indicated the potential <strong>of</strong> <strong>RAPD</strong> <strong>markers</strong> to<br />
demonstrate the genetic variability <strong>of</strong> stink bug egg parasitoids. Wilkerson et al.<br />
(1993) reported that <strong>RAPD</strong> analysis will prove to be a powerful <strong>and</strong> technically<br />
accessible tool in elucidating the systematics <strong>of</strong> uncharacterized dipteran species<br />
complexes from natural populations. They also discussed some problematic<br />
characteristics <strong>of</strong> <strong>RAPD</strong> b<strong>and</strong>ing patterns <strong>and</strong> approaches to overcome these problems<br />
were suggested.
<strong>Comparison</strong> <strong>of</strong> <strong>RAPD</strong> <strong>and</strong> <strong>PCR</strong>-<strong>RFLP</strong> <strong>markers</strong> <strong>for</strong> <strong>classification</strong> <strong>and</strong> taxonomic studies 193<br />
In this study, <strong>RAPD</strong> analysis proved to be as in<strong>for</strong>mative as <strong>PCR</strong>-<strong>RFLP</strong><br />
analysis. The frequency <strong>of</strong> diagnostic primers observed in this study is quite high in<br />
comparison to studies <strong>of</strong> closely related species. There were no accepted methods <strong>for</strong><br />
estimating genetic divergence from <strong>RAPD</strong> data <strong>and</strong> this may be considerable<br />
technical difficulty. However, the genetic similarity suggested by <strong>RAPD</strong> survey <strong>of</strong> C.<br />
maculatus <strong>and</strong> C. bicolor species is seemingly at odds with their extreme<br />
morphological dissimilarity. While <strong>RAPD</strong> analysis is clearly an approach <strong>of</strong> merit <strong>for</strong><br />
such studies, some characteristics <strong>of</strong> <strong>RAPD</strong> reactions were encountered. First, <strong>RAPD</strong><br />
b<strong>and</strong> patterns must be empirically determined to be reproducible be<strong>for</strong>e their use as<br />
<strong>markers</strong> is justified. This could be made after repeated reactions to confirm the<br />
absence or presence <strong>of</strong> the b<strong>and</strong>. Second, preferential amplification during <strong>RAPD</strong><br />
reactions has little effect on the use <strong>of</strong> <strong>RAPD</strong> <strong>markers</strong> in diagnostic studies, but could<br />
be <strong>of</strong> serious importance in studies requiring independent <strong>markers</strong>, such as hybrid<br />
zone analysis, pedigree analysis or relatedness estimates based on b<strong>and</strong> sharing.<br />
Finally, the inference that b<strong>and</strong>s <strong>of</strong> similar size in different individuals are truly<br />
homologous should be made cautiously <strong>and</strong> rejected in cases <strong>of</strong> complex b<strong>and</strong>ing<br />
patterns or the b<strong>and</strong>s that differ in intensity or reproducibility. B<strong>and</strong> homology can<br />
only be definitely determined by further investigation, such as Southern blotting or<br />
sequencing. To avoid complicated interpretation, the primers used should have some<br />
characteristics, such as strong diagnostic b<strong>and</strong>s <strong>and</strong> simple patterns. Primers<br />
producing b<strong>and</strong>ing patterns that are in any way suspect should be passed over in<br />
favour <strong>of</strong> screening additional primers <strong>for</strong> <strong>markers</strong> with optimal characteristics.<br />
Conclusively, on the bases <strong>of</strong> ease, cost, technical labor, speed <strong>and</strong> amount <strong>of</strong><br />
DNA needed, the <strong>RAPD</strong> marker system is preferentially used in taxonomic <strong>and</strong><br />
<strong>classification</strong> studies. On the bases <strong>of</strong> degree <strong>of</strong> polymorphism, precision <strong>of</strong> genetic<br />
distance estimates <strong>and</strong> the statistical power <strong>of</strong> the test, no differences were observed<br />
between <strong>RAPD</strong> <strong>and</strong> <strong>PCR</strong>-<strong>RFLP</strong> tests.<br />
REFERENCES<br />
Alam, M. T.; Manoj K. D.; Ansari, M. A. <strong>and</strong> Sharma, Y. D. (2006): Molecular<br />
identification <strong>of</strong> Anopheles (Cellia) sundaicus from the Andaman <strong>and</strong> Nicobar<br />
isl<strong>and</strong>s <strong>of</strong> India. Acta Tropica. 97: 10–18.<br />
Aljanabi, S. M.; Marta, 1.; Loiácono, S.; Lourenço, R. T.; Borges M. <strong>and</strong> Tigano, M.<br />
S. (1998): <strong>RAPD</strong> analysis revealing polymorphism in egg parasitoids <strong>of</strong><br />
soybean stink bugs (Hemiptera: Pentatomidae). Soc. Entomol. Brasil. 27(3):<br />
413-417.<br />
Benchimol, L. L.; Souza, Jr. C.; Garcia, A. A.; Kono, P. M.; Mangolim, C. A.;<br />
Barbosa, A. M.; Coelho, A. S. <strong>and</strong> Souza, A. P. (2000): Genetic diversity in<br />
tropical maize inbred lines: Heterotic group assignment <strong>and</strong> hybrid<br />
per<strong>for</strong>mance determined by <strong>RFLP</strong> marker. Plant Breeding 119(6): 491-496.<br />
Black, W. C. (1993): <strong>PCR</strong> with arbitrary primers: approach with care. Insect Mol.<br />
Biol. 2: 1–6.<br />
Botstein, D.; White, K. L.; Skolnick, M. <strong>and</strong> Davis, R. W. (1980): Construction <strong>of</strong> a<br />
genetic linkage map in man using restriction fragment length polymorphisms.<br />
Am. J. Hum. Genet. 32: 314-33l .<br />
Chapini, E.; Soressi, L.; Fogher, C. <strong>and</strong> Zanirato, M. (1999): Genetic identity <strong>and</strong><br />
relationship between four Anagrus species (Hymenoptera: Mymaridae) using<br />
<strong>RAPD</strong> analysis. Eru. J. Entomol. 96: 393-400.
194<br />
Fatma H. Galal<br />
Collins, F. H. <strong>and</strong> Paskewitz, S. M. (1996): A review <strong>of</strong> the use <strong>of</strong> ribosomal DNA<br />
(rDNA) to differentiate among cryptic Anopheles species. Insect Mol. Biol. 5:<br />
1-9.<br />
Dudley, J. W.; Saghai Maro<strong>of</strong>, M. A. <strong>and</strong> Rufener, G. K. (1991): Molecular <strong>markers</strong><br />
<strong>and</strong> grouping <strong>of</strong> parents in a maize breeding program. Crop Sci. 31: 718-723.<br />
El-Alfy, S. H.; Abdelmordy, M. <strong>and</strong> Salama, M. S. (2009): Genetic variation among<br />
Nile tilapiine fishes (Perci<strong>for</strong>mes: Cichlidae) assessed by r<strong>and</strong>om amplified<br />
polymorphic DNA (<strong>RAPD</strong>) analysis. Research J. Cell <strong>and</strong> Mol. Biol. 3(1): 63-<br />
70.<br />
Messmer, M. M.; Melchinger, A. E.; Boppenmaier, J. <strong>and</strong> Herrmann, R. G. (1993):<br />
Relationships among early European maize (Zea mays L.) inbred lines: II.<br />
<strong>Comparison</strong> <strong>of</strong> pedigree <strong>and</strong> <strong>RFLP</strong> data. Crop Sci. 33: 944-950.<br />
Nagaraju, J.; Reddy, K. D.; Nagaraja, G. M. <strong>and</strong> Sethuraman, B. N. (2001):<br />
<strong>Comparison</strong> <strong>of</strong> multilocus <strong>RFLP</strong>s <strong>and</strong> <strong>PCR</strong>-based marker systems <strong>for</strong> genetic<br />
analysis <strong>of</strong> the silkworm, Bombyx mori. Heredity 86: 588-597.<br />
Norusis, M. J. (1994): SPSS pr<strong>of</strong>essional statistics 6.1. SPSS Inc., Chicago, IL. p.385.<br />
Pr<strong>of</strong>t, T.; M<strong>of</strong>fatt, S. L.; Berkahn, C. J. <strong>and</strong> Fraser, J. D. (1999): Identification <strong>and</strong><br />
characterization <strong>of</strong> novel superantigens from Streptococcus pyogenes. J. Exp.<br />
Med. 189: 89–102.<br />
Saiki, R. K.; Gelf<strong>and</strong>, D. H.; St<strong>of</strong>fel, S.; Scharf, S. J.; Higuchi, R.; Horn, G. T.;<br />
Mullis, K. B. <strong>and</strong> Erlich, H. A. (1988): Primer-directed enzymatic<br />
amplification <strong>of</strong> DNA with a thermostable DNA polymerase. Science. 239:<br />
487-491.<br />
Sambrook, J.; Fritsch, E. F. <strong>and</strong> Maniatis, T. (1989): Molecular Cloning: a laboratory<br />
manual. 2 nd ed. N.Y., Cold Spring Harbor Laboratory, Cold Spring Harbor<br />
Laboratory Press. 1659 p.<br />
Smith, O. S.; Smith, J. S.; Bowen, S. L.; Tenborg, R. A. <strong>and</strong> Wall, S. J. (1990):<br />
Similarities among a group <strong>of</strong> elite maize inbreds as measured by pedigree, F1<br />
heterosis, <strong>and</strong> <strong>RFLP</strong>s. Theor. Applied Genet. 80: 833-840.<br />
Vos, P.; Hogers, R.; Bleeker, M.; Reijans, M.; Van Delee, T.; Hornes, M.; Frijters, A.;<br />
Pot, J.; Peleman, J.; Kuiper, M. <strong>and</strong> Zabeau, M. (1995): AFLP: A new<br />
technique <strong>for</strong> DNA fingerprinting. Nucleic Acids Res. 23: 4407–4414.<br />
Welsh, J. <strong>and</strong> McClell<strong>and</strong>, M. (1990): Fingerprinting genomes using <strong>PCR</strong> with<br />
arbitrary primers. Nucleic Acids Res. 18: 7213-7218.<br />
Wilkerson, R. C.; Parsons, T. J.; Albrightt, D. G.; Klein, T. A. <strong>and</strong> Braun, M. J.<br />
(1993): R<strong>and</strong>om amplified polymorphic DNA (<strong>RAPD</strong>) <strong>markers</strong> readily<br />
distinguish cryptic mosquito species (Diptera: Culicidae: Anopheles). Insect<br />
Mol. Biol. l(4): 205-211.<br />
Williams, G. K.; Kubelik, A. R.; Livakj, K. J.; Rafalski, A. <strong>and</strong> Tincey, S. V. (1990):<br />
DNA polymorphisms amplified by arbitrary primers are useful as genetic<br />
<strong>markers</strong>. Nucleic Acids Res. 18: 6531-6535.<br />
Wu, K. S.; Jones, R.; Danneberger, L. <strong>and</strong> Scolnik, P. A. (1994): Detection <strong>of</strong><br />
microsatellite polymorphisms without cloning. Nucl. Acids Res. 22: 3257–<br />
3258.<br />
Zietkiecwicz, E.; Rafalski, A. <strong>and</strong> Labuda, D. (1994): Genome fingerprinting by<br />
simple sequence repeat (SSR)-anchored polymerase chain reaction<br />
amplification. Genomics. 20: 176–183.
<strong>Comparison</strong> <strong>of</strong> <strong>RAPD</strong> <strong>and</strong> <strong>PCR</strong>-<strong>RFLP</strong> <strong>markers</strong> <strong>for</strong> <strong>classification</strong> <strong>and</strong> taxonomic studies 195<br />
تاساردلا<br />
ىف<br />
ARABIC SUMMARY<br />
ينيابتلا بلافرلا لعافت تاملعم و لسلستملا ىئاوشعلا ةرملبلا لعافت تاملعم مادختسا نيب ةنراقم<br />
تارشحلا<br />
فينصت و ةيميسقتلا<br />
. ١٢٢١١<br />
للاج نيسح ةمطاف<br />
، رصم ، ةزيجلا - ةرھاقلا ةعماج - مولعلا ةيلك - تارشحلا ملع مسق<br />
بلافرلا لعافت تاملعم و لسلستملا ىئاوشعلا ةرملبلا لعافت تاملعم ةءافك مييقتل براجتلا<br />
تيرجأ<br />
: ىھو ،ةساردلا<br />
هذھل غلابلا<br />
لمنلا نم عاونأ ةثلاث تمدختساو . تارشحلا ميسقت<br />
و فينصتلل ةيئيزج تاودأك ينيابتلا<br />
يوونلا ضمحلا صلاختسا<br />
مت . ساتلاويكام ساتونوبماك و سيسنيوراف مايرومونوم ، رولوكيب سيفيلجاتاك<br />
: ىھ و عطقلا تاميزنإ نم ةعبرأ عم<br />
ينيابتلا بلافرلا لعافت ىف كلذ دعب مدختسيل<br />
، تارشحلا نم يمونيجلا<br />
مادختسا مت ، كلذ ىلإ ةفاضلإابو . زوراجأ ملاھ ٪ ٢ ىلع جتانلا لصف مت و SacI , Taq1 ، MspI EcoRI ،<br />
لعافت نم تانايبلا ىلع لوصحلا دعب . لسلستملا ىئاوشعلا ةرملبلا لعافت تاملعم ديلوتل ىئاوشع ءىداب ٤٠<br />
ديدحتل تانيعلل ةيفينصتلا ةرجشلا لمع و ايئاصحإ اھليلحتو ينيابتلا بلافرلا لعافت و لسلستملا ىئاوشعلا ةرملبلا<br />
نيب اميف نيابتلا تايوتسمو ، دحاولا عونلا ىف نيابتلا تايوتسم ةسارد تمت<br />
دقو . ةلاح لك يف نيابتلا ىوتسم<br />
: ىتلآاك يئاھنلا جاتنتسلاا ناكو ، ةقباسلا تاسارداا عم ، جئاتنلا<br />
تشقونو . روطتلاو ءوشنلا تاقلاعو عاونلأا<br />
لعافت تاملعم نإف ، يوونلا ضمحلا نم ةبولطملا<br />
ةيمكلاو ةعرسلاو ةلامعلاو ةفلكتلاو لمعلا ةلوھس سسأ ىلع<br />
ةقدو ، نيابتلا ىوتسم سسأ ىلعو<br />
. ةيميسقتلاو<br />
ةيفينصتلا تاساردلا يف لضفلأا ربتعت لسلستملا ىئاوشعلا ةرملبلا<br />
ةرملبلا لعافت تاملعم ةءافك نيب تافلاتخا يأ ظحلاي مل ، رابتخلال ةيئاصحلإا ةوقلاو ، ةينيجلا ةفاسملا ريدقت<br />
.<br />
ينيابتلا بلافرلا لعافت تاملعم و لسلستملا ىئاوشعلا