CAR on the Beat - Investigative Reporters and Editors
CAR on the Beat - Investigative Reporters and Editors
CAR on the Beat - Investigative Reporters and Editors

Create successful ePaper yourself
Turn your PDF publications into a flip-book with our unique Google optimized e-Paper software.
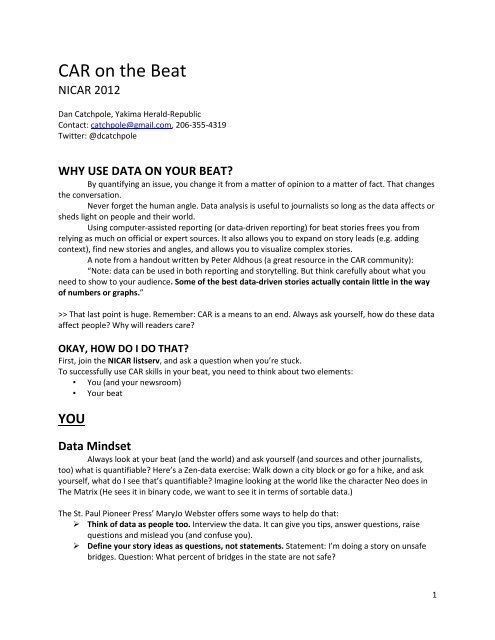
<str<strong>on</strong>g>CAR</str<strong>on</strong>g> <strong>on</strong> <strong>the</strong> <strong>Beat</strong><br />
NI<str<strong>on</strong>g>CAR</str<strong>on</strong>g> 2012<br />
Dan Catchpole, Yakima Herald-Republic<br />
C<strong>on</strong>tact: catchpole@gmail.com, 206-355-4319<br />
Twitter: @dcatchpole<br />
WHY USE DATA ON YOUR BEAT?<br />
By quantifying an issue, you change it from a matter of opini<strong>on</strong> to a matter of fact. That changes<br />
<strong>the</strong> c<strong>on</strong>versati<strong>on</strong>.<br />
Never forget <strong>the</strong> human angle. Data analysis is useful to journalists so l<strong>on</strong>g as <strong>the</strong> data affects or<br />
sheds light <strong>on</strong> people <strong>and</strong> <strong>the</strong>ir world.<br />
Using computer-assisted reporting (or data-driven reporting) for beat stories frees you from<br />
relying as much <strong>on</strong> official or expert sources. It also allows you to exp<strong>and</strong> <strong>on</strong> story leads (e.g. adding<br />
c<strong>on</strong>text), find new stories <strong>and</strong> angles, <strong>and</strong> allows you to visualize complex stories.<br />
A note from a h<strong>and</strong>out written by Peter Aldhous (a great resource in <strong>the</strong> <str<strong>on</strong>g>CAR</str<strong>on</strong>g> community):<br />
“Note: data can be used in both reporting <strong>and</strong> storytelling. But think carefully about what you<br />
need to show to your audience. Some of <strong>the</strong> best data-driven stories actually c<strong>on</strong>tain little in <strong>the</strong> way<br />
of numbers or graphs.”<br />
>> That last point is huge. Remember: <str<strong>on</strong>g>CAR</str<strong>on</strong>g> is a means to an end. Always ask yourself, how do <strong>the</strong>se data<br />
affect people? Why will readers care?<br />
OKAY, HOW DO I DO THAT?<br />
First, join <strong>the</strong> NI<str<strong>on</strong>g>CAR</str<strong>on</strong>g> listserv, <strong>and</strong> ask a questi<strong>on</strong> when you’re stuck.<br />
To successfully use <str<strong>on</strong>g>CAR</str<strong>on</strong>g> skills in your beat, you need to think about two elements:<br />
• You (<strong>and</strong> your newsroom)<br />
• Your beat<br />
YOU<br />
Data Mindset<br />
Always look at your beat (<strong>and</strong> <strong>the</strong> world) <strong>and</strong> ask yourself (<strong>and</strong> sources <strong>and</strong> o<strong>the</strong>r journalists,<br />
too) what is quantifiable? Here’s a Zen-data exercise: Walk down a city block or go for a hike, <strong>and</strong> ask<br />
yourself, what do I see that’s quantifiable? Imagine looking at <strong>the</strong> world like <strong>the</strong> character Neo does in<br />
The Matrix (He sees it in binary code, we want to see it in terms of sortable data.)<br />
The St. Paul Pi<strong>on</strong>eer Press’ MaryJo Webster offers some ways to help do that:<br />
Think of data as people too. Interview <strong>the</strong> data. It can give you tips, answer questi<strong>on</strong>s, raise<br />
questi<strong>on</strong>s <strong>and</strong> mislead you (<strong>and</strong> c<strong>on</strong>fuse you).<br />
Define your story ideas as questi<strong>on</strong>s, not statements. Statement: I’m doing a story <strong>on</strong> unsafe<br />
bridges. Questi<strong>on</strong>: What percent of bridges in <strong>the</strong> state are not safe?<br />
1
Tune you data radar to pick up opportunities to quantify. Look for issues, statements <strong>and</strong> o<strong>the</strong>r<br />
things that can be quantified.<br />
For an example of tuning your data radar, I had to write a budget story about a rural fire district<br />
<strong>on</strong> my beat. The district fire chief told me that <strong>the</strong> district needed to hire more full-time firefighters<br />
because its number of volunteer firefighters was declining. I did some research, <strong>and</strong> found that this is a<br />
nati<strong>on</strong>al problem, but I couldn’t find an example of any reporter who had quantified <strong>the</strong> problem.<br />
So I found <strong>the</strong> data for each fire district in <strong>the</strong> state over <strong>the</strong> past decade. That showed a slight<br />
decline in my paper’s county. I did more reporting <strong>and</strong> found that fire districts were receiving more<br />
emergency calls. So fewer volunteers were resp<strong>on</strong>ding to more calls. I got <strong>the</strong> call data (which had to be<br />
pulled from each district b/c of a historic quirk with 911 dispatch in my paper’s coverage area), <strong>and</strong><br />
found that calls had g<strong>on</strong>e up by about 20%, which produced a much more dramatic story:<br />
Not so dramatic: Way more dramatic:<br />
[To see <strong>the</strong> story: http://www.yakimaherald.com/news/latestlocalnews/489105-8/yakima-county-firedistricts-face-dangerous-volunteer-shortage]<br />
Running with scissors<br />
<strong>Beat</strong> reporters are usually pressed for time, but rushed data analysis can produce errors. D<strong>on</strong>’t<br />
rush. D<strong>on</strong>’t run with scissors.<br />
Know your data: How was it collected, entered <strong>and</strong> processed? What do <strong>the</strong> values represent?<br />
(It might seem self-evident, but that doesn’t mean it is.) Talk to <strong>the</strong> database manager to learn<br />
about <strong>the</strong> data’s provenance.<br />
Use trusted methodology: D<strong>on</strong>’t make it up as you go. Run <strong>the</strong> data <strong>and</strong> <strong>the</strong>n run it from scratch<br />
again. Have o<strong>the</strong>rs double check your data. C<strong>on</strong>sult experts (stat profs <strong>and</strong> teachers, data<br />
journalists, NI<str<strong>on</strong>g>CAR</str<strong>on</strong>g>-L) about your methodology.<br />
False precisi<strong>on</strong>: Beware of your results, especially when venturing into new ground. Analysis can<br />
produce results that are precise but not really correct or d<strong>on</strong>’t match <strong>the</strong> ground truth, so turn<br />
to notebook reporting to verify. For example, Washingt<strong>on</strong> state’s Employment Security Divisi<strong>on</strong><br />
calculates industry sector employment by rounding to <strong>the</strong> nearest 100. So if a county’s<br />
agriculture jobs go from 900 to 1,000, did <strong>the</strong> county gain 100 jobs? Not necessarily. It might<br />
have really g<strong>on</strong>e from 949 to 951 jobs.<br />
Correlati<strong>on</strong> vs Causality: Just because two variables move in relati<strong>on</strong> to each o<strong>the</strong>r does not<br />
mean that <strong>on</strong>e causes <strong>the</strong> o<strong>the</strong>r, or that if <strong>on</strong>e moves, <strong>the</strong> o<strong>the</strong>r will definitely react in a<br />
2
particular way. As journalists, we d<strong>on</strong>’t have <strong>the</strong> time (or academic training) to do <strong>the</strong> rigorous<br />
analysis it takes to establish causality. Also, <strong>the</strong>re might be o<strong>the</strong>r factors at play influencing <strong>the</strong><br />
variables. So, we can typically <strong>on</strong>ly say that <strong>the</strong>re is an observed trend, that A tends to move in<br />
relati<strong>on</strong> to B. (For most readers, that is more than enough.)<br />
o For example, I analyzed pitching data from 1921 to 2011. I measured <strong>the</strong> average number of<br />
strikeouts per nine innings <strong>and</strong> <strong>the</strong> average number of complete games thrown by starting<br />
pitchers, <strong>and</strong> found that <strong>the</strong> two have a Pears<strong>on</strong> correlati<strong>on</strong> coefficient (or Pears<strong>on</strong> r) of -<br />
0.96. That is a super str<strong>on</strong>g relati<strong>on</strong>ship for something affected by so many variables, like<br />
pitching. The results of a Pears<strong>on</strong> r test can <strong>on</strong>ly be -1 to 1. So, yeah, -0.96 is incredibly<br />
str<strong>on</strong>g. But <strong>the</strong> most I can say is that <strong>the</strong>re is a str<strong>on</strong>g correlati<strong>on</strong> between <strong>the</strong> two. I can’t<br />
prove that <strong>the</strong> increase in strikeouts led to fewer complete games being thrown.<br />
[http://public.tableausoftware.com/views/Baseballsdisappearingcompletegame/Disappearin<br />
gcompletegames]<br />
Triangulate your data<br />
There often is not a dataset out <strong>the</strong>re that answers <strong>the</strong> specific questi<strong>on</strong> you have in mind. But<br />
you can often answer it by data triangulati<strong>on</strong> – essentially using two datasets that answer related<br />
questi<strong>on</strong>s to answer your questi<strong>on</strong>.<br />
When you’re hiking (without GPS) <strong>and</strong> need to find your positi<strong>on</strong> with a compass <strong>and</strong> map, you<br />
triangulate your positi<strong>on</strong>. You take a compass reading off <strong>on</strong>e l<strong>and</strong>mark, <strong>and</strong> draw a straight line with<br />
that <strong>on</strong> <strong>the</strong> map. Then you do <strong>the</strong> same thing with a sec<strong>on</strong>d l<strong>and</strong>mark. Where <strong>the</strong> two lines meet <strong>on</strong> <strong>the</strong><br />
map is where you are.<br />
For example, no <strong>on</strong>e is collecting data quantifying if <strong>the</strong>re are enough volunteer firefighters in<br />
Yakima County, but by combining two datasets (<strong>the</strong> number of volunteers <strong>and</strong> call volumes), I showed<br />
that <strong>the</strong>re are about 33 percent fewer volunteers per 100 emergency calls today as compared to 10<br />
years ago.<br />
Or for ano<strong>the</strong>r example, no agency is probably collecting data to count how many sex offenders<br />
work in summer camps in your coverage area. But state agencies have lists of registered sex offenders<br />
<strong>and</strong> of licensed camp staff. By triangulating <strong>the</strong> two, you can find out how many are working with kids<br />
every summer.<br />
Organizati<strong>on</strong><br />
– Newsroom: Communicate early with your editors, graphics desk <strong>and</strong> o<strong>the</strong>rs. D<strong>on</strong>’t tell<br />
<strong>the</strong>m you have a chart for your story late in <strong>the</strong> afterno<strong>on</strong>. If you make your editors’<br />
lives easier <strong>and</strong> make <strong>the</strong>m look good, <strong>the</strong>y will give you more time to do data stories.<br />
– Calendar, lists (project <strong>and</strong> to-do): Excel is a great tool for tracking your projects. I keep<br />
a Current Project Excel doc in which each project has its own worksheet.<br />
– Data diary: Carefully chart what you’ve d<strong>on</strong>e with <strong>the</strong> data. It is critical when you’re<br />
covering a beat, <strong>and</strong> have to pick things up <strong>and</strong> put <strong>the</strong>m down because of your daily<br />
dem<strong>and</strong>s.<br />
– E.g. Steps for cleaning addresses. (Note: There are better ways to clean<br />
addresses, e.g. OpenRefine.):<br />
1. Excel: Ran CLEAN functi<strong>on</strong> <strong>on</strong> addresses in a new column to take out not printable<br />
characters. That solved issue of cell c<strong>on</strong>tents being <strong>on</strong> multiple lines.<br />
2. Copy pasted into Notepad++<br />
3. Did Find/Replace w/ RegEx to break main address <strong>and</strong> additi<strong>on</strong>al info. FIND: (^.+)([0-<br />
9]{5})(.+$) REPLACE: \1\2,\3<br />
4. Pasted Addresses back into Notepad++.<br />
3
5. Separated apartment numbers starting w/ “#” from address. Ran F/R: FIND:<br />
(^.+)(#.+)(YAKIMA.+$) REPLACE: \1\3,\2<br />
6. Pasted (now comma delimited) results into Excel. Copied address column (w/o # part)<br />
<strong>and</strong> pasted into Notepad++.<br />
7. Separated City names (which I should have d<strong>on</strong>e before separating apartment<br />
numbers). Did FIND/REPLACE with: (^.+)(\sAVE\s)(.+)(YAKIMA.+$) <strong>and</strong> \1\2,\4,\3<br />
8. I ran it for: RD, AVE, ST, BLVD, WAY, DR, PL, LN, Av, St, Bl, LOOP<br />
9. Pasted results into Excel. Using Filter to display addresses w/o Yakima in <strong>the</strong>m.<br />
10. Separated apt numbers that are <strong>on</strong>ly numerical characters <strong>and</strong> d<strong>on</strong>’t have “#” from<br />
address<br />
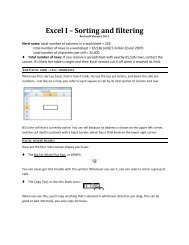
Tools First, learn Excel. It has been around since <strong>the</strong> 1980s. It’ll probably be around for a few more<br />
years. (In fact, <strong>on</strong>e paper is still using an Excel tutorial written in 1991 by Rich Gord<strong>on</strong>, who is now a<br />
journalism professor at Northwestern University.) Open it every day. Use it for your pers<strong>on</strong>al finances.<br />
Get comfortable with it (<strong>and</strong> pivot tables).<br />
Let your needs dictate what you tools you learn next. Oftentimes, several tools perform similar<br />
functi<strong>on</strong>s. Figure out which <strong>on</strong>e you like best, <strong>and</strong> get good at it.<br />
YOUR BEAT<br />
Finding stories:<br />
1. Proactive: Mining data for stories<br />
2. Reactive: Using data to exp<strong>and</strong> <strong>on</strong> stories.<br />
Finding data for your beat<br />
Find databases relevant to your beat, <strong>and</strong> mine <strong>the</strong>m regularly. There are too many beats to give a<br />
comprehensive list, so here are some examples of useful sources:<br />
General: Census.gov, FedStats, data.gov, FAA, CDC, Nati<strong>on</strong>al Institute of Health<br />
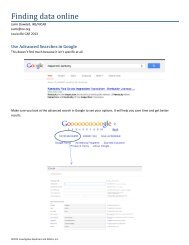
Google searches: “data”, “database”; Advanced Search >> Search websites by document type<br />
(.xls, .pdf, .doc) to find data <strong>and</strong> documents.<br />
School data: DataQualityCampaign.org (Gates Foundati<strong>on</strong>), your state’s department of<br />
educati<strong>on</strong>, federal Department of Educati<strong>on</strong>. Get school district’s database of school employees’<br />
salaries, benefits, stipends <strong>and</strong> any o<strong>the</strong>r compensati<strong>on</strong>. (If <strong>the</strong>y’re technically state employees,<br />
<strong>the</strong>n you can get this data for every district from <strong>the</strong> state.)<br />
Have a questi<strong>on</strong> or want suggesti<strong>on</strong>s specific to your beat? D<strong>on</strong>’t hesitate to c<strong>on</strong>tact me, <strong>and</strong> I’ll do my<br />
best to help.<br />
Dan Catchpole, Yakima Herald-Republic<br />
C<strong>on</strong>tact: catchpole@gmail.com, 206-355-4319<br />
Twitter: @dcatchpole<br />
4