Revitalizing Sales Compensation - Aon
Revitalizing Sales Compensation - Aon
Revitalizing Sales Compensation - Aon

You also want an ePaper? Increase the reach of your titles
YUMPU automatically turns print PDFs into web optimized ePapers that Google loves.
Parity (PPP) adjusted currency conversion rate. This would<br />
translate into an approximate value of ` 9-11 crores. now<br />
compare that with the median compensation of the CEO<br />
of an Indian company (in a revenue range of USD 2-4<br />
billion), and you would find the CEO pay to be in the<br />
range of ` 5-7 crores.<br />
Source: <strong>Aon</strong> Hewitt TCM Studies, OECD PPP Database 2011<br />
Note: Figures represent Total Fixed Pay<br />
There are two other interesting dimensions to this<br />
story. The first is around how the CEO compensation<br />
grows in India vis-à-vis other countries. At an average,<br />
executive pay in India has seen a Compound Annual<br />
Growth Rate (CAGR) of approximately 13-14% over the<br />
last decade. In the same period, the average growth in<br />
executive compensation across most Western economies<br />
has been in the range of 1-3%. If we assume that growth<br />
rates remain unchanged over the next five years, Indian<br />
CEOs would earn greater than their Western counterparts,<br />
albeit on a PPP basis.<br />
The second, and slightly nuanced story, is around<br />
how compensation is structured for executives in India vs<br />
the Western world. Typically, Indian CEOs have between<br />
45-50% of their compensation delivered through fixed<br />
(and non-performance linked) elements of pay, while their<br />
Western counterparts usually don’t have more than 20%<br />
of their pay as fixed. If you apply these percentages to the<br />
total compensation numbers, you will find that on a fixed<br />
pay basis, Indian CEOs already make more than their<br />
Western peers!<br />
The Story You Need to Know<br />
Let us now turn to the fundamental construct of executive<br />
pay practices that our study and the subsequent analysis<br />
threw up. Beyond this point, we will focus on the data as it<br />
is and some of the stories behind the data.<br />
10 www.aonhewitt.com/india<br />
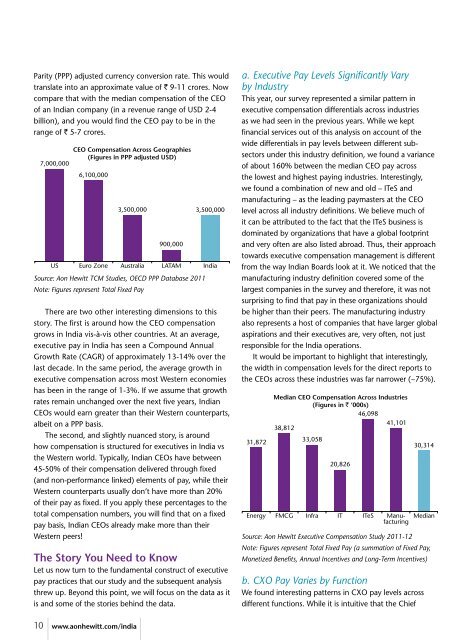
a. Executive Pay Levels Significantly Vary<br />
by Industry<br />
This year, our survey represented a similar pattern in<br />
executive compensation differentials across industries<br />
as we had seen in the previous years. While we kept<br />
financial services out of this analysis on account of the<br />
wide differentials in pay levels between different subsectors<br />
under this industry definition, we found a variance<br />
of about 160% between the median CEO pay across<br />
the lowest and highest paying industries. Interestingly,<br />
we found a combination of new and old – ITeS and<br />
manufacturing – as the leading paymasters at the CEO<br />
level across all industry definitions. We believe much of<br />
it can be attributed to the fact that the ITeS business is<br />
dominated by organizations that have a global footprint<br />
and very often are also listed abroad. Thus, their approach<br />
towards executive compensation management is different<br />
from the way Indian Boards look at it. We noticed that the<br />
manufacturing industry definition covered some of the<br />
largest companies in the survey and therefore, it was not<br />
surprising to find that pay in these organizations should<br />
be higher than their peers. The manufacturing industry<br />
also represents a host of companies that have larger global<br />
aspirations and their executives are, very often, not just<br />
responsible for the India operations.<br />
It would be important to highlight that interestingly,<br />
the width in compensation levels for the direct reports to<br />
the CEOs across these industries was far narrower (~75%).<br />
Source: <strong>Aon</strong> Hewitt Executive <strong>Compensation</strong> Study 2011-12<br />
Note: Figures represent Total Fixed Pay (a summation of Fixed Pay,<br />
Monetized Benefits, Annual Incentives and Long-Term Incentives)<br />
b. CXO Pay Varies by Function<br />
We found interesting patterns in CXO pay levels across<br />
different functions. While it is intuitive that the Chief