a randomised controlled trial (MATISSE). - ResearchGate
a randomised controlled trial (MATISSE). - ResearchGate
a randomised controlled trial (MATISSE). - ResearchGate

You also want an ePaper? Increase the reach of your titles
YUMPU automatically turns print PDFs into web optimized ePapers that Google loves.
DOI: 10.3310/hta16080<br />
Health Technology Assessment 2012; Vol. 16: No. 8<br />
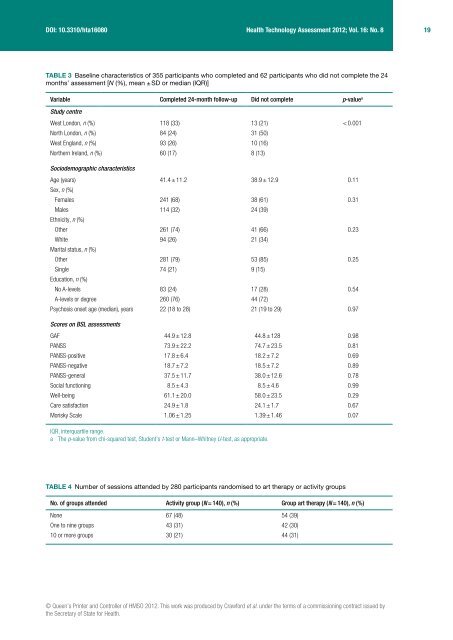
TABLE 3 Baseline characteristics of 355 participants who completed and 62 participants who did not complete the 24<br />
months’ assessment [N (%), mean ± SD or median (IQR)]<br />
Variable Completed 24-month follow-up Did not complete p-value a<br />
Study centre<br />
West London, n (%) 118 (33) 13 (21) < 0.001<br />
North London, n (%) 84 (24) 31 (50)<br />
West England, n (%) 93 (26) 10 (16)<br />
Northern Ireland, n (%) 60 (17) 8 (13)<br />
Sociodemographic characteristics<br />
Age (years)<br />
Sex, n (%)<br />
41.4 ± 11.2 38.9 ± 12.9 0.11<br />
Females 241 (68) 38 (61) 0.31<br />
Males<br />
Ethnicity, n (%)<br />
114 (32) 24 (39)<br />
Other 261 (74) 41 (66) 0.23<br />
White<br />
Marital status, n (%)<br />
94 (26) 21 (34)<br />
Other 281 (79) 53 (85) 0.25<br />
Single<br />
Education, n (%)<br />
74 (21) 9 (15)<br />
No A-levels 83 (24) 17 (28) 0.54<br />
A-levels or degree 260 (76) 44 (72)<br />
Psychosis onset age (median), years 22 (18 to 28) 21 (19 to 29) 0.97<br />
Scores on BSL assessments<br />
GAF 44.9 ± 12.8 44.8 ± 128 0.98<br />
PANSS 73.9 ± 22.2 74.7 ± 23.5 0.81<br />
PANSS-positive 17.8 ± 6.4 18.2 ± 7.2 0.69<br />
PANSS-negative 18.7 ± 7.2 18.5 ± 7.2 0.89<br />
PANSS-general 37.5 ± 11.7 38.0 ± 12.6 0.78<br />
Social functioning 8.5 ± 4.3 8.5 ± 4.6 0.99<br />
Well-being 61.1 ± 20.0 58.0 ± 23.5 0.29<br />
Care satisfaction 24.9 ± 1.8 24.1 ± 1.7 0.67<br />
Morisky Scale 1.06 ± 1.25 1.39 ± 1.46 0.07<br />
IQR, interquartile range.<br />
a The p-value from chi-squared test, Student’s t-test or Mann–Whitney U-test, as appropriate.<br />
TABLE 4 Number of sessions attended by 280 participants <strong>randomised</strong> to art therapy or activity groups<br />
No. of groups attended Activity group (N = 140), n (%) Group art therapy (N = 140), n (%)<br />
None 67 (48) 54 (39)<br />
One to nine groups 43 (31) 42 (30)<br />
10 or more groups 30 (21) 44 (31)<br />
© Queen’s Printer and Controller of HMSO 2012. This work was produced by Crawford et al. under the terms of a commissioning contract issued by<br />
the Secretary of State for Health.<br />
19