Measuring carbon stock in peat soils - Balai Penelitian Tanah
Measuring carbon stock in peat soils - Balai Penelitian Tanah
Measuring carbon stock in peat soils - Balai Penelitian Tanah

You also want an ePaper? Increase the reach of your titles
YUMPU automatically turns print PDFs into web optimized ePapers that Google loves.
Practical<br />
guidel<strong>in</strong>es<br />
<strong>Measur<strong>in</strong>g</strong><br />
<strong>carbon</strong> <strong>stock</strong><br />
<strong>in</strong> <strong>peat</strong> <strong>soils</strong><br />
Fahmudd<strong>in</strong> Agus<br />
Kurniatun Hairiah<br />
Anny Mulyani<br />
World Agroforestry Centre<br />
and<br />
Indonesian Centre for Agricultural Land<br />
Resources Research and Development
Practical guidel<strong>in</strong>es<br />
MEASURING<br />
CARBON STOCK<br />
IN PEAT SOILS<br />
Fahmudd<strong>in</strong> Agus, Kurniatun Hairiah, Anny Mulyani
Citation<br />
Agus F, Hairiah K, Mulyani A. 2011. <strong>Measur<strong>in</strong>g</strong> <strong>carbon</strong> <strong>stock</strong> <strong>in</strong> <strong>peat</strong> <strong>soils</strong>: practical guidel<strong>in</strong>es. Bogor, Indonesia:<br />
World Agroforestry Centre (ICRAF) Southeast Asia Regional Program, Indonesian Centre for Agricultural Land<br />
Resources Research and Development. 60p.<br />
These guidel<strong>in</strong>es are published collaboratively by the World Agroforestry Centre (ICRAF) Southeast Asia<br />
Regional Program, the Indonesian Centre for Agricultural Land Resources Research and Development and<br />
Brawijaya University.<br />
Disclaimer and copyright<br />
The World Agroforestry Centre (ICRAF) Southeast Asia Regional Program and the Indonesian Centre<br />
for Agricultural Land Resources Research and Development hold jo<strong>in</strong>t copyright <strong>in</strong> this publication but<br />
encourage duplication, without alteration, for non-commercial purposes. Proper citation is required <strong>in</strong> all<br />
<strong>in</strong>stances. The <strong>in</strong>formation <strong>in</strong> this booklet is, to our knowledge, accurate although we do not warrant the<br />
<strong>in</strong>formation nor are we liable for any damages aris<strong>in</strong>g from use of the <strong>in</strong>formation.<br />
Website l<strong>in</strong>ks provided by our site will have their own policies that must be honoured. The Centre ma<strong>in</strong>ta<strong>in</strong>s<br />
a database of users although this <strong>in</strong>formation is not distributed and is used only to measure the usefulness<br />
of our <strong>in</strong>formation. Without restriction, please add a l<strong>in</strong>k to our website www.worldagroforestry.org on your<br />
website or publication.<br />
ISBN 978-979-3198-66-8<br />
Contacts<br />
Fahmudd<strong>in</strong> Agus (Fahmudd<strong>in</strong>_agus@yahoo.com), Anny Mulyani (a_mulyani2000@yahoo.com), Indonesian<br />
Centre for Agricultural Land Resources Research and Development, Bogor, West Java, Indonesia. Kurniatun<br />
Hairiah (kurniatunhairiah@gmail.com), Brawijaya University, Malang, East Java, Indonesia.<br />
World Agroforestry Centre (ICRAF)<br />
Southeast Asia Regional Program<br />
Jalan CIFOR, Situ Gede, S<strong>in</strong>dang Barang<br />
Bogor 16115<br />
[PO Box 161, Bogor 16001]<br />
Jawa Barat, Indonesia<br />
Telephone: +62 251 8625415<br />
Facsimile: +62 251 8625416<br />
www.worldagroforestrycentre.org/sea<br />
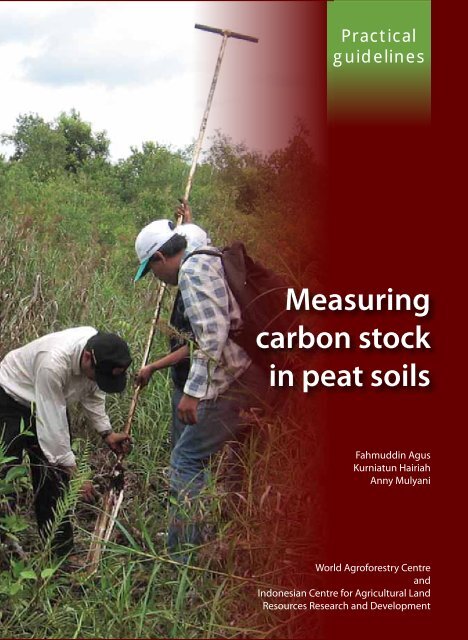
Cover photographs<br />
Tra<strong>in</strong><strong>in</strong>g <strong>in</strong> <strong>peat</strong> soil sampl<strong>in</strong>g <strong>in</strong> South Kalimantan, Indonesia. Photo credits: Harti N<strong>in</strong>gsih (front), ALLREDDI<br />
project (back)<br />
Design and layout<br />
Tikah Atikah (t.atikah@cgiar.org) and Sadewa (sadewa@cgiar.org)<br />
Copyedit<strong>in</strong>g<br />
Robert F<strong>in</strong>layson
Contents<br />
Figures v<br />
Table vii<br />
Glossary ix<br />
Foreword xiii<br />
1. Background 1<br />
1.1. Difference between <strong>peat</strong> and m<strong>in</strong>eral <strong>soils</strong> 2<br />
1.2. Carbon emissions from Indonesian <strong>peat</strong>lands 4<br />
2. Carbon-<strong>stock</strong>-related <strong>peat</strong> properties 9<br />
2.1. Bulk density 9<br />
2.2. Soil <strong>carbon</strong> content 10<br />
2.3. Peat maturity 11<br />
3. Carbon <strong>stock</strong> determ<strong>in</strong>ation of <strong>peat</strong> soil 15<br />
3.1. Determ<strong>in</strong>ation of sampl<strong>in</strong>g po<strong>in</strong>ts 15<br />
3.2. Peat soil sampl<strong>in</strong>g 19<br />
3.2.1. The k<strong>in</strong>ds of <strong>peat</strong> samples 19<br />
3.2.2. Peat sampl<strong>in</strong>g us<strong>in</strong>g <strong>peat</strong> auger 20<br />
3.2.3. Procedure for <strong>peat</strong> sampl<strong>in</strong>g 22<br />
3.2.4. Undisturbed soil sampl<strong>in</strong>g us<strong>in</strong>g soil core 26<br />
3.2.5. Soil sampl<strong>in</strong>g us<strong>in</strong>g hollow box of galvanized iron sheet 27<br />
3.3. Measurement of bulk density and organic matter content 29<br />
3.3.1. Bulk density 29<br />
3.3.2. Soil organic <strong>carbon</strong> content 31<br />
4. Estimation of greenhouse gas emissions 43<br />
5. Discussion 51<br />
References 55<br />
Appendix. Record sheet for <strong>peat</strong> observation 59<br />
iii
Figures<br />
Figure 1. Schematic process of the formation and development of<br />
<strong>peat</strong> <strong>in</strong> a wetland bas<strong>in</strong> landscape 3<br />
Figure 2. Schematic diagram of sampl<strong>in</strong>g po<strong>in</strong>ts with<strong>in</strong> a <strong>peat</strong> dome<br />
us<strong>in</strong>g the grid or transects methods 17<br />
Figure 3. Peat thickness maps 18<br />
Figure 4. Observation plots of biomass and necromass<br />
(Hairiah et al. 2011a) and <strong>peat</strong> sampl<strong>in</strong>g po<strong>in</strong>t placement 18<br />
Figure 6. The <strong>peat</strong> auger 21<br />
Figure 7. Us<strong>in</strong>g the <strong>peat</strong> auger on <strong>in</strong>undated <strong>peat</strong> 22<br />
Figure 8. Peat sample appear<strong>in</strong>g from the gouge on the f<strong>in</strong>’s surface 23<br />
Figure 9. Peat samples 24<br />
Figure 10. Soil core (soil r<strong>in</strong>g) for undisturbed soil sampl<strong>in</strong>g 27<br />
Figure 11. Stages of undisturbed soil sampl<strong>in</strong>g us<strong>in</strong>g soil core 27<br />
Figure 12. Cubical and fluid <strong>peat</strong> samples 28<br />
Figure 13. Illustration of <strong>peat</strong> soil volume 30<br />
Figure 14. Porcela<strong>in</strong> mortar and pestle 32<br />
Figure 15. Porcela<strong>in</strong> cups <strong>in</strong>side a furnace 33<br />
Figure 16. Determ<strong>in</strong>ation of <strong>peat</strong> maturity <strong>in</strong> the field 38<br />
Figure 17. 10 ml syr<strong>in</strong>ge (left) and a sieve (right) 38<br />
v
vi<br />
Figure 18. Infra-Red Gas Analyzer (IRGA) and the closed chamber for<br />
measur<strong>in</strong>g CO 2 gas flux emitted from the soil 46<br />
Figure 19. Gas sampl<strong>in</strong>g from a closed chamber for gas concentration<br />
measurement us<strong>in</strong>g gas chromatography 47<br />
Figure 20. The rate of subsidence of dra<strong>in</strong>ed <strong>peat</strong> as a function of time s<strong>in</strong>ce<br />
the dra<strong>in</strong>age starts (Wösten et al. 1997) 49
Tables<br />
Table 1. Some differences <strong>in</strong> the characteristics of <strong>peat</strong> and upland <strong>soils</strong> 4<br />
Table 2. Mean and standard deviation of selected <strong>peat</strong> properties<br />
based on samples from Sumatra and Kalimantan 35<br />
Table 3. Example of calculation of <strong>carbon</strong> <strong>stock</strong>s <strong>in</strong> <strong>peat</strong> soil from one<br />
po<strong>in</strong>t of observation 36<br />
Table 4. Indicators used for differentiat<strong>in</strong>g <strong>peat</strong> maturity <strong>in</strong> the field<br />
and <strong>in</strong> the laboratory 37<br />
Table 5. Calculation of the change <strong>in</strong> <strong>peat</strong> <strong>carbon</strong> <strong>stock</strong>s based on<br />
bulk density (BD) and organic <strong>carbon</strong> content (C org ) data<br />
by layer 49<br />
vii
Glossary<br />
Aboveground biomass. Biomass above ground level (above the soil<br />
surface), consist<strong>in</strong>g of trees, other plants and animals (the latter are<br />
normally considered to be negligible).<br />
Belowground biomass. Biomass below the soil surface, consist<strong>in</strong>g of plant<br />
roots and soil biota.<br />
Biomass. The total mass of liv<strong>in</strong>g matter—plants and animals—<strong>in</strong> a unit<br />
area. It is normally quantified on the basis of dry weight and usually<br />
expressed <strong>in</strong> tonne per hectare (t/ha) or megagram per hectare (Mg/<br />
ha). 1 Mg = 1 t = 1,000,000 gram.<br />
Carbon pool. A subsystem that can store or release <strong>carbon</strong>. Examples of<br />
<strong>carbon</strong> pools are plant biomass, necromass, soil and water.<br />
Carbon budget. The balance of the transfer, dur<strong>in</strong>g a specified time period,<br />
of <strong>carbon</strong> from one <strong>carbon</strong> pool to another <strong>in</strong> a <strong>carbon</strong> cycle, or from<br />
<strong>carbon</strong> pools to the atmosphere.<br />
Carbon dioxide equivalent (CO 2 eq). A measure used to compare the<br />
global warm<strong>in</strong>g potential (GWP) of certa<strong>in</strong> greenhouse gases<br />
relative to the warm<strong>in</strong>g potential of CO 2 ; it comb<strong>in</strong>es differences <strong>in</strong><br />
the heat-trapp<strong>in</strong>g effect as well as expected residence time <strong>in</strong> the<br />
atmosphere. For example, the GWP of methane (CH 4 ) dur<strong>in</strong>g an<br />
account<strong>in</strong>g period of 100 years is 25 and for nitrous oxide (N 2 O) it is<br />
298. This means that emissions of 1 t of CH 4 and N 2 O are equivalent<br />
to 25 and 298 t of CO 2 , respectively.<br />
Carbon dioxide. This is an odourless and colourless gas, expressed <strong>in</strong> the<br />
formula CO 2 , that is formed from a variety of processes such as<br />
combustion and/or decomposition of organic matter and volcanic<br />
ix
x<br />
eruptions. It is captured from the atmosphere, along with solar<br />
energy, by green plants through photosynthesis, and reemitted<br />
by respiration, releas<strong>in</strong>g energy. Today’s CO 2 concentration <strong>in</strong> the<br />
atmosphere is about 0.039% by volume or 388 mole ppm. The CO 2<br />
concentration has <strong>in</strong>creased over the past century ow<strong>in</strong>g to the use<br />
of fossil fuel and natural gas as well as the reduction of above- and<br />
belowground terrestrial <strong>carbon</strong> <strong>stock</strong>s. The molecular weight of CO 2<br />
is 44 g; the atomic weight of <strong>carbon</strong> (C) is 12 g. Conversion of the<br />
weight of C to CO 2 is 44/12 or 3.67.<br />
Carbon sequestration. The process of absorption of CO 2 from the<br />
atmosphere <strong>in</strong>to plant tissues and soil.<br />
Carbon <strong>stock</strong>. The mass of <strong>carbon</strong> stored <strong>in</strong> an ecosystem at any given time,<br />
either <strong>in</strong> the form of biomass, necromass (dead organisms) or soil<br />
<strong>carbon</strong>.<br />
Carbon. Non-metallic chemical element expressed with the atomic symbol<br />
‘C’, which is widely available <strong>in</strong> all organic (C bound to H and O) and<br />
<strong>in</strong>organic (elemental C) matter. Carbon has the atomic number 6 and<br />
typical atomic weight of 12 g/mol, but a stable C13 and radioactive<br />
C14 also occur <strong>in</strong> small amounts.<br />
Emissions. The process of releas<strong>in</strong>g greenhouse gases <strong>in</strong>to the atmosphere.<br />
Fibric. Early stage of <strong>peat</strong> decomposition where recognizable plant fibres<br />
dom<strong>in</strong>ate (Table 4).<br />
Forest. A vegetation (land-cover) type dom<strong>in</strong>ated by trees, which is<br />
recognized through various def<strong>in</strong>itions that, for example, restrict<br />
the m<strong>in</strong>imum area, give the m<strong>in</strong>imum crown cover <strong>in</strong> current or<br />
potential stages and express restrictions on the type of woody<br />
vegetation that is <strong>in</strong>cluded <strong>in</strong> the concept of ‘trees’.<br />
Flux. The flow (of greenhouse gases) between pools, for example, from the<br />
soil <strong>in</strong>to the atmosphere <strong>in</strong> the unit weight of gas per unit surface<br />
area, expressed as, for example, mg/(m 2 hour).<br />
Hemic. Intermediate stage of <strong>peat</strong> decomposition, between fibric and sapric<br />
(Table 4).
Histosol. Peat soil.<br />
Land cover. The vegetation on the Earth’s surface, such as forests, half-open<br />
woodlands, grasslands and open fields.<br />
Land use. This term refers to the classification of land-cover types based on<br />
human activities, such as plantation forestry, tree crops, field crops,<br />
urban and conservation areas (please note that a term such as ‘forest’<br />
can refer to both land cover and land use, depend<strong>in</strong>g on context).<br />
Necromass (dead organic matter). The weight of dead organisms (mostly<br />
plants) <strong>in</strong> a unit land area, usually expressed as dry weight <strong>in</strong> t/ha or<br />
Mg/ha. Aboveground necromass <strong>in</strong>cludes dead trees (stand<strong>in</strong>g or on<br />
the surface), the litter layer of dead leaves, twigs and branches and<br />
crop residues. Belowground necromass <strong>in</strong>cludes dead roots and crop<br />
residues buried by soil tillage that have not yet been converted <strong>in</strong>to<br />
soil organic matter.<br />
Organic matter. Material derived from liv<strong>in</strong>g matter that can decompose<br />
or be the result of decomposition or materials consist<strong>in</strong>g of organic<br />
compounds.<br />
Peat (as substrate). Soil dom<strong>in</strong>ated by partially decomposed plant residues,<br />
with an organic C content of more than 18% (organic matter content<br />
of more than 30%).<br />
Peat soil (as soil type). Soils with at least 50 cm of <strong>peat</strong>. Peat soil has a<br />
thickness rang<strong>in</strong>g from 0.5 m (by def<strong>in</strong>ition) to more than 15 m.<br />
Large areas of tropical <strong>peat</strong>s have thicknesses rang<strong>in</strong>g 2–8 m.<br />
Peatland (as ecosystem). A land system dom<strong>in</strong>ated by <strong>peat</strong> <strong>soils</strong>. Peatland<br />
is usually found <strong>in</strong> wetland conditions but not all wetlands are<br />
<strong>peat</strong>lands. Mosses, grasses, shrubs and trees can contribute to the<br />
formation of <strong>peat</strong> <strong>in</strong> water-saturated conditions, with the term ‘bog’<br />
reserved for <strong>peat</strong>land dom<strong>in</strong>ated by moss.<br />
Sapric. Advanced stage of <strong>peat</strong> decomposition <strong>in</strong>to organic-matter-rich<br />
‘earth’ without visible fibres (Table 4).<br />
xi
xii<br />
Soil bulk density (BD). Dry weight of soil per unit volume (<strong>in</strong>clud<strong>in</strong>g<br />
volume of soil solids and pores filled with gas and water).<br />
Soil organic <strong>carbon</strong> content (C org ). The mass of <strong>carbon</strong> per unit weight<br />
of soil. Its units are percentage by weight or gram per kilogram<br />
(g organic C/kg soil), tonne per tonne (t /t) or megagram per<br />
megagram (Mg/Mg). If laboratory analysis only provides data on<br />
organic matter content (for example, by the method of loss on<br />
ignition (LOI)), the Corg content of the soil is normally assumed<br />
to be 1/1.724 of soil organic matter content. If the <strong>peat</strong> soil has an<br />
organic matter content of 98% then the C org = 98%/1.724 = 57% =<br />
570 g/kg = 0.57 Mg/Mg = 0.57 t/t or simply 0.57.<br />
Soil organic matter content. The mass of soil organic matter per unit<br />
weight of dry soil. Usually expressed as percentage by weight<br />
or gram per kilogram (g organic matter/kg dry soil) tonne per<br />
tonne (t /t) or megagram per megagram (Mg/Mg). Organic matter<br />
content of 98% by weight = 980 g/kg = 0.98 Mg/Mg = 0.98 t/t.
Foreword<br />
Peatland is one of the largest terrestrial <strong>carbon</strong> storehouses. However,<br />
the <strong>carbon</strong> it conta<strong>in</strong>s is only protected from decomposition by the wet<br />
conditions of the <strong>peat</strong>. Under special conditions where decomposition<br />
is slow ow<strong>in</strong>g to low oxygen supply (water saturated), low nutrient<br />
concentrations, and acidity, dead organic matter from trees or other<br />
vegetation can start to pile up and accumulate, creat<strong>in</strong>g conditions<br />
that further slow decomposition. Specialized trees, sedges and other<br />
vegetation start to dom<strong>in</strong>ate and a <strong>peat</strong> swamp forest is formed. When<br />
this starts to hold enough water, it can become a semi-autonomous<br />
landscape unit, depend<strong>in</strong>g on ra<strong>in</strong>fall and atmospheric nutrient <strong>in</strong>puts,<br />
<strong>in</strong>dependent of the m<strong>in</strong>eral soil and groundwater. The belowground<br />
<strong>carbon</strong> <strong>stock</strong>s can reach 10–100 times those of the most lush tropical<br />
forest. However, when the forest is cleared and the <strong>peat</strong> is dra<strong>in</strong>ed the<br />
stored <strong>carbon</strong> is readily decomposed and released as CO , the most<br />
2<br />
important greenhouse gas. In addition, excessive dra<strong>in</strong>age of <strong>peat</strong>land<br />
<strong>in</strong>creases its vulnerability to fires and, <strong>in</strong> turn, the <strong>peat</strong> loses its function<br />
of buffer<strong>in</strong>g the surround<strong>in</strong>g environment from drought by the gradual<br />
release of water stored <strong>in</strong> the <strong>peat</strong> ‘dome’. What took thousands of years<br />
to accumulate can be burnt with<strong>in</strong> a few days and decompose <strong>in</strong> a few<br />
years or decades.<br />
With the <strong>in</strong>crease of human populations, land resources are becom<strong>in</strong>g<br />
scarcer. Peatlands that were once formerly regarded as wasteland are<br />
<strong>in</strong>creas<strong>in</strong>gly be<strong>in</strong>g developed for various economic purposes such<br />
as agriculture and settlements. As a consequence, the <strong>carbon</strong> s<strong>in</strong>k of<br />
actively grow<strong>in</strong>g <strong>peat</strong> becomes one of the most important <strong>carbon</strong><br />
sources associated with land uses, land-use changes and forestry.<br />
Tropical <strong>peat</strong> alone is estimated to contribute 1–3% of global CO2 emissions ow<strong>in</strong>g to human activity. In Indonesia, the country that has<br />
xiii
xiv<br />
the largest area of tropical <strong>peat</strong>, emissions from <strong>peat</strong>land are around<br />
one-third of the total, although the exact numbers are debated and<br />
uncerta<strong>in</strong>. Therefore, <strong>in</strong> the context of Nationally Appropriate Mitigation<br />
Actions (NAMAs) and efforts to Reduce Emissions from Deforestation<br />
and Degradation (REDD+), conservation and susta<strong>in</strong>able management of<br />
<strong>peat</strong>land has become one of the ma<strong>in</strong> concerns.<br />
One of the requirements of any scheme to reduce <strong>carbon</strong> emissions<br />
through REDD+ and NAMA is a credible monitor<strong>in</strong>g, report<strong>in</strong>g and<br />
verify<strong>in</strong>g (MRV) system. MRV systems document, report on and verify<br />
changes <strong>in</strong> <strong>carbon</strong> <strong>stock</strong>s <strong>in</strong> a transparent, consistent and accurate<br />
manner. An MRV system must be supported by a reliable method<br />
for measur<strong>in</strong>g <strong>carbon</strong> <strong>stock</strong>s and changes <strong>in</strong> them, both above- and<br />
belowground. This booklet provides practical guidance on <strong>peat</strong> sampl<strong>in</strong>g<br />
and analysis, calculation of the amount of <strong>carbon</strong> and data <strong>in</strong>terpretation.<br />
It also expla<strong>in</strong>s the relationship between changes <strong>in</strong> <strong>carbon</strong> <strong>stock</strong> and CO2 emissions.<br />
We thank the various people and organizations who have assisted <strong>in</strong><br />
writ<strong>in</strong>g and publish<strong>in</strong>g this book. Hopefully, it will be useful for people<br />
who are engaged <strong>in</strong> the MRV of <strong>carbon</strong> <strong>stock</strong>s <strong>in</strong> <strong>peat</strong>land.
The conversion of <strong>peat</strong> forests <strong>in</strong>to agricultural areas requires the<br />
construction of dra<strong>in</strong>age canals to facilitate root growth. The dra<strong>in</strong>age<br />
depth should be carefully regulated and managed to m<strong>in</strong>imize CO 2<br />
emission.<br />
Photo: Maswar
Background<br />
Soil is one of the three <strong>carbon</strong> pools on land. Other pools <strong>in</strong>clude biomass<br />
and necromass (IPCC 2006). Carbon <strong>stock</strong>s <strong>in</strong> natural forestland around the<br />
world have been estimated to total about 1146 gigatonne (Gt). The world’s<br />
<strong>peat</strong>lands are thought to conta<strong>in</strong> 180 to 455 Gt C on only a fraction of the<br />
total land area. The <strong>carbon</strong> <strong>stock</strong>s <strong>in</strong> natural forests <strong>in</strong> the tropical parts of<br />
Asia are larger than <strong>in</strong> sub-tropical regions, with an average range of 41–54<br />
Gt C aboveground and about 43 Gt <strong>in</strong> the soil or an average range of 132–<br />
174 t/ha <strong>in</strong> plant biomass and 139 t/ha <strong>in</strong> the soil (Dixon et al. 1994).<br />
Indonesia and several other countries <strong>in</strong> tropical regions, particularly<br />
Malaysia, Papua New Gu<strong>in</strong>ea and Brunei Darussalam, as well as hav<strong>in</strong>g<br />
m<strong>in</strong>eral <strong>soils</strong> also have <strong>peat</strong> <strong>soils</strong> (Histosols). Peat <strong>soils</strong> store much more<br />
<strong>carbon</strong> per unit area than m<strong>in</strong>eral <strong>soils</strong>. The amount could be more than ten<br />
times the <strong>carbon</strong> stored <strong>in</strong> upland (m<strong>in</strong>eral) <strong>soils</strong>, depend<strong>in</strong>g on the <strong>peat</strong><br />
thickness.<br />
Peatlands store <strong>carbon</strong> <strong>in</strong> plant biomass and necromass (above the surface<br />
and <strong>in</strong> the soil). In the soil, the <strong>carbon</strong> is stored <strong>in</strong> <strong>peat</strong> layers and <strong>in</strong> the<br />
elevated <strong>carbon</strong> content of the m<strong>in</strong>eral soil layer below the <strong>peat</strong> layer<br />
(substratum). Of the various <strong>carbon</strong> stores, the largest <strong>stock</strong> <strong>in</strong> <strong>peat</strong>land is<br />
<strong>in</strong> the <strong>peat</strong> soil itself, followed by the plant biomass. In uplands, the <strong>carbon</strong><br />
stored <strong>in</strong> plant biomass can exceed the <strong>carbon</strong> stored <strong>in</strong> the soil, depend<strong>in</strong>g<br />
on the type and density of crops cover<strong>in</strong>g the land (Hairiah and Rahayu<br />
2010).<br />
The concentration of <strong>carbon</strong> <strong>in</strong> <strong>peat</strong> <strong>soils</strong> ranges 30–70 kg/m 3 (or 30–70 g/<br />
dm 3 ), which is equivalent to 30–700 t/ha/m of <strong>peat</strong> depth. Thus, if a <strong>peat</strong><br />
soil has a thickness of 10 m, then the <strong>carbon</strong> <strong>stock</strong> <strong>in</strong> it is likely to be around<br />
3000–7000 t/ha (Agus and Subiksa 2008). In upland conditions, <strong>carbon</strong> <strong>stock</strong><br />
<strong>in</strong> the 0–100 cm soil layer ranged 20–300 t/ha (Shofiyati et al. 2010) but at<br />
a depth of more than 100 cm the amount of <strong>carbon</strong> stored is so low that it<br />
1
2<br />
Agus et al. (2011)<br />
usually can be ignored. Peat thickness varied from 0.5 m to deeper than 15<br />
m but the commonly found thickness was 2–8 m.<br />
Formation of <strong>peat</strong>land often starts <strong>in</strong> a bas<strong>in</strong> or shallow lake that gradually<br />
fills with organic material from dead plants. On further expansion the<br />
<strong>peat</strong>land may form a ‘<strong>peat</strong> dome’. The edges of the dome tend to be th<strong>in</strong>ner<br />
with less <strong>carbon</strong> <strong>stock</strong> whereas the central parts tend to be thicker and<br />
conta<strong>in</strong> more <strong>carbon</strong> <strong>stock</strong> (Figure 1). However, this situation does not<br />
apply to all areas of <strong>peat</strong>. Often the relief of the bottom of the <strong>peat</strong> is not<br />
flat, but bumpy. Furthermore, not all landscapes of <strong>peat</strong> form a dome.<br />
Occasionally, <strong>peat</strong> formation ceases before a dome is formed, for example,<br />
ow<strong>in</strong>g to the <strong>in</strong>fluence of dra<strong>in</strong>age and land clear<strong>in</strong>g. Other <strong>peat</strong> areas<br />
develop <strong>in</strong> former river beds and the subsoil may still have traces of the<br />
meander<strong>in</strong>g river, with a correspond<strong>in</strong>gly high variability of <strong>peat</strong> depth,<br />
even though the surface appears to be even.<br />
At the micro-spatial level, soil <strong>carbon</strong> content <strong>in</strong> the <strong>peat</strong> varies both<br />
vertically and horizontally. L<strong>in</strong>ked to the process of <strong>peat</strong> formation there<br />
may be voids with very low bulk density that become covered. But next<br />
to such a void there may be dead trees that have not completely decayed<br />
and have high <strong>carbon</strong> density. This variation is a source of uncerta<strong>in</strong>ty<br />
<strong>in</strong> measur<strong>in</strong>g <strong>peat</strong> <strong>carbon</strong> <strong>stock</strong> and a challenge. For example, if we are<br />
attempt<strong>in</strong>g to take samples us<strong>in</strong>g an auger and encounter dead wood we<br />
must abandon the place for one nearby, which may <strong>in</strong>troduce a bias <strong>in</strong> the<br />
results.<br />
1.1. Difference between <strong>peat</strong> and m<strong>in</strong>eral <strong>soils</strong><br />
Peat <strong>soils</strong> differ from m<strong>in</strong>eral <strong>soils</strong> <strong>in</strong> C org content, structure, bulk density,<br />
distribution of <strong>carbon</strong> <strong>in</strong> the soil profile and the ease of burn<strong>in</strong>g and oxidation<br />
(Table 1). Therefore, the tools used for soil sampl<strong>in</strong>g and the soil depths that<br />
are sampled are also different between the two soil types.
Practical guidel<strong>in</strong>es <strong>Measur<strong>in</strong>g</strong> <strong>carbon</strong> <strong>stock</strong> <strong>in</strong> <strong>peat</strong> <strong>soils</strong><br />
Figure 1. Schematic process of the formation and development of <strong>peat</strong> <strong>in</strong> a<br />
wetland bas<strong>in</strong> landscape<br />
a) Encroachment of shallow lake by wetland vegetation; b) Topogenic <strong>peat</strong><br />
formation; and c) Formation of ombrogenic <strong>peat</strong> dome above topogenic <strong>peat</strong>.<br />
Source: Noor 2001 from van de Meene 1984<br />
3
4<br />
Agus et al. (2011)<br />
Table 1. Some differences <strong>in</strong> the characteristics of <strong>peat</strong> and upland <strong>soils</strong><br />
Characteristics Peat soil M<strong>in</strong>eral soil<br />
1. C org content Ranges 18–60% Ranges 0.5–6% on most<br />
upland <strong>soils</strong>; around 10% on<br />
recent volcanic Andisols; and<br />
8–20% on submerged wetland<br />
<strong>soils</strong><br />
2. Structure Structureless and does not<br />
form clods<br />
3. Bulk density (BD) Ranges 0.03–0.3 g/cm 3 and<br />
under extreme conditions can<br />
be between 0.4<br />
g/cm 3 .<br />
4. Carbon distribution <strong>in</strong><br />
the profile<br />
High <strong>carbon</strong> content,<br />
homogeneously distributed<br />
from soil surface to the<br />
m<strong>in</strong>eral soil <strong>in</strong>terface at <strong>peat</strong><br />
bottom<br />
5. Ease of burn<strong>in</strong>g Easily burned when dry; can<br />
be used as fuel<br />
5. Type of soil analysis for<br />
determ<strong>in</strong><strong>in</strong>g <strong>carbon</strong><br />
<strong>stock</strong><br />
7. Devise used for<br />
sampl<strong>in</strong>g for BD<br />
analysis<br />
Carbon content and BD by<br />
layer from the soil surface to<br />
the bottom of the <strong>peat</strong><br />
Peat auger. For BD, the<br />
unsaturated surface <strong>peat</strong><br />
layer can be retrieved us<strong>in</strong>g<br />
sample r<strong>in</strong>gs. Soil blocks can<br />
be used to assess bias <strong>in</strong> the<br />
use of augers for bulk density<br />
estimates<br />
Depend<strong>in</strong>g on texture and<br />
degree of compaction, ranges<br />
from loose and aggregated to<br />
massive<br />
Ranges 0.6–1.6 g/cm 3 , with<br />
values below 1 g/cm 3 for<br />
undisturbed forest <strong>soils</strong><br />
Mostly concentrated <strong>in</strong> the<br />
0–30 cm layer<br />
Not easily burned<br />
Carbon content and bulk<br />
density by layers to a depth of<br />
30–100 cm<br />
Sample r<strong>in</strong>gs or small soil<br />
blocks<br />
1.2. Carbon emissions from Indonesian <strong>peat</strong>lands<br />
Under natural forest conditions, <strong>peat</strong>lands behave as <strong>carbon</strong> s<strong>in</strong>ks. Natural<br />
<strong>peat</strong> forests, which are not affected by dra<strong>in</strong>age (and prolonged droughts),<br />
grow slowly at a rate of 0–3 mm/year because of accumulation of dead tree<br />
trunks or branches on top of the soil and decompose slowly. But if the forest
Practical guidel<strong>in</strong>es <strong>Measur<strong>in</strong>g</strong> <strong>carbon</strong> <strong>stock</strong> <strong>in</strong> <strong>peat</strong> <strong>soils</strong><br />
is cleared and dra<strong>in</strong>ed, the <strong>peat</strong>land changes from a s<strong>in</strong>k to a CO 2 source.<br />
There are several factors that can alter the function of <strong>peat</strong>land from a s<strong>in</strong>k<br />
<strong>in</strong>to a CO 2 source.<br />
1. Land clear<strong>in</strong>g that <strong>in</strong>creases the amount of sunlight onto the <strong>peat</strong> surface<br />
so that soil temperature and the activity of decompos<strong>in</strong>g microorganisms<br />
<strong>in</strong>crease. Fell<strong>in</strong>g of trees also <strong>in</strong>creases the availability of fresh organic<br />
matter that easily decomposes <strong>in</strong>to CO under aerobic, and CH under<br />
2 4<br />
anaerobic, conditions. Thus, <strong>in</strong> addition to emissions from tree biomass,<br />
logg<strong>in</strong>g also accelerates decomposition of organic matter.<br />
2. Dra<strong>in</strong>age that decreases the <strong>peat</strong> watertable on the site and surround<strong>in</strong>g<br />
areas that are under agricultural and forest covers. Dra<strong>in</strong>age changes the<br />
soil conditions from anaerobic (water saturated) to aerobic (unsaturated)<br />
and <strong>in</strong>creases CO emissions. Recession of the watertable can also occur<br />
2<br />
naturally, such as under the <strong>in</strong>fluence of drought, but a high watertable<br />
dom<strong>in</strong>ates humid areas where <strong>peat</strong> is formed.<br />
3. Peat fires. Fires <strong>in</strong>crease CO emissions ow<strong>in</strong>g to burn<strong>in</strong>g or oxidation<br />
2<br />
of one or a comb<strong>in</strong>ation of plant biomass, necromass and <strong>peat</strong> layers.<br />
Fires often occur dur<strong>in</strong>g land-use change from forest to agriculture or<br />
other land uses. Fires can also occur dur<strong>in</strong>g long drought periods. Under<br />
traditional farm<strong>in</strong>g practices, burn<strong>in</strong>g can be done <strong>in</strong>tentionally to reduce<br />
soil acidity and improve soil fertility. But, on the other hand, this practice<br />
<strong>in</strong>creases the contribution of <strong>peat</strong> to CO emissions.<br />
2<br />
4. The addition of fertilizers and ameliorants. The addition of fertilizers, such<br />
as nitrogen fertilizers, lowers the ratio of soil C/N and encourages the<br />
decomposition of organic matter by microorganisms, followed by the<br />
release of CO . Nitrogen fertilizer can also contribute to N O emission.<br />
2 2<br />
Fertiliz<strong>in</strong>g with manure or the addition of ameliorants that <strong>in</strong>crease the<br />
pH of <strong>peat</strong> can also accelerate <strong>peat</strong> decomposition.<br />
Indonesia has about 15 million ha of <strong>peat</strong>land with belowground <strong>carbon</strong><br />
<strong>stock</strong> of about 20-30 Gt. This is a revision of earlier <strong>peat</strong>land map by<br />
Wahyunto et al. 2004, 2005, 2006 us<strong>in</strong>g soil survey data. However, with<br />
<strong>in</strong>creas<strong>in</strong>g population and the demands of economic development, the<br />
exploitation of <strong>peat</strong> for various development purposes has also <strong>in</strong>creased<br />
so that the amount of CO 2 emissions from <strong>peat</strong>lands is <strong>in</strong>creas<strong>in</strong>g. It has<br />
been estimated that CO 2 emissions from <strong>peat</strong> and related forest land uses<br />
5
6<br />
Agus et al. (2011)<br />
and land-use changes is more than 50% of the total emissions of Indonesia<br />
(Hooijer et al. 2010, Boer et al. 2010).<br />
The Reduc<strong>in</strong>g Emissions from Deforestation and Forest Degradation (REDD)<br />
schemes currently <strong>in</strong> test<strong>in</strong>g phases require that the <strong>carbon</strong> balance is<br />
measureable, reportable and verifiable accord<strong>in</strong>g to <strong>in</strong>ternational standards.<br />
This booklet provides a step-by-step guide to measurement of <strong>carbon</strong> <strong>stock</strong>s<br />
<strong>in</strong> <strong>peat</strong> <strong>soils</strong>, <strong>in</strong>clud<strong>in</strong>g examples of <strong>carbon</strong> <strong>stock</strong>s and emissions calculations.<br />
The last chapter describes the relationship between <strong>carbon</strong> <strong>stock</strong>s and CO 2<br />
emissions from <strong>peat</strong> <strong>soils</strong>.<br />
The measurement of <strong>carbon</strong> <strong>stock</strong>s <strong>in</strong> <strong>peat</strong>land as described <strong>in</strong> this booklet<br />
is supplementary to the <strong>carbon</strong> <strong>stock</strong> measurement technique accord<strong>in</strong>g<br />
to the Rapid Carbon Stock Appraisal method developed by the World<br />
Agroforestry Centre Southeast Asia Regional Program (Hairiah and Rahayu<br />
2007), with a focus on measurement at field level and its extrapolation to<br />
landscape level (Hairiah et al. 2011a, b).
The exposure of woody roots aboveground is direct proof of the subsidence<br />
of <strong>peat</strong> caused by <strong>peat</strong> decomposition and compaction (consolidation)<br />
under dra<strong>in</strong>age conditions.<br />
Photo: Fahmudd<strong>in</strong> Agus<br />
7
Carbon-<strong>stock</strong>-related<br />
<strong>peat</strong> properties<br />
The ma<strong>in</strong> data needed to calculate <strong>carbon</strong> <strong>stock</strong>s <strong>in</strong> a <strong>peat</strong> landscape are:<br />
Bulk Density (BD), [g/cm3 or kg/dm3 or t/m3 ]<br />
Organic <strong>carbon</strong> content (C ), [% by weight or g/g or kg/kg]<br />
org<br />
Peat thickness. If the samples consist of many layers, the thickness of each<br />
layer with its respective BD and C , needs to be measured [cm or m]<br />
org<br />
Area of land <strong>in</strong> which the <strong>carbon</strong> <strong>stock</strong> is to be estimated [ha or km2 ]<br />
In addition to the above data, additional <strong>in</strong>formation on <strong>peat</strong> maturity or<br />
fibre content will be helpful.<br />
2.1. Bulk density<br />
Bulk density (BD) is the mass of soil solid phase (M s ) divided by the total<br />
soil volume (V t ). The total volume of soil is the sum of the volume of soil<br />
solid phase and the volume of soil pores (air filled and water filled) <strong>in</strong> an<br />
undisturbed (as <strong>in</strong> the field) condition. The BD determ<strong>in</strong>ation of <strong>peat</strong> <strong>soils</strong> <strong>in</strong><br />
pr<strong>in</strong>ciple is the same as that of m<strong>in</strong>eral <strong>soils</strong> (see Chapter 2.4.2. <strong>in</strong> Hairiah et<br />
al. 2011a), but the sampl<strong>in</strong>g and handl<strong>in</strong>g procedures are different because<br />
of the different properties of the two types of <strong>soils</strong>.<br />
M s is determ<strong>in</strong>ed from oven dry weight at 105 o C for 48 hours or more,<br />
until constant weight is achieved (no reduction <strong>in</strong> sample weight when<br />
the samples are dried for a longer time). Often the samples taken from the<br />
field are very wet and when a sub-sample is taken for dry<strong>in</strong>g it tends to<br />
cause substantial errors <strong>in</strong> the BD measurement. For that reason, usually the<br />
whole sample taken with a <strong>peat</strong> auger is quantitatively transferred <strong>in</strong>to an<br />
alum<strong>in</strong>ium can for dry<strong>in</strong>g at 105 o C for 48–96 hours to reach the constant<br />
weight.<br />
9
10<br />
Agus et al. (2011)<br />
BD values of <strong>peat</strong> <strong>soils</strong> generally range between 0.03 and 0.3 g/cm3 . However,<br />
with<strong>in</strong> a <strong>peat</strong> profile, sometimes pockets may exist which are nearly empty of<br />
<strong>peat</strong> and filled with water, with a BD of < 0.01 g/cm3 . This condition is often<br />
found <strong>in</strong> natural <strong>peat</strong> forests. By contrast, the BD of a <strong>peat</strong> surface layer under<br />
several years of agricultural use may <strong>in</strong>crease to as high as 0.3 to 0.4 g/cm3 .<br />
BD is determ<strong>in</strong>ed <strong>in</strong> the laboratory by a gravimetric method of weigh<strong>in</strong>g<br />
the oven dry weight of a known volume of <strong>peat</strong>. The samples used for the<br />
analysis may be samples taken us<strong>in</strong>g a <strong>peat</strong> auger (Ejkelkamp model), r<strong>in</strong>g<br />
sample or cubical sample as long as the sample volume can be determ<strong>in</strong>ed<br />
easily.<br />
Accord<strong>in</strong>g to Maswar (2011), division by a correction factor of 1.136 is<br />
needed to correct for compaction that occurs at the sampl<strong>in</strong>g stage. This<br />
correction factor was established by comparison of auger samples and large<br />
blocks of <strong>peat</strong> obta<strong>in</strong>ed from soil pits and is considered to represent the real<br />
condition <strong>in</strong> the field.<br />
2.2. Soil <strong>carbon</strong> content<br />
The organic <strong>carbon</strong> content of soil can be determ<strong>in</strong>ed by one of several<br />
methods, namely, dry combustion (loss on ignition (LOI)), Walkley and Black<br />
procedure (1934) or CN auto-analyzer. For <strong>peat</strong> soil, the CN autoanalyzer<br />
or LOI techniques are more preferable than the Walkley and Black. The LOI<br />
method is relatively simple but nevertheless gives a fairly accurate figure for<br />
determ<strong>in</strong><strong>in</strong>g the ash content (<strong>in</strong>organic material) and <strong>peat</strong> organic matter<br />
because with this method the soil organic matter can be burned completely.<br />
However, LOI technique semi-quantitatively estimate <strong>peat</strong> <strong>carbon</strong> content<br />
by multiply<strong>in</strong>g <strong>peat</strong> organic matter content with a constant of 0.58. On the<br />
other hand, under the Walkley and Black technique, there is a possibility<br />
of <strong>in</strong>complete digestion of organic matter, lead<strong>in</strong>g to underestimat<strong>in</strong>g the<br />
<strong>carbon</strong> content value. The CN autoanalyzer is a direct method (measur<strong>in</strong>g<br />
<strong>carbon</strong> or CO 2 ), however, the amount of sample analyzed is very small (a<br />
few milligram), such that ensur<strong>in</strong>g the representativeness of the sample is<br />
critical and duplicate measurements are needed. In this booklet, we limit<br />
explanation to the LOI technique only , although for the quantitative analysis<br />
the CN auto-analyzer technique is preferable.
2.3. Peat maturity<br />
Practical guidel<strong>in</strong>es <strong>Measur<strong>in</strong>g</strong> <strong>carbon</strong> <strong>stock</strong> <strong>in</strong> <strong>peat</strong> <strong>soils</strong><br />
Peat maturity observation is useful for assess<strong>in</strong>g <strong>peat</strong> fertility and <strong>carbon</strong><br />
content. The more mature the <strong>peat</strong>, the generally more fertile, although<br />
many other factors also determ<strong>in</strong>e fertility, <strong>in</strong>clud<strong>in</strong>g clay or ash mixture. The<br />
more mature <strong>peat</strong>s also tend to have a higher <strong>carbon</strong> content per volume.<br />
Observation of <strong>peat</strong> maturity can be done <strong>in</strong> the field or <strong>in</strong> the laboratory<br />
based on fibre content, which will be discussed <strong>in</strong> the next section.<br />
11
Peat <strong>soils</strong> differ <strong>in</strong> properties from m<strong>in</strong>eral <strong>soils</strong> and require different<br />
methods and tools for sampl<strong>in</strong>g.<br />
Photo: Fahmudd<strong>in</strong> Agus
Measurement of <strong>carbon</strong> <strong>stock</strong>s <strong>in</strong> a landscape or <strong>peat</strong> dome consists of three<br />
stages.<br />
1. Determ<strong>in</strong>ation of sampl<strong>in</strong>g po<strong>in</strong>ts<br />
2. Peat soil sampl<strong>in</strong>g<br />
3. Analysis of samples and calculation of <strong>carbon</strong> <strong>stock</strong>s<br />
3.1. Determ<strong>in</strong>ation of sampl<strong>in</strong>g po<strong>in</strong>ts<br />
Carbon <strong>stock</strong><br />
determ<strong>in</strong>ation of <strong>peat</strong> soil<br />
For mapp<strong>in</strong>g the <strong>carbon</strong> <strong>stock</strong>s <strong>in</strong> a landscape or dome, the po<strong>in</strong>ts of<br />
sampl<strong>in</strong>g may be accord<strong>in</strong>g to ‘grid’ or from multiple transects across the<br />
<strong>peat</strong> dome, for example, north–south, east–west, northeast–southwest and<br />
northwest–southeast so that a range of <strong>peat</strong> thicknesses will be represented.<br />
Usually, the <strong>peat</strong> tends to be thicker closer to the centre of a dome. However,<br />
the surface of the underly<strong>in</strong>g m<strong>in</strong>eral soil at the bottom of the <strong>peat</strong> is<br />
usually irregular, tend<strong>in</strong>g to be bumpy. The more irregular the surface of the<br />
underly<strong>in</strong>g m<strong>in</strong>eral substratum the higher the variation of thickness and<br />
<strong>carbon</strong> <strong>stock</strong>s. This requires a more <strong>in</strong>tensive sampl<strong>in</strong>g.<br />
Figure 2 shows the two approaches to determ<strong>in</strong>e sampl<strong>in</strong>g po<strong>in</strong>ts.<br />
Sampl<strong>in</strong>g us<strong>in</strong>g the grid system requires more observation po<strong>in</strong>ts. The<br />
number of observation po<strong>in</strong>ts and the total area represented by each grid is<br />
determ<strong>in</strong>ed by the scale of the map or the level of accuracy required <strong>in</strong> the<br />
measurement. For the mapp<strong>in</strong>g scales of 1:10 000, 1:25 000, 1:50 000 and<br />
1:250 000 an ideal sampl<strong>in</strong>g <strong>in</strong>tensity is one sampl<strong>in</strong>g po<strong>in</strong>t for 1 ha, 6.25 ha,<br />
25 ha and 625 ha, respectively. However, this approach will require a very<br />
high number of soil samples. This method is less popular nowadays, even<br />
15
16<br />
Agus et al. (2011)<br />
for mapp<strong>in</strong>g m<strong>in</strong>eral <strong>soils</strong>, unless the area to be mapped is relatively small. A<br />
more frequently used approach is the ‘terra<strong>in</strong>’ technique, which is based on<br />
physiographic conditions, group<strong>in</strong>g land of similar properties (Aguilar et al.<br />
2005). For <strong>peat</strong>land, we encourage the use of the transect approach (Figure<br />
2B) so that the number of samples can be reduced without compromis<strong>in</strong>g<br />
quality.<br />
Distance between observation po<strong>in</strong>ts <strong>in</strong> a transect is determ<strong>in</strong>ed by<br />
the scale of the map and the variation of <strong>peat</strong> thickness and properties.<br />
For large areas, additional transects (observation po<strong>in</strong>ts) may be added<br />
between exist<strong>in</strong>g transects. When detailed observation is required, then the<br />
distance between one po<strong>in</strong>t to another <strong>in</strong> the grid or with<strong>in</strong> each should<br />
be approximately 500 m. Our experience <strong>in</strong> several locations <strong>in</strong>dicates that<br />
with<strong>in</strong> 50 m distance the variation <strong>in</strong> <strong>peat</strong> thickness can range 10–50 cm,<br />
<strong>in</strong>dicat<strong>in</strong>g that a more <strong>in</strong>tensive sampl<strong>in</strong>g may be necessary.<br />
The coord<strong>in</strong>ates of each po<strong>in</strong>t of measurement must be recorded by us<strong>in</strong>g<br />
a global position<strong>in</strong>g system (GPS). Based on the pair of sampl<strong>in</strong>g po<strong>in</strong>ts<br />
coord<strong>in</strong>ates and the <strong>peat</strong> thickness, we can generate a contour map of <strong>peat</strong><br />
thickness by us<strong>in</strong>g a geographic <strong>in</strong>formation system (GIS) with a schematic<br />
model, as presented <strong>in</strong> Figure 3. For the assessment of <strong>carbon</strong> <strong>stock</strong>s <strong>in</strong> a<br />
landscape or <strong>peat</strong> dome, the <strong>peat</strong> BD and organic matter content data will<br />
be required <strong>in</strong> addition to the <strong>peat</strong> thickness contour map.<br />
At all selected observation po<strong>in</strong>ts, the observation of <strong>carbon</strong> <strong>stock</strong>s<br />
aboveground (plant biomass and necromass) should also be determ<strong>in</strong>ed<br />
accord<strong>in</strong>g to the procedure of the Rapid Carbon Stock Appraisal (RaCSA)<br />
method, which is described <strong>in</strong> Hairiah et al. (2011a). To generate the pairs<br />
of data of plant biomass, necromass and <strong>peat</strong> (belowground) <strong>carbon</strong>, <strong>peat</strong><br />
samples can be taken <strong>in</strong> the middle of the small plots (5 x 40 m) or large plots<br />
(20 x 100 m) when there are large trees with diameter greater than 30 cm,<br />
depend<strong>in</strong>g on the plot used <strong>in</strong> the measurement of biomass and necromass<br />
(Figure 4). Should <strong>in</strong>tensive <strong>carbon</strong> <strong>stock</strong> observation be required, then the<br />
<strong>peat</strong> soil sampl<strong>in</strong>g may be distributed with<strong>in</strong> the RaCSA plots.
Practical guidel<strong>in</strong>es <strong>Measur<strong>in</strong>g</strong> <strong>carbon</strong> <strong>stock</strong> <strong>in</strong> <strong>peat</strong> <strong>soils</strong><br />
Figure 2. Schematic diagram of sampl<strong>in</strong>g po<strong>in</strong>ts with<strong>in</strong> a <strong>peat</strong> dome us<strong>in</strong>g the grid<br />
or transects methods<br />
(A) Grid or regular sampl<strong>in</strong>g po<strong>in</strong>ts; (B) transects north–south, east–west,<br />
northwest–southeast, northeast–southwest. = Po<strong>in</strong>t of observation determ<strong>in</strong>ed by<br />
GPS<br />
17
18<br />
Agus et al. (2011)<br />
1-2 m<br />
2-3 m<br />
2-3 m 3-4 m<br />
0-2 m<br />
4-5 m<br />
3-4 m<br />
4-5 m<br />
3-4 m<br />
2-3 m<br />
1-2 m<br />
Figure 3. Peat thickness maps<br />
Sample maps based on west–east transect: (top) <strong>peat</strong> thickness contours; (bottom)<br />
cross-sectional thickness<br />
Figure 4. Observation plots of biomass and necromass (Hairiah et al. 2011a) and<br />
<strong>peat</strong> sampl<strong>in</strong>g po<strong>in</strong>t placement
3.2. Peat soil sampl<strong>in</strong>g<br />
3.2.1. The k<strong>in</strong>ds of <strong>peat</strong> samples<br />
Practical guidel<strong>in</strong>es <strong>Measur<strong>in</strong>g</strong> <strong>carbon</strong> <strong>stock</strong> <strong>in</strong> <strong>peat</strong> <strong>soils</strong><br />
In general, soil samples taken <strong>in</strong> the field can be divided <strong>in</strong>to two k<strong>in</strong>ds,<br />
that is, <strong>in</strong>tact (undisturbed) and disturbed soil samples.<br />
Undisturbed soil samples are those which structure is similar to the actual<br />
structure of the <strong>peat</strong> <strong>in</strong> the field. Disturbed soil samples are those which<br />
structure is different from the orig<strong>in</strong>al structure because of disturbance<br />
dur<strong>in</strong>g sampl<strong>in</strong>g, handl<strong>in</strong>g and transportation. (Nearly) undisturbed soil<br />
samples can be obta<strong>in</strong>ed us<strong>in</strong>g a <strong>peat</strong> auger or soil core (hollow tube,<br />
which is also known as ‘soil r<strong>in</strong>gs’). Disturbed soil samples can be taken<br />
with a regular soil auger, hoe, shovel or machete.<br />
For <strong>peat</strong> sampl<strong>in</strong>g, the use of <strong>peat</strong> auger is recommended (Figure 5, left)<br />
because it can be used to sample almost undisturbed soil from the top to<br />
bottom layers. A <strong>peat</strong> auger can be used even under <strong>in</strong>undated conditions.<br />
Samples taken by a <strong>peat</strong> auger can be used for the analysis of bulk density,<br />
water content (% volume) and chemical properties <strong>in</strong>clud<strong>in</strong>g the <strong>carbon</strong><br />
content.<br />
Soil cores can be used for sampl<strong>in</strong>g the mature surface layer of <strong>peat</strong> under<br />
unsaturated condition. Soil cores cannot be used for fibric (immature) <strong>peat</strong><br />
or when the <strong>peat</strong> is saturated. As with the use of soil cores, cube-shaped<br />
samples can only be taken for the surface layer of mature (sapric maturity)<br />
unsaturated <strong>peat</strong>.<br />
19
20<br />
Agus et al. (2011)<br />
3.2.2. Peat sampl<strong>in</strong>g us<strong>in</strong>g <strong>peat</strong> auger<br />
Box 1. Tools and materials<br />
a) Peat auger (see pic below), consist<strong>in</strong>g of <strong>peat</strong> sampler, extension rods<br />
and one handle<br />
b) Number 23 spanner or wrench (2 pcs) to <strong>in</strong>stall and disassemble the<br />
extension rods<br />
c) Metre stick or tape (2 m long) for measur<strong>in</strong>g the thickness of the <strong>peat</strong><br />
layers, the depth of charcoal or clay layers (if any) and the watertable.<br />
d) Fifty-metre-long metre tape for measur<strong>in</strong>g the distance between<br />
observation po<strong>in</strong>ts on a transect<br />
e) Knife or plastic spatula<br />
f) Brush and cloths for clean<strong>in</strong>g the auger<br />
g) Bucket<br />
h) Plastic bags<br />
i) Label<strong>in</strong>g cards<br />
j) Markers<br />
k) GPS device<br />
Edelman auger<br />
Extension rods<br />
Handle<br />
Gouge and f<strong>in</strong>
Box 2. The ma<strong>in</strong> parts of a <strong>peat</strong> auger (Eijkelkamp model)<br />
Practical guidel<strong>in</strong>es <strong>Measur<strong>in</strong>g</strong> <strong>carbon</strong> <strong>stock</strong> <strong>in</strong> <strong>peat</strong> <strong>soils</strong><br />
The ma<strong>in</strong> section (sampler) of a <strong>peat</strong> auger consists of a hooked blade (f<strong>in</strong>)<br />
and a half-cyl<strong>in</strong>drical tube (gouge) that has one sharp edge to cut the <strong>peat</strong>.<br />
The sampler can be easily connected to the extension rods and auger handle<br />
us<strong>in</strong>g two no. 23 spanners or wrenches.<br />
Figure 6. The <strong>peat</strong> auger<br />
The sta<strong>in</strong>less steel bottom part of the <strong>peat</strong> sampler has an auger body<br />
consist<strong>in</strong>g of a half-cyl<strong>in</strong>drical sampler conta<strong>in</strong><strong>in</strong>g a section or ‘gouge’ (1) with<br />
a large cone (2) at its bottom end. The gouge has one cutt<strong>in</strong>g edge and is<br />
sealed by a hooked blade or ‘f<strong>in</strong>’ (3) h<strong>in</strong>ged on the auger body. The blade’s top<br />
and bottom ends’ width are identical to the auger’s width but is wider <strong>in</strong> the<br />
middle. The protrud<strong>in</strong>g, rounded side has a cutt<strong>in</strong>g edge<br />
The large cone serves to push aside the soil when the sampler is <strong>in</strong>serted. At<br />
that stage, the blade seals off the gouge. When the auger is given a half turn<br />
(180°) to fill, the resistance will cause the blade to rema<strong>in</strong> <strong>in</strong> position. When<br />
the auger is hoisted, the other side of the blade seals off the gouge.<br />
21
22<br />
Agus et al. (2011)<br />
3.2.3. Procedure for <strong>peat</strong> sampl<strong>in</strong>g<br />
Figure 7. Us<strong>in</strong>g the <strong>peat</strong> auger on<br />
<strong>in</strong>undated <strong>peat</strong><br />
1) Attach the handle and the<br />
extension rods accord<strong>in</strong>g to the<br />
desired depth of sampl<strong>in</strong>g.<br />
2) Connect the ma<strong>in</strong> bottom part<br />
of the auger to the extension<br />
rods us<strong>in</strong>g two no. 23 spanners or<br />
wrenches to tighten the connection.<br />
3) Turn the f<strong>in</strong> to have the concave<br />
part fac<strong>in</strong>g the outside of the tube.<br />
4) Drive the auger vertically <strong>in</strong>to<br />
the <strong>peat</strong> without turn<strong>in</strong>g it until<br />
the desired depth is reached. The<br />
f<strong>in</strong> closes the gouge such that no<br />
sample enters the gouge at this<br />
stage. The cone at the bottom of the<br />
auger pushes the <strong>peat</strong> aside.<br />
5) If a hard layer is found, do not<br />
force the auger us<strong>in</strong>g a hammer as it<br />
will damage the auger.<br />
6) After the auger reaches the<br />
desired depth, turn it clockwise at<br />
least 180˚. While the gouge rotates, the f<strong>in</strong> stays at its position, the gouge<br />
is filled with <strong>peat</strong> and the f<strong>in</strong> closes so that no additional <strong>peat</strong> enters the<br />
gouge.<br />
7) Pull the auger slowly out and lay it on a pla<strong>in</strong> surface covered by a plastic<br />
sheet with the f<strong>in</strong> fac<strong>in</strong>g upward. Turn the f<strong>in</strong> until the samples appears<br />
on top of the concave surface (Figure 8).
Figure 8. Peat sample appear<strong>in</strong>g from the gouge on the f<strong>in</strong>’s surface<br />
Peat <strong>in</strong> the bottom picture is more mature than that <strong>in</strong> the top picture<br />
Practical guidel<strong>in</strong>es <strong>Measur<strong>in</strong>g</strong> <strong>carbon</strong> <strong>stock</strong> <strong>in</strong> <strong>peat</strong> <strong>soils</strong><br />
23
24<br />
Agus et al. (2011)<br />
8) Store the <strong>peat</strong> samples <strong>in</strong> accordance with their <strong>in</strong>tended uses. For<br />
example, for <strong>peat</strong> <strong>carbon</strong> dat<strong>in</strong>g, the samples can be stored <strong>in</strong> a PVC<br />
pipe cut <strong>in</strong> half and covered with alum<strong>in</strong>ium foil. For the determ<strong>in</strong>ation<br />
of water content (% volume) and BD, the <strong>peat</strong> and water from the auger<br />
must be quantitatively transferred <strong>in</strong>to plastic bags (Figure 9) so that<br />
no fluid is spilled and the volume does not change (from 500 cm 3 ).<br />
Sometimes the 50 cm-long samples need to be cut <strong>in</strong>to 2–3 parts if, for<br />
example, there are differences <strong>in</strong> maturity or if there is a layer of clay or<br />
ash at certa<strong>in</strong> depths. Each piece of 10 cm length has a volume of 100<br />
cm 3 .<br />
Figure 9. Peat samples<br />
Labelled and sealed <strong>in</strong> plastic bags, ready for transportation to the laboratory for<br />
analysis
Notes<br />
Practical guidel<strong>in</strong>es <strong>Measur<strong>in</strong>g</strong> <strong>carbon</strong> <strong>stock</strong> <strong>in</strong> <strong>peat</strong> <strong>soils</strong><br />
<br />
depth so that the error <strong>in</strong> depth determ<strong>in</strong>ation can be m<strong>in</strong>imized.<br />
<br />
needed. An auger set of n<strong>in</strong>e extension rods can be used to take samples to a depth<br />
of 10 m. Peat sampl<strong>in</strong>g to a depth of 400 cm is relatively easy to do but sampl<strong>in</strong>g at<br />
deeper depth will be more difficult.<br />
<br />
gouge may not be filled and the f<strong>in</strong> may not close properly. In such circumstances,<br />
the auger<strong>in</strong>g needs to be re<strong>peat</strong>ed at another po<strong>in</strong>t nearby otherwise the volume<br />
of sample will be < 500 cm3 .<br />
<br />
ord<strong>in</strong>ary soil auger (Edelman auger) to penetrate hard layers above the <strong>in</strong>tended<br />
<strong>peat</strong> sampl<strong>in</strong>g depth.<br />
<br />
that they were no longer suitable for bulk density determ<strong>in</strong>ation.<br />
Box 3. Ma<strong>in</strong>tenance of <strong>peat</strong> auger<br />
The auger must be kept clean. After use, wash the auger with<br />
fresh water.<br />
Use a brush to clean the threads at each end of the extension<br />
rods.<br />
Dry the auger us<strong>in</strong>g a dry cloth and let it completely dry under<br />
the sun.<br />
Keep the auger <strong>in</strong> its bag or box.<br />
25
26<br />
Agus et al. (2011)<br />
3.2.4. Undisturbed soil sampl<strong>in</strong>g us<strong>in</strong>g soil core<br />
The method of <strong>peat</strong> sampl<strong>in</strong>g us<strong>in</strong>g soil cores is the same as for m<strong>in</strong>eral <strong>soils</strong>.<br />
However, only mature and relatively dry <strong>peat</strong> can be sampled us<strong>in</strong>g a soil<br />
r<strong>in</strong>g. Stages of sampl<strong>in</strong>g us<strong>in</strong>g the r<strong>in</strong>gs are shown <strong>in</strong> Figure 11 (modified<br />
from Suganda et al. 2007).<br />
1. Clean the soil surface of litter and small plants.<br />
2. Dig a circle with a diameter of about 20 cm to a desired depth. For<br />
example, to 5 cm if the sample is to be taken from a depth of 5–10 cm.<br />
Trim the soil with a knife or a machete.<br />
3. Put a r<strong>in</strong>g on the ground vertically.<br />
4. Put a small block of wood on the r<strong>in</strong>g, press slowly until three-quarters of<br />
the r<strong>in</strong>g is <strong>in</strong>serted <strong>in</strong>to the soil.<br />
5. Put another r<strong>in</strong>g on top of the first one, and press until about 1 cm of the<br />
second r<strong>in</strong>g is <strong>in</strong>serted <strong>in</strong> the soil.<br />
6. Separate the upper r<strong>in</strong>g from the bottom r<strong>in</strong>g slowly.<br />
7. Dig the r<strong>in</strong>g us<strong>in</strong>g a shovel or a machete. In digg<strong>in</strong>g, the tip of the shovel<br />
should be deeper than the lower end of the r<strong>in</strong>g so that 1 or 2 cm of the<br />
soil beneath the r<strong>in</strong>g is lifted up.<br />
8. Slice excess soil on top of the r<strong>in</strong>g with caution and close the r<strong>in</strong>g us<strong>in</strong>g<br />
a plastic cap that attaches snugly to the r<strong>in</strong>g. Then slice the excess soil at<br />
the bottom of the r<strong>in</strong>g and close it with another cap.<br />
9. Attach a paper label to the cap of the r<strong>in</strong>g that gives the sample’s location,<br />
date of sampl<strong>in</strong>g and depth of sample.
Practical guidel<strong>in</strong>es <strong>Measur<strong>in</strong>g</strong> <strong>carbon</strong> <strong>stock</strong> <strong>in</strong> <strong>peat</strong> <strong>soils</strong><br />
Figure 10. Soil core (soil r<strong>in</strong>g) for undisturbed soil sampl<strong>in</strong>g<br />
Soil r<strong>in</strong>gs with and without caps. R<strong>in</strong>g diameters typically range 5–7.5 cm and<br />
heights 2.5–6 cm. R<strong>in</strong>gs of small diameter may cause more damage to soil samples.<br />
Figure 11. Stages of undisturbed soil sampl<strong>in</strong>g us<strong>in</strong>g soil core<br />
(From top left to bottom right)<br />
3.2.5. Soil sampl<strong>in</strong>g us<strong>in</strong>g hollow box of galvanized iron sheet<br />
Similar to sampl<strong>in</strong>g with a soil r<strong>in</strong>g, this method is only applicable for<br />
mature and dry <strong>peat</strong>. Alternatively, a <strong>peat</strong> cube can be created with a knife<br />
or machete (Figure 12) without the use of soil core or soil sampl<strong>in</strong>g box. The<br />
method of sampl<strong>in</strong>g with a metal box is similar to that us<strong>in</strong>g a soil r<strong>in</strong>g. The<br />
detail is described <strong>in</strong> Hairiah et al. (2011a).<br />
27
28<br />
Agus et al. (2011)<br />
Note:<br />
The ma<strong>in</strong> purpose of us<strong>in</strong>g a metal box or r<strong>in</strong>g for <strong>peat</strong> sampl<strong>in</strong>g is to take soil samples<br />
with known volumes under field conditions. For the BD or water content (% volume)<br />
measurements, each sample from the soil core can be quantitatively transferred <strong>in</strong>to a<br />
plastic bag so that the same r<strong>in</strong>g can be used to take more samples. But for analysis of<br />
soil water tension (pF), samples must be ma<strong>in</strong>ta<strong>in</strong>ed <strong>in</strong> the r<strong>in</strong>g so that the structure is<br />
not disturbed.<br />
Figure 12. Cubical and fluid <strong>peat</strong> samples<br />
Cubical (left) and fluid (right) samples taken with an Eldeman auger from depths<br />
below the watertable
Practical guidel<strong>in</strong>es <strong>Measur<strong>in</strong>g</strong> <strong>carbon</strong> <strong>stock</strong> <strong>in</strong> <strong>peat</strong> <strong>soils</strong><br />
3.3. Measurement of bulk density and organic matter<br />
content<br />
For the determ<strong>in</strong>ation of <strong>carbon</strong> <strong>stock</strong>s <strong>in</strong> <strong>peat</strong> soil the data of BD, C org , the<br />
thickness of the <strong>peat</strong> and area of the landscape or dome are required.<br />
3.3.1. Bulk density<br />
Peat BD is determ<strong>in</strong>ed <strong>in</strong> the laboratory by a gravimetric method. Samples<br />
to be used for BD analysis can be taken us<strong>in</strong>g a <strong>peat</strong> auger (for example,<br />
Ejkelkamp model), a soil core or hollow metal box, each with associated<br />
sample volume. The method of soil sampl<strong>in</strong>g is as described above.<br />
Determ<strong>in</strong>ation of BD<br />
1. Transfer each sample obta<strong>in</strong>ed with <strong>peat</strong> auger or r<strong>in</strong>g quantitatively<br />
<strong>in</strong>to an alum<strong>in</strong>ium cup. If us<strong>in</strong>g a soil core, each sample can either be<br />
removed from the core or the core with sample <strong>in</strong>side can be placed <strong>in</strong><br />
an alum<strong>in</strong>ium can for oven dry<strong>in</strong>g.<br />
2. If the data of soil moisture content is required, then weigh the wet soil<br />
<strong>in</strong>side the cup. The mass of wet soil (M ) is M + M , where Ms is the mass<br />
t w s<br />
of the dry soil and Mw is the mass of water conta<strong>in</strong>ed <strong>in</strong> the soil matrix<br />
(Figure 13).<br />
3. Dry the soil samples <strong>in</strong> an oven at 105 oC for 2 x 24 hours or until the<br />
constant weight is achieved. If the sample is very wet, it may take 4–5 x<br />
24 hours to reach the constant weight. The constant weight is obta<strong>in</strong>ed<br />
when the sample weight does not decrease after subsequent dry<strong>in</strong>g.<br />
For example, if the weight of sample that is dried for 2 x 24 hours is still<br />
higher than the sample that was dried for 3 x 24 hours, then the dry<strong>in</strong>g<br />
should be cont<strong>in</strong>ued.<br />
4. Put the dry soil with<strong>in</strong> the alum<strong>in</strong>ium can <strong>in</strong> a desiccator for about 10<br />
m<strong>in</strong>utes.<br />
5. Weigh the dry weight of the soil (M s ) plus the can weight (M c ).<br />
6. Save the soil samples for analysis of organic materials with the LOI<br />
method. If the <strong>carbon</strong> content is to be determ<strong>in</strong>ed by CN analyzer or<br />
Walkley and Black method, the oven-dried soil samples cannot be used,<br />
<strong>in</strong>stead air dried samples must be used.<br />
29
30<br />
Agus et al. (2011)<br />
Determ<strong>in</strong>e the volume of soil samples, V t . If soil samples are taken with the<br />
soil r<strong>in</strong>g, then V t = πr 2 t, where r is the <strong>in</strong>side radius and t is the height of<br />
the r<strong>in</strong>g. If the samples are from an Eijkelkamp <strong>peat</strong> auger with a thickness<br />
(sample length) of 50 cm, then V t = 0.5 dm 3 = 500 cm 3 . If a 20 cm-long <strong>peat</strong><br />
sample was taken from the <strong>peat</strong> auger, then V t = 200 cm 3 .<br />
Calculate BD as<br />
DB<br />
V t = V s + V w + V a<br />
Figure 13. Illustration of <strong>peat</strong> soil volume<br />
Peat soil volume consists of the volume of soil solids (V s ), liquid (V w ) and gas (V a ) and<br />
the mass of soil solids (M s ), water (M w ) and air (M a ). The mass of soil solids, M s , is the<br />
sum of the mass of organic matter, M om , and ash M ash<br />
[1]
Practical guidel<strong>in</strong>es <strong>Measur<strong>in</strong>g</strong> <strong>carbon</strong> <strong>stock</strong> <strong>in</strong> <strong>peat</strong> <strong>soils</strong><br />
If the unit weight is gram (g) and unit volume is cm3 then the unit for BD is g/<br />
cm3 . This unit is equivalent with kg/dm3 or t/m3 .<br />
Wash and dry the cans <strong>in</strong> the oven at 105 oC for 1 2 hours. Weigh each can,<br />
M . Soil water content (by volume), KA , can be calculated as:<br />
c v<br />
Water content by weight, K Am ,<br />
[2a]<br />
[2b]<br />
Units used are cm 3 /cm 3 and g/g to give an <strong>in</strong>dication that the water content<br />
was calculated based on volume and weight, respectively. The unit can be<br />
written <strong>in</strong> the form of %.<br />
The value of water content by volume (KA v ) can be converted <strong>in</strong>to water<br />
content by weight (KA m ) with the formula:<br />
KA m = KA v * ρ w /BD [3]<br />
Where ρ w is water density which is approximately 1 g/cm 3<br />
3.3.2. Soil organic <strong>carbon</strong> content<br />
Determ<strong>in</strong>ation of soil organic matter content with the LOI method.<br />
The mass of soil solids, M s , as illustrated <strong>in</strong> Figure 13, consists of the mass of<br />
organic matter, M om , and the mass of ash, M ash . In the LOI method, all organic<br />
matter present <strong>in</strong> the soil sample is burned at a temperature of 550 o C for 6<br />
hours. The burned organic matter will evaporate and the rema<strong>in</strong><strong>in</strong>g material<br />
is <strong>in</strong>organic matter such as clay, silt and other non-combustible substances<br />
that are collectively called ash for the purpose of this analysis. The mass<br />
lost from the sample equals the mass loss of organic matter. Conversion<br />
of organic matter to organic <strong>carbon</strong> content uses the conversion factor of<br />
1/1.724. This method is a semi-quantitative one, s<strong>in</strong>ce the mass lost dur<strong>in</strong>g<br />
31
32<br />
Agus et al. (2011)<br />
the conversion reflects only the organic matter content and the conversion<br />
factor of 1/1.724 is a generalized relationship between organic matter and<br />
<strong>carbon</strong> content.<br />
Procedure of LOI<br />
1) Gr<strong>in</strong>d thoroughly one tablespoon of oven-dried soil (from Step 6, section<br />
3.3.1 above) by us<strong>in</strong>g a porcela<strong>in</strong> mortar and pestle (Figure 14).<br />
2) Weigh a 1 or 2 g f<strong>in</strong>e <strong>peat</strong> sample and transfer quantitatively <strong>in</strong>to a<br />
porcela<strong>in</strong> cup of known weight, M . c<br />
3) Arrange the porcela<strong>in</strong> cups conta<strong>in</strong><strong>in</strong>g the samples <strong>in</strong> a furnace (Figure<br />
15).<br />
4) Close the furnace and gradually raise the temperature. Leave for one<br />
hour for every 100 oC <strong>in</strong>crease of temperature until the temperature<br />
reaches 550 oC. Let the ignition take place at 550 oC for 6 hours.<br />
5) Turn off the furnace and allow to cool down for approximately 8 hours.<br />
6) Weigh the weight of ash rema<strong>in</strong><strong>in</strong>g <strong>in</strong> the cup, M . ash<br />
Figure 14. Porcela<strong>in</strong> mortar and pestle
Figure 15. Porcela<strong>in</strong> cups <strong>in</strong>side a furnace<br />
Practical guidel<strong>in</strong>es <strong>Measur<strong>in</strong>g</strong> <strong>carbon</strong> <strong>stock</strong> <strong>in</strong> <strong>peat</strong> <strong>soils</strong><br />
7) Weigh about 3 g (BB = wet weight) f<strong>in</strong>e sample from Step 1 of this<br />
procedure <strong>in</strong>to an alum<strong>in</strong>ium can of known weight. Oven dry for 2 4<br />
hours at 105 o C and weigh the dry weight (BK). Calculate the water<br />
content as:<br />
Equation [4] is identical with Equation [2b] where M s + M w = M t .<br />
Calculate the soil sample dry mass as,<br />
M S = M t * (1 — KA m ) [5]<br />
M t <strong>in</strong> this case is the 1 or 2 g sample used <strong>in</strong> the ignition (Procedure 2)<br />
above. Equation [5] applies when us<strong>in</strong>g the unit mass fraction of KA m<br />
(the mass of water/the mass of dry soil). However, when KAm uses the<br />
% by weight unit then equation [5] becomes,<br />
M s = M t * (100%- KA m %)<br />
Furnace<br />
Porcela<strong>in</strong> cups<br />
for ignition<br />
[4]<br />
33
34<br />
Agus et al. (2011)<br />
Calculate organic <strong>carbon</strong> content, C org , based on dry weight (g of C/g<br />
of dry soil):<br />
The ash content can be calculated as:<br />
Ash content (%) = M ash /M s * 100% = 100% - C org % [7]<br />
C org content is usually expressed <strong>in</strong> % by weight or weight fraction<br />
of organic matter to total dry weight. Organic matter content by soil<br />
volume, C v , can be calculated as:<br />
C v is expressed <strong>in</strong> g/cm 3 or kg/dm 3 or t/m 3 (Mg/m 3 ). C v is the weight of<br />
organic <strong>carbon</strong> per unit volume of soil.<br />
Page et al. (2002) suggest an average value of C v of 0.06 t/m 3 . However,<br />
observation of hundreds of <strong>peat</strong> samples that orig<strong>in</strong>ated from Sumatra<br />
and Kalimantan (Agus et al. 2011a; Table 2) shows a high variation of C v<br />
value by <strong>peat</strong> maturity. C v ranged 0.082 ± 0.035 t/m 3 for <strong>peat</strong> with sapric<br />
maturity, 0.057 ± 0.026 t/m 3 for hemic maturity and 0.046 ± 0.025 t/m 3 for<br />
<strong>peat</strong> with fibric maturity. Thus, the recommended value of Page et al. (2002)<br />
approaches the value for <strong>peat</strong> with hemic (medium) maturity. Generalization<br />
of C v value results <strong>in</strong> errors <strong>in</strong> <strong>carbon</strong> <strong>stock</strong>s and emissions estimates us<strong>in</strong>g<br />
the subsidence approach (described further <strong>in</strong> Chapter 4).<br />
[6]<br />
[8]
Practical guidel<strong>in</strong>es <strong>Measur<strong>in</strong>g</strong> <strong>carbon</strong> <strong>stock</strong> <strong>in</strong> <strong>peat</strong> <strong>soils</strong><br />
Table 2. Mean and standard deviation of selected <strong>peat</strong> properties based on samples<br />
from Sumatra and Kalimantan<br />
Peat properties<br />
Sapric (n = 263)<br />
Maturity*<br />
Hemic (n = 904) Fibric (n = 659)<br />
C organic (%) 48.90 ± 8.91 52.27 ± 8.52 53.56 ± 6.48<br />
Bulk density (t/m3 ) 0.174 ± 0.082 0.117 ± 0.073 0.089 ± 0.058<br />
Ash content (%) 9.98 ± 13.67 8.89 ± 12.67 5.69 ± 9.25<br />
C v (t/m 3 ) 0.082 ± 0.035 0.057 ± 0.026 0.046 ± 0.025<br />
* Method of <strong>peat</strong> maturity determ<strong>in</strong>ation is expla<strong>in</strong>ed <strong>in</strong> section 3.3.3. Source: Agus et al. 2011<br />
The range of <strong>peat</strong> BD is generally about 0.02–0.3 t/m 3 depend<strong>in</strong>g on<br />
maturity and compaction, as well as the the ash content. C org content of <strong>peat</strong><br />
ranges 18–58% if the analysis is us<strong>in</strong>g the LOI method. If C org is analyzed by<br />
direct methods, such as CN autoanalyzer, then the maximum C org can be<br />
slightly greater than 60%.<br />
Example of calculation:<br />
(i) Determ<strong>in</strong>ation of <strong>carbon</strong> <strong>stock</strong>s at one po<strong>in</strong>t of observation<br />
Given that the soil BD of <strong>peat</strong> layers 0–20 cm, 20–50 cm, 50–100 cm, 100–150<br />
cm and 150–180 cm, respectively are 0.12; 0.10, 0.09; 0.11 and 0.15 t/m3 and the consecutive ash content is 4%, 3%, 2%, 2% and 15%, what is the<br />
<strong>carbon</strong> <strong>stock</strong> for each layer and what is the total <strong>carbon</strong> <strong>stock</strong> of this <strong>peat</strong> per<br />
hectare?<br />
Solution:<br />
BD data and ash content of the soil for each layer and the calculation are<br />
presented <strong>in</strong> Table 3.<br />
35
36<br />
Agus et al. (2011)<br />
Table 3. Example of calculation of <strong>carbon</strong> <strong>stock</strong>s <strong>in</strong> <strong>peat</strong> soil from one po<strong>in</strong>t of<br />
observation<br />
Layer (cm) Thickness<br />
per layer<br />
Volume per<br />
layer (m<br />
(m)<br />
3 /ha)<br />
BD<br />
(t/m3 Ash<br />
content<br />
C (%) org C (t/m v<br />
)<br />
(%)<br />
3 ) C <strong>stock</strong> per<br />
layer<br />
(t/ha)<br />
A B C D E F G H<br />
Given Column B x Given Given (100% - Column D Column C x<br />
10 000 (from soil (from soil column x (column column G<br />
analysis) analysis) E)/1.724 F /100)<br />
0–20 0.2 2000 0.12 4 55.68 0.067 134<br />
20–50 0.3 3000 0.10 3 56.26 0.056 169<br />
50–100 0.5 5000 0.09 2 56.84 0.051 256<br />
100–150 0.5 5000 0.11 2 56.84 0.063 313<br />
150–180 0.3 3000 0.15 15 49.30 0.074 222<br />
Total 1093<br />
C org is calculated by the equation [6] or = 100% - ash content (%); C v is<br />
calculated by the equation [8] and C <strong>stock</strong> equals C v * soil volume. From this<br />
calculation it was found that the soil <strong>carbon</strong> <strong>stock</strong> <strong>in</strong> this location was about<br />
1093 t/ha from the surface to 180 cm depth.<br />
(ii) Calculation of <strong>carbon</strong> <strong>stock</strong>s <strong>in</strong> a landscape or <strong>peat</strong> dome<br />
Carbon <strong>stock</strong>s <strong>in</strong> a landscape of <strong>peat</strong> soil can be calculated by us<strong>in</strong>g the data<br />
of area of each class of <strong>peat</strong> depth (A ), the average thickness of the <strong>peat</strong> <strong>in</strong><br />
i<br />
each thickness class (h ) and the average data for BD and C for each <strong>peat</strong><br />
i org<br />
layer and <strong>peat</strong> area. Peatland area for each thickness class can be calculated<br />
us<strong>in</strong>g a thickness contour map (Figure 3 above) by us<strong>in</strong>g a GIS tool.<br />
C <strong>stock</strong> = ∑ (A i * h i * BD * C org ) = ∑ (A i * h i * C v ) [9]<br />
Determ<strong>in</strong>ation of <strong>peat</strong> maturity<br />
Peat maturity level is divided <strong>in</strong>to three classes: sapric, hemic and fibric.<br />
In practice, there are three <strong>in</strong>dicators used for field evaluation and one<br />
<strong>in</strong>dicator for laboratory evaluation (Table 4).
Practical guidel<strong>in</strong>es <strong>Measur<strong>in</strong>g</strong> <strong>carbon</strong> <strong>stock</strong> <strong>in</strong> <strong>peat</strong> <strong>soils</strong><br />
Table 4. Indicators used for differentiat<strong>in</strong>g <strong>peat</strong> maturity <strong>in</strong> the field and <strong>in</strong> the<br />
laboratory<br />
Indicators Fibric (immature) Hemic (medium) Sapric (mature)<br />
<strong>peat</strong><br />
maturity<br />
<strong>peat</strong><br />
1. Decomposition Peat at early Half-decomposed Decomposed<br />
stage<br />
decomposition <strong>peat</strong>, with some <strong>peat</strong> <strong>in</strong> which the<br />
stage, with its orig<strong>in</strong>al materials orig<strong>in</strong>al materials<br />
orig<strong>in</strong>al materials are still recognizable are no longer<br />
still recognizable<br />
recognizable<br />
2. Colour Brown–light<br />
brown<br />
Brown Dark brown–black<br />
3. When squeezed More than two- One-to-two-thirds Less than one-<br />
<strong>in</strong> the palm the thirds of the <strong>in</strong>itial of the <strong>in</strong>itial amount third of the <strong>in</strong>itial<br />
amount of fibre<br />
rema<strong>in</strong><strong>in</strong>g<br />
amount<br />
amount<br />
4. Fibre content (%)<br />
us<strong>in</strong>g laboratory<br />
method<br />
> 75 15–75 < 15<br />
Determ<strong>in</strong>ation of <strong>peat</strong> maturity with field technique<br />
The method of determ<strong>in</strong><strong>in</strong>g the maturity of <strong>peat</strong> <strong>in</strong> the field is quite simple<br />
but it provides very useful and relatively accurate <strong>in</strong>formation when<br />
determ<strong>in</strong>ed by an experienced technician.<br />
Take a handful of <strong>peat</strong> from the desired depth and squeeze <strong>in</strong> the palm of<br />
the hand.<br />
Fibric (immature) <strong>peat</strong> is <strong>peat</strong> at early maturity stage with orig<strong>in</strong>al<br />
materials still recognizable, brown to light brown <strong>in</strong> colour and when<br />
squeezed <strong>in</strong> the palm, more than two-thirds of its orig<strong>in</strong>al amount<br />
rema<strong>in</strong>s <strong>in</strong> hand.<br />
Hemic (medium) maturity is half-decomposed <strong>peat</strong> with some of the<br />
orig<strong>in</strong>al materials still recognizable, brown <strong>in</strong> colour and when squeezed<br />
<strong>in</strong> the palm between one-third and two-thirds of the orig<strong>in</strong>al amount<br />
rema<strong>in</strong>.<br />
Sapric (mature) <strong>peat</strong> is at an advanced stage of decomposition with<br />
orig<strong>in</strong>al materials not recognizable, is dark brown to black <strong>in</strong> colour and<br />
when squeezed <strong>in</strong> the palm less than one-third of the orig<strong>in</strong>al amount<br />
rema<strong>in</strong>s.<br />
37
38<br />
Agus et al. (2011)<br />
Figure 16. Determ<strong>in</strong>ation of <strong>peat</strong> maturity <strong>in</strong> the field<br />
Simply squeeze a handful of <strong>peat</strong>. The sample <strong>in</strong> the right hand of the surveyor is<br />
fibric and the one <strong>in</strong> the left is hemic<br />
Determ<strong>in</strong>ation of <strong>peat</strong> maturity <strong>in</strong> the laboratory<br />
1) Fill a 10 ml or 25 ml syr<strong>in</strong>ge (Figure 17) with <strong>peat</strong> sample<br />
2) Press the sample us<strong>in</strong>g the syr<strong>in</strong>ge pump and record the volume, Vol 1,<br />
when the sample can no longer be compressed<br />
3) Transfer the sample <strong>in</strong>to a 150 μm or 0.0059 <strong>in</strong>ch sieve<br />
Figure 17. 10 ml syr<strong>in</strong>ge (left) and a sieve (right)
Practical guidel<strong>in</strong>es <strong>Measur<strong>in</strong>g</strong> <strong>carbon</strong> <strong>stock</strong> <strong>in</strong> <strong>peat</strong> <strong>soils</strong><br />
4) Use a shower spray or a r<strong>in</strong>s<strong>in</strong>g bottle to wash out the f<strong>in</strong>e materials<br />
5) After the f<strong>in</strong>e materials have been thoroughly washed out of the sieve,<br />
transfer the coarse fibre aga<strong>in</strong> <strong>in</strong>to the syr<strong>in</strong>ge and press. Record the<br />
volume, Vol 2<br />
6) Calculate the fibre content = Vol 2/Vol 1 X 100%<br />
7) Group the <strong>peat</strong> maturity based on the criteria:<br />
Sapric <strong>peat</strong> is decomposed <strong>peat</strong> with a fibre content less than<br />
15%<br />
Hemic <strong>peat</strong> is half-decomposed <strong>peat</strong> with fibre content 15–75%<br />
Fibric <strong>peat</strong> is immature <strong>peat</strong> with fibre content greater than 75%.<br />
39
Burn<strong>in</strong>g is often still used <strong>in</strong> land clear<strong>in</strong>g and preparation. If the<br />
watert¬able is below 30 cm and the <strong>peat</strong> is dry, fire can burn surface <strong>peat</strong><br />
layers and decrease the <strong>carbon</strong> <strong>stock</strong>.<br />
Photo: Kurniatun Hairiah<br />
41
Estimation of<br />
greenhouse gas emissions<br />
A reduction of <strong>carbon</strong> <strong>stock</strong> translates to <strong>carbon</strong> emissions and an <strong>in</strong>crease <strong>in</strong><br />
<strong>carbon</strong> <strong>stock</strong> translates to <strong>carbon</strong> sequestration. Carbon emissions data are<br />
normally expressed as CO -e (CO equivalent).<br />
2 2<br />
Peatland emits greenhouse gases <strong>in</strong> the forms of CO , CH (methane) and<br />
2 4<br />
N O. Of the three gases, CO is the most important because it forms the<br />
2 2<br />
highest amount emitted by <strong>peat</strong>land, especially converted <strong>peat</strong> forest<br />
to agriculture or settlements. CH is measurable <strong>in</strong> <strong>peat</strong> forests that are<br />
4<br />
normally saturated or submerged. CO emissions dom<strong>in</strong>ate dra<strong>in</strong>ed <strong>peat</strong>,<br />
2<br />
whereas CH emissions decrease significantly or even become undetectable<br />
4<br />
<strong>in</strong> dra<strong>in</strong>ed <strong>peat</strong>land. N O emissions occur from nitrogen-rich <strong>soils</strong>. Part of the<br />
2<br />
leached nitrate <strong>in</strong>to the anaerobic layer is reduced <strong>in</strong>to N O. In general, CO 2 2<br />
emissions from <strong>peat</strong> soil can be calculated based on the change <strong>in</strong> <strong>carbon</strong><br />
<strong>stock</strong>s with<strong>in</strong> a given period of time.<br />
Carbon storage <strong>in</strong> <strong>peat</strong>lands is the largest <strong>in</strong> (belowground) <strong>peat</strong> soil,<br />
second, <strong>in</strong> the plant biomass and, third, <strong>in</strong> the necromass. Each component<br />
of <strong>carbon</strong> <strong>stock</strong> may be <strong>in</strong>creased or decreased depend<strong>in</strong>g on natural factors<br />
and human <strong>in</strong>tervention. Droughts result <strong>in</strong> a decreased watertable, which<br />
could subsequently accelerate CO emissions from <strong>peat</strong> <strong>soils</strong>. Agricultural<br />
2<br />
land management practices on <strong>peat</strong>land, such as burn<strong>in</strong>g, construction of<br />
dra<strong>in</strong>age and fertilization affect CO emission levels. Peat fires can lower the<br />
2<br />
<strong>carbon</strong> <strong>stock</strong> <strong>in</strong> plant biomass and <strong>in</strong> the <strong>peat</strong>, which translates to <strong>in</strong>creased<br />
emissions from both sources. Fertilization can <strong>in</strong>crease emissions ow<strong>in</strong>g to<br />
<strong>in</strong>creased microbial activity. On the other hand, reduc<strong>in</strong>g the depth of the<br />
watertable <strong>in</strong> dra<strong>in</strong>ed <strong>peat</strong>land through <strong>in</strong>stallation of canal block<strong>in</strong>g is likely<br />
to reduce the amount of emissions.<br />
Plant growth is a process of CO captured from the atmosphere through<br />
2<br />
photosynthesis and stored as <strong>carbon</strong> <strong>in</strong> plant tissue. The process of plant<br />
growth, especially of tree crops, <strong>in</strong>creases <strong>carbon</strong> <strong>stock</strong>s <strong>in</strong> a landscape.<br />
43
44<br />
Agus et al. (2011)<br />
Therefore, the amount of CO2 emissions at a certa<strong>in</strong> time <strong>in</strong>terval can be<br />
estimated by the formula:<br />
E =<br />
( E a + E bb + E bo — S a )<br />
t<br />
E = Emissions ow<strong>in</strong>g to aboveground biomass decomposition<br />
a<br />
E = C x 3.67<br />
a b<br />
[10]<br />
Where C b is the biomass (and necromass) <strong>carbon</strong> <strong>stock</strong>s that are subjected to<br />
decomposition upon land-use conversion. The <strong>in</strong>dex 3.67 is the conversion<br />
factor from C to CO 2 . Accord<strong>in</strong>g to the IPCC (2006), when land is cleared<br />
it is assumed that all (100%) of plant biomass <strong>carbon</strong> is oxidized <strong>in</strong>to CO 2<br />
through either burn<strong>in</strong>g or decomposition by microbes or a comb<strong>in</strong>ation of<br />
both. Suppos<strong>in</strong>g that a <strong>peat</strong> forest is cleared with aboveground <strong>carbon</strong> <strong>stock</strong><br />
<strong>in</strong> the plant biomass as high as 100 t/ha, then the amount of emissions from<br />
this source are<br />
E = 100 t/ha C x 3.67 CO /C = 367 t/ha CO .<br />
a 2 2<br />
If the total forest area that was cleared was 6000 ha, then the emissions from<br />
the plant biomass would be<br />
Ea = 367 t/ha CO x 6,000 ha = 2,202,000 t CO .<br />
2 2<br />
The method for determ<strong>in</strong><strong>in</strong>g <strong>carbon</strong> <strong>stock</strong> <strong>in</strong> plant biomass is elaborated <strong>in</strong><br />
Hairiah et al. (2011a).<br />
E = CO emissions ow<strong>in</strong>g to <strong>peat</strong> fire. When a layer of <strong>peat</strong> is completely<br />
bb 2<br />
burned, then the organic matter will be oxidized, result<strong>in</strong>g <strong>in</strong> CO and 2<br />
H O and a number of other gases.<br />
2<br />
E = Volume of burnt <strong>peat</strong> (m bb 3 ) x BD (t/m3 ) x C (t/t) x 3.67 CO /C<br />
org 2<br />
= Volume of burnt <strong>peat</strong> (m3 ) x C (t/m v 3 ) x 3,67 CO /C 2<br />
The volume of burnt <strong>peat</strong> can be estimated by measur<strong>in</strong>g the volume of the<br />
<strong>peat</strong> bas<strong>in</strong> formed after the fire, with the bas<strong>in</strong> be<strong>in</strong>g the portion of <strong>in</strong>itial<br />
<strong>peat</strong> that is completely burned.<br />
For example, if 6000 ha of <strong>peat</strong> with properties similar to the example <strong>in</strong><br />
Table 2 burnt evenly to a depth of 30 cm, then
Practical guidel<strong>in</strong>es <strong>Measur<strong>in</strong>g</strong> <strong>carbon</strong> <strong>stock</strong> <strong>in</strong> <strong>peat</strong> <strong>soils</strong><br />
The volume of burnt <strong>peat</strong> from the 0–20 cm layer = 0.2 m x 6000 ha x 10 000<br />
m 2 /ha = 12 000 000 m 3 .<br />
E bb (the amount of CO 2 emissions from the 0–20 cm layer)<br />
= Volume of burnt <strong>peat</strong> x C x 3,67<br />
v<br />
= 12 000 000 m3 x 0.067 t/m3 C x 3.67 CO /C 2<br />
= 2 950 680 t CO2 The volume of burnt <strong>peat</strong> from the 20–30 cm depth = 0.1 m x 6000 ha x 10<br />
000 m 2 /ha = 6 000 000 m 3 .<br />
E bb (the amount of CO 2 emissions from 20–30 cm layer)<br />
= 6 000 000 m3 * 0.056 t/m3 C x 3.67 CO /C 2<br />
= 1 233 120 t CO2 Total emission from the 0–30 cm layer<br />
= 2 950 680 t CO + 1 233 120 t CO = 4 183 800 t CO 2 2 2<br />
Note: In reality the burn<strong>in</strong>g is never evenly distributed. It can enter <strong>in</strong>to a few<br />
metres of dry <strong>peat</strong> while some parts of the surface are only partially burnt.<br />
E bo = Emissions from <strong>peat</strong> decomposition. There are various factors that<br />
affect the rate of <strong>peat</strong> decomposition. The most important one is the depth<br />
of the watertable, but under the same watertable emission rates can be<br />
different depend<strong>in</strong>g on the maturity of the <strong>peat</strong>, fertilizer application and the<br />
<strong>in</strong>fluence of plant root respiration. Plant root respiration must be discounted<br />
from emission calculations because it is compensated by CO 2 absorption<br />
through photosynthesis.<br />
E can be measured or estimated by several approaches, for example:<br />
bo<br />
Measurement of greenhouse gas fluxes us<strong>in</strong>g CO Infra-Red Gas<br />
2<br />
45
46<br />
Agus et al. (2011)<br />
Analyzer (IRGA) or Gas Chromatography (GC)<br />
o By us<strong>in</strong>g IRGA the gas from a closed chamber flows <strong>in</strong>to the IRGA<br />
(Figure 18) by us<strong>in</strong>g a pressure pump and CO concentration is<br />
2<br />
directly read by the IRGA every second for approximately 2.5<br />
m<strong>in</strong>utes. A l<strong>in</strong>ear relationship between time of observations with<br />
the concentration of CO gas is used to calculate the CO flux to<br />
2 2<br />
the ground surface.<br />
o If us<strong>in</strong>g a GC, the gas samples are collected from closed<br />
chambers us<strong>in</strong>g syr<strong>in</strong>ges (Figure 19) and then the gas<br />
concentration is measured by a GC (Hue et al. 2000).<br />
Closed chamber<br />
PC or data logger<br />
Unit IRGA<br />
Figure 18. Infra-Red Gas Analyzer (IRGA) and the closed chamber for measur<strong>in</strong>g CO 2<br />
gas flux emitted from the soil<br />
Empirical relationship of land management and emissions<br />
From a review of publications based on research <strong>in</strong> Sarawak, Malaysia, and<br />
(ma<strong>in</strong>ly) Kalimantan, Indonesia, Hooijer et al. (2006, 2010) developed a l<strong>in</strong>ear<br />
relationship between the depth of dra<strong>in</strong>age, DD, and CO emissions:<br />
2<br />
E bo (t CO 2 /ha/yr) = 0,91 DD (cm) [11]
Practical guidel<strong>in</strong>es <strong>Measur<strong>in</strong>g</strong> <strong>carbon</strong> <strong>stock</strong> <strong>in</strong> <strong>peat</strong> <strong>soils</strong><br />
Figure 19. Gas sampl<strong>in</strong>g from a closed chamber for gas concentration measurement<br />
us<strong>in</strong>g gas chromatography<br />
The equation applies to DD between 30 and 120 cm. However,<br />
the literature referred to by Hooijer et al. (2006, 2010) did not<br />
separate the CO 2 from root respiration to the emissions caused<br />
by <strong>peat</strong> decomposition. Emissions from root respiration <strong>in</strong><br />
certa<strong>in</strong> circumstances can be very high. Handayani (2009)<br />
reported that for oil palm plantations on <strong>peat</strong>land <strong>in</strong> West Aceh<br />
district, the root respiration contribution was about 30% of the<br />
measured CO 2 based on closed chamber measurement. Thus,<br />
Agus et al. (2010) suggest that Hooijer (2010) be modified as<br />
E bo (t CO 2 /ha/year) = 0.7 x 0.91 DD (cm) [12]<br />
For example, if the undra<strong>in</strong>ed natural <strong>peat</strong>land is converted to<br />
plantations with a depth of dra<strong>in</strong>age of 60 cm there will be an<br />
47
48<br />
Agus et al. (2011)<br />
<strong>in</strong>crease of CO 2 emissions:<br />
E bo = 0.7 x 0.91 t CO 2 / ha / yr / cm x 60 cm = 38.22 t CO 2 / ha / yr.<br />
If the area of the converted land is 6000 ha for an oil palm<br />
plantation cycle of 25 years then<br />
E bo = 0.7 x 0.91 t CO 2 /ha/yr/cm x 60 cm x 6000 ha x 25 yr<br />
= 5 733 000 t CO 2 = 5.7 Mt CO 2<br />
Estimate based on <strong>peat</strong> subsidence<br />
Accord<strong>in</strong>g to Wösten et al. (1997), subsidence takes place very rapidly<br />
<strong>in</strong> the first few years after the dra<strong>in</strong>age is <strong>in</strong>itiated and achieves stability<br />
at the rate of about 2 cm/yr (Figure 20). They expla<strong>in</strong>ed further that,<br />
assum<strong>in</strong>g that there is no fire, then the decomposition accounts for 60% of<br />
subsidence, while compaction (consolidation) accounts for 40%. In contrast,<br />
Couwenberg (2010) estimated that the decomposition of <strong>peat</strong> accounted for<br />
approximately 40% of subsidence. That is, if subsidence occurs as thick as 10<br />
cm, 4 cm is attributable to <strong>peat</strong> decomposition and 6 cm due to compaction<br />
and consolidation.<br />
Based on Couwenberg (2010), suppos<strong>in</strong>g that with<strong>in</strong> 25 years a landscape<br />
of <strong>peat</strong> undergoes 50 cm subsidence, then 40% x 50 cm = 20 cm of the<br />
subsidence is caused by <strong>peat</strong> decomposition. If the volume-based <strong>carbon</strong><br />
content, C v = 0.06 t /m 3 , then from the 6000 ha of <strong>peat</strong>land, emissions that<br />
occur dur<strong>in</strong>g 25 years would be<br />
E bo = 0.20 m x 0.06 t/m 3 C x 3.67 t CO 2 /t C x 6000 ha x 10 000 m 2 /ha<br />
= 2 642 000 t CO 2 = 2.6 Mt CO 2<br />
Estimation based on changes <strong>in</strong> <strong>carbon</strong> <strong>stock</strong>s <strong>in</strong> <strong>peat</strong><br />
This estimate is based on the difference <strong>in</strong> <strong>carbon</strong> <strong>stock</strong>s <strong>in</strong> <strong>peat</strong> at time t 1 ,<br />
for example, when <strong>peat</strong>land is still covered by natural forest and at time t 2 ,<br />
after a few years of dra<strong>in</strong>age. Carbon content and BD measurements were<br />
done by layers from the surface to the <strong>peat</strong> bottom at time t 1 and t 2 . Sample<br />
calculations <strong>in</strong> Table 5 provide the data of BD and C org , at t 1 and t 2 <strong>in</strong> 1990 and<br />
2015, respectively. This approach provides an estimate of emissions as much<br />
as 5.8 million t CO 2 over 25 years (Table 5).
Subsiden komulatif (cm)<br />
350<br />
300<br />
250<br />
200<br />
150<br />
100<br />
50<br />
1974<br />
4,6 cm/yr<br />
0<br />
1960 1970 1980<br />
Year<br />
Practical guidel<strong>in</strong>es <strong>Measur<strong>in</strong>g</strong> <strong>carbon</strong> <strong>stock</strong> <strong>in</strong> <strong>peat</strong> <strong>soils</strong><br />
2,0 cm/yr<br />
1990 2000<br />
Figure 20. The rate of subsidence of dra<strong>in</strong>ed <strong>peat</strong> as a function of time s<strong>in</strong>ce the<br />
dra<strong>in</strong>age starts (Wösten et al. 1997)<br />
Table 5. Calculation of the change <strong>in</strong> <strong>peat</strong> <strong>carbon</strong> <strong>stock</strong>s based on bulk density (BD)<br />
and organic <strong>carbon</strong> content (C org ) data by layer<br />
1986<br />
Observation <strong>in</strong> 1990 Hypothetical observation <strong>in</strong> 2015<br />
No.<br />
Peat depth<br />
BD %Corg Cv C <strong>stock</strong><br />
Peat depth<br />
BD %Corg Cv C <strong>stock</strong><br />
(cm) (t/m (cm)<br />
3 ) (t/m3 ) (t/ha) (t/m3 ) (t/m3 ) (t/ha)<br />
1 0-40 0.10 30 0.03 120 0-30 0.35 25 0.09 263<br />
2 40-100 0.15 40 0.06 360 30-80 0.30 35 0.11 525<br />
3 100-160 0.12 40 0.05 288 80-140 0.20 40 0.08 480<br />
4 160-200 0.15 45 0.07 270 140-200 0.15 45 0.07 405<br />
5 200-250 0.16 35 0.06 280 200-250 0.16 35 0.06 280<br />
6 250-300 0.14 50 0.07 350 250-300 0.14 50 0.07 350<br />
7 300-350 0.13 58 0.08 377 300-350 0.13 58 0.08 377<br />
8 350-355 0.12 50 0.06 330 350-390 0.12 30 0.04 144<br />
9 355-400 0.14 50 0.07 315<br />
10 400-450 0.12 55 0.07 330<br />
11 450-470 0.13 25 0.03 65<br />
Average 0.13 43 0.06 0.19 40 0.07<br />
Total (t/ha C) 3,085 2,824<br />
Decrease <strong>in</strong> <strong>carbon</strong> <strong>stock</strong> <strong>in</strong> 25 years (t/ha C) 262<br />
Emissions = Decrease <strong>in</strong> <strong>carbon</strong> <strong>stock</strong> <strong>in</strong> 25 years on 6000 ha (t CO ) = 2<br />
262 t/ha * 6000 ha *3.67 5,758,230<br />
49
50<br />
Agus et al. (2011)<br />
S = Sequestration or CO uptake by plants = the time-averaged <strong>carbon</strong><br />
a 2<br />
<strong>stock</strong> <strong>in</strong> the biomass and necromass of the succeed<strong>in</strong>g plants (t/<br />
ha) x 3.67. For example, if the time-averaged <strong>carbon</strong> <strong>stock</strong> from one<br />
economic time cycle of 25 years of oil palm = 40 t/ha C, then for 6000<br />
ha of land, its contribution <strong>in</strong> reduc<strong>in</strong>g CO <strong>in</strong> the atmosphere = 40 t/ha<br />
2<br />
C ha x 6000 x 3.67 t CO /C = 880 800 t CO .<br />
2 2<br />
Δt = The time period for the calculation, which depends on the purpose of<br />
the analysis. It could be 1 m<strong>in</strong>ute or 1 hour <strong>in</strong> terms of gas flux, 1 year<br />
or several years for plant growth, as long as all factors <strong>in</strong> the calculation<br />
(Equation 10) use the same time period. For <strong>carbon</strong> trad<strong>in</strong>g, a long<br />
time scale of, for example, 10–20 years, is normally used.<br />
By us<strong>in</strong>g the above calculation and Table 5 for E bo , and comb<strong>in</strong><strong>in</strong>g them to<br />
Equation [10], then<br />
( E + E + E — S )<br />
a bb bo a E =<br />
t<br />
E = (2,202,000 + 4,183,800 + 5,758,230 – 880,800) t CO /25 years<br />
2<br />
= 11,262,430 t CO 2 /25 yr/6,000 ha, and this is equivalent with<br />
= 75 t CO 2 /ha/year<br />
From this calculation it can be <strong>in</strong>terpreted that about 11 million tonne (M t )<br />
of CO 2 would be emitted with<strong>in</strong> 25 years from the 6000 ha <strong>peat</strong> forest that<br />
was converted to plantation. From the perspective of REDD, it can be stated<br />
that about 11 Mt CO 2 /25 yr/6000 ha can be reduced by ma<strong>in</strong>ta<strong>in</strong><strong>in</strong>g the <strong>peat</strong><br />
forest as is (by avoid<strong>in</strong>g deforestation).
Discussion<br />
In REDD or any similar emission reduction scheme, the service providers of<br />
<strong>carbon</strong> conservation are entitled for payment from the <strong>carbon</strong> service buyers<br />
based on a formal agreement. The amount of payment may be based on<br />
the <strong>in</strong>ternationally published price of <strong>carbon</strong> or on the ‘opportunity cost’ of<br />
forgone benefits from alternative bus<strong>in</strong>ess on the land.<br />
What should a country, a prov<strong>in</strong>ce or district consider prior to engagement<br />
<strong>in</strong> <strong>carbon</strong> trad<strong>in</strong>g? They should first understand and conv<strong>in</strong>ce themselves of<br />
several issues.<br />
Whether the price of <strong>carbon</strong> offered by the buyers can cover the<br />
opportunity and transaction costs. In other words, whether the seller of<br />
the service is will<strong>in</strong>g to accept the amount of payment.<br />
Whether government at national and sub-national levels, as well as the<br />
local community, can obey the long-term commitment (<strong>in</strong> this example,<br />
25 years, but it may be 10, 20 or longer than 25) not to cut or dra<strong>in</strong> the<br />
<strong>peat</strong> forest.<br />
Whether avoid<strong>in</strong>g deforestation on the land under contract can avoid<br />
‘leakage’, that is, an <strong>in</strong>crease <strong>in</strong> deforestation and land conversion <strong>in</strong><br />
surround<strong>in</strong>g areas.<br />
If the answer to each of the three question is ‘yes’, it <strong>in</strong>dicates that both the<br />
<strong>carbon</strong> buyers and sellers are ready for <strong>carbon</strong> trad<strong>in</strong>g.<br />
Apart from <strong>carbon</strong> trad<strong>in</strong>g, a decrease <strong>in</strong> <strong>carbon</strong> <strong>stock</strong> is associated with <strong>peat</strong><br />
subsidence. Peat subsidence is highly related to susta<strong>in</strong>ability of farm<strong>in</strong>g<br />
on <strong>peat</strong>land. Before us<strong>in</strong>g <strong>peat</strong>lands for agriculture we need to consider the<br />
susta<strong>in</strong>ability and environmental aspects (Agus and Subiksa 2008). For those<br />
lands that have been used for agriculture, it is imperative to implement<br />
the best management techniques for susta<strong>in</strong><strong>in</strong>g the bus<strong>in</strong>ess. Given the<br />
relatively low productivity of <strong>peat</strong>lands and their important role as a buffer<br />
of environmental quality, then the future development of <strong>peat</strong>land for<br />
agriculture should be kept to a m<strong>in</strong>imum.<br />
51
Dra<strong>in</strong>age canals are used not only to reduce soil saturation but also for<br />
transportation. Ma<strong>in</strong>tenance of a high watertable <strong>in</strong> the canal is important for<br />
transport functions but also reduces CO 2 emissions.<br />
Photo: Me<strong>in</strong>e van Noordwijk
References<br />
Aguilar FJ, Agüera F, Aguilar MA, Carvajal F. 2005. Effects of terra<strong>in</strong><br />
morphology, sampl<strong>in</strong>g density and <strong>in</strong>terpolation methods on grid DEM<br />
accuracy. Photogrammetric Eng<strong>in</strong>eer<strong>in</strong>g and Remote Sens<strong>in</strong>g 71(7):805–<br />
816.<br />
Agus F, Wahyunto, Mulyani A, Dariah A, Maswar, Susanti E. 2011. Variasi <strong>stock</strong><br />
karbon dan emisi CO di lahan gambut. Laporan Tengah Tahun KP3I.<br />
2<br />
Variations <strong>in</strong> <strong>carbon</strong> <strong>stock</strong>s and emissions of CO <strong>in</strong> <strong>peat</strong>lands. Mid-year<br />
2<br />
report KP3I. Bogor, Indonesia: <strong>Balai</strong> Besar Litbang Sumberdaya Lahan<br />
Pertanian. In press.<br />
Agus F, Subiksa IGM. 2008. Lahan gambut: potensi untuk pertanian dan aspek<br />
l<strong>in</strong>gkungan. Peatlands: potential for agriculture and the environmental<br />
aspect. Bogor, Indonesia: <strong>Balai</strong> <strong>Penelitian</strong> <strong>Tanah</strong>; World Agroforestry<br />
Centre (ICRAF) Southeast Asia Regional Program.<br />
Agus F, Handayani E, Van Noordwijk M, Idris K, Sabiham S. 2010. Root<br />
respiration <strong>in</strong>terference with <strong>peat</strong> CO emission measurement. In:<br />
2<br />
Proceed<strong>in</strong>gs N<strong>in</strong>eteenth World Congress of Soil Science, 1–6 August 2010,<br />
Brisbane, Australia. DVD. Brisbane, Australia: International Union of Soil<br />
Sciences. p. 50–53.<br />
Boer R, Sulistyowati, Las I, Zed F, Masripat<strong>in</strong> N, Kartakusuma DA, Hilman D,<br />
Mulyanto HS. 2010. Indonesia’s second national communication under<br />
the United Nations Framework Convention on Climate Change. Jakarta:<br />
M<strong>in</strong>istry of the Environment.<br />
Couwenberg J, Domma<strong>in</strong> R, Joosten H. 2010. Greenhouse gas fluxes from<br />
tropical <strong>peat</strong>lands <strong>in</strong> Southeast Asia. Global Change Biology 16:1715–<br />
1732.<br />
Dixon RK, Brown S, Houghton RA, Solomon AM, Trexler MC, Wisniewski<br />
J. 1994. Carbon pools and flux of global forest ecosystems. Science<br />
263:185–191.<br />
55
56<br />
Agus et al. (2011)<br />
Hairiah K, Rahayu S. 2007. Pengukuran ‘cadangan karbon’ di berbagai macam<br />
penggunaan lahan. Measurement of <strong>carbon</strong> <strong>stock</strong>s <strong>in</strong> a wide range<br />
of land uses. Bogor, Indonesia: World Agroforestry Centre (ICRAF)<br />
Southeast Asia Regional Program; Malang, Indonesia: Universitas<br />
Brawijaya.<br />
Hairiah K, Ekad<strong>in</strong>ata A, Sari RR, Rahayu S. 2011a. Pengukuran cadangan<br />
karbon dari t<strong>in</strong>gkat lahan ke bentang lahan. Edisi 2. Measurement of<br />
<strong>carbon</strong> <strong>stock</strong>s from plot to landscape level. Second Edition. Bogor,<br />
Indonesia: World Agroforestry Centre (ICRAF) Southeast Asia Regional<br />
Program; Malang, Indonesia: Universitas Brawijaya.<br />
Hairiah K, Dewi S, Agus F, Velarde SJ, Ekad<strong>in</strong>ata A, Rahayu S, van Noordwijk<br />
M. 2011b. <strong>Measur<strong>in</strong>g</strong> <strong>carbon</strong> <strong>stock</strong>s across land-use systems: a manual.<br />
Bogor, Indonesia: World Agroforestry Centre (ICRAF) Southeast Asia<br />
Regional Program.<br />
Handayani E. 2009. Emisi karbon dioksida (CO ) dan metan (CH ) pada<br />
2 4<br />
perkebunan kelapa sawit di lahan gambut yang memiliki keragaman<br />
dalam ketebalan gambut dan umur tanaman. Emissions of <strong>carbon</strong><br />
dioxide (CO ) and methane (CH ) <strong>in</strong> oil palm plantations on <strong>peat</strong>lands<br />
2 4<br />
have diversity <strong>in</strong> the thickness of <strong>peat</strong> and plant age. PhD Thesis.<br />
Bogor, Indonesia: Institut Pertanian Bogor.<br />
Hooijer A, Page S, Canadell JG, Silvius M, Kwadijk J, Wösten H, Jauhia<strong>in</strong>en<br />
J. 2010. Current and future CO emissions from dra<strong>in</strong>ed <strong>peat</strong>lands <strong>in</strong><br />
2<br />
Southeast Asia. Biogeosciences 7:1505–1514.<br />
Hooijer A, Silvius M, Wösten H, Page S. 2006. PEAT-CO : assessment of CO 2 2<br />
emissions from dra<strong>in</strong>ed <strong>peat</strong>lands <strong>in</strong> SE Asia. Delft Hydraulics report<br />
Q3943 (2006). Delft, The Netherlands: WL/Delft Hydraulics.<br />
Hue AX, Chen GX, Wang ZP, Van Cleemput O, Patrick Jr WH. 2000. Methane<br />
and nitrous oxide emissions from a rice field <strong>in</strong> relation to soil redox<br />
and microbiological processes. Soil Science Society of America Journal<br />
64:2180–2186.<br />
[IPCC] Intergovernmental Panel on Climate Change. 2006. IPCC guidel<strong>in</strong>es<br />
for national greenhouse gas <strong>in</strong>ventories. Eggleston HS, Buendia L,<br />
Miwa K, Ngara T, Tanabe K, eds. Prepared by the National Greenhouse<br />
Gas Inventories Programme. Hayama, Japan: Institute for Global<br />
Environmental Studies.
Practical guidel<strong>in</strong>es <strong>Measur<strong>in</strong>g</strong> <strong>carbon</strong> <strong>stock</strong> <strong>in</strong> <strong>peat</strong> <strong>soils</strong><br />
Jaenicke J, Wösten H, Budiman AA, Siegert F. 2010. Plann<strong>in</strong>g hydrological<br />
restoration of <strong>peat</strong>lands <strong>in</strong> Indonesia to mitigate <strong>carbon</strong> dioxide<br />
emissions. Mitigation and Adaptation Strategies for Global Change<br />
15(3):223–239.<br />
Maswar. 2011. Kajian cadangan karbon pada lahan gambut tropika yang<br />
didra<strong>in</strong>ase untuk tanaman tahunan. Study of <strong>carbon</strong> <strong>stock</strong>s <strong>in</strong> tropical<br />
<strong>peat</strong>land dra<strong>in</strong>ed for annual crops. Bogor, Indonesia: Sekolah<br />
Pascasarjana, Institut Pertanian Bogor.<br />
Murdiyarso D, Rosal<strong>in</strong>a U, Hairiah K, Muslihat L, Suryadiputra INN, Jaya A.<br />
2004. Petunjuk lapangan: Pendugaan Cadangan Karbon pada Lahan<br />
Gambut. Field tips: estimation of <strong>carbon</strong> <strong>in</strong> <strong>peat</strong>land reserves. Bogor,<br />
Indonesia: Wetlands International Indonesia Program; Ottawa: Wildlife<br />
Habitat Canada.<br />
Noor M. 2001. Pertanian lahan gambut: potensi dan kendala. Peatland:<br />
potential and constra<strong>in</strong>ts. Jakarta: Penerbit Kanisius.<br />
Page SE, Siegert F, Rieley JO, Boehm HV, Jaya A, Lim<strong>in</strong> S. 2002. The amount<br />
of <strong>carbon</strong> released from <strong>peat</strong> and forest fires <strong>in</strong> Indonesia dur<strong>in</strong>g 1997.<br />
Nature 420:61–65.<br />
Ritung, S., Wahyunto, Nugroho, K., Sukarman, Hikmatullah, Suparto,<br />
Tafakresnanto, C. 2011. Peta Lahan Gambut Indonesia Skala 1:250.000<br />
(Indonesian <strong>peat</strong>land map at the scale 1:250,000). Indonesian Center<br />
for Agricultural Land Resources Research and Development, Bogor,<br />
Indonesia.<br />
Shofiyati R, Las I, Agus F. 2010. Indonesian soil database and predicted <strong>stock</strong><br />
of soil <strong>carbon</strong>. In: Chen ZS, Agus F, eds. Proceed<strong>in</strong>gs of <strong>in</strong>ternational<br />
workshop on evaluation and susta<strong>in</strong>able management of soil <strong>carbon</strong><br />
sequestration <strong>in</strong> Asian countries. 28–29 September 2010. Bogor,<br />
Indonesia. Bogor, Indonesia: Indonesian Soil Research Institute; Taipei:<br />
Food and Fertilizer Technology Center for the Asian and Pacific Region;<br />
Tsukuba, Japan: National Institute for Agro-Environmental Sciences. p.<br />
73–83.<br />
Suganda H, Rachman A, Sutono. 2007. Petunjuk pengambilan contoh tanah.<br />
Soil sampl<strong>in</strong>g <strong>in</strong>structions. In: Kurnia U, Agus F, Adimihardja A, Dariah<br />
A, eds. Sifat fisik tanah dan metode analisisnya. Soil physical properties<br />
and analytical methods. Bogor, Indonesia: <strong>Balai</strong> <strong>Penelitian</strong> <strong>Tanah</strong>. p.<br />
3–24.<br />
57
58<br />
Agus et al. (2011)<br />
Van de Meene J. 1984. Geological aspects of <strong>peat</strong> formation <strong>in</strong> the<br />
Indonesian-Malaysian lowlands. Bullet<strong>in</strong> Geological Research and<br />
Development Centre 9:20–31.<br />
Wahyunto, Ritung S, Suparto, Subagjo H. 2004. Map of <strong>peat</strong>land distribution<br />
area and <strong>carbon</strong> content <strong>in</strong> Kalimantan. Bogor, Indonesia: Wetlands<br />
International Indonesia Program; Ottawa: Wildlife Habitat Canada.<br />
Wahyunto, Ritung S, Suparto, Subagjo H. 2005. Peatland distribution and<br />
<strong>carbon</strong> content <strong>in</strong> Sumatra and Kalimantan. Bogor, Indonesia: Wetlands<br />
International Indonesia Program; Ottawa: Wildlife Habitat Canada.<br />
Wahyunto, Suparto, Heryanto B, Bekti H. 2006. Sebaran lahan gambut,<br />
luas dan cadangan karbon bawah permukaan di Papua. Peatland<br />
distribution, extent and belowground <strong>carbon</strong> <strong>stock</strong>s <strong>in</strong> Papua. Bogor,<br />
Indonesia: Wetlands International Indonesia Program.<br />
Walkley A, Black IA. 1934. An exam<strong>in</strong>ation of Degtjareff method for<br />
determ<strong>in</strong><strong>in</strong>g soil organic matter and a proposed modification of the<br />
chromic acid titration method. Soil Science 37:29–37.<br />
Wösten JHM, Ismail AB, van Wijk ALM. 1997. Peat subsidence and its practical<br />
implications: a case study <strong>in</strong> Malaysia. Geoderma 78:25–36.
Appendix. Record sheet for <strong>peat</strong> observation<br />
Practical guidel<strong>in</strong>es <strong>Measur<strong>in</strong>g</strong> <strong>carbon</strong> <strong>stock</strong> <strong>in</strong> <strong>peat</strong> <strong>soils</strong><br />
No. Name of Surveyor No. of landscape photo:<br />
1 Date<br />
2 Code/Observation Number<br />
3 Location (village, subdistrict, district,<br />
prov<strong>in</strong>ce)<br />
4 Coord<strong>in</strong>ates/GPS position<br />
5 Peat thickness(cm)<br />
6 Type of underly<strong>in</strong>g layer Clay/quartz sand/acid sulphate<br />
7 Dra<strong>in</strong>age pattern Natural/artificial. Expla<strong>in</strong>! ………………........<br />
...................................<br />
8 Distance of observation po<strong>in</strong>t from the Primary canal/secondary canal/tertiary canal/field<br />
dra<strong>in</strong>age canal (cm)<br />
dra<strong>in</strong><br />
9 Watertable at the canal (cm) At present …. cm. In wet season….. cm. In dry<br />
season …cm<br />
10 Watertable at the observation po<strong>in</strong>t<br />
(observed from the auger hole) (cm)<br />
11 Land use<br />
What year was the dra<strong>in</strong>age canal<br />
constructed?<br />
Previous land use<br />
Year of conversion to present land<br />
use<br />
59
60<br />
Agus et al. (2011)<br />
12 Sample code and number<strong>in</strong>g for each<br />
layer (must appear on this form and <strong>in</strong> the<br />
sample plastic bags)<br />
No. Code and date Depth (cm) Maturity Remarks (e.g. <strong>in</strong> case of the presence of clay or<br />
charcoal layer, record at what depth and how thick)<br />
1<br />
2<br />
3<br />
4<br />
5<br />
6<br />
7<br />
8<br />
9<br />
10<br />
11<br />
12<br />
13<br />
14<br />
15<br />
16<br />
17<br />
18<br />
19<br />
20
Indonesian Centre for Agricultural Land<br />
Resources Research and Development