Measuring and segmentation in CT data using deformable models
Measuring and segmentation in CT data using deformable models
Measuring and segmentation in CT data using deformable models

Create successful ePaper yourself
Turn your PDF publications into a flip-book with our unique Google optimized e-Paper software.
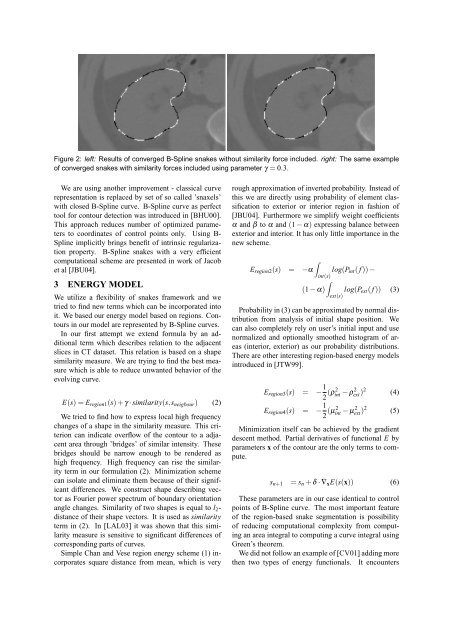
Figure 2: left: Results of converged B-Spl<strong>in</strong>e snakes without similarity force <strong>in</strong>cluded. right: The same example<br />
of converged snakes with similarity forces <strong>in</strong>cluded us<strong>in</strong>g parameter γ = 0.3.<br />
We are us<strong>in</strong>g another improvement - classical curve<br />
representation is replaced by set of so called ’snaxels’<br />
with closed B-Spl<strong>in</strong>e curve. B-Spl<strong>in</strong>e curve as perfect<br />
tool for contour detection was <strong>in</strong>troduced <strong>in</strong> [BHU00].<br />
This approach reduces number of optimized parameters<br />
to coord<strong>in</strong>ates of control po<strong>in</strong>ts only. Us<strong>in</strong>g B-<br />
Spl<strong>in</strong>e implicitly br<strong>in</strong>gs benefit of <strong>in</strong>tr<strong>in</strong>sic regularization<br />
property. B-Spl<strong>in</strong>e snakes with a very efficient<br />
computational scheme are presented <strong>in</strong> work of Jacob<br />
et al [JBU04].<br />
3 ENERGY MODEL<br />
We utilize a flexibility of snakes framework <strong>and</strong> we<br />
tried to f<strong>in</strong>d new terms which can be <strong>in</strong>corporated <strong>in</strong>to<br />
it. We based our energy model based on regions. Contours<br />
<strong>in</strong> our model are represented by B-Spl<strong>in</strong>e curves.<br />
In our first attempt we extend formula by an additional<br />
term which describes relation to the adjacent<br />
slices <strong>in</strong> <strong>CT</strong> <strong>data</strong>set. This relation is based on a shape<br />
similarity measure. We are try<strong>in</strong>g to f<strong>in</strong>d the best measure<br />
which is able to reduce unwanted behavior of the<br />
evolv<strong>in</strong>g curve.<br />
E(s) = Eregion1(s) + γ · similarity(s,sneigbour) (2)<br />
We tried to f<strong>in</strong>d how to express local high frequency<br />
changes of a shape <strong>in</strong> the similarity measure. This criterion<br />
can <strong>in</strong>dicate overflow of the contour to a adjacent<br />
area through ’bridges’ of similar <strong>in</strong>tensity. These<br />
bridges should be narrow enough to be rendered as<br />
high frequency. High frequency can rise the similarity<br />
term <strong>in</strong> our formulation (2). M<strong>in</strong>imization scheme<br />
can isolate <strong>and</strong> elim<strong>in</strong>ate them because of their significant<br />
differences. We construct shape describ<strong>in</strong>g vector<br />
as Fourier power spectrum of boundary orientation<br />
angle changes. Similarity of two shapes is equal to l2distance<br />
of their shape vectors. It is used as similarity<br />
term <strong>in</strong> (2). In [LAL03] it was shown that this similarity<br />
measure is sensitive to significant differences of<br />
correspond<strong>in</strong>g parts of curves.<br />
Simple Chan <strong>and</strong> Vese region energy scheme (1) <strong>in</strong>corporates<br />
square distance from mean, which is very<br />
rough approximation of <strong>in</strong>verted probability. Instead of<br />
this we are directly us<strong>in</strong>g probability of element classification<br />
to exterior or <strong>in</strong>terior region <strong>in</strong> fashion of<br />
[JBU04]. Furthermore we simplify weight coefficients<br />
α <strong>and</strong> β to α <strong>and</strong> (1 − α) express<strong>in</strong>g balance between<br />
exterior <strong>and</strong> <strong>in</strong>terior. It has only little importance <strong>in</strong> the<br />
new scheme.<br />
<br />
Eregion2(s) = −α<br />
<strong>in</strong>t(s)<br />
<br />
(1 − α)<br />
log(P<strong>in</strong>t( f )) −<br />
ext(s)<br />
log(Pext( f )) (3)<br />
Probability <strong>in</strong> (3) can be approximated by normal distribution<br />
from analysis of <strong>in</strong>itial shape position. We<br />
can also completely rely on user’s <strong>in</strong>itial <strong>in</strong>put <strong>and</strong> use<br />
normalized <strong>and</strong> optionally smoothed histogram of areas<br />
(<strong>in</strong>terior, exterior) as our probability distributions.<br />
There are other <strong>in</strong>terest<strong>in</strong>g region-based energy <strong>models</strong><br />
<strong>in</strong>troduced <strong>in</strong> [JTW99].<br />
Eregion3(s) = − 1<br />
2 (ρ2 <strong>in</strong>t − ρ 2 ext) 2<br />
Eregion4(s) = − 1<br />
2 (µ2 <strong>in</strong>t − µ 2 ext) 2<br />
(4)<br />
(5)<br />
M<strong>in</strong>imization itself can be achieved by the gradient<br />
descent method. Partial derivatives of functional E by<br />
parameters x of the contour are the only terms to compute.<br />
sn+1 = sn + δ · ∇xE(s(x)) (6)<br />
These parameters are <strong>in</strong> our case identical to control<br />
po<strong>in</strong>ts of B-Spl<strong>in</strong>e curve. The most important feature<br />
of the region-based snake <strong>segmentation</strong> is possibility<br />
of reduc<strong>in</strong>g computational complexity from comput<strong>in</strong>g<br />
an area <strong>in</strong>tegral to comput<strong>in</strong>g a curve <strong>in</strong>tegral us<strong>in</strong>g<br />
Green’s theorem.<br />
We did not follow an example of [CV01] add<strong>in</strong>g more<br />
then two types of energy functionals. It encounters