AK Tobacco Facts - Alaska Department of Health and Social ...
AK Tobacco Facts - Alaska Department of Health and Social ...
AK Tobacco Facts - Alaska Department of Health and Social ...

Create successful ePaper yourself
Turn your PDF publications into a flip-book with our unique Google optimized e-Paper software.
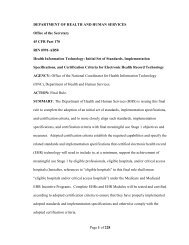
<strong>Alaska</strong><br />
<strong>Tobacco</strong> <strong>Facts</strong><br />
The impact <strong>of</strong> tobacco on the lives<br />
<strong>of</strong> <strong>Alaska</strong>’s people.<br />
%<br />
September, 2009, Update
<strong>Alaska</strong><br />
<strong>Tobacco</strong><br />
<strong>Facts</strong><br />
2009 Update<br />
Sean Parnell, Governor<br />
William H. Hogan, MS, Commissioner, <strong>Department</strong> <strong>of</strong> <strong>Health</strong> <strong>and</strong> <strong>Social</strong> Services<br />
Deborah L. Erickson, Acting Director, Division <strong>of</strong> Public <strong>Health</strong><br />
Kathy Allely, MPH, Section Chief, Chronic Disease Prevention & <strong>Health</strong> Promotion<br />
Suggested Citation:<br />
http://www.hss.state.ak.us/DPH/chronic/tobacco/alaska_tobacco_facts.pdf<br />
Copyright Information:<br />
All material in this document is in the public domain <strong>and</strong> may be reproduced or copied<br />
without permission; citation as to source, however, is appreciated.<br />
<strong>Alaska</strong> <strong>Tobacco</strong> <strong>Facts</strong>, 2009 Update
Acknowledgements<br />
<strong>Tobacco</strong> <strong>Facts</strong> was commissioned by the <strong>Tobacco</strong> Prevention <strong>and</strong> Control Program,<br />
Section <strong>of</strong> Chronic Disease Prevention <strong>and</strong> <strong>Health</strong> Promotion, Division <strong>of</strong> Public <strong>Health</strong>,<br />
<strong>Alaska</strong> <strong>Department</strong> <strong>of</strong> <strong>Health</strong> <strong>and</strong> <strong>Social</strong> Services. Major contributors to the<br />
development <strong>of</strong> this report include Erin Peterson, MPH from the <strong>Tobacco</strong> Prevention<br />
<strong>and</strong> Control Program, Kathy Pickle, MPH <strong>and</strong> Chris Bushore, both from Program Design<br />
<strong>and</strong> Evaluation Services in Portl<strong>and</strong>, Oregon.<br />
We would like to acknowledge the following individuals <strong>and</strong> organizations for their<br />
contributions to this report:<br />
<strong>Alaska</strong> <strong>Department</strong> <strong>of</strong> <strong>Health</strong> <strong>and</strong> <strong>Social</strong> Services<br />
Division <strong>of</strong> Public <strong>Health</strong><br />
Section <strong>of</strong> Chronic Disease Prevention <strong>and</strong> <strong>Health</strong> Promotion<br />
Charles Utermohle, PhD, Programmer/Analyst<br />
Rebecca Wells, SM, <strong>Alaska</strong> BRFSS Coordinator<br />
Section <strong>of</strong> Women’s, Children’s, <strong>and</strong> Family <strong>Health</strong><br />
Kathy Perham-Hester, MS, MPH, <strong>Alaska</strong> PRAMS Coordinator<br />
Bureau <strong>of</strong> Vital Statistics<br />
Phillip Mitchell, MS, Section Chief<br />
Division <strong>of</strong> Behaviorial <strong>Health</strong><br />
Joe Darnell, Chief Investigator, <strong>Tobacco</strong> Enforcement <strong>and</strong> Youth<br />
Education<br />
<strong>Alaska</strong> <strong>Department</strong> <strong>of</strong> Revenue<br />
Tax Division<br />
Johanna Bales, CPA, Revenue Audit Supervisor<br />
Janis Hales, BA, Tax Auditor<br />
<strong>Alaska</strong> <strong>Tobacco</strong> <strong>Facts</strong>, 2009 Update i
Table <strong>of</strong> Contents<br />
Table <strong>of</strong> Contents ............................................................................................................ 2<br />
1. Introduction ................................................................................................................. 2<br />
2. Cigarette Consumption................................................................................................ 3<br />
3. <strong>Tobacco</strong>-Related Deaths <strong>and</strong> Economic Costs ........................................................... 4<br />
4. Adult Smoking ............................................................................................................. 5<br />
5. Adult Smokeless <strong>Tobacco</strong> Use ................................................................................. 16<br />
6. Youth Cigarette Smoking .......................................................................................... 20<br />
7. Youth Cigar Use ........................................................................................................ 25<br />
8. Youth Smokeless <strong>Tobacco</strong> Use ................................................................................ 27<br />
9. Youth Access to <strong>Tobacco</strong>.......................................................................................... 29<br />
10. <strong>Tobacco</strong> Use During Pregnancy.............................................................................. 31<br />
11. Secondh<strong>and</strong> Smoke ................................................................................................ 34<br />
12. <strong>Alaska</strong> <strong>Tobacco</strong> Prevention <strong>and</strong> Control Program................................................... 39<br />
13. Trend Tables ........................................................................................................... 44<br />
14. Data Sources .......................................................................................................... 48<br />
<strong>Alaska</strong> <strong>Tobacco</strong> <strong>Facts</strong>, 2009 Update ii
1. Introduction<br />
In 2004, the <strong>Alaska</strong> Division <strong>of</strong> Public <strong>Health</strong> produced <strong>Tobacco</strong> in the Great L<strong>and</strong><br />
(www.epi.hss.state.ak.us/pubs/tobacc<strong>of</strong>eb04.pdf), a monograph intended to provide the<br />
reader with a comprehensive review <strong>of</strong> data related to tobacco use <strong>and</strong> its consequences<br />
in <strong>Alaska</strong>. <strong>Alaska</strong> <strong>Tobacco</strong> <strong>Facts</strong> is designed to be a brief, annual update to <strong>Tobacco</strong> in<br />
the Great L<strong>and</strong> that can be used to educate <strong>Alaska</strong>ns about the toll that tobacco<br />
continues to take on the health <strong>and</strong> well-being <strong>of</strong> our citizens.<br />
Trends in tobacco use are measured from the baseline year <strong>of</strong> 1996, prior to two early<br />
events in tobacco prevention <strong>and</strong> control in <strong>Alaska</strong>: the tobacco tax increase in 1997 <strong>and</strong><br />
<strong>Alaska</strong>’s decision to join in the national multi-state <strong>Tobacco</strong> Master Settlement Agreement<br />
in 1998. Differences are noted where there is statistical significance (p < .05).<br />
The following are highlights from <strong>Alaska</strong> <strong>Tobacco</strong> <strong>Facts</strong>, 2009 Update:<br />
• Per adult cigarette consumption declined 48% from State Fiscal Year (SFY) 1996<br />
to SFY 2008; 405 million fewer cigarettes were sold in 2008 compared to 1996.<br />
• In 2007, tobacco use cost <strong>Alaska</strong>ns $314 million in direct medical expenditures <strong>and</strong><br />
an additional $177 million in lost productivity due to tobacco-related deaths.<br />
• The percentage <strong>of</strong> adult smokers in <strong>Alaska</strong> has declined by one-fifth since<br />
1996 to 21.5 percent in 2007, a statistically significant decrease.<br />
• <strong>Alaska</strong> Native adults are twice as likely to smoke as non-Native adults.<br />
• <strong>Alaska</strong>ns with less education, with lower incomes, <strong>and</strong> who live in rural areas <strong>of</strong> the<br />
state also smoke more than their peers.<br />
• The majority <strong>of</strong> <strong>Alaska</strong>n adults who currently smoke want to quit; three out <strong>of</strong> five<br />
tried to quit in the last 12 months.<br />
• Smoking among high school students has dropped from 36.5% in 1995 to 17.8% in<br />
2007.<br />
• Although they are still more than twice as likely to smoke as students <strong>of</strong> other racial<br />
backgrounds, <strong>Alaska</strong> Native high school students were also the only group to show<br />
a decrease in smoking between 2003 (44.2%) <strong>and</strong> 2007 (31.7%).<br />
• Eight out <strong>of</strong> ten smokers believe that secondh<strong>and</strong> smoke is harmful <strong>and</strong> nearly as<br />
many agree that people should be protected from secondh<strong>and</strong> smoke.<br />
<strong>Alaska</strong> <strong>Tobacco</strong> <strong>Facts</strong>, 2009 Update 2
Cigarette Packs Per Adult<br />
2. Cigarette Consumption<br />
Annual Per Adult Sales <strong>of</strong> Cigarette Packs, By Fiscal Year,<br />
150<br />
120<br />
90<br />
60<br />
30<br />
0<br />
<strong>Alaska</strong> <strong>and</strong> US (minus <strong>Alaska</strong>), 1996-2008<br />
128.6<br />
116.7<br />
1996<br />
1997<br />
1998<br />
1999<br />
<strong>Alaska</strong><br />
US<br />
Fiscal Year<br />
78.4<br />
67.4<br />
2000<br />
2001<br />
2002<br />
2003<br />
2004<br />
2005<br />
2006<br />
2007<br />
2008<br />
Sources: <strong>Alaska</strong> <strong>Department</strong> <strong>of</strong> Revenue, Tax Division FY08 Reports;<br />
Orzechowski & Walker, The Tax Burden on <strong>Tobacco</strong>, 2007.<br />
• Between State Fiscal Years (SFY) 1996 <strong>and</strong> 2008, the per adult number <strong>of</strong><br />
cigarette packs sold in <strong>Alaska</strong> dropped 48%, from 128.6 packs to 67.4 packs per<br />
adult.<br />
• This drop in cigarette sales translates to 405 million fewer cigarettes sold in <strong>Alaska</strong><br />
in 2008 compared to 1996.<br />
<strong>Alaska</strong> <strong>Tobacco</strong> <strong>Facts</strong>, 2009 Update 3
3. <strong>Tobacco</strong>-Related Deaths <strong>and</strong> Economic Costs<br />
600<br />
500<br />
400<br />
300<br />
Number <strong>of</strong> Deaths Due to Selected Causes,<br />
507<br />
<strong>Alaska</strong>, 2006<br />
200<br />
132<br />
100<br />
84<br />
44<br />
0<br />
15 10<br />
<strong>Tobacco</strong> Suicide Motor Liver Homicide HIV/AIDS<br />
Use Vehicle Disease/<br />
(Direct) Crash Cirrhosis<br />
Sources: <strong>Alaska</strong> Bureau <strong>of</strong> Vital Statistics (2006 deaths); <strong>Alaska</strong> Behavioral Risk Factor<br />
Surveillance System (smoking prevalence); CDC, Smoking Attributable Morbidity, Mortality,<br />
<strong>and</strong> Economic Costs.*<br />
• More <strong>Alaska</strong>ns die annually from the effects <strong>of</strong> tobacco use than from suicide,<br />
motor vehicle crashes, chronic liver disease <strong>and</strong> cirrhosis, homicide, <strong>and</strong><br />
HIV/AIDS combined.<br />
• An additional estimated 120 <strong>Alaska</strong>ns die each year from lung cancer <strong>and</strong> heart<br />
disease caused by exposure to secondh<strong>and</strong> smoke. *<br />
• In 2007, tobacco use cost <strong>Alaska</strong>ns an estimated $314 million annually in direct<br />
medical expenditures <strong>and</strong> an additional $177 million annually in lost productivity<br />
due to tobacco-related deaths.<br />
• This sums to an astounding $491 million; yet it underestimates total costs; lost<br />
productivity from tobacco-related illness <strong>and</strong> costs due to second-h<strong>and</strong> smoke<br />
exposure-related illness or death are not included.<br />
*<br />
See Section 13: Data Sources, pp 48-49 for information on how smoking-attributable <strong>and</strong> secondh<strong>and</strong> smokeattributable<br />
deaths were estimated.<br />
<strong>Alaska</strong> <strong>Tobacco</strong> <strong>Facts</strong>, 2009 Update 4
Percentage Who Smoke<br />
50%<br />
40%<br />
30%<br />
20%<br />
10%<br />
0%<br />
4. Adult Smoking<br />
Percentage <strong>of</strong> Adults Who Smoke, by Year<br />
<strong>Alaska</strong> <strong>and</strong> US, 1996-2007<br />
27.7%<br />
24.7%<br />
<strong>Alaska</strong><br />
US<br />
21.5%<br />
19.7%<br />
1996 1997 1998 1999 2000 2001 2002 2003 2004 2005 2006 2007<br />
Sources: <strong>Alaska</strong> Behavioral Risk Factor Surveillance System, St<strong>and</strong>ard BRFSS Survey<br />
(1996-2003), combined Modified <strong>and</strong> St<strong>and</strong>ard BRFSS Surveys (2004-2007); National<br />
<strong>Health</strong> Interview Survey<br />
• Smoking prevalence has declined significantly from 27.7% in 1996 to 21.5% in<br />
2007.<br />
• Among women, the proportion <strong>of</strong> smokers decreased significantly from 24.2%<br />
in 1996 to 18.9% in 2007.<br />
• Among men, the decline in smoking was not significant.<br />
• Men continue to be significantly more likely than women to be smokers; in<br />
2007, 24.0% <strong>of</strong> <strong>Alaska</strong>n men vs. 18.9% <strong>of</strong> <strong>Alaska</strong>n women were current<br />
smokers.<br />
<strong>Alaska</strong> <strong>Tobacco</strong> <strong>Facts</strong>, 2009 Update 5
Smoking Status <strong>of</strong> Adults, <strong>Alaska</strong>, 2007<br />
Never<br />
Smokers<br />
52%<br />
Current<br />
Smokers<br />
21%<br />
Former<br />
Smokers<br />
27%<br />
Source: <strong>Alaska</strong> Behavioral Risk Factor Surveillance System, combined Modified <strong>and</strong><br />
St<strong>and</strong>ard BRFSS Surveys<br />
• As the proportion <strong>of</strong> smokers decreases, the proportion <strong>of</strong> <strong>Alaska</strong>ns who have<br />
never been smokers has increased from 46.3% in 1996 to 51.7% in 2007.<br />
• Although proportion <strong>of</strong> former smokers among all <strong>Alaska</strong>n adults has remained<br />
at about a quarter <strong>of</strong> the population, among <strong>Alaska</strong>ns who have ever been<br />
smokers, the proportion <strong>of</strong> former smokers increased from 48.4% in 1996 to<br />
55.5% in 2007.<br />
• Being able to stay quit for 3 or more months greatly increases the chances <strong>of</strong><br />
quitting tobacco for life. Among recent smokers--those who smoked in the past<br />
year, the proportion that have successfully remained quit for 3 or more months<br />
has increased from 5.5% in 2001 to 9.1% in 2007.<br />
Note: Questions in the <strong>Alaska</strong> Behavioral Risk Factor Surveillance System about when<br />
former smokers last smoked changed in 2001, <strong>and</strong> data from earlier years are not<br />
comparable.<br />
<strong>Alaska</strong> <strong>Tobacco</strong> <strong>Facts</strong>, 2009 Update 6
Percentage <strong>of</strong> Adults Who Smoke, by Age Group, <strong>Alaska</strong>,<br />
2007<br />
Percentage Who Smoke<br />
50%<br />
40%<br />
30%<br />
20%<br />
10%<br />
0%<br />
29%<br />
22%<br />
25%<br />
21%<br />
24%<br />
16%<br />
9%<br />
All 18-24 25-34 35-44 45-54 55-64 65+<br />
Adults<br />
Note: Throughout this report percentages are rounded to the nearest whole number in<br />
graphs <strong>and</strong> tables in which at least one category’s prevalence estimate is based on fewer<br />
than 500 responses (per national BRFSS guidelines).<br />
Source: <strong>Alaska</strong> Behavioral Risk Factor Surveillance System, combined Modified <strong>and</strong><br />
St<strong>and</strong>ard BRFSS Surveys<br />
• Among <strong>Alaska</strong>ns between the ages <strong>of</strong> 40 to 59, smoking decreased significantly<br />
from 28.7% in 1996 to 21.6% in 2007.<br />
• Younger adults between the ages <strong>of</strong> 18 <strong>and</strong> 34 are the most likely to be<br />
smokers (27%).<br />
• More than half <strong>of</strong> all current smokers (57%) were smoking by the time they<br />
were 17 years old.<br />
<strong>Alaska</strong> <strong>Tobacco</strong> <strong>Facts</strong>, 2009 Update 7
Percentage <strong>of</strong> Adults Who Smoke, by Region, <strong>Alaska</strong>, 2007<br />
Region Percentage<br />
North/Interior 36%<br />
Southwest 34%<br />
Mat-Su Borough 26%<br />
Fairbanks (North Star) 22%<br />
Gulf Coast 20%<br />
Anchorage Borough 20%<br />
Southeast 19%<br />
All Adults 22%<br />
Source: <strong>Alaska</strong> Behavioral Risk Factor Surveillance System, combined Modified <strong>and</strong><br />
St<strong>and</strong>ard BRFSS Surveys<br />
• Residents <strong>of</strong> more rural regions in <strong>Alaska</strong> – Southwest <strong>and</strong> North/Interior<br />
Regions – are more likely than residents <strong>of</strong> other regions <strong>of</strong> <strong>Alaska</strong> to smoke.<br />
• Between 1996 <strong>and</strong> 2007, adult smoking prevalence decreased in three regions<br />
<strong>of</strong> <strong>Alaska</strong>: Anchorage (23% to 17%), Gulf Coast (29% to 20%), <strong>and</strong> Southeast<br />
(28% to 19%).<br />
• Regional groupings include:<br />
o Anchorage Borough<br />
o Mat-Su Borough<br />
o Gulf Coast – Kenai, Kodiak, <strong>and</strong> Valdez Cordova Boroughs <strong>and</strong> Census<br />
Areas (plus part <strong>of</strong> Denali)<br />
o Southeast – Yakutat, Skagway, Juneau, Sitka, Haines, Wrangell-<br />
Petersburg, Ketchikan, <strong>and</strong> Ketchikan Gateway Boroughs <strong>and</strong> Census<br />
Areas<br />
o Fairbanks (North Star) – Fairbanks North Star Borough<br />
o North/Interior – Nome, Northwest Arctic, North Slope, Yukon-Koyukuk,<br />
Southeast Fairbanks, <strong>and</strong> Denali Boroughs <strong>and</strong> Census Areas<br />
o Southwest – Bristol Bay, East Aleutians, West Aleutians, Dillingham,<br />
Lake & Peninsula, Bethel, <strong>and</strong> Wade Hampton Boroughs <strong>and</strong> Census<br />
Areas (plus part <strong>of</strong> Yukon-Koyukuk)<br />
<strong>Alaska</strong> <strong>Tobacco</strong> <strong>Facts</strong>, 2009 Update 8
Percentage <strong>of</strong> Adults Who Smoke, by Race/Ethnicity,<br />
50%<br />
40%<br />
30%<br />
20%<br />
10%<br />
0%<br />
22%<br />
41%<br />
<strong>Alaska</strong>, 2005-2007<br />
36%<br />
26%<br />
20%<br />
13%<br />
12%<br />
All Adults <strong>Alaska</strong> Pacific Hispanic White African Asian<br />
Native Isl<strong>and</strong>er American<br />
Note: The race categories <strong>of</strong> <strong>Alaska</strong> Native, African American, Asian, Pacific Isl<strong>and</strong>er, <strong>and</strong><br />
White do not include respondents <strong>of</strong> Hispanic ethnicity.<br />
Source: <strong>Alaska</strong> Behavioral Risk Factor Surveillance System, combined Modified <strong>and</strong><br />
St<strong>and</strong>ard BRFSS Surveys<br />
• In <strong>Alaska</strong>, African American adults <strong>and</strong> Asian adults are significantly less likely<br />
to smoke than adults from all other race/ethnicity groups.<br />
• <strong>Alaska</strong> Native adults are more likely to be smokers than Hispanic, White,<br />
African American, or Asian adults.<br />
• <strong>Alaska</strong>ns <strong>of</strong> Native Hawaiian or Pacific Isl<strong>and</strong>er heritage are more likely to be<br />
smokers than are White, African American, or Asian adults.<br />
• There is no significant difference in smoking prevalence between White <strong>and</strong><br />
Hispanic adults.<br />
<strong>Alaska</strong> <strong>Tobacco</strong> <strong>Facts</strong>, 2009 Update 9
Percentage Who Smoke<br />
50%<br />
30%<br />
Percentage <strong>of</strong> Adults Who Smoke, by Year<br />
<strong>Alaska</strong> Natives <strong>and</strong> Non-Natives, 1996-2007<br />
(3-year moving averages)<br />
40% 42.7% 41.1%<br />
20%<br />
10%<br />
0%<br />
24.3%<br />
<strong>Alaska</strong> Native<br />
Non-Native<br />
20.3%<br />
1996- 1997- 1998- 1999- 2000- 2001- 2002- 2003- 2004- 2005-<br />
1998 1999 2000 2001 2002 2003 2004 2005 2006 2007<br />
Source: <strong>Alaska</strong> Behavioral Risk Factor Surveillance System, combined Modified <strong>and</strong><br />
St<strong>and</strong>ard BRFSS Surveys<br />
• Smoking prevalence has remained relatively stable among <strong>Alaska</strong> Natives over<br />
the past decade; among non-Native adults, there has been a small but<br />
significant decrease in smoking from 1996 to 2007.<br />
• <strong>Alaska</strong> Native adults are currently twice as likely to smoke as non-Native<br />
<strong>Alaska</strong>n adults.<br />
<strong>Alaska</strong> <strong>Tobacco</strong> <strong>Facts</strong>, 2009 Update 10
Percentage <strong>of</strong> Adults Who Smoke, by Socio-Economic Status <strong>and</strong> Race,<br />
<strong>Alaska</strong>, 2005-2007<br />
SES Status* <strong>Alaska</strong> Natives <strong>Alaska</strong> Non-Natives Total<br />
Lower 48% 34% 38%<br />
Higher 33% 16% 18%<br />
All Adults 41% 20% 22%<br />
Source: <strong>Alaska</strong> Behavioral Risk Factor Surveillance System, combined Modified <strong>and</strong><br />
St<strong>and</strong>ard BRFSS Surveys<br />
*Lower SES is calculated as those persons with less than a High School education or less<br />
than 185% <strong>of</strong> the <strong>Alaska</strong> Poverty Level Guideline.<br />
• Nearly half (42%) <strong>of</strong> adult smokers live in households earning less than 185% <strong>of</strong><br />
the <strong>Alaska</strong> Poverty Level Guideline.<br />
Source: <strong>Alaska</strong> Behavioral Risk Factor Surveillance System, combined Modified <strong>and</strong><br />
St<strong>and</strong>ard BRFSS Surveys, 2007<br />
• Although unemployed adults <strong>and</strong> those who are unable to work comprise about<br />
11% <strong>of</strong> the overall adult population, they are disproportionately likely to smoke;<br />
43% <strong>of</strong> unemployed adults <strong>and</strong> 46% <strong>of</strong> those who are unable to work are smokers,<br />
compared to 20% <strong>of</strong> employed adults who smoke.<br />
Source: <strong>Alaska</strong> Behavioral Risk Factor Surveillance System, combined Modified <strong>and</strong><br />
St<strong>and</strong>ard BRFSS Surveys, 2007<br />
<strong>Alaska</strong> <strong>Tobacco</strong> <strong>Facts</strong>, 2009 Update 11
Percentage <strong>of</strong> Adults Who Smoke, by Education <strong>and</strong> Race,<br />
<strong>Alaska</strong>, 2005-2007<br />
<strong>Alaska</strong> <strong>Alaska</strong> Non-<br />
Education Level<br />
Natives Natives Total<br />
Less than high school graduate 45% 45% 45%<br />
High school graduate or GED 45% 29% 33%<br />
Some college 36% 21% 23%<br />
College graduate 27% 9% 10%<br />
All Adults 41% 20% 23%<br />
Source: <strong>Alaska</strong> Behavioral Risk Factor Surveillance System, combined Modified <strong>and</strong><br />
St<strong>and</strong>ard BRFSS Surveys<br />
Percentage <strong>of</strong> Adults Who Smoke, by Income <strong>and</strong> Race,<br />
<strong>Alaska</strong>, 2005-2007<br />
Household Income Level <strong>Alaska</strong> Natives<br />
<strong>Alaska</strong> Non-<br />
Natives Total<br />
Less than $15,000 49% 39% 43%<br />
$15,000 - $24,999 49% 31% 35%<br />
$25,000 - $49,000 45% 25% 28%<br />
$50,000 - $74,000 37% 17% 18%<br />
$75,000 or more 21% 13% 14%<br />
All Adults 42% 20% 23%<br />
Source: <strong>Alaska</strong> Behavioral Risk Factor Surveillance System, combined Modified <strong>and</strong><br />
St<strong>and</strong>ard BRFSS Surveys<br />
• <strong>Alaska</strong>ns with fewer years <strong>of</strong> education <strong>and</strong>/or lower household income are more<br />
likely to be smokers; this pattern is true for both <strong>Alaska</strong> Native <strong>and</strong> non-Native<br />
adults.<br />
Source: <strong>Alaska</strong> Behavioral Risk Factor Surveillance System, combined Modified <strong>and</strong><br />
St<strong>and</strong>ard BRFSS Surveys, 2005-2007<br />
<strong>Alaska</strong> <strong>Tobacco</strong> <strong>Facts</strong>, 2009 Update 12
Percentage Who Smoke Every Day<br />
(among smokers)<br />
Percentage <strong>of</strong> Adult Smokers Who Smoke Every Day, by Year<br />
100%<br />
80%<br />
60%<br />
40%<br />
20%<br />
0%<br />
81.7%<br />
78.4%<br />
<strong>Alaska</strong> <strong>and</strong> United States, 1996-2007<br />
<strong>Alaska</strong><br />
US<br />
78.0%<br />
71.0%<br />
1996 1997 1998 1999 2000 2001 2002 2003 2004 2005 2006 2007<br />
Sources: <strong>Alaska</strong> Behavioral Risk Factor Surveillance System, St<strong>and</strong>ard Survey (1996-<br />
2003), combined Modified <strong>and</strong> St<strong>and</strong>ard BRFSS Surveys (2004-2007); National <strong>Health</strong><br />
Interview Survey<br />
• The proportion <strong>of</strong> <strong>Alaska</strong>n smokers who smoke every day has remained about<br />
the same since 1996; roughly 7 out <strong>of</strong> 10 smoke daily.<br />
<strong>Alaska</strong> <strong>Tobacco</strong> <strong>Facts</strong>, 2009 Update 13
Percentage <strong>of</strong> Adult Smokers Who Smoke Every Day, by Year<br />
Percentage Who Smoke Every Day<br />
(among smokers)<br />
100%<br />
<strong>Alaska</strong> Natives <strong>and</strong> Non-Natives, 1996-2007<br />
80%<br />
82%<br />
(3-Year moving averages)<br />
72%<br />
71%<br />
60% 66%<br />
40%<br />
20% <strong>Alaska</strong> Native<br />
Non-Native<br />
0%<br />
1996- 1997- 1998- 1999- 2000- 2001- 2002- 2003- 2004- 2005-<br />
1998 1999 2000 2001 2002 2003 2004 2005 2006 2007<br />
Source: <strong>Alaska</strong> Behavioral Risk Factor Surveillance System, St<strong>and</strong>ard Survey (1996-2003),<br />
combined Modified <strong>and</strong> St<strong>and</strong>ard BRFSS Surveys (2004-2007)<br />
• Compared to non-Native adult smokers in <strong>Alaska</strong>, <strong>Alaska</strong> Native adult smokers have<br />
consistently been less likely to smoke every day.<br />
• The proportion <strong>of</strong> non-Native adult smokers who smoke daily has significantly<br />
decreased since 2007.<br />
<strong>Alaska</strong> <strong>Tobacco</strong> <strong>Facts</strong>, 2009 Update 14
Percentage <strong>of</strong> Adult Smokers Endorsing Key Cessation Variables<br />
Aware <strong>of</strong> Quit Line<br />
<strong>Alaska</strong>, 2007<br />
30%<br />
66%<br />
Doctor Advised I Quit* 63%<br />
Want to Quit 65%<br />
Plan to Quit w/in 30 Days<br />
Attempted to Quit 61%<br />
0% 20% 40% 60% 80% 100%<br />
Percentage (among smokers)<br />
Sources: <strong>Alaska</strong> Behavioral Risk Factor Surveillance System, Modified Survey (except for<br />
‘Attempted to Quit’ which was based on data from combined Modified <strong>and</strong> St<strong>and</strong>ard BRFSS<br />
Surveys)<br />
*Among current smokers who had a health care visit in the past 12 months.<br />
• Two thirds <strong>of</strong> <strong>Alaska</strong>ns who currently smoke (65%) want to quit.<br />
• Three out <strong>of</strong> five current smokers (61%) have attempted to quit in the past 12<br />
months; quit attempts were made by over half <strong>of</strong> those who smoke every day<br />
(55%) <strong>and</strong> three quarters <strong>of</strong> those who smoke some days (74%).<br />
• Quit attempts among <strong>Alaska</strong> Native people who currently smoke have<br />
increased from 59% in 2001 to 70% in 2007.<br />
• The proportion <strong>of</strong> <strong>Alaska</strong>n smokers who had a health care visit in the past 12<br />
months <strong>and</strong> received advice from their health care provider to quit has<br />
decreased from 73% in 2001 to 63% in 2007.<br />
<strong>Alaska</strong> <strong>Tobacco</strong> <strong>Facts</strong>, 2009 Update 15
5. Adult Smokeless <strong>Tobacco</strong> Use<br />
Percentage <strong>of</strong> Adults Who Use Smokeless <strong>Tobacco</strong>, by Year<br />
Percentage Who Use Smokeless <strong>Tobacco</strong><br />
25%<br />
20%<br />
15%<br />
10%<br />
5%<br />
0%<br />
4.1%<br />
<strong>Alaska</strong>, 1996-2007<br />
5.1%<br />
1996 1997 1998 1999 2000 2001 2002 2003 2004 2005 2006 2007<br />
Note: NA = Data not available.<br />
Source: <strong>Alaska</strong> Behavioral Risk Factor Surveillance System, St<strong>and</strong>ard Survey (1996-2002),<br />
Modified Survey (2004), combined St<strong>and</strong>ard <strong>and</strong> Modified Surveys (2005-07)<br />
• Use <strong>of</strong> smokeless tobacco in <strong>Alaska</strong> has remained stable over the past twelve<br />
years.<br />
Source: <strong>Alaska</strong> Behavioral Risk Factor Surveillance System.<br />
• Nationally, an estimated 3% <strong>of</strong> adults are current smokeless tobacco users; with<br />
use much higher among men (6%) than women (0.4%).<br />
Source: Substance Abuse <strong>and</strong> Mental <strong>Health</strong> Services Administration. Results From the 2005 National<br />
Survey on Drug Use <strong>and</strong> <strong>Health</strong>: Detailed Tables. Rockville, MD: Substance Abuse <strong>and</strong> Mental <strong>Health</strong><br />
Services Administration, Office <strong>of</strong> Applied Studies; 2006.<br />
• Smokeless tobacco use is a known cause <strong>of</strong> cancer <strong>of</strong> the mouth <strong>and</strong> gum, <strong>and</strong> is<br />
linked to oral health problems like periodontitis <strong>and</strong> tooth loss.<br />
Source: International Agency for Research on Cancer (IARC). Summaries <strong>and</strong> Evaluations <strong>Tobacco</strong><br />
Products, Smokeless (Group 1); February 1998.<br />
<strong>Alaska</strong> <strong>Tobacco</strong> <strong>Facts</strong>, 2009 Update 16
Percentage <strong>of</strong> Adults Who Use Smokeless <strong>Tobacco</strong>, by Age Group<br />
Percentage Who Use<br />
Smokeless <strong>Tobacco</strong><br />
25%<br />
20%<br />
15%<br />
10%<br />
5%<br />
0%<br />
5% 5%<br />
<strong>Alaska</strong>, 2006-2007<br />
8%<br />
7%<br />
4%<br />
3%<br />
1%<br />
All 18-24 25-34 35-44 45-54 55-64 65+<br />
Adults<br />
Age Group<br />
Source: <strong>Alaska</strong> Behavioral Risk Factor Surveillance System, Combined Surveys<br />
Percentage <strong>of</strong> Adults Who Use Smokeless <strong>Tobacco</strong>, by Region<br />
<strong>Alaska</strong>, 2006-2007<br />
BRFSS Region Percentage<br />
Southwest 23%<br />
North/Interior 6%<br />
Gulf Coast 6%<br />
Southeast 4%<br />
Fairbanks <strong>and</strong> Vicinity 4%<br />
Anchorage <strong>and</strong> Vicinity 3%<br />
All Adults 5%<br />
Source: <strong>Alaska</strong> Behavioral Risk Factor Surveillance System, Combined Surveys<br />
• Younger <strong>Alaska</strong>ns ages 18-44 are significantly more likely to use smokeless<br />
tobacco than those who are aged 45 <strong>and</strong> older.<br />
• <strong>Alaska</strong>ns in the Southwest Region are significantly more likely to use smokeless<br />
tobacco than those in any other region.<br />
<strong>Alaska</strong> <strong>Tobacco</strong> <strong>Facts</strong>, 2009 Update 17
Percentage Who Use<br />
Smokeless <strong>Tobacco</strong><br />
Percentage <strong>of</strong> Adults Who Use Smokeless <strong>Tobacco</strong>, by Year<br />
25%<br />
20%<br />
15%<br />
10%<br />
5%<br />
0%<br />
1996-1998<br />
<strong>Alaska</strong> Natives <strong>and</strong> Non-Natives, 1996-2007<br />
12.4%<br />
4.0%<br />
1997-1999<br />
1998-2000<br />
(Multi-year averages)<br />
1999-2001<br />
2000-2002<br />
<strong>Alaska</strong> Native<br />
Non-Native<br />
2001-2002<br />
2002&2004<br />
2004-2005<br />
2005-2006<br />
2006-2007<br />
Notes: Due to missing data for 2003, the last five time points are 2-year averages.<br />
11.6%<br />
3.8%<br />
Source: <strong>Alaska</strong> Behavioral Risk Factor Surveillance System, St<strong>and</strong>ard Survey (1996-2002),<br />
Modified Survey (2004), combined St<strong>and</strong>ard <strong>and</strong> Modified Surveys (2005-07)<br />
Percentage <strong>of</strong> Adults Who Use Smokeless <strong>Tobacco</strong>, by Sex<br />
<strong>Alaska</strong> Natives <strong>and</strong> Non-Natives, 2006-2007 Combined<br />
<strong>Alaska</strong> Native Non-Native Total<br />
Men 14.8% 7.2% 8.3%<br />
Women 8.1% 0.1% 1.3%<br />
Total 11.6% 3.8% 4.9%<br />
Source: <strong>Alaska</strong> Behavioral Risk Factor Surveillance System, combined Surveys<br />
• Adult <strong>Alaska</strong> Natives use smokeless tobacco more than adult non-Natives, <strong>and</strong><br />
men use smokeless tobacco more than women.<br />
<strong>Alaska</strong> <strong>Tobacco</strong> <strong>Facts</strong>, 2009 Update 18
Type <strong>of</strong> Smokeless <strong>Tobacco</strong> Used by Adults, <strong>Alaska</strong>, 2006-2007<br />
Multiple Types<br />
7%<br />
Iq'Mik<br />
14%<br />
Snuff<br />
28%<br />
Other<br />
3%<br />
Source: <strong>Alaska</strong> Behavioral Risk Factor Surveillance System, Modified Survey<br />
Chewing<br />
<strong>Tobacco</strong><br />
48%<br />
• Approximately half <strong>of</strong> adult <strong>Alaska</strong>ns who are using smokeless tobacco report<br />
using “chewing tobacco” alone; chewing tobacco accounts for 26% <strong>of</strong> <strong>Alaska</strong><br />
Native <strong>and</strong> 59% <strong>of</strong> non-Native smokeless tobacco use.<br />
• Fourteen percent <strong>of</strong> adults who use smokeless tobacco—40% <strong>of</strong> <strong>Alaska</strong> Native<br />
users—are using tobacco in the form <strong>of</strong> Iq’mik or Blackbull, which is leaf tobacco<br />
mixed with ash created from burning a common tree fungus (i.e., “punk ash”).<br />
<strong>Alaska</strong> <strong>Tobacco</strong> <strong>Facts</strong>, 2009 Update 19
6. Youth Cigarette Smoking<br />
Percentage <strong>of</strong> High School Students Who Smoke, by Sex <strong>and</strong> Year<br />
Percentage Who Smoke<br />
50%<br />
40%<br />
30%<br />
20%<br />
10%<br />
0%<br />
<strong>Alaska</strong>, 1995, 2003 <strong>and</strong> 2007<br />
36.5% 36.4%<br />
19.2% 18.4%<br />
17.8%<br />
15.9%<br />
All Students Boys<br />
Source: <strong>Alaska</strong> Youth Risk Behavior Survey<br />
36.5%<br />
Girls<br />
1995<br />
2003<br />
2007<br />
20.2% 19.7%<br />
• Smoking among high school students dropped from 36.5% in 1995 to 17.8% in<br />
2007.<br />
• This decrease means that there are approximately 8,200 fewer youth smokers in<br />
2007 than there were in 1995.<br />
Note: Population numbers used to calculate the number fewer smokers are from 2000<br />
Census, ages 14 to 17.<br />
<strong>Alaska</strong> <strong>Tobacco</strong> <strong>Facts</strong>, 2009 Update 20
Percentage Who Smoke<br />
80%<br />
60%<br />
40%<br />
20%<br />
0%<br />
Percentage <strong>of</strong> High School Students Who Smoke,<br />
61.9%<br />
by Race <strong>and</strong> Year<br />
<strong>Alaska</strong>, 1995, 2003 <strong>and</strong> 2007<br />
44.2%<br />
31.7% 34.4%<br />
12.4% 14.2%<br />
24.3%<br />
1995<br />
2003<br />
2007<br />
12.2%<br />
6.8%<br />
<strong>Alaska</strong> Native White Other Race<br />
Groups<br />
Source: <strong>Alaska</strong> Youth Risk Behavior Survey<br />
• Between 2003 <strong>and</strong> 2007, the decline in youth smoking was notable for <strong>Alaska</strong><br />
Native students, but did not significantly change for White or Other Race Group<br />
students.<br />
• <strong>Alaska</strong> Native high school students are still more than twice as likely to smoke as<br />
students <strong>of</strong> other racial/ethnic backgrounds, but the gap has decreased<br />
considerably since 2003.<br />
• Among <strong>Alaska</strong> Native high school boys, frequent smoking – 20 or more days in the<br />
past month – decreased from 19.3% in 2003 to 8.1% in 2007.<br />
<strong>Alaska</strong> <strong>Tobacco</strong> <strong>Facts</strong>, 2009 Update 21
Percentage <strong>of</strong> High School Students Who Smoke, by Grade <strong>and</strong> Year<br />
Percentage Who Smoke<br />
50%<br />
40%<br />
30%<br />
20%<br />
10%<br />
0%<br />
30.8%<br />
<strong>Alaska</strong>, 1995, 2003 <strong>and</strong> 2007<br />
13.3%<br />
12.1%<br />
1995 2003 2007<br />
38.1%<br />
40.5% 40.7%<br />
24.8%<br />
21.7% 21.3% 21.9%<br />
19.3% 19.1%<br />
9th 10th 11th 12th<br />
Source: <strong>Alaska</strong> Youth Risk Behavior Survey<br />
Grade<br />
• Between 1995 <strong>and</strong> 2007, declines in youth smoking were in seen in each high<br />
school grade level.<br />
<strong>Alaska</strong> <strong>Tobacco</strong> <strong>Facts</strong>, 2009 Update 22
Percentage <strong>of</strong> High School Students Who Smoke, by Sex <strong>and</strong> Grade<br />
<strong>Alaska</strong>, 2007<br />
9th Grade 10th Grade 11th Grade 12th Grade Total<br />
Girls 12.5% 21.4% 20.6% 25.9% 19.7%<br />
Boys 11.9% 17.3% 17.8% 18.0% 15.9%<br />
Total 12.1% 19.3% 19.1% 21.9% 17.8%<br />
Source: <strong>Alaska</strong> Youth Risk Behavior Survey<br />
Percentage <strong>of</strong> High School Students Who Smoke, by Race <strong>and</strong> Sex<br />
<strong>Alaska</strong>, 2007<br />
Girls Boys Total<br />
<strong>Alaska</strong> Native 35.8% 27.4% 31.7%<br />
White 15.7% 13.0% 14.2%<br />
Other Race Groups 4.8% 7.7% 6.8%<br />
Total 19.7% 15.9% 17.8%<br />
Source: <strong>Alaska</strong> Youth Risk Behavior Survey<br />
Percentage <strong>of</strong> High School Students Who Smoke, by Race <strong>and</strong> Grade<br />
<strong>Alaska</strong>, 2007<br />
9th Grade 10th Grade 11th Grade 12th Grade Total<br />
<strong>Alaska</strong> Native 22.1% 24.4% 37.4% 52.1% 31.7%<br />
White 8.8% 20.5% 14.3% 14.3% 14.2%<br />
Other Race Groups 3.9% 5.0% 8.1% 8.2% 6.8%<br />
Total 12.1% 19.3% 19.1% 21.9% 17.8%<br />
Source: <strong>Alaska</strong> Youth Risk Behavior Survey<br />
• In all grades, <strong>Alaska</strong> Native high school students were more likely to smoke<br />
than their White or Other Race classmates.<br />
<strong>Alaska</strong> <strong>Tobacco</strong> <strong>Facts</strong>, 2009 Update 23
Percentage <strong>of</strong> High School Students Who Started Smoking<br />
Before Age 13, by Race <strong>and</strong> Year, <strong>Alaska</strong>, 1995, 2003 <strong>and</strong> 2007<br />
Percentage <strong>of</strong> Students Who Started < Age 13<br />
80%<br />
60%<br />
40%<br />
20%<br />
0%<br />
47.0%<br />
34.2%<br />
26.0%<br />
28.1% 28.1%<br />
14.1%<br />
12.5%<br />
1995<br />
2003<br />
2007<br />
19.4%<br />
12.3%<br />
<strong>Alaska</strong> Native White Other Race<br />
Groups<br />
Source: <strong>Alaska</strong> Youth Risk Behavior Survey<br />
• Overall, the proportion <strong>of</strong> high school students who started smoking before age 13<br />
dropped from 30.7% in 1995 to 19.6% in 2003, to 16.1% in 2007.<br />
• Among currently smoking high school students, the proportion <strong>of</strong> those who started<br />
before age 13 dropped from 53.1% in 1995 to 48.2% in 2003 to 40.8% in 2007.<br />
• Over one in four <strong>Alaska</strong> Native high school students (26.0%) started smoking<br />
before age 13.<br />
<strong>Alaska</strong> <strong>Tobacco</strong> <strong>Facts</strong>, 2009 Update 24
7. Youth Cigar Use<br />
Percentage <strong>of</strong> High School Students Who Smoke Cigars or Cigarillos,<br />
Percentage Who Smoked Cigars<br />
30%<br />
25%<br />
20%<br />
15%<br />
10%<br />
by Sex <strong>and</strong> Year, <strong>Alaska</strong>, 2003 <strong>and</strong> 2007<br />
7.8%<br />
10.1%<br />
11.6%<br />
13.6%<br />
5% 3.5%<br />
0%<br />
All Students Boys Girls<br />
Source: <strong>Alaska</strong> Youth Risk Behavior Survey; question first added in 2003<br />
6.1%<br />
2003<br />
2007<br />
• Although boys are more likely to smoke cigars, the proportion smoking cigars<br />
increased significantly among girls between 2003 <strong>and</strong> 2007.<br />
• The majority <strong>of</strong> cigar smoking occurred among students who currently smoke<br />
cigarettes. Among students who smoke cigarettes, 17.5% also reported cigar use,<br />
whereas only 2.2% <strong>of</strong> students who do not smoke cigarettes reported smoking<br />
cigars.<br />
<strong>Alaska</strong> <strong>Tobacco</strong> <strong>Facts</strong>, 2009 Update 25
Percentage <strong>of</strong> High School Students Who Smoke Cigars,<br />
Percentage Who Smoke Cigars<br />
by Race <strong>and</strong> Year, <strong>Alaska</strong>, 2003 <strong>and</strong> 2007<br />
30%<br />
25%<br />
20%<br />
15%<br />
10%<br />
5%<br />
0%<br />
5.2%<br />
7.8%<br />
11.4%<br />
8.7%<br />
7.8%<br />
2003<br />
2007<br />
8.4%<br />
<strong>Alaska</strong> Native White Other Race<br />
Groups<br />
Source: <strong>Alaska</strong> Youth Risk Behavior Survey<br />
• Among <strong>Alaska</strong> Natives, Whites, <strong>and</strong> other race groups, cigar use was not<br />
significantly different for 2003 <strong>and</strong> 2007.<br />
• Across race groups, the majority <strong>of</strong> cigar smoking occurred among students<br />
who currently smoke cigarettes. Among cigarette smoking youth, 10.8% <strong>of</strong><br />
<strong>Alaska</strong> Native, 21.4% <strong>of</strong> White, <strong>and</strong> 20.6% <strong>of</strong> Other Race Group student<br />
cigarette smokers had also smoked one or more cigars in the past 30 days.<br />
<strong>Alaska</strong> <strong>Tobacco</strong> <strong>Facts</strong>, 2009 Update 26
8. Youth Smokeless <strong>Tobacco</strong> Use<br />
Percentage <strong>of</strong> High School Students Who Use Smokeless <strong>Tobacco</strong>,<br />
Percentage Who Use Smokeless <strong>Tobacco</strong><br />
30%<br />
25%<br />
20%<br />
15%<br />
10%<br />
5%<br />
0%<br />
15.6%<br />
by Sex <strong>and</strong> Year<br />
<strong>Alaska</strong>, 1995, 2003 <strong>and</strong> 2007<br />
11.2%<br />
10.4%<br />
23.5%<br />
15.6%<br />
13.5%<br />
1995<br />
2003<br />
2007<br />
7.3%<br />
6.7% 6.2%<br />
All Students Boys Girls<br />
Source: <strong>Alaska</strong> Youth Risk Behavior Survey<br />
• Overall, use <strong>of</strong> smokeless tobacco among high school students dropped from<br />
15.6% in 1995 to 10.4% in 2007, due to the decline in boys’ use <strong>of</strong> smokeless<br />
tobacco during this time.<br />
• <strong>Alaska</strong> Native girls have a higher prevalence <strong>of</strong> smokeless use (16.4%) than White<br />
(3.9%) or Other Race girls (4.2%).<br />
<strong>Alaska</strong> <strong>Tobacco</strong> <strong>Facts</strong>, 2009 Update 27
Percentage <strong>of</strong> High School Students Who Use Smokeless <strong>Tobacco</strong>, by<br />
Percentage Who Use Smokeless <strong>Tobacco</strong><br />
30%<br />
25%<br />
20%<br />
15%<br />
10%<br />
5%<br />
0%<br />
Race <strong>and</strong> Year<br />
<strong>Alaska</strong>, 1995, 2003 <strong>and</strong> 2007<br />
1995<br />
24.4% 2003<br />
22.5% 2007<br />
16.5% 16.1%<br />
8.9%<br />
8.2% 8.1%<br />
7.4% 7.2%<br />
<strong>Alaska</strong> Native White Other Race Groups<br />
Source: <strong>Alaska</strong> Youth Risk Behavior Survey<br />
• Although it appeared that there was a decrease in smokeless use among<br />
<strong>Alaska</strong> Native students between 2003 <strong>and</strong> 2007, this decrease was not<br />
significant.<br />
• Smokeless tobacco use decreased for White students between 1995 <strong>and</strong> 2003,<br />
but there was no significant change between 2003 <strong>and</strong> 2007.<br />
<strong>Alaska</strong> <strong>Tobacco</strong> <strong>Facts</strong>, 2009 Update 28
9. Youth Access to <strong>Tobacco</strong><br />
Percentage <strong>of</strong> High School Student Smokers Who Bought Their Own<br />
Cigarettes in the Past 30 Days, by Race <strong>and</strong> Year<br />
<strong>Alaska</strong>, 1995, 2003 <strong>and</strong> 2007<br />
1995 2003 2007<br />
<strong>Alaska</strong> Native 28.6% 11.5% 6.3<br />
White 27.1% 13.6% 9.0<br />
Other Race Groups 27.1% 13.6% *<br />
Total 27.1% 12.1% 7.6%<br />
Source: <strong>Alaska</strong> Youth Risk Behavior Survey<br />
• Since 1995, there has been a dramatic decrease in the proportion <strong>of</strong> high school<br />
students who report buying their own cigarettes.<br />
• In 2007, the majority <strong>of</strong> high school smokers (69.0%) got their cigarettes primarily<br />
from other people around them; 33.7% gave money to someone else to buy them,<br />
27.1% borrowed them from someone else, <strong>and</strong> 8.2% were given cigarettes by<br />
someone who was 18 or older.<br />
Source: <strong>Alaska</strong> Youth Risk Behavior Survey<br />
• Most adults (95.5%) believe it is somewhat or very important for communities to<br />
keep stores from selling tobacco products to teenagers.<br />
Source: <strong>Alaska</strong> Behavioral Risk Factor Surveillance System, Modified Survey 2006<br />
<strong>Alaska</strong> <strong>Tobacco</strong> <strong>Facts</strong>, 2009 Update 29
Percentage <strong>of</strong> Vendors Found Selling <strong>Tobacco</strong> to Minors, <strong>Alaska</strong><br />
Percentage <strong>of</strong> <strong>Tobacco</strong> Vendors in Non-Compliance<br />
50%<br />
40%<br />
30%<br />
20%<br />
10%<br />
0%<br />
34% 34%<br />
29%<br />
24%<br />
by Fiscal Year, 1996-2007<br />
36%<br />
27%<br />
Source: <strong>Alaska</strong> Synar Compliance Database.<br />
30%<br />
Synar Non-Compliance<br />
Maximum Target<br />
14%<br />
12%<br />
10% 9% 9%<br />
1996<br />
1997<br />
1998<br />
1999<br />
2000<br />
2001<br />
2002<br />
2003<br />
2004<br />
2005<br />
2006<br />
2007<br />
• Since 2003, <strong>Alaska</strong> has maintained the “20% or below” compliance rate<br />
established by the federal Synar amendment. This means fewer tobacco vendors<br />
statewide are selling tobacco products to minors compared to previous years.<br />
<strong>Alaska</strong> <strong>Tobacco</strong> <strong>Facts</strong>, 2009 Update 30
Percentage Who Smoke<br />
50%<br />
40%<br />
30%<br />
20%<br />
10%<br />
0%<br />
10. <strong>Tobacco</strong> Use During Pregnancy<br />
Prenatal Smoking (last 3 months), by Year<br />
33.0%<br />
21.6%<br />
18.2%<br />
<strong>Alaska</strong>, 1996-2006<br />
Overall<br />
<strong>Alaska</strong> Native<br />
Non-Native<br />
28.0%<br />
14.8%<br />
10.5%<br />
1996 1997 1998 1999 2000 2001 2002 2003 2004 2005 2006<br />
Source: <strong>Alaska</strong> Pregnancy Risk Assessment Monitoring System (PRAMS)<br />
• Prenatal tobacco use accounts for 20-30% <strong>of</strong> all low birth weight births in the United<br />
States. According to the 2004 Surgeon General’s Report, eliminating maternal<br />
smoking may lead to a 10% reduction in all sudden infant deaths <strong>and</strong> a 12% reduction<br />
in deaths from perinatal conditions.<br />
Source: The <strong>Health</strong> Consequences <strong>of</strong> Smoking: A Report <strong>of</strong> the Surgeon General. U.S.<br />
<strong>Department</strong> <strong>of</strong> <strong>Health</strong> <strong>and</strong> Human Services, Centers for Disease Control <strong>and</strong> Prevention,<br />
National Center for Chronic Disease Prevention <strong>and</strong> <strong>Health</strong> Promotion, Office on Smoking<br />
<strong>and</strong> <strong>Health</strong>, 2004.<br />
• In 2006, 14.8% <strong>of</strong> <strong>Alaska</strong>n women who gave birth to a live-born infant smoked during<br />
the last 3 months <strong>of</strong> their pregnancy.<br />
• Although there was a statistically significant decline in overall prenatal smoking for the<br />
1996-2006 timeframe, it was not a steady decline during the whole period; the biggest<br />
decrease occurred between 1996 <strong>and</strong> 1997, from 21.6% to 17.6%.<br />
<strong>Alaska</strong> <strong>Tobacco</strong> <strong>Facts</strong>, 2009 Update 31
Percentage Who Use Smokeless <strong>Tobacco</strong><br />
30%<br />
25%<br />
20%<br />
15%<br />
Prenatal Smokeless <strong>Tobacco</strong> Use, by Year<br />
26.7%<br />
10% 6.5%<br />
5%<br />
0%<br />
<strong>Alaska</strong>, 1996-2003<br />
Overall<br />
<strong>Alaska</strong> Native<br />
Non-Native<br />
16.9%<br />
4.5%<br />
0.3% 0.4%<br />
1996 1997 1998 1999 2000 2001 2002 2003<br />
Source: <strong>Alaska</strong> Pregnancy Risk Assessment Monitoring System (PRAMS)<br />
• Between 1996 <strong>and</strong> 2003 there was a statistically significant decline in prenatal<br />
smokeless tobacco use among <strong>Alaska</strong> Native women.<br />
• Prenatal smokeless tobacco use was more common among women who:<br />
• live in Southwest <strong>Alaska</strong> (43.0% vs. 1.4 - 6.4% for other Dept. <strong>of</strong> Labor regions,<br />
2001-2003 data)<br />
• have less than 12 years <strong>of</strong> education (8.2% vs. 6.3% <strong>of</strong> women with 12 years <strong>of</strong><br />
education <strong>and</strong> 1.5% <strong>of</strong> women with >12 years <strong>of</strong> education, 2003 data)<br />
• had their prenatal care paid for by Medicaid (7.9% vs. 1.4% <strong>of</strong> women with non-<br />
Medicaid prenatal payer sources, 2003 data)<br />
Source: <strong>Alaska</strong> Pregnancy Risk Assessment Monitoring System (PRAMS)<br />
<strong>Alaska</strong> <strong>Tobacco</strong> <strong>Facts</strong>, 2009 Update 32
Percentage Who Use Iqmik or Spit <strong>Tobacco</strong><br />
25%<br />
20%<br />
15%<br />
10%<br />
5%<br />
0%<br />
Prenatal Iqmik or Spit <strong>Tobacco</strong> Use, by Year<br />
16.6%<br />
5.0%<br />
1.2%<br />
<strong>Alaska</strong>, 2004-2006<br />
Overall<br />
2004 2005 2006<br />
Year<br />
2004 2005 2006<br />
Overall 5.0% 5.7% 3.6%<br />
<strong>Alaska</strong> Native 16.6% 20.8% 14.1%<br />
Non-Native 1.2% 0.5% 0.2%<br />
<strong>Alaska</strong> Native<br />
Non-Native<br />
14.1%<br />
3.6%<br />
0.2%<br />
Source: <strong>Alaska</strong> Pregnancy Risk Assessment Monitoring System (PRAMS)<br />
Note: Although data about smokeless tobacco use have been collected since 1996, the<br />
questions used since 2004 are substantively different than those used prior. For this<br />
reason, data since 2004 are presented separately.<br />
• In 2006, approximately 377 <strong>Alaska</strong> women used iq'mik or spit tobacco during their<br />
pregnancy that resulted in a live-born infant.<br />
• Between 2004 <strong>and</strong> 2006 there was no significant decline in prenatal iq'mik or spit<br />
tobacco use among <strong>Alaska</strong> Native women.<br />
• For the years 2004 through 2006 combined, <strong>Alaska</strong> Native women (17.1%) were 28<br />
times as likely as non-Native women (0.6%) to use iq'mik or spit tobacco prenatally.<br />
• Prenatal iq'mik or spit tobacco use is more common among women who live in<br />
Southwest <strong>Alaska</strong> (56.3% vs. 0 - 7.7% for other Dept. <strong>of</strong> Labor regions, 2004-2005<br />
data).<br />
<strong>Alaska</strong> <strong>Tobacco</strong> <strong>Facts</strong>, 2009 Update 33
11. Secondh<strong>and</strong> Smoke<br />
According to a recent report from the Surgeon General:<br />
• There is no risk-free level <strong>of</strong> secondh<strong>and</strong> smoke exposure. Even brief exposure<br />
can be dangerous.<br />
• Nonsmokers who are exposed to secondh<strong>and</strong> smoke at home or work increase<br />
their heart disease risk by 25–30% <strong>and</strong> their lung cancer risk by 20–30%.<br />
• Almost 60% <strong>of</strong> U.S. children aged 3–11 years—or almost 22 million children—are<br />
exposed to secondh<strong>and</strong> smoke.<br />
• Eliminating smoking in indoor spaces is the only way to fully protect nonsmokers<br />
from secondh<strong>and</strong> smoke exposure. Separating smokers from nonsmokers,<br />
cleaning the air, <strong>and</strong> ventilating buildings cannot eliminate secondh<strong>and</strong> smoke<br />
exposure.<br />
Source: U.S. <strong>Department</strong> <strong>of</strong> <strong>Health</strong> <strong>and</strong> Human Services. The <strong>Health</strong> Consequences <strong>of</strong><br />
Involuntary Exposure to <strong>Tobacco</strong> Smoke: A Report <strong>of</strong> the Surgeon General. Atlanta,<br />
Georgia: U.S. <strong>Department</strong> <strong>of</strong> <strong>Health</strong> <strong>and</strong> Human Services, Centers for Disease Control <strong>and</strong><br />
Prevention, Coordinating Center for <strong>Health</strong> Promotion, National Center for Chronic Disease<br />
Prevention <strong>and</strong> <strong>Health</strong> Promotion, Office on Smoking <strong>and</strong> <strong>Health</strong>, 2006 [cited 2006 Sep 27].<br />
Available from: http://www.surgeongeneral.gov/library/secondh<strong>and</strong>smoke/report/ .<br />
• Roughly 19,130 <strong>Alaska</strong>n children are exposed to secondh<strong>and</strong> smoke in their<br />
homes.<br />
Source: <strong>Alaska</strong> Behavioral Risk Factor Surveillance System, Modified Survey; <strong>Alaska</strong><br />
<strong>Department</strong> <strong>of</strong> Labor <strong>and</strong> Workforce Development Population Estimates, 2007.<br />
• More than 1 in 4 <strong>Alaska</strong>n smokers with children in the home (27.8%) reported that<br />
someone was smoking in the home in the past 30 days.<br />
• Risk <strong>of</strong> exposure to secondh<strong>and</strong> smoke for children living with smokers was higher<br />
for those aged 5 to 12 (32.7%) than for children under age 5 (13.7%).<br />
• Having a home rule against smoking inside significantly lowers the risk <strong>of</strong><br />
secondh<strong>and</strong> smoke exposure.<br />
Source: Dent, C. Assessment <strong>of</strong> Factors Related to Secondh<strong>and</strong> Smoke Exposure Among<br />
<strong>Alaska</strong>n Households With a Smoker <strong>and</strong> Children at Home. Anchorage, <strong>AK</strong>: Section <strong>of</strong><br />
Chronic Disease Prevention <strong>and</strong> <strong>Health</strong> Promotion, Division <strong>of</strong> Public <strong>Health</strong>, <strong>Alaska</strong><br />
<strong>Department</strong> <strong>of</strong> <strong>Health</strong> <strong>and</strong> <strong>Social</strong> Services; June 2007.<br />
<strong>Alaska</strong> <strong>Tobacco</strong> <strong>Facts</strong>, 2009 Update 34
Percentage <strong>of</strong> Adults Who Support Full Smoking Bans in Selected<br />
Percentage Supporting Smoking Bans<br />
100%<br />
80%<br />
60%<br />
40%<br />
20%<br />
0%<br />
Locations, by Smoking Status, <strong>Alaska</strong>, 2007<br />
78.4%<br />
59.7%<br />
All Adults<br />
Smokers<br />
75.0%<br />
56.9%<br />
89.2%<br />
82.2%<br />
Workplaces Restaurants School Grounds<br />
or Events*<br />
Ban Smoking in...<br />
Source: <strong>Alaska</strong> Behavioral Risk Factor Surveillance System, Modified Survey, 2007<br />
* Source: <strong>Alaska</strong> Behavioral Risk Factor Surveillance System, Modified Survey, 2004<br />
• Recently enacted comprehensive clean indoor air policies in Anchorage <strong>and</strong><br />
Juneau protect workers in these jurisdictions.<br />
• There is widespread support for clean indoor air policies such as smoking bans<br />
in work places, including establishments like restaurants.<br />
<strong>Alaska</strong> <strong>Tobacco</strong> <strong>Facts</strong>, 2009 Update 35
Indicators <strong>of</strong> Home Secondh<strong>and</strong> Smoke Exposure <strong>and</strong> Policy,<br />
by Select Demographics, <strong>Alaska</strong>, 2007<br />
Percentage with:<br />
No Exposure<br />
at Home a<br />
Full Smoking<br />
Ban in Home b<br />
Smoking status<br />
Non-smokers 94% 92%<br />
Smokers 68% 65%<br />
Race<br />
<strong>Alaska</strong> Native 90% 87%<br />
Non-Native 88% 86%<br />
Education level<br />
Did not graduate H.S. 78% 80%<br />
High school graduate 89% 85%<br />
Some college 85% 83%<br />
College graduate 95% 93%<br />
Household Income<br />
Less than $15,000 73% 72%<br />
$15,000-$24,999 85% 84%<br />
$25,000-$49,555 89% 85%<br />
$50,000-$74,999 89% 87%<br />
$75,000 or more 91% 90%<br />
All Adults 89% 86%<br />
a<br />
No one (including respondent) smoked anywhere inside respondent’s home in the past 30<br />
days;<br />
b<br />
Rules about smoking inside respondent’s home best described as: “Smoking is not<br />
allowed anywhere inside your home”.<br />
Source: <strong>Alaska</strong> Behavioral Risk Factor Surveillance System, Modified Survey<br />
• Non-smokers <strong>and</strong> adults with higher education or higher household income are<br />
least likely to be exposed to secondh<strong>and</strong> smoke in their homes; these same groups<br />
are also most likely to have a smoking ban in their homes.<br />
<strong>Alaska</strong> <strong>Tobacco</strong> <strong>Facts</strong>, 2009 Update 36
Indicators <strong>of</strong> Work Secondh<strong>and</strong> Smoke Exposure <strong>and</strong> Policy,<br />
by Select Demographics, <strong>Alaska</strong>, 2007<br />
Percentage with:<br />
No Exposure<br />
at Work a<br />
Full Smoking<br />
Ban at Work b<br />
Sex<br />
Men 68% 72%<br />
Women 80% 88%<br />
Smoking status<br />
Non-smokers 79% 81%<br />
Smokers 52% 68%<br />
Race<br />
<strong>Alaska</strong> Native 66% 71%<br />
Non-Native 75% 80%<br />
Education level<br />
Did not graduate H.S. 51% 67%<br />
High school graduate 65% 64%<br />
Some college 71% 82%<br />
College graduate 86% 92%<br />
Household Income<br />
Less than $15,000 52% 53%<br />
$15,000-$24,999 74% 67%<br />
$25,000-$49,555 77% 80%<br />
$50,000-$74,999 67% 77%<br />
$75,000 or more 79% 87%<br />
All Adults 74% 79%<br />
a No one (including respondent) smoked anywhere inside respondent’s workplace in the<br />
past 30 days. (Asked only <strong>of</strong> employed adults who work mostly indoors.); b Rules about<br />
smoking inside respondent’s workplace best described as: “Smoking is not allowed in any<br />
work areas”.<br />
Source: <strong>Alaska</strong> Behavioral Risk Factor Surveillance System, Modified Survey<br />
• Women <strong>and</strong> adults with higher education are least likely to be exposed to<br />
secondh<strong>and</strong> smoke in their workplaces.<br />
• Workplace smoking bans are most common among non-smokers, women, non-<br />
Natives, college graduates, <strong>and</strong> those with household incomes above $50,000.<br />
<strong>Alaska</strong> <strong>Tobacco</strong> <strong>Facts</strong>, 2009 Update 37
Percentage in Agreement<br />
Adults’ Opinions on Harm from Secondh<strong>and</strong> Smoke,<br />
100%<br />
80%<br />
60%<br />
40%<br />
20%<br />
0%<br />
by Smoking Status, <strong>Alaska</strong>, 2007<br />
89.7%<br />
All Adults Smokers<br />
81.6%<br />
84.3%<br />
75.9%<br />
Secondh<strong>and</strong> smoke is People should be protected<br />
harmful* from SHS**<br />
* Percentage who say that secondh<strong>and</strong> smoke is somewhat harmful or very harmful.<br />
** Percentage who agree or strongly agree that people should be protected from secondh<strong>and</strong> smoke.<br />
Source: <strong>Alaska</strong> Behavioral Risk Factor Surveillance System, Modified Survey 2006<br />
• Most <strong>Alaska</strong>ns—whether smokers or non-smokers—see secondh<strong>and</strong> smoke as a<br />
source <strong>of</strong> harm from which people should be protected.<br />
• How would <strong>Alaska</strong>ns respond if smoking were no longer allowed in bars?<br />
o 90% <strong>of</strong> all <strong>Alaska</strong>n adults say they would go to bars just as <strong>of</strong>ten or even<br />
more if smoking was not allowed in bars.<br />
o 72% <strong>of</strong> adult smokers in <strong>Alaska</strong> say they would go to bars just as <strong>of</strong>ten or<br />
more <strong>of</strong>ten if smoking was not allowed in bars.<br />
Source: <strong>Alaska</strong> Behavioral Risk Factor Surveillance System, Modified Survey 2007<br />
<strong>Alaska</strong> <strong>Tobacco</strong> <strong>Facts</strong>, 2009 Update 38
12. <strong>Alaska</strong> <strong>Tobacco</strong> Prevention <strong>and</strong> Control Program<br />
The State <strong>of</strong> <strong>Alaska</strong> TPC Program is located within the <strong>Department</strong> <strong>of</strong> <strong>Health</strong> & <strong>Social</strong><br />
Services, Division <strong>of</strong> Public <strong>Health</strong>, in the Section <strong>of</strong> Chronic Disease Prevention <strong>and</strong><br />
<strong>Health</strong> Promotion. In 1994, funding was received from the Centers for Disease Control<br />
<strong>and</strong> Prevention (CDC) to address the problem <strong>of</strong> tobacco use in <strong>Alaska</strong> by establishing<br />
the State <strong>of</strong> <strong>Alaska</strong> <strong>Tobacco</strong> Prevention <strong>and</strong> Control program. Since then, the tobacco<br />
prevention <strong>and</strong> control effort in <strong>Alaska</strong> has become comprehensive, involving local<br />
coalitions, nonpr<strong>of</strong>it <strong>and</strong> tribal organizations, schools, healthcare centers, state legislators,<br />
local governments, <strong>and</strong> the statewide <strong>Alaska</strong> <strong>Tobacco</strong> Control Alliance (ATCA). Funding<br />
for tobacco prevention <strong>and</strong> control work has also improved since 1994.<br />
In 1998, the State <strong>of</strong> <strong>Alaska</strong> joined 45 other states in the national multi-state <strong>Tobacco</strong><br />
Master Settlement Agreement with the tobacco industry, under which the state is entitled<br />
to receive approximately $816 million over 25 years. The settlement funds to states are<br />
intended to support tobacco prevention <strong>and</strong> cessation programs.<br />
According to CDC Best Practices for Comprehensive <strong>Tobacco</strong> Control Programs 2 ,<br />
increasing excise taxes on cigarettes reduces tobacco consumption rates. In 1997, a<br />
$0.71 per pack cigarette tax increase was implemented in <strong>Alaska</strong>, raising the tax to $1.00<br />
per pack. In 2005, the legislature implemented a progressive increase in the cigarette tax<br />
from $1.00 per pack to $2.00 per pack ($.60 in 2005 <strong>and</strong> $.20 each in 2006 <strong>and</strong> 2007).<br />
Between fiscal years 1995 <strong>and</strong> 2008, per capita taxable cigarette sales have decreased<br />
by 48%.<br />
In 2001 the <strong>Alaska</strong> State legislature established the <strong>Tobacco</strong> Use Education <strong>and</strong><br />
Cessation Fund (TUECF) under AS 37.05.580 to provide a source to finance the<br />
comprehensive smoking education, tobacco use prevention, <strong>and</strong> tobacco control program<br />
authorized by AS 44.29.020(A)(15). Each year, 20 percent <strong>of</strong> MSA funds <strong>and</strong> a portion <strong>of</strong><br />
cigarette tax revenue are to be placed into the <strong>Tobacco</strong> Use Education <strong>and</strong> Cessation<br />
Fund. The <strong>Alaska</strong> legislature authorized $8.4 million in expenditures from this fund in<br />
FY09 for use by the TPC Program.<br />
The TPC Program has four major public health goals based on recommendations from<br />
the CDC Best Practices, which also support program components to address the needs<br />
<strong>and</strong> conditions articulated in <strong>Health</strong>y <strong>Alaska</strong>ns 2010 Plan. The 4 major program goals<br />
follow.<br />
Table 1: Goals for a comprehensive approach to reducing tobacco use<br />
Goal 1: Preventing the initiation <strong>of</strong> tobacco use among young people<br />
Goal 2: Promoting tobacco cessation among adults <strong>and</strong> young people<br />
Goal 3: Eliminating exposure to secondh<strong>and</strong> smoke<br />
Goal 4: Identifying <strong>and</strong> eliminating tobacco-related disparities in specific<br />
populations<br />
2 CDC, Best Practices for Comprehensive <strong>Tobacco</strong> Control Programs (2007). US <strong>Department</strong> <strong>of</strong> <strong>Health</strong> <strong>and</strong> Human Services, Centers for Disease<br />
Control <strong>and</strong> Prevention, National Center for Chronic Disease Prevention <strong>and</strong> <strong>Health</strong> Promotion, Office on Smoking <strong>and</strong> <strong>Health</strong>.<br />
<strong>Alaska</strong> <strong>Tobacco</strong> <strong>Facts</strong>, 2009 Update 39
The structure <strong>of</strong> <strong>Alaska</strong>’s TPC Program is also based on guidance from the CDC Best<br />
Practices. In October, 2007, CDC released an updated edition <strong>of</strong> their 1999 Best<br />
Practices document, which reorganized the nine components <strong>of</strong> comprehensive tobacco<br />
control programs into five overarching components. Below are descriptions <strong>of</strong> each<br />
program component according to Best Practices recommendation areas; cases where<br />
there is no program component to match the Best Practices recommendation area are<br />
noted.<br />
1. State <strong>and</strong> Community Interventions:<br />
The overarching component <strong>of</strong> “State <strong>and</strong> Community Interventions” is broken up into five<br />
subheadings, each <strong>of</strong> which are described below.<br />
Statewide Programs<br />
Statewide programs increase the capacity <strong>of</strong> local organizations by: providing assistance<br />
<strong>and</strong> support around community development, promoting media advocacy, implementing<br />
clean indoor air policies, <strong>and</strong> reducing minor’s access to tobacco. Statewide programs<br />
also sponsor training, conferences, <strong>and</strong> the provision <strong>of</strong> technical assistance.<br />
The <strong>Alaska</strong> TPC Program currently has the following statewide programs:<br />
• Technical assistance to community programs (State grantees) on action<br />
planning, coalition development; supporting communities on clean indoor air<br />
ordinances, local policy change, <strong>and</strong> promoting media advocacy<br />
• General support, training, <strong>and</strong> development to the statewide tobacco<br />
coalition (ATCA),<br />
• Implementation <strong>of</strong> a statewide strategic plan in conjunction with ATCA<br />
Community Programs<br />
In order to achieve the reductions in secondh<strong>and</strong> smoke (SHS) exposure <strong>and</strong> individual<br />
behavior change that support non-use <strong>of</strong> tobacco, communities must change the way<br />
tobacco is promoted, sold <strong>and</strong> used. Communities must also change social norms around<br />
tobacco use by targeting tobacco-related knowledge, attitudes <strong>and</strong> practices.<br />
The <strong>Alaska</strong> TPC Program provides grants to local organizations for staff, operating<br />
expenses, resource <strong>and</strong> educational materials, <strong>and</strong> education, training <strong>and</strong> media. These<br />
grantees organize their communities to establish plans <strong>of</strong> action, draw leaders into<br />
tobacco control activities <strong>and</strong> promote local tobacco control policies <strong>and</strong> ordinances. The<br />
TPC Program currently has community program grants in 20 communities/regions.<br />
Expected outcomes include the creation, implementation, <strong>and</strong> enforcement <strong>of</strong> populationbased<br />
policies that protect residents from SHS, discourage youth initiation, <strong>and</strong> provide<br />
support for tobacco users to quit.<br />
<strong>Tobacco</strong>-Related Disparities<br />
The TPC Program is also engaged in efforts to identify <strong>and</strong> eliminate tobacco-related<br />
disparities. In FY06 <strong>Alaska</strong> was chosen as one <strong>of</strong> 11 states funded by the national<br />
Centers for Disease Control <strong>and</strong> Prevention (CDC) to participate in a strategic planning<br />
process around disparities. The strategic planning process resulted in a set <strong>of</strong><br />
<strong>Alaska</strong> <strong>Tobacco</strong> <strong>Facts</strong>, 2009 Update 40
ecommendations for action to be undertaken by the <strong>Alaska</strong> TPC Program <strong>and</strong> its<br />
statewide partners to reduce <strong>and</strong> eventually eliminate disparities in tobacco use due to<br />
race, region <strong>of</strong> residence, or socio economic status in the state <strong>of</strong> <strong>Alaska</strong>. The TPC<br />
Program created a position to oversee the disparities component <strong>of</strong> the program <strong>and</strong> hired<br />
a coordinator in the summer <strong>of</strong> 2008.<br />
Ongoing collection <strong>and</strong> analysis <strong>of</strong> data is also an important part <strong>of</strong> work to address<br />
tobacco-related disparities. The TPC Program uses routine surveillance to identify<br />
population groups with disproportionately high tobacco use rates. In addition, the TPC<br />
Program has conducted several in-depth data analysis projects to gather more<br />
information about tobacco knowledge <strong>and</strong> behavior among identified disparate groups.<br />
Two examples include the report “What State Surveys Tell Us About <strong>Tobacco</strong> Use Among<br />
<strong>Alaska</strong> Natives: Implications for Program Planning”, published in 2007, <strong>and</strong> a report on<br />
tobacco use among adults <strong>of</strong> low socioeconomic status.<br />
Youth<br />
Because most people who start smoking are younger than age 18, programs that prevent<br />
the onset <strong>of</strong> smoking among young people are an important part <strong>of</strong> a comprehensive<br />
tobacco control program. In 2007 the TPC Program initiated a school-based tobacco<br />
prevention program. The TPC Program currently funds 6 school districts to develop<br />
comprehensive school tobacco prevention programs. Funded districts address the<br />
following five key priority areas: 1) institute <strong>and</strong> enforce comprehensive tobacco<br />
prevention policies, 2) implement effective K-12 tobacco prevention classroom instruction,<br />
3) provide assistance to students, families, <strong>and</strong> staff who want to quit using tobacco<br />
products, 4) involve parents <strong>and</strong> families in support <strong>of</strong> school-based tobacco prevention<br />
programs, <strong>and</strong> 5) create <strong>and</strong> maintain linkages to community-based tobacco prevention<br />
coalitions. To promote synergy between school-based <strong>and</strong> community efforts, all funded<br />
school programs are located in regions with community grantee programs<br />
School <strong>and</strong> community programs to reduce youth tobacco use are supported <strong>and</strong><br />
reinforced by statewide efforts to reduce youth access to tobacco. Through the Division<br />
<strong>of</strong> Behavioral <strong>Health</strong>, <strong>Alaska</strong> conducts a statewide enforcement program to comply with<br />
the Federal SYNAR Amendment to (1) have <strong>and</strong> enforce State-level minors’ access laws<br />
to decrease the rate <strong>of</strong> sales to persons under the age <strong>of</strong> 18 to less than 20 percent, (2)<br />
conduct annual statewide inspection surveys that accurately measure the effectiveness <strong>of</strong><br />
their enforcement efforts, <strong>and</strong> (3) report annually to the Secretary <strong>of</strong> <strong>Health</strong> <strong>and</strong> Human<br />
Services. Since 2003, <strong>Alaska</strong> has successfully met federal requirements that illegal<br />
vendor sales not exceed 20 percent.<br />
Chronic Disease Programs<br />
The TPC Program is located in the Section <strong>of</strong> Chronic Disease Prevention <strong>and</strong> <strong>Health</strong><br />
Promotion (CDPHP) within the <strong>Alaska</strong> Division <strong>of</strong> Public <strong>Health</strong>. TPC staff currently<br />
collaborate with other CDPHP Programs on a worksite health promotion initiative. The<br />
initiative aims to help organizations develop or enhance employee health by creating a<br />
healthy workplace environment. Features <strong>of</strong> a healthy environment include policies <strong>and</strong><br />
practices that support employees in being informed about their health, having healthy<br />
habits, following good preventive practices, <strong>and</strong> being informed health consumers.<br />
<strong>Alaska</strong> <strong>Tobacco</strong> <strong>Facts</strong>, 2009 Update 41
TPC Staff are also working to link cessation resources available through the <strong>Alaska</strong><br />
<strong>Tobacco</strong> Quitline with information on other chronic conditions. The Program has<br />
developed inserts on the treatment <strong>of</strong> chronic conditions to distribute with Quitline provider<br />
materials, <strong>and</strong> information is also distributed to Quitline callers.<br />
2. <strong>Health</strong> Communications Interventions:<br />
TPC <strong>Health</strong> Communications Interventions consist <strong>of</strong> a wide range <strong>of</strong> efforts, including<br />
paid television, radio <strong>and</strong> print media. Research shows that counter-marketing promotes<br />
quitting, decreases the likelihood <strong>of</strong> initiation, <strong>and</strong> supports community efforts to create<br />
tobacco-free social norms. The TPC Program currently has two counter-marketing<br />
contractors, one for urban markets <strong>and</strong> the other for rural markets.<br />
3. Cessation Interventions:<br />
Programs that assist both young <strong>and</strong> adult smokers in quitting can produce significant<br />
health <strong>and</strong> economic benefits. Evidence-based clinical practice guidelines describe a<br />
variety <strong>of</strong> effective cessation strategies, including brief advice by medical providers to quit<br />
smoking, FDA approved pharmacotherapy (e.g., nicotine replacement therapy, NRT) <strong>and</strong><br />
population based cessation helplines or Quitlines. System changes are critical to the<br />
broad-based success <strong>of</strong> cessation interventions.<br />
The TPC Program currently funds a statewide, toll-free Quitline that includes the provision<br />
<strong>of</strong> NRT. The program also funds 9 tobacco federally qualified health care systems to<br />
implement the clinical practice guidelines.<br />
4. Surveillance <strong>and</strong> Evaluation:<br />
The <strong>Alaska</strong> <strong>Tobacco</strong> Prevention <strong>and</strong> Control Program maintains a surveillance <strong>and</strong><br />
evaluation system in order to monitor progress in reducing tobacco use <strong>and</strong> to document<br />
program accountability. The surveillance component <strong>of</strong> the program includes the<br />
examination <strong>of</strong> tobacco-related behaviors, attitudes <strong>and</strong> health outcomes at regular<br />
intervals. Through surveillance, the TPC Program monitors the achievement <strong>of</strong> the<br />
primary program goals, including reduced prevalence <strong>of</strong> tobacco use among young<br />
people <strong>and</strong> adults, <strong>and</strong> declines in exposure to secondh<strong>and</strong> smoke. The TPC Program<br />
publishes key tobacco indicators annually in <strong>Alaska</strong> <strong>Tobacco</strong> <strong>Facts</strong>. In addition, the<br />
Program has completed specialized data analysis projects on tobacco use among priority<br />
populations <strong>and</strong> specific tobacco topics, including reports on youth, <strong>Alaska</strong> Natives,<br />
economically disadvantaged adults, secondh<strong>and</strong> smoke, <strong>and</strong> smokeless tobacco.<br />
Program evaluation uses surveillance data to assess program impact <strong>and</strong> to measure<br />
progress in each program component. Grantees <strong>and</strong> contractors submit routine progress<br />
reports containing information on program activities <strong>and</strong> results. The program also<br />
conducts detailed assessments <strong>of</strong> specific TPC components, including a survey <strong>of</strong> quit<br />
rates <strong>and</strong> satisfaction among <strong>Alaska</strong> <strong>Tobacco</strong> Quitline participants.<br />
The TPC Program entered into an inter-governmental agreement, beginning FY 06 with<br />
Program Design <strong>and</strong> Evaluation Services Unit (PDES). PDES has experience evaluating<br />
<strong>Alaska</strong> <strong>Tobacco</strong> <strong>Facts</strong>, 2009 Update 42
state programs in Oregon, Washington <strong>and</strong> California <strong>and</strong> provides rigorous technical<br />
support related to the evaluation needs <strong>of</strong> the TPC Program.<br />
5. Administration <strong>and</strong> Management:<br />
An effective tobacco control program requires a strong management structure. The TPC<br />
Program must coordinate with other state agencies, the <strong>Alaska</strong> <strong>Tobacco</strong> Control Alliance<br />
(ATCA), numerous non-pr<strong>of</strong>it organizations intent on reducing tobacco use, the CDC, <strong>and</strong><br />
other key stakeholders.<br />
<strong>Alaska</strong> <strong>Tobacco</strong> <strong>Facts</strong>, 2009 Update 43
Section 2. Cigarette Consumption<br />
13. Trend Tables<br />
Annual Per Adult Sales <strong>of</strong> Cigarettes, By Fiscal Year<br />
Fiscal Year <strong>Alaska</strong> US minus <strong>AK</strong><br />
1996 128.6 116.7<br />
1997 125.9 115.7<br />
1998 115.2 112.8<br />
1999 102.3 107.5<br />
2000 100.2 103.4<br />
2001 94.0 98.8<br />
2002 91.6 96.2<br />
2003 90.1 89.9<br />
2004 92.0 86.9<br />
2005 88.0 84.4<br />
2006 80.4 80.7<br />
2007 78.0 78.4<br />
2008 67.4<br />
Sources: <strong>Alaska</strong> <strong>Department</strong> <strong>of</strong> Revenue, Tax Division FY08 Reports;<br />
Orzechowski & Walker, The Tax Burden on <strong>Tobacco</strong>, 2007.<br />
<strong>Alaska</strong> <strong>Tobacco</strong> <strong>Facts</strong>, 2009 Update 44
Section 4. Adult Smoking<br />
Percentage <strong>of</strong> <strong>Alaska</strong>n Adults Who Smoke, by Year<br />
Year <strong>Alaska</strong> US Combined <strong>Alaska</strong> Nonyears<br />
Natives Natives<br />
1996 27.7% NA<br />
1997 26.5% 24.7%<br />
1998 26.1% 24.1%<br />
1999 27.3% 23.5%<br />
2000 25.0% 23.3%<br />
2001 26.2% 22.8%<br />
2002 29.3% 22.5%<br />
2003 26.2% 21.6%<br />
2004 24.3% 20.9%<br />
2005 24.8% 20.9%<br />
2006 24.0% 20.8%<br />
2007 21.5% 19.7%<br />
Percentage <strong>of</strong> Adult Smokers Who Smoke Every Day, by Year<br />
1996-1998 42.7% 24.3%<br />
1997-1999 41.0% 24.0%<br />
1998-2000 41.6% 23.4%<br />
1999-2001 42.8% 23.2%<br />
2000-2002 43.5% 23.5%<br />
2001-2003 44.3% 23.8%<br />
2002-2004 44.5% 23.1%<br />
2003-2005 43.3% 22.0%<br />
2004-2006 42.8% 21.1%<br />
2005-2007 41.1% 20.3%<br />
Year <strong>Alaska</strong> US Combined <strong>Alaska</strong> Nonyears<br />
Natives Natives<br />
1996 78% 82%<br />
1997 84% 82%<br />
1998 76% 82%<br />
1999 70% 82%<br />
2000 75% 82%<br />
2001 72% 82%<br />
2002 75% 82%<br />
2003 74% 81%<br />
2004 70% 81%<br />
2005 74% 81%<br />
2006 66% 79%<br />
2007 71% 78%<br />
1996-1998 71% 82%<br />
1997-1999 71% 78%<br />
1998-2000 67% 76%<br />
1999-2001 67% 74%<br />
2000-2002 69% 76%<br />
2001-2003 69% 76%<br />
2002-2004 67% 75%<br />
2003-2005 66% 75%<br />
2004-2006 66% 72%<br />
2005-2007 66% 72%<br />
Sources: <strong>Alaska</strong> Behavioral Risk Factor Surveillance System, St<strong>and</strong>ard BRFSS Survey (1998-2003),<br />
combined Modified <strong>and</strong> St<strong>and</strong>ard BRFSS Surveys (2004-2007); National <strong>Health</strong> Interview Survey<br />
<strong>Alaska</strong> <strong>Tobacco</strong> <strong>Facts</strong>, 2009 Update 45
Section 5. Adult Smokeless <strong>Tobacco</strong> Use<br />
Percentage <strong>of</strong> Adults Who Use Smokeless, by Year<br />
Year All <strong>Alaska</strong>n Adults<br />
1996 4.1%<br />
1997 5.6%<br />
1998 5.4%<br />
1999 5.4%<br />
2000 5.7%<br />
2001 6.1%<br />
2002 6.6%<br />
2003 NA<br />
2004 4.4%<br />
2005 4.9%<br />
2006 4.7%<br />
2007 5.1%<br />
Combined <strong>Alaska</strong> Non-<br />
Years Native Native<br />
1996-1998 12.4% 4.0%<br />
1997-1999 12.9% 4.3%<br />
1998-2000 13.5% 4.3%<br />
1999-2001 14.6% 4.4%<br />
2000-2002 14.4% 4.9%<br />
2001-2002 14.8% 5.0%<br />
2002& 2004 11.0% 4.7%<br />
2004-2005 10.6% 3.7%<br />
2005-2006 10.6% 3.8%<br />
2006-2007 11.6% 3.8%<br />
Source: <strong>Alaska</strong> Behavioral Risk Factor Surveillance System, St<strong>and</strong>ard Survey (1996-2002),<br />
Modified Survey (2004), combined St<strong>and</strong>ard <strong>and</strong> Modified Surveys (2005-07)<br />
<strong>Alaska</strong> <strong>Tobacco</strong> <strong>Facts</strong>, 2009 Update 46
Section 10. <strong>Tobacco</strong> Use During Pregnancy<br />
Prenatal Smoking (last 3 months), by Year<br />
Year Overall <strong>Alaska</strong> Native Non-Native<br />
1996 21.6% 33.0% 18.2%<br />
1997 17.6% 29.1% 14.1%<br />
1998 18.3% 32.8% 13.8%<br />
1999 16.6% 29.2% 12.6%<br />
2000 16.8% 29.2% 12.7%<br />
2001 14.7% 27.8% 10.3%<br />
2002 17.7% 29.3% 14.0%<br />
2003 16.7% 25.7% 13.9%<br />
2004 17.4% 31.3% 12.6%<br />
2005 16.0% 27.7% 12.0%<br />
2006 14.8% 28.0% 10.5%<br />
Prenatal Smokeless <strong>Tobacco</strong> Use, by Year<br />
Year Overall <strong>Alaska</strong> Native Non-Native<br />
1996 6.5% 26.7% 0.3%<br />
1997 5.9% 21.3% 1.0%<br />
1998 6.5% 22.0% 1.6%<br />
1999 5.6% 20.4% 0.7%<br />
2000 5.5% 20.1% 0.5%<br />
2001 4.7% 17.5% 0.4%<br />
2002 5.0% 17.8% 0.8%<br />
2003 4.5% 16.9% 0.4%<br />
Source: <strong>Alaska</strong> Pregnancy Risk Assessment Monitoring System (PRAMS)<br />
<strong>Alaska</strong> <strong>Tobacco</strong> <strong>Facts</strong>, 2009 Update 47
<strong>Tobacco</strong> Tax Data<br />
14. Data Sources<br />
Data on cigarette sales in <strong>Alaska</strong> were obtained from the <strong>Alaska</strong> <strong>Department</strong> <strong>of</strong> Revenue,<br />
Tax Division. In <strong>Alaska</strong>, a tobacco tax is levied on cigarettes <strong>and</strong> other tobacco products<br />
that are sold, imported, or transferred into the state. This tax, which currently amounts to<br />
$2.00 for a pack <strong>of</strong> 20 cigarettes <strong>and</strong> 75 percent <strong>of</strong> wholesale price for cigars <strong>and</strong> chewing<br />
tobacco, is collected primarily from licensed wholesalers <strong>and</strong> distributors. <strong>Tobacco</strong> tax<br />
returns are filed monthly by the last day <strong>of</strong> the month following the month in which the<br />
sales were made. <strong>Alaska</strong> tax data may fail to account for tobacco products that are<br />
consumed here but are purchased out <strong>of</strong> state or through other means not captured by<br />
tax records (e.g., bought over the Internet). Because data files are updated monthly,<br />
variations can occur depending on when a report is accessed. <strong>Tobacco</strong> <strong>Facts</strong> sales<br />
estimates for years prior to FY 2008 are those calculated for <strong>and</strong> included in prior reports,<br />
<strong>and</strong> are not updated to reflect any further changes. Estimates used for 2008 come from<br />
the “FY 08 Cigarette <strong>and</strong> Other <strong>Tobacco</strong> Products Summary” dated 9/16/08.<br />
Population Estimates<br />
<strong>Alaska</strong> <strong>and</strong> US population estimates by age, used in calculating US tobacco consumption<br />
(packs per adult), come from the U.S. Census Bureau Population Division website Table<br />
2: Annual Estimates <strong>of</strong> the Population by Sex <strong>and</strong> Selected Age Groups for the United<br />
States: April 1, 2000 to July 1, 2007 (NC-EST2007-02), data release <strong>of</strong> May 1, 2008.<br />
<strong>Alaska</strong> population estimates by age, sex <strong>and</strong> race/ethnicity, used in calculating the<br />
number <strong>of</strong> tobacco users <strong>and</strong> <strong>Alaska</strong> consumption (packs per adult), come from the<br />
<strong>Alaska</strong> <strong>Department</strong> <strong>of</strong> Labor <strong>and</strong> Workforce Development population estimate web pages<br />
at, http://laborstats.alaska.gov/?PAGEID=67&SUBID=171, accessed January 13, 2009.<br />
Smoking Attributable Mortality, Morbidity <strong>and</strong> Economic Costs<br />
(SAMMEC)<br />
Estimates <strong>of</strong> <strong>Alaska</strong>’s mortality <strong>and</strong> economic costs associated with tobacco use were<br />
calculated using an online application developed at CDC known as Smoking Attributable<br />
Mortality, Morbidity <strong>and</strong> Economic Costs (SAMMEC). The SAMMEC formula applies age-<br />
<strong>and</strong> sex-specific smoking-attributable fractions to mortality data for each smoking-related<br />
disease in the population under study, also taking into consideration the smoking<br />
prevalence for each population. The overall smoking-attributable mortality is the sum <strong>of</strong><br />
the smoking-attributable deaths across age groups <strong>and</strong> causes <strong>of</strong> death for both sexes<br />
combined for 2006.<br />
SAMMEC also provides estimates <strong>of</strong> smoking-attributed medical expenditures <strong>and</strong> for<br />
productivity losses due to smoking mortality. This application does not currently allow<br />
estimates <strong>of</strong> morbidity-related productivity costs. The estimates <strong>of</strong> adult medical<br />
<strong>Alaska</strong> <strong>Tobacco</strong> <strong>Facts</strong>, 2009 Update 48
expenditures attributable to smoking <strong>and</strong> the loss <strong>of</strong> productivity due to smoking-related<br />
mortality were calculated using such measures as the state’s 2004 age- <strong>and</strong> sex-specific<br />
mortality rates for specified conditions, the 2004 BRFSS estimate <strong>of</strong> adult smoking<br />
prevalence, the 2004 present value for future earnings, <strong>and</strong> the 2004 US life expectancy.<br />
The 2004 estimate <strong>of</strong> total medical spending in <strong>Alaska</strong>, obtained from the Centers for<br />
Medicare <strong>and</strong> Medicaid Services, was used in estimating smoking-related medical<br />
expenditures. This estimate was then adjusted to 2007 using the medical consumer price<br />
index.<br />
Data on specific causes <strong>of</strong> deaths from smoking-related diseases in <strong>Alaska</strong> were<br />
abstracted from death certificates, provided by the <strong>Alaska</strong> Bureau <strong>of</strong> Vital Statistics. The<br />
cause <strong>of</strong> death used in our analysis was the underlying cause, based on the Tenth<br />
Revision <strong>of</strong> the International Classification <strong>of</strong> Diseases (ICD-10). Deaths <strong>of</strong> <strong>Alaska</strong>n<br />
residents who died out <strong>of</strong> state were not included in the figures used to produce the<br />
SAMMEC estimates <strong>of</strong> tobacco-related deaths <strong>and</strong> the associated economic costs. The<br />
estimates <strong>of</strong> current smoking prevalence used for the SAMMEC calculations were<br />
obtained from the <strong>Alaska</strong> BRFSS.<br />
Estimated deaths due to secondh<strong>and</strong> smoke were calculated by applying national<br />
environmental tobacco smoke exposure mortality estimates provided in “<strong>Health</strong> Effects <strong>of</strong><br />
Exposure to Environmental <strong>Tobacco</strong> Smoke, Final Report, September 1997”, produced by<br />
the California Environmental Protection Agency, to <strong>Alaska</strong> 2001 census population<br />
estimates.<br />
Behavioral Risk Factor Surveillance System (BRFSS)<br />
The BRFSS is an anonymous telephone survey conducted by the <strong>Alaska</strong> Division <strong>of</strong><br />
Public <strong>Health</strong> in cooperation with the CDC. It aims to estimate the prevalence <strong>of</strong><br />
behavioral risk factors in the general population that are known to be associated with the<br />
leading causes <strong>of</strong> morbidity <strong>and</strong> mortality in adults. The BRFSS has operated<br />
continuously in <strong>Alaska</strong> since it began in 1991.<br />
The BRFSS uses a probability (or r<strong>and</strong>om) sample in which all <strong>Alaska</strong>n households have<br />
a known, nonzero chance <strong>of</strong> selection. The sample is stratified into five regions, with<br />
roughly equal numbers <strong>of</strong> interviews conducted in each region. This method deliberately<br />
over-samples rural areas <strong>of</strong> the state. Respondents are r<strong>and</strong>omly selected from among<br />
the adult members <strong>of</strong> each household reached through a series <strong>of</strong> r<strong>and</strong>om telephone<br />
calls. Those living in institutions (i.e., nursing homes, dormitories) are not surveyed.<br />
Interviews are conducted by trained college interns <strong>and</strong> administrative clerks, during<br />
weekdays, evenings, <strong>and</strong> weekends throughout the year. In addition to tobacco use, the<br />
BRFSS questionnaire covers such topics as general health status, health care access,<br />
nutrition, physical activity, diabetes, alcohol use, women’s health, injury prevention, <strong>and</strong><br />
HIV/AIDS awareness. There are also questions on the demographic characteristics <strong>of</strong><br />
respondents.<br />
<strong>Alaska</strong> <strong>Tobacco</strong> <strong>Facts</strong>, 2009 Update 49
<strong>Alaska</strong> presently conducts two BRFSS surveys: the st<strong>and</strong>ard BRFSS <strong>and</strong> a modified<br />
BRFSS, which contains many tobacco questions adopted from the CDC’s Adult <strong>Tobacco</strong><br />
Survey. Both surveys are conducted throughout the year, using separate samples drawn<br />
using the same methodology. BRFSS data appearing throughout this report are identified<br />
as coming from either the modified survey (“Modified”) or the st<strong>and</strong>ard <strong>and</strong> modified<br />
surveys combined (“Combined”). At present approximately 210 <strong>Alaska</strong>n adults are<br />
interviewed each month for the st<strong>and</strong>ard BRFSS, to reach an annual sample size <strong>of</strong> 2,500<br />
(500 per region); the same number are interviewed for the modified BRFSS, for a total <strong>of</strong><br />
roughly 5,000 survey respondents.<br />
Both the st<strong>and</strong>ard <strong>and</strong> modified BRFSS are weighted (separately) to compensate for the<br />
over-representation or under-representation <strong>of</strong> persons in various subgroups. The data<br />
are further weighted to adjust the distribution <strong>of</strong> the sample data so that it reflects the total<br />
population <strong>of</strong> the sampled area. In addition, a combined dataset (st<strong>and</strong>ard plus modified)<br />
is created <strong>of</strong> union <strong>of</strong> questions appearing on both surveys. This combined dataset is<br />
weighted separately.<br />
Where possible, the combined dataset was used to provide the estimates contained in<br />
this report. In cases where questions appeared on only one or another <strong>of</strong> the BRFSS<br />
surveys, that particular dataset was used. Weighted percentages (<strong>and</strong> in some cases<br />
numbers) were reported, <strong>and</strong> 95% confidence intervals were used to determine the<br />
significance <strong>of</strong> differences between population subgroups.<br />
Regional Reporting<br />
Regions were defined using borough designation using a mapping <strong>of</strong> telephone prefixes<br />
to borough. Although the BRFSS survey data do not provide enough representation for<br />
reporting by most <strong>of</strong> the individual boroughs, combining boroughs provided a useful<br />
geographic factor for analyses. Region was also modified by tribal health organization<br />
region designation. While the individual tribal health organizations are generally too small<br />
to represent with survey data from the BRFSS, these aggregated units help meet the<br />
need <strong>of</strong> providing information at a useful level <strong>of</strong> geography. In this report, most boroughs<br />
fall entirely within the boundary <strong>of</strong> one region; the exceptions are Yukon-Koyukuk <strong>and</strong><br />
Denali Boroughs. Tribal health care is provided for part <strong>of</strong> these boroughs by<br />
organizations in another borough, <strong>and</strong> the regions used in this report reflect that<br />
difference between tribal health provision <strong>and</strong> borough. For this reason, about 14% <strong>of</strong><br />
respondents from the Yukon-Koyukuk Borough are categorized with the Southwest<br />
region, <strong>and</strong> about 14% <strong>of</strong> those from the Denali Borough are grouped with the Gulf Coast<br />
Region for the purposes <strong>of</strong> this report.<br />
Regional groups for the associations analyses are as follows:<br />
1) Anchorage <strong>and</strong> Vicinity – Anchorage <strong>and</strong> Mat-Su Boroughs (each borough<br />
reported separately for cigarette smoking prevalence)<br />
2) Gulf Coast – Kenai, Kodiak, <strong>and</strong> Valdez Cordova Boroughs (plus part <strong>of</strong> Denali)<br />
3) Southeast – Yakutat, Skagway, Juneau, Sitka, Haines, Wrangell-Petersburg,<br />
Ketchikan, <strong>and</strong> Ketchikan Gateway Boroughs<br />
4) Fairbanks North Star<br />
<strong>Alaska</strong> <strong>Tobacco</strong> <strong>Facts</strong>, 2009 Update 50
5) North/Interior – Nome, Northwest Arctic, North Slope, Yukon-Koyukuk,<br />
Southeast Fairbanks, <strong>and</strong> Denali Boroughs<br />
6) Southwest -- Bristol Bay, East Aleutians, West Aleutians, Dillingham, Lake &<br />
Peninsula, Bethel, <strong>and</strong> Wade Hampton Boroughs (plus part <strong>of</strong> Yukon-Koyukuk)<br />
Reporting by Race Group<br />
Because there are small numbers <strong>of</strong> BRFSS respondents who report their primary race<br />
group as something other than White or <strong>Alaska</strong> Native each year, the most recent three<br />
years <strong>of</strong> data are combined to report information by race group.<br />
Reporting by <strong>Alaska</strong> Native vs. Non-Native Status<br />
When reporting trends by <strong>Alaska</strong> Native <strong>and</strong> non-Native groups, or when reporting by<br />
Native status <strong>and</strong> gender, BRFSS data are also grouped in multiple year sets to increase<br />
precision for group comparisons <strong>and</strong> for graphing <strong>of</strong> trends over time. However,<br />
significance tests for trend are conducted using single year data.<br />
Youth Risk Behavior Survey (YRBS)<br />
The YRBS is a systematic survey <strong>of</strong> high school students investigating behaviors related<br />
to the leading causes <strong>of</strong> mortality, morbidity <strong>and</strong> social problems among youth. The<br />
Centers for Disease Control <strong>and</strong> Prevention sponsors national <strong>and</strong> state surveys every<br />
two years, most recently in 2007. <strong>Alaska</strong> first participated in the YRBS in 1995. The next<br />
statewide survey with a statistically valid, representative sample was in 2003. <strong>Alaska</strong> was<br />
unsuccessful in its attempt to obtain a statewide representative sample in 2005, but<br />
achieved the participation rates required to meet the CDC representative sample<br />
st<strong>and</strong>ards in the 2007 YRBS.<br />
The <strong>Alaska</strong> YRBS is conducted using a two-stage sampling design. Schools are selected<br />
first with a probability <strong>of</strong> inclusion proportional to the size <strong>of</strong> their enrollment. Once a<br />
school is chosen, classes are selected, with each student having an equal opportunity for<br />
inclusion. In 2007, active parental consent was required for each student participating in<br />
the YRBS. On the appointed survey day students completed written questionnaires <strong>and</strong><br />
returned them in class in unmarked, sealed envelopes.<br />
The 2007 sampling frame included 159 schools, from which 43 were sampled <strong>and</strong> 41<br />
participated. Overall participation rates were above 60% in all three years for which data<br />
are presented. A total <strong>of</strong> 1,318 respondents participated in 2007, 1,481 respondents in<br />
2003 <strong>and</strong> 1,634 in 1995. Data were weighted to reflect the true distribution <strong>of</strong> <strong>Alaska</strong> high<br />
school students by sex <strong>and</strong> grade level.<br />
Synar Compliance Data<br />
The Center for Substance Abuse Prevention (CSAP) oversees implementation <strong>of</strong> the<br />
Synar Amendment, which requires states to have laws in place prohibiting the sale <strong>and</strong><br />
distribution <strong>of</strong> tobacco products to persons under age 18. (<strong>Alaska</strong>, Utah, Alabama, <strong>and</strong><br />
<strong>Alaska</strong> <strong>Tobacco</strong> <strong>Facts</strong>, 2009 Update 51
New Jersey have exp<strong>and</strong>ed this prohibition to persons under 19.) States are required to<br />
collect data on vendor compliance with underage sales laws, <strong>and</strong> must achieve a<br />
maximum sales-to-minors rate <strong>of</strong> not greater than 20 percent to avoid penalties. The<br />
sample from which these data are collected must reflect the distribution <strong>of</strong> the underage<br />
population throughout the state <strong>and</strong> the distribution <strong>of</strong> outlets that are accessible to youth<br />
throughout the state.<br />
<strong>Alaska</strong> data on vendor sales <strong>of</strong> tobacco products to minors are obtained through the<br />
<strong>Alaska</strong> <strong>Department</strong> <strong>of</strong> <strong>Health</strong> <strong>and</strong> <strong>Social</strong> Services, Division <strong>of</strong> Behavioral <strong>Health</strong>’s<br />
<strong>Tobacco</strong> Enforcement Program. A business license database provided by the <strong>Department</strong><br />
<strong>of</strong> Occupational Licensing is used to identify outlets that are accessible to youth. Each<br />
summer, eligible, trained, underage youth attempt to purchase tobacco products in the<br />
sampled establishments. Undercover <strong>Tobacco</strong> Enforcement staff monitors these<br />
transactions, noting whether sales occurred.<br />
Synar data are reported for the federal fiscal year, October through September. The year<br />
reported in this document reflects the end date <strong>of</strong> the federal fiscal year; that is, data<br />
collected from October 2006 to September 2007 are reported as the 2007 data.<br />
Pregnancy Risk Assessment Monitoring System (PRAMS)<br />
PRAMS data were used in this report to document prenatal tobacco use. PRAMS is a<br />
population-based survey <strong>of</strong> <strong>Alaska</strong>n women who have recently delivered a live-born<br />
infant. It gathers information on the health risk behaviors <strong>and</strong> circumstances <strong>of</strong> pregnant<br />
<strong>and</strong> postpartum women. PRAMS is conducted in collaboration with the CDC in 37 states,<br />
New York City, <strong>and</strong> South Dakota (Yankton Sioux Tribe). In <strong>Alaska</strong>, the Division <strong>of</strong> Public<br />
<strong>Health</strong> has administered PRAMS since 1990.<br />
A stratified systematic sample is drawn each month from the state’s live birth records for<br />
infants between two <strong>and</strong> six months <strong>of</strong> age. Sampled mothers receive a series <strong>of</strong> mailed<br />
questionnaires to solicit a response, <strong>and</strong> since 1997, telephone follow-up has been<br />
initiated among those who do not respond to the third mailed request.<br />
In addition to maternal tobacco use, the PRAMS questionnaire addresses such topics as<br />
access to prenatal care, obstetric history, maternal use <strong>of</strong> alcohol, nutrition, economic<br />
status, maternal stress, <strong>and</strong> early infant development <strong>and</strong> health status. Survey<br />
responses are weighted so that reported prevalences accurately describe <strong>Alaska</strong>n women<br />
delivering a live-born infant during the year <strong>of</strong> the survey. The weighted response rate for<br />
2006 was 77 percent.<br />
Because the questions about smokeless tobacco use changed significantly in 2004, trend<br />
data are available from 1990 to 2003. Data from 2004 reflect combined information from<br />
questions about different types <strong>of</strong> smokeless tobacco, including Ikmik.<br />
<strong>Alaska</strong> <strong>Tobacco</strong> <strong>Facts</strong>, 2009 Update 52