- Page 1 and 2: LA-11711-M Manual .;,, C3* ;’ !::
- Page 3: A Nuclear Cross Section Data Handbo
- Page 6 and 7: Li-6 . . . . . . . . . Li-7 . . . B
- Page 8 and 9: Ag-107 . . . . . . . . . . . . . .
- Page 10 and 11: Np-237 Np-238 Pu-237 Pu-238 Pu-239
- Page 12 and 13: criticisms; the latter for his modi
- Page 14 and 15: and angular distributions of the in
- Page 16 and 17: value used in calculating the mean
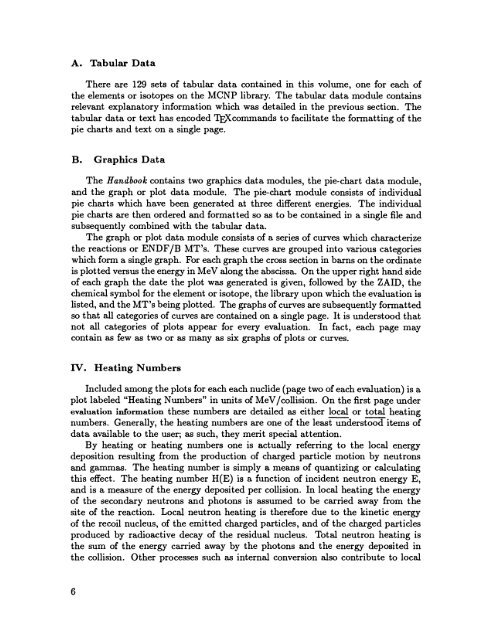
- Page 20 and 21: ~Uij(E) j The “total” heating n
- Page 22 and 23: the future generation of this docum
- Page 24 and 25: 11. R. J. Howerton, R. E. Dye,P. C.
- Page 26 and 27: Actinium Aluminum Americium Antimon
- Page 28 and 29: MT 1 2 4 16 17 18 19 20 21 22 24 25
- Page 30 and 31: Reaction elaat ic (n,-f) Hydrogen-1
- Page 32 and 33: Reaction elastic (n,2n) (n,2n) (n,.
- Page 34 and 35: TYitium - 3 ZAID=1OO3.5OC SOURCE: E
- Page 36 and 37: Re~tion eleetk (n,p) (n,d) Helium -
- Page 38 and 39: Helium - 4 ZAID=2004.50C SOURCE: EN
- Page 40 and 41: Reaction MT elaatic 2 (n,%l)u (n,n
- Page 42 and 43: Reaction elaatk (n#n) (m,2m)a (m,h)
- Page 44 and 45: Beryllium - 7 ZAID=4007.35C SOURCE:
- Page 46 and 47: Beryllium - 9 ZAID=4009.50C SOURCE:
- Page 48 and 49: Boron - 10 ZAID=501O.5OC SOURCE: EN
- Page 50 and 51: REFERENCE: Boron - 11 ZAID=5011.56C
- Page 52 and 53: Reaction elaatk (n#l’l) (Il,n’)
- Page 54 and 55: Reaction elastic (n#’l) (SI,sl’
- Page 56 and 57: REFERENCE: elaatk (n#’l) (n,m’a
- Page 58 and 59: Reection eleet ic (n,2n) (n,n’1)
- Page 60 and 61: Reaction elastic (n,2n) (n,n’)u (
- Page 62 and 63: Reaction elaat ic (n,n’1) (n,n’
- Page 64 and 65: SOURCE:ENDF/B-V(MAT=1309, Reaction
- Page 66 and 67: Reaction elantic (n,2n) (n,n’1) (
- Page 68 and 69:
Reaetion elaatic (n,2n) (n,n’)a (
- Page 70 and 71:
Reaction elastic (n,2n) (n,n’1) (
- Page 72 and 73:
Silicon ZAID=14000050C SOURCE:ENDF/
- Page 74 and 75:
Ruaction alast k (rl,an) (Il,n’)p
- Page 76 and 77:
Reaction elastic (n,2n) (n,n’)p (
- Page 78 and 79:
Reaction elastic (n,2n) (n,n’)ff
- Page 80 and 81:
Argon ZAID=18000.35C SOURCE: ENDL-8
- Page 82 and 83:
Reaction elastic (n,2n) (n,n’)a [
- Page 84 and 85:
Reection elaotk (n#m) (Il,n’)a (n
- Page 86 and 87:
Reaction elaetic (n,2n) (n,Sn) (n,n
- Page 88 and 89:
Vanadium ZAID=23000.50C SOURCE:ENDF
- Page 90 and 91:
Reaction elaet ic (n,2n) (n,$n) (n,
- Page 92 and 93:
Reaction elwkic (n,an) (n,$n) (n,n
- Page 94 and 95:
Reaction elastic (n,2n) (n,n’)o (
- Page 96 and 97:
Reaction elastic (n,2n) (n,n’)a (
- Page 98 and 99:
Reaction elastic (n,an) (n,n’)a (
- Page 100 and 101:
Nickel - 58 ZAID=28058.35C SOURCE:
- Page 102 and 103:
Reaction eleatk (SI,an) (Sl,sn) (n,
- Page 104 and 105:
Gallium ZAID=31OOO.5OC SOURCE:ENDF/
- Page 106 and 107:
Arsenic - 74 ZAID=33074.35C ~ SOURC
- Page 108 and 109:
Arsenic - 75 ZAID=33075.35C SOURCE:
- Page 110 and 111:
Reaction elaat ic (n,2n) (n,n’1)
- Page 112 and 113:
Reaction elastic (n,2n) (n,n’1) (
- Page 114 and 115:
Reaction ela8tic (n,2n) (n,n’1) (
- Page 116 and 117:
Reaction elaatk (m*) (I@l) (81,BI
- Page 118 and 119:
Reaction elaetic (n,2n) (m,n’1) (
- Page 120 and 121:
Reaction elastk (I@n) (n,wl) (n,n
- Page 122 and 123:
REFERENCE: Reaction elaatk (n,n’c
- Page 124 and 125:
Yttrium - 89 ZAID=39089.50C SOURCE:
- Page 126 and 127:
● Reaction elastic (n,2n) (n,n’
- Page 128 and 129:
Reaction eleatic (n,2n) (n,3n) g,:;
- Page 130 and 131:
Molybdenum ZAID=42000.50C SOURCE: E
- Page 132 and 133:
Rhodium - 103 ZAID=45103.5OC SOURCE
- Page 134 and 135:
●la9tk (Il,2n) (18,h) (n,n’c) (
- Page 136 and 137:
Average Fission Product from 23’P
- Page 138 and 139:
Reaction eleet k (n,2n) (n,n’1) (
- Page 140 and 141:
Silver - 107 ZAID=47107.5OC SOURCE:
- Page 142 and 143:
Silver - 109 ZAID=47109.5OC SOURCE:
- Page 144 and 145:
Reaction ela8tic (n,2n) (n,rl’1)
- Page 146 and 147:
Tin ZAID=50000.35C SOURCE:ENDL-85(Z
- Page 148 and 149:
REF Reaction elaatk (n#l’c) (Il,2
- Page 150 and 151:
Xenon ZAID=54000.35C SOURCE:ENDL-85
- Page 152 and 153:
Xenon - 134 ZAID=54134.35C SOURCE:E
- Page 154 and 155:
Reaction elastic (n,an) (n,ml) (n,n
- Page 156 and 157:
Samarium - 149 ZAID=62149.50C SOURC
- Page 158 and 159:
Europium ZAID=63000.35C SOURCE: END
- Page 160 and 161:
Reaction elaatic (n,2n) (n,3n) (n,n
- Page 162 and 163:
Reaction elastic (n,2n) (n,3n) (n,n
- Page 164 and 165:
Reaction (n,an) (n,h) (n,n’1) (11
- Page 166 and 167:
R.caetion elaatk (n,all) (n,srl) (n
- Page 168 and 169:
Gadolinium ZAID=64000.35C SOURCE: E
- Page 170 and 171:
&action llastic ~n,!ht) Il,n’)u :
- Page 172 and 173:
Reaction elastic (n,2n) (n,n’)cr
- Page 174 and 175:
Reaction elastic (n,2n) (n,n’)a (
- Page 176 and 177:
Reaction elaet ic (n,2n) (n,n’)a
- Page 178 and 179:
Reaction elaatic (n,2n) (n,n’)u (
- Page 180 and 181:
Reaction elastk (n,am) (a,m’)o (n
- Page 182 and 183:
Gadolinium - 160 ZAID=64160.50C SOU
- Page 184 and 185:
elaetk (n,2n) (I@l) (n,4n) (n,n’1
- Page 186 and 187:
Reaction ela8tic (n,2n) (n,n’1) (
- Page 188 and 189:
Reaction elastic (n,~n) (n,3n) (n,n
- Page 190 and 191:
Reaction elastic (n,2n) (n,3n) (n,n
- Page 192 and 193:
Reaction eleetic (n,2n) (n,h) @d$ (
- Page 194 and 195:
Reaetion elastic (n,!h) (n,3n) [:::
- Page 196 and 197:
Reaction ellwtic (n,an) 1; (m,%) (m
- Page 198 and 199:
Reaction elaatic (n,2n) (n,3n) (n,n
- Page 200 and 201:
OIMtic (n*am) (Ib,h) (n,m’1) (n,n
- Page 202 and 203:
Reaction eleetic (n,2n) (n,.$u) (n,
- Page 204 and 205:
Platinum ZAID=78000.35C SOURCE: END
- Page 206 and 207:
Reaction elastic (n,2n) (n,3n) (n,4
- Page 208 and 209:
Reaction elaatic (n,2n) (n,9n) (n,n
- Page 210 and 211:
Reaetion 91a8tic (n,an) (n,sn) (n,n
- Page 212 and 213:
Thorium - 231 ZAID=90231.35C SOURCE
- Page 214 and 215:
Thorium - 232 ZAID=90232.50C . SOUR
- Page 216 and 217:
Thorium - 233 ZAID=90233.35C SOURCE
- Page 218 and 219:
Reaction elastic (n,2n) (n,Sn) flui
- Page 220 and 221:
Uranium - 233 ZAID=92233,50C‘ SOU
- Page 222 and 223:
Uranium - 234 ZAID=92234.50C SOURCE
- Page 224 and 225:
Reaction elaetic (n,2n) (n,Sn) (n,f
- Page 226 and 227:
Reaction elastic (n,2n) (n,3n) (n,f
- Page 228 and 229:
Uranium - 237 ZAID=92237.50C SOURCE
- Page 230 and 231:
Reaction elastic (n,2n) ~n#l) (n,n
- Page 232 and 233:
Uranium - 239 ZAID=92239.35C~ SOURC
- Page 234 and 235:
Uranium - 240 ZAID=92240.35C SOURCE
- Page 236 and 237:
● Neptunium - 235 ZAID=93235.35C
- Page 238 and 239:
Neptunium - 236 ZAID=93236.35C , SO
- Page 240 and 241:
Reaction elastic (n,2n) (n,3n) fiss
- Page 242 and 243:
Neptunium - 238 ZAID=93238.35C SOUR
- Page 244 and 245:
Plutonium - 237 ZAID=94237.35C SOUR
- Page 246 and 247:
Reaction elastic (n,2n) (n,3n) (n,f
- Page 248 and 249:
Reaction eleetic (n,2n) (n,Sn) fiss
- Page 250 and 251:
Reaction elestic (n,2n) (n,Sn) (n,f
- Page 252 and 253:
Reaction elaatic (n,2n) (n,Sn) fiss
- Page 254 and 255:
Reaction elastic (n,2n) (n,3n) fiss
- Page 256 and 257:
Plutonium - 243 ZAID=94243.35C SOUR
- Page 258 and 259:
Reaction elastic (n,2n) (n,3n) (n,f
- Page 260 and 261:
Reaction elestic (n,ln) (n,3n) (n,f
- Page 262 and 263:
Reaction elaatic (n,2n) [:::;) (n,n
- Page 264 and 265:
elastic (n,2n) [;::;) (n,n’f) (n,
- Page 266 and 267:
Curium - 243 ZAID=96243.35C SOURCE:
- Page 268 and 269:
Curium - 244 ZAID=96244.50C~ SOURCE
- Page 270 and 271:
Curium - 245 ZAID=96245.35C SOURCE:
- Page 272 and 273:
Curium - 246 ZAID=96246.35C SOURCE:
- Page 274 and 275:
Curium - 247 ZAID=96247.35C SOURCE:
- Page 276 and 277:
Curium - 248 ZAID=96248.35C SOURCE:
- Page 278 and 279:
REFERENCE: Reaction elaatlc (n#l’
- Page 280 and 281:
Californium - 249 ZAID=98249.35C SO
- Page 282 and 283:
Californium - 250 ZAID=98250.35C SO
- Page 284 and 285:
Californium - 251 ZAID=98251.35C SO
- Page 286 and 287:
Californium - 252 ZAID=98252.35C SO
- Page 288 and 289:
Density Values APPENDIX A EXPLANATO
- Page 291 and 292:
001425 Ao2 02tw350 A03 0s1475 A04 0