Chapter 7 - Soil Fertility (925 KB) Download - iGrow
Chapter 7 - Soil Fertility (925 KB) Download - iGrow
Chapter 7 - Soil Fertility (925 KB) Download - iGrow

You also want an ePaper? Increase the reach of your titles
YUMPU automatically turns print PDFs into web optimized ePapers that Google loves.
Best Management Practices<br />
for Corn Production<br />
in South Dakota<br />
EC929
Best Management Practices<br />
for Corn Production<br />
in South Dakota<br />
®<br />
South Dakota State University is an Affirmative Action/Equal Opportunity<br />
Employer and offers all benefits, services, education, and employment<br />
without regard for race, color, creed, religion, national origin, ancestry,<br />
citizenship, age, gender, sexual orientation, disability, or Vietnam Era<br />
veteran status.<br />
––––––––––––––––––––––––––––––––––––––––––––––––––––––––––––––––––––––––––––––––––––––<br />
Support for this document was provided by South Dakota State University, South Dakota Cooperative<br />
Extension Service, South Dakota Agricultural Experiment Station; South Dakota Corn Utilization<br />
Council; USDA-CSREES-406; South Dakota Department of Environment and Natural Resources<br />
through EPA-319; South Dakota USGS Water Resources Institute; USDA-North Central Region SARE<br />
program; Colorado Corn Growers Association; and Colorado State University.<br />
––––––––––––––––––––––––––––––––––––––––––––––––––––––––––––––––––––––––––––––––––––––<br />
Published by South Dakota State University, College of Agriculture and Biological Sciences,<br />
AgBio Communications Unit, Box 2218A, Brookings, South Dakota 57007<br />
© 2009 by South Dakota State University, Brookings, South Dakota<br />
All rights reserved, including the right to reproduce any part of this book in any form, except brief<br />
quotations, without premission of the publisher.<br />
––––––––––––––––––––––––––––––––––––––––––––––––––––––––––––––––––––––––––––––––––––––<br />
EC929. 2,000 copies printed and distributed by South Dakota Cooperative Extension Service at a cost of<br />
$8.68 each. May 2009.
ii<br />
About 5 million acres of South Dakota land—close to 10% of<br />
our state’s land resources—are devoted to corn production. This<br />
fact alone makes it clear just how important corn production is<br />
to the economy of the state of South Dakota. But throw in recent<br />
developments in South Dakota’s corn-based ethanol industry, and<br />
the result is an even further elevation of corn—an elevation to a<br />
most prominent position within the economy of our state.<br />
For the last century, the intensity of farming management has<br />
continued to escalate. This best management practices manual has<br />
brought together some of the best of both old and new technology.<br />
It is my belief that this manual will be a significant<br />
reference and resource for every South Dakota corn producer.<br />
To all who participated in the development of Best Management Practices for Corn<br />
Production in South Dakota, I both extend my appreciation and offer a commendation<br />
for a job well done.<br />
Latif Lighari, Ph.D.<br />
Associate Dean and Director<br />
South Dakota State University<br />
South Dakota Cooperative Extension Service<br />
Professor of Agricultural Education<br />
College of Agriculture and Biological Sciences<br />
South Dakota corn producers are some of the most productive<br />
in the nation. Our state ranked sixth in the nation in production<br />
of corn for grain in 2007 and has led the nation in planted acres of<br />
genetically engineered corn hybrids since 2000. And yet, our corn<br />
producers face many challenges each year. Each producer must<br />
make the best decision on which corn hybrid to plant, choose the<br />
best fertilizer program, manage high input costs, expect seasonal<br />
hazards, deal with weeds and pests, and market the harvest for the<br />
greatest profit.<br />
This manual presents the best management practices developed<br />
for the changing environment of corn production agriculture<br />
in South Dakota. From detailed, basic information on<br />
corn growth and development, through each phase of the corn<br />
production process, the authors and contributors have provided corn producers with an<br />
up-to-date and invaluable reference tool.<br />
I extend my congratulations to the editors, reviewers, authors, and contributors for<br />
a job well done.<br />
Bill Even<br />
South Dakota Secretary of Agriculture
Editors<br />
David E. Clay, Kurtis D. Reitsma, and Sharon A. Clay<br />
Plant Science Department, South Dakota State University<br />
Brookings, South Dakota 57007<br />
For information, contact david.clay@sdstate.edu.<br />
Coordination, Manuscript Editing, and Graphic Design<br />
Eric Ollila , Publication Coordinator-Editor<br />
Terry Molengraaf, Information Officer<br />
AgBio Communications Unit<br />
College of Agriculture and Biological Sciences, South Dakota State University<br />
Brookings, South Dakota 57007<br />
Reviewers, Authors, and Contributors (alphabetical order)<br />
Troy Bauder, Research Scientist Department of <strong>Soil</strong> & Crop Science, Colorado State University<br />
Dwayne L. Beck, Research Manager Dakota Lakes Research Farm, South Dakota State University<br />
Sue L. Blodgett, Department Head Plant Science Department, South Dakota State University<br />
C. Gregg Carlson, Agronomist Plant Science Department, South Dakota State University<br />
Michael A. Catangui, Entomologist Cooperative Extension Service, South Dakota State University<br />
David E. Clay, <strong>Soil</strong> Scientist Plant Science Department, South Dakota State University<br />
Sharon A. Clay, Weed Scientist Plant Science Department, South Dakota State University<br />
Darrell L. Deneke, IPM Specialist Cooperative Extension Service, South Dakota State University<br />
Martin A. Draper, Plant Pathologist Cooperative State Research, Education, and Extension Service<br />
B. Wade French, Entomologist Agricultural Research Service, United States Department of Agriculture<br />
Billy W. Fuller, Entomologist Plant Science Department, South Dakota State University<br />
Robert G. Hall, Agronomist Cooperative Extension Service, South Dakota State University<br />
Curt A. Hoffbeck, Agronomist Pioneer Hi-Bred International<br />
Daniel S. Humburg, Biosystems Engineer Agricultural and Biosystems Engineering Dept., South Dakota State University<br />
Marie A. Langham, Plant Pathologist Plant Science Department, South Dakota State University<br />
Douglas D. Malo, <strong>Soil</strong> Scientist Plant Science Department, South Dakota State University<br />
Mike J. Moechnig, Weed Scientist Cooperative Extension Service, South Dakota State University<br />
Richard E. Nicolai, Biosystems Engineer Agricultural and Biosystems Engineering Dept., South Dakota State University<br />
Kurtis D. Reitsma, Agronomist Plant Science Department, South Dakota State University<br />
Bradley E. Ruden, Plant Pathologist Plant Diagnostic Clinic, South Dakota State University<br />
Thomas E. Schumacher, <strong>Soil</strong> Scientist Plant Science Department, South Dakota State University<br />
Dennis P. Todey, Climatologist State Climate Office, South Dakota State University<br />
Todd P. Trooien, Biosystems Engineer Agricultural and Biosystems Engineering Dept., South Dakota State University<br />
Hal D. Werner, Biosystems Engineer Agricultural and Biosystems Engineering Dept., South Dakota State University<br />
James A. Wilson, Pesticide Specialist Cooperative Extension Service, South Dakota State University<br />
Howard J. Woodard, <strong>Soil</strong> Scientist Plant Science Department, South Dakota State University<br />
Leon J. Wrage, Weed Scientist Plant Science Department, South Dakota State University<br />
Recognition and Acknowledgements:<br />
South Dakota Corn Utilization Council<br />
South Dakota Department of Agriculture<br />
South Dakota Department of Environment and Natural Resources<br />
Cover photos: USDA-NRCS and Kurtis D. Reitsma.<br />
iii
CHAPTER 7<br />
<strong>Soil</strong> <strong>Fertility</strong><br />
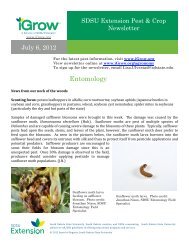
Corn requires sufficient amounts of at least 14 nutrients<br />
for optimal production (fig. 7.1). <strong>Soil</strong> fertility strategies should<br />
consider soil residual plant nutrients, cost of fertilizer relative<br />
to the value of corn, and management techniques that increase<br />
efficiency.<br />
Different fertilizers have different concentrations of plant<br />
nutrients reflected in the grade or percent of each nutrient (%N,<br />
%P 2 O 5 , %K 2 O). Commonly used fertilizers in South Dakota and<br />
their grades are listed in Table 7.1.<br />
Table 7.1. Common fertilizers used in South Dakota<br />
Dry fertilizers<br />
----Percent----<br />
N P 2 O 5 K 2 O<br />
Ammonium nitrate 33 0 0<br />
Urea 46 0 0<br />
Diammonium phosphate (DAP) 18 46 0<br />
Mono-ammonium phosphate (MAP) 11 52 0<br />
Ammonium sulfate (21-0-0-24 S) 21 0 0<br />
Potassium chloride 0 0 60<br />
Potassium nitrate 13 0 44<br />
Liquid fertilizers N P 2 O 5 K 2 O lb/gal.<br />
Urea-ammonium-nitrate (UAN) 28-32 0 0 10.8<br />
Ammonium polyphosphate 10 34 0 10.5<br />
Multigrade (7-21-7) 7 21 7 10.7<br />
Multigrade (9-18-9) 9 18 9 11.0<br />
Gaseous fertilizers N P 2 O 5 K 2 O<br />
Anhydrous ammonia 82 0 0<br />
Figure 7.1. Nutrients required for<br />
corn growth and development<br />
Frequently required fertilizer nutrients for<br />
South Dakota corn production: N, P<br />
Required less often (confirmed response<br />
on some soils): K, Zn, Fe<br />
Rarely required, but some response<br />
reported: S<br />
Supplemental fertilizer not required in<br />
South Dakota: Ca, Mg, Mn, Cu, B, Mo, Ni, Cl<br />
Nitrogen<br />
Phosphorus<br />
Sulfur<br />
Potassium<br />
Zinc<br />
Iron<br />
CO 2<br />
Calcium<br />
O 2<br />
H 2 O<br />
MACRONUTRIENTS (Primary)<br />
SECONDARY NUTRIENTS<br />
MICRONUTRIENTS<br />
Magnesium<br />
Molybdenum<br />
Manganese<br />
Copper<br />
Boron<br />
Nickel<br />
Chlorine<br />
(Modified from Colorado State University)<br />
CHAPTER 7: <strong>Soil</strong> <strong>Fertility</strong> 39
40<br />
CHAPTER 7: <strong>Soil</strong> <strong>Fertility</strong><br />
Corn Yield Expectations<br />
Fertilizer recommendations for nitrogen<br />
(N), phosphorus (P), and potassium (K)<br />
are based on expected yield or “yield goal.”<br />
Calculating yield goals is complicated by<br />
improved genetics, which are gradually increasing<br />
crop yields. Further complications<br />
are introduced by rotations, which reduce<br />
the amount of available information for<br />
specific crops.<br />
General guidelines for calculating yield<br />
goals include the following:<br />
<br />
more than 10 years in yield goal<br />
calculations (Table 7.2).<br />
<br />
should not be included in the calculation.<br />
<br />
potentials, some attempt should be<br />
made to standardize the data (Table<br />
7.3). For example, a field with a yield<br />
of 140 bu/acre 10 years ago may now<br />
produce a yield of 160 bu/acre.<br />
<br />
increasing at an annual rate of ≈2.0 bu/<br />
acre over the past 20 years.<br />
tic,<br />
yield goal is important. Underestimating<br />
yield goal can lead to a gradual<br />
yield decline.<br />
<br />
on management, climate, and soil, and<br />
will likely vary from field to field.<br />
Additional information regarding yield<br />
goals is available in Reitsma et al. (2008).<br />
<strong>Soil</strong> Sampling<br />
<strong>Soil</strong> samples are collected both to<br />
estimate nutrient levels in a field and to<br />
estimate the amount of residual nutrients in<br />
the soil. For accurate estimates, representative<br />
soil samples must be collected. Accuracy<br />
improves both by increasing the number of<br />
subsamples composited into a bulk sample<br />
and by avoiding areas of the field that do not<br />
represent the majority of the field (e.g., old<br />
feedlots, farmsteads, and fence lines). Details<br />
on soil sampling and sample handling are<br />
available in Clay et al. (2002) and Gelderman<br />
et al. (2005). “Rules of thumb” for soil<br />
sampling are provided in Table 7.4.<br />
Table 7.2. Estimating a yield goal from multiple years of data<br />
Field records<br />
Year<br />
1<br />
2<br />
3<br />
4<br />
5<br />
6<br />
7<br />
8<br />
9<br />
10<br />
Base yield goal = 136<br />
#Standardized<br />
yield (bu/A)<br />
136<br />
133<br />
126<br />
128<br />
126<br />
145<br />
*171<br />
163<br />
*112<br />
129<br />
Conditions<br />
Average<br />
Average<br />
Average<br />
Average<br />
Average<br />
Average<br />
Excellent<br />
Excellent<br />
Poor<br />
Average<br />
#Standardized yield considering average annual increase of 2 bu/A/yr.<br />
*Outliers were removed to calculate average yield.<br />
The yield goal + 10% recommendation:<br />
<br />
<br />
Full soil profile at planting<br />
<br />
Average soil profile at planting<br />
136 bushels<br />
Poor moisture conditions at planting<br />
<br />
Producers should be prepared to apply additional fertilizer N as an<br />
in-season side-dress if needed when using the soil moisture approach.<br />
Table 7.3. Methods for estimating yield potential<br />
- Remote sensing<br />
- Field history (field)<br />
age<br />
where the maximum and minimum values have<br />
been removed.<br />
<br />
after outliers have been removed, based on plant<br />
available water at planting.<br />
<br />
- Productivity index<br />
Table 7.4. “Rules of thumb” for soil sampling<br />
<br />
terraces, old fence lines, farmsteads, feedlots, or any<br />
other areas that do not represent the field.<br />
<br />
<br />
<br />
<br />
whole field.<br />
<br />
0-to-24-inch sample and may require an additional 24-to-<br />
48-inch depth increment.<br />
<br />
micronutrients are based on 0-to-6-inch samples.
Grid or management-zone soil sampling can be used to develop site-specific recommendations that<br />
can be used to generate field maps. These maps, in turn, can be used as a basis for precision fertilizer<br />
placement. In grid sampling, a composite sample from each point or cell is collected and analyzed. Grid<br />
or management-zone sample results can be compared with yield monitor data to make more precise<br />
decisions. Further details on precision nutrient management are available in Clay et al. (1997).<br />
Nitrogen Recommendations<br />
N applied to soil undergoes many transformations (fig. 7.2). In some situations, N can even be lost<br />
from the system before the plant can use it. N is mobile in the plant and will move from older growth to<br />
newer growth (translocation), resulting in a yellowing of older leaves (fig. 7.3).<br />
The N recommendations for corn that is to be harvested for grain or silage are different (Table 7.5).<br />
For both corn and silage, though, the N-fertilizer recommendation is the difference between crop need<br />
and N credits. Credits that should be considered include residual soil test N, manure N, legumes (if<br />
grown within the previous 2 years), and irrigation water (see Tables 7.6 and 7.7 for additional information).<br />
Residual soil N is estimated by analyzing a 0-to-24-inch sample collected in the spring. If a soil sample<br />
is not available, residual-soil N can be estimated using the long-term soil test average of 55 lbs. N/acre.<br />
Figure 7.2. Important N transformations in agricultural soils<br />
!"#$%&!'()#%$*+*,#<br />
!"#$%&'(&)*+<br />
:*;/"*$,
42<br />
CHAPTER 7: <strong>Soil</strong> <strong>Fertility</strong><br />
The importance of measured residual-N value<br />
increases with the potential for the soil to contain a<br />
- significant amount of NO -N (fig. 7.4).<br />
3<br />
In sensitive areas, such as folds over shallow<br />
aquifers, an additional sample from the 24-to-48inch<br />
depth should be collected. If soil test N exceeds<br />
- 30 lbs. NO -N/A in the 24-to-48-inch depth, 80%<br />
3<br />
of that soil test N is included in the residual N credit<br />
(Gerwing and Gelderman 2005).<br />
The manure N credit is best determined by<br />
sampling the manure. The sample should be representative<br />
of the source and should be taken after the<br />
material has been well mixed. If the manure is not<br />
sampled, N content can be estimated using values in<br />
Table 7.6.<br />
Legume plants that form symbiotic relationships<br />
with Rhizobium sp. bacteria can provide a<br />
significant amount of N to the crop that follows. In<br />
situations where corn follows soybeans, a credit of<br />
40 lbs. N/acre is recommended. Credits for other<br />
legume crops are provided in Table 7.7.<br />
Additional information on N management is<br />
available in Reitsma et al. (2008).<br />
- Figure 7.4. Probability of significant soil NO – N level<br />
3<br />
(Courtesy of Reitsma et. al. 2008)<br />
Previous Crop<br />
Figure 7.3. Nitrogen deficiency in corn<br />
Note the V-shaped chlorosis in older leaves and that the<br />
lowest leaves (the oldest leaves on the plant) are dead.<br />
(Photo courtesy of Iowa State University)<br />
Table 7.5. Nitrogen fertilizer recommendation<br />
Corn for grain<br />
<br />
Corn for silage<br />
<br />
Where:<br />
<br />
<br />
<br />
(Adapted from Gerwing and Gelderman 2005)<br />
Alfalfa Soybeans Corn<br />
Manured<br />
(Within the Last Two (2) Years)<br />
Yes No<br />
Manured<br />
(Within the Last Two (2) Years)<br />
Yes No<br />
Low High<br />
Precipitation<br />
Low High<br />
Low High Moderate Very High High Very High High<br />
Probability of Significant Residual <strong>Soil</strong> NO 3 - - N Levels
Table 7.6. Estimated nitrogen content of manure<br />
Type of Livestock<br />
Farrowing<br />
Nursery<br />
Grow-Finish<br />
Grow-Finish(deep pit)<br />
Grow-Finish(wet/dry feeder)<br />
Grow-Finish(earthen pit)<br />
Breeding-Gestation<br />
Farrow-Finish<br />
Farrow-Feeder<br />
<br />
<br />
<br />
Veal calf<br />
<br />
Beef cows<br />
Feeder calves<br />
Finishing cattle<br />
Broilers<br />
Pullets<br />
Layers<br />
Tom turkeys<br />
<br />
Ducks<br />
Liquid Manure Solid Manure<br />
Nitrogen (N)<br />
lbs/1000 gal<br />
Nitrogen (N)<br />
lbs/ton<br />
N N N N <br />
7<br />
11<br />
-<br />
17<br />
21<br />
8<br />
13<br />
12<br />
10<br />
25<br />
26<br />
22<br />
26<br />
25<br />
13<br />
19<br />
21<br />
50<br />
48<br />
20<br />
37<br />
40<br />
17<br />
Swine<br />
Dairy<br />
Beef<br />
Poultry<br />
8<br />
14<br />
-<br />
33<br />
39<br />
24<br />
12<br />
16<br />
11<br />
6<br />
6<br />
5<br />
21 6<br />
7<br />
8<br />
8<br />
13<br />
12<br />
37<br />
16<br />
20 5<br />
11 8<br />
10<br />
-<br />
-<br />
-<br />
4<br />
8<br />
5<br />
8<br />
8<br />
8<br />
4<br />
7<br />
4<br />
6<br />
7<br />
34<br />
39<br />
22<br />
32<br />
32<br />
13<br />
(Adapted from Lorimor and Powers 2004)<br />
These values should not be used in place of a regular manure analysis, as<br />
true nutrient content varies drastically depending on feeding and manure<br />
storage and handling practices. Use only for planning purposes.<br />
Table 7.7. Nitrogen credits from previous legume crop<br />
<br />
Alfalfa or 3 Legume<br />
Green Manure<br />
Population<br />
(Plants/ft 2 )<br />
Soybeans, edible beans, peas,<br />
lentils, and other annual legumes<br />
1,2 <br />
(lbs N/Acre)<br />
44<br />
CHAPTER 7: <strong>Soil</strong> <strong>Fertility</strong><br />
is used for acid soils (pH < 7), while the Olsen (O-P)<br />
method is used for basic soils (pH >7). Results from<br />
Mehlich III (MIII) soil tests, which are sometimes<br />
reported by soil testing labs in neighboring states, are<br />
similar to those obtained from the Bray-1 method.<br />
The soil test results represent index values that<br />
coincide with a recommended P fertilizer rate. The<br />
rate of fertilizer P increases with yield goal and/or<br />
with declining soil test P values. As soil test P values<br />
increase, the probability that the crop will show a positive<br />
yield response from applied fertilizer P decreases.<br />
Corn grown in areas where soil test values are very low<br />
(B1-P and MIII-P, 0–5 ppm; O-P, 0–3 ppm) has an<br />
80% chance of showing a yield response. Fertilizer P<br />
recommendations are calculated using the equations<br />
in Table 7.8.<br />
If manure is applied, the recommendation should<br />
be adjusted based on the amount of P contained in<br />
the manure. If an analysis of the manure is available,<br />
assume 90% of total P is available. If an analysis is not<br />
available, calculate P from data in Table 7.9.<br />
Figure 7.6. The phosphorus cycle<br />
The Phosphorus Cycle<br />
Animal manures<br />
and biosolids<br />
Organic phosphorus<br />
<br />
<br />
<br />
Leaching<br />
(usually minor)<br />
Component Input Loss<br />
Mineralization<br />
Plant<br />
residues<br />
Immobilization<br />
<strong>Soil</strong> solution<br />
phosphorus<br />
-2 4 -1<br />
2 PO 4<br />
Plant<br />
uptake<br />
Figure 7.5. P-deficient Corn<br />
<br />
leaf edges and slow and stunted growth. Symptoms most<br />
often appear early in the season, especially in low areas<br />
with high water tables.<br />
(Photo courtesy of Howard J. Woodard, South Dakota State<br />
University)<br />
Crop<br />
harvest<br />
Weathering<br />
Adsorption<br />
Dissolution<br />
Precipitation<br />
Primary<br />
minerals<br />
(apatite)<br />
Desorption<br />
Mineral<br />
Fertilizers<br />
Runoff and<br />
erosion<br />
Mineral surfaces<br />
(clays, carbonates,<br />
Fe and Al oxides)<br />
Secondary<br />
Compounds<br />
(CaP, FeP, MnP, AlP)<br />
(Courtesy of International Plant Nutrition Institute)
Table 7.8. Equations used to calculate<br />
P recommendation<br />
<br />
<br />
Olson P<br />
<br />
Where:<br />
FPR = Fertilizer P Rate (lbs P 2 O 5 /A)<br />
STP = <strong>Soil</strong> Test P Value (ppm)<br />
<br />
(Gerwing and Gelderman 2005)<br />
Banded<br />
Phosphorus in the Environment<br />
Off-site movement of P generally occurs with<br />
runoff and erosion because P is strongly attached<br />
to soil. The transport of P from production fields<br />
to streams and lakes can result in algal blooms.<br />
Transport is minimized by adopting conservation<br />
tillage and other management practices designed<br />
to reduce or contain runoff and erosion. Concentrations<br />
of P in runoff waters can be reduced by<br />
minimizing the exposure of manure and fertilizer<br />
to runoff water (Table 7.10). Adopting these and<br />
other management practices has the potential to<br />
improve the quality of surface water.<br />
Table 7.10. Phosphorus management techniques to<br />
improve water quality<br />
<br />
– incorporate<br />
– inject<br />
– band apply<br />
ment<br />
units – fertilize according to crop need<br />
and soil test.<br />
<br />
surface water or drainage.<br />
<br />
<br />
in fields near surface waters or drainages.<br />
<br />
covered ground.<br />
<br />
reduce erosion and runoff.<br />
Figure 7.7. Band vs. broadcast P application<br />
High Uptake Efficiency<br />
fertilizer<br />
(Illustrations courtesy of Colorado State University)<br />
Low Uptake Efficiency<br />
Broadcast<br />
Table 7.9. *Estimated phosphorus content of manure<br />
Type of Livestock Liquid<br />
P O 2 5<br />
Solid<br />
(Lbs/1,000 gal.)<br />
Swine<br />
(Lbs/ton)<br />
Farrowing 12 6<br />
Nursery 19 8<br />
Grow-Finish(deep pit or solid) 42 9<br />
Grow-Finish(wet/dry feeder) 44 -<br />
Grow-Finish(earthen pit) 22 -<br />
Breeding-Gestation 25 7<br />
Farrow-Finish 24 8<br />
Farrow-Feeder<br />
Dairy<br />
18 7<br />
15 3<br />
14 3<br />
14 3<br />
Veal calf 22 3<br />
<br />
Beef<br />
15 4<br />
Beef cows 16 4<br />
Feeder calves 18 4<br />
Finishing cattle<br />
Poultry<br />
18 7<br />
Broilers 40 53<br />
Pullets 35 35<br />
Layers 52 51<br />
Tom turkeys 40 50<br />
38 50<br />
Ducks 15 21<br />
(Adapted from Lorimor and Powers 2004)<br />
* These values vary drastically depending on feeding and<br />
manure storage and handling practices and are not likely<br />
representative of actual nutrient content of the manure.<br />
Use only for planning purposes. These values should not<br />
be used in place of a regular manure analysis.<br />
CHAPTER 7: <strong>Soil</strong> <strong>Fertility</strong> 45
46<br />
CHAPTER 7: <strong>Soil</strong> <strong>Fertility</strong><br />
Potassium<br />
Potassium-deficiency symptoms appear as leaf<br />
yellowing and burning that begins at the tip of older<br />
leaves (fig. 7.8). Commonly, these symptoms are<br />
observed in sandy soils with low organic matter and in<br />
fields that were previously harvested for silage. About<br />
0.27 lbs. of K 2 O are removed by each bushel of corn<br />
grain, while K 2 O removed with silage averages about<br />
7.3 lbs./ton. Silage’s high potassium (K) removal occurs<br />
1) because K levels in plant material are nearly<br />
three times greater those that found in grain and 2)<br />
because K is soluble and can be washed out of dead<br />
leaves (so when the entire live plant is harvested, most<br />
K is removed from the field). Based on these estimates,<br />
a 150 bu/acre corn crop removes 40.5 lbs. of K 2 O with<br />
the grain.<br />
Most agricultural soils in South Dakota have<br />
relatively high K levels. However, in some situations<br />
there may be a positive response to K fertilizer<br />
applied as starter or broadcast. In South Dakota, K<br />
fertilizer recommendations are based on the amount<br />
of K extracted from a 0-to-6-inch soil sample using<br />
the equations in Table 7.11.<br />
If manure is applied, K fertilizer may not be<br />
needed (manure contains high amounts of K). K fertilizer<br />
can be applied in contact with the seed in small<br />
amounts. However, seed germination can be reduced<br />
from salt damage if the N plus K 2 O in the fertilizer<br />
exceeds 10 lbs./acre.<br />
Secondary and Micronutrients<br />
In most situations, the secondary nutrients (Ca,<br />
Mg, S) and micronutrients (B, Zn, Fe, Cu Mo, Mn) do<br />
not limit yields in South Dakota. Zinc (Zn) deficiencies<br />
can be observed in coarse-textured soils, eroded<br />
soils, organic soils, or soils with high levels of P. Seasonal<br />
climate conditions may also affect Zn availability,<br />
as Zn-deficiency symptoms are often observed in<br />
cool, wet soils. Corn suffering from Zn deficiency can<br />
be seen in fig. 7.9.<br />
Iron (Fe) deficiencies may be observed in leveled<br />
or eroded sites when calcareous subsoils have been<br />
exposed and pH levels are above 7. Fe-deficiency<br />
symptoms in corn are observed as yellowing with<br />
interveinal striping of younger leaves (fig. 7.10).<br />
Correcting for Fe deficiency can be difficult; the best<br />
approach is to incorporate manure or biosolids in<br />
problem areas.<br />
Micronutrient deficiencies usually result from<br />
environmental conditions and may be temporary or<br />
have little effect on yield. If micronutrient deficiencies<br />
Figure 7.8. Potassium-deficient corn<br />
Potassium-deficiency symptoms appear as burning of<br />
leaf edges.<br />
(Photo courtesy of University of Georgia–Athens)<br />
Table 7.11. Calculating a K recommendation<br />
<br />
<br />
<br />
<br />
Where:<br />
FKR = Fertilizer K Rate (lbs K 2 O/A)<br />
STK = <strong>Soil</strong> Test K Value (ppm)<br />
<br />
A minimum of 60 lbs K 2 O/A is recommended.<br />
(Gerwing & Gelderman 2005)<br />
Figure 7.9. Zinc deficiency in corn<br />
Zinc-deficiency symptoms are shown on the youngest<br />
leaves and appear as feathering and striping.<br />
(Photo courtesy of University of Georgia)<br />
Figure 7.10. Iron deficiency in corn<br />
<br />
(Photo courtesy of University of Georgia)
are suspected, soil testing is recommended. Recommendations<br />
for Zn and Fe can be found in Table<br />
17.12.<br />
Considerations for No-Till<br />
No-tillage can result in slower early season growth.<br />
Starter fertilizer applied with or near the seed can<br />
be used to enhance early season growth. If N or K is<br />
applied with the seed, the total amount added should<br />
not exceed 10 lbs. of N + K 2 O. If possible, N fertilizer<br />
should be subsurface band applied. In no-tillage systems,<br />
it is recommended that the N rate be increased<br />
30 lbs./acre. Broadcasting urea onto residue-covered<br />
fields in the fall can result in a substantial amount of<br />
N loss. To increase N-use efficiency, it is recommended<br />
that the N be spring-applied.<br />
Table 7.12. Zinc and iron recommendations<br />
Zinc soil test Zinc recommendations<br />
interpretation (ppm) (lb/acre1 )<br />
0.0–0.25 Very low 10<br />
0.26–0.50 Low 10<br />
0.51–0.75 Medium 5<br />
0<br />
1.01+ Very high 0<br />
1Based on inorganic products as source of zinc,<br />
such as zinc sulfate.<br />
<br />
ppm<br />
<br />
<br />
recommendations<br />
lb/acre<br />
0–2.5 Low 0.15<br />
2.6–4.5 Medium 0.15<br />
0<br />
(Gerwing and Gelderman 2005)<br />
Additional Information and References<br />
Clay, D.E., C.G. Carlson, K. Brix Davis, J. Oolman, and B. Berg. 1997. <strong>Soil</strong> sampling strategies for estimating<br />
residual nitrogen. J. Production Agriculture. 10: 446-51.<br />
Clay, D.E., N. Kitchen, C.G. Carlson, J.C. Kleinjan and W.A. Tjentland. 2002. Collecting representative<br />
soil samples for N and P fertilizer recommendations. Crop Management. http://www.plantmanagementnetwork.org/cm/.<br />
Gelderman, R., Gerwing J. and K. Reitsma. 2005. Recommended soil sampling methods for South Dakota.<br />
FS935. South Dakota State University, South Dakota Cooperative Extension Service, South<br />
Dakota Department of Agriculture. Brookings, SD. http://agbiopubs.sdstate.edu.<br />
Gerwing, J. and R. Gelderman. 2005. Fertilizer recommendations guide. EC750. South Dakota State<br />
University, South Dakota Cooperative Extension Service, United States Department of Agriculture.<br />
Brookings, SD. http://agbiopubs.sdstate.edu/articles/EC750.pdf.<br />
Lorimor, J. and W. Powers. 2004. Manure characteristics–manure management systems series. Midwest<br />
Plan Service – 18, Sec. 1, 2nd ed. Ames, IA.<br />
Reitsma, K.D., R.H. Gelderman, P. Skiles, K. Alverson, J. Hemenway, H.J. Woodard, T.E. Schumacher,<br />
D.D. Malo and D.E. Clay. 2008. Nitrogen Best Management Practices for Corn in South Dakota.<br />
FS941. South Dakota State University, South Dakota Cooperative Extension Service, South Dakota<br />
Department of Agriculture. Brookings, SD. http://agbiopubs.sdstate.edu.<br />
Rehm, G., G. Randall, J. Lamb, and R. Eliason. 2006. Fertilizing corn in Minnesota. FO-3790-C. U. of<br />
Minn. Ext. Service, St. Paul, MN. http://www.soils.umn.edu.<br />
––––––––––––––––––––––––––––––––––––––––––––––––––––––––––––––––––––––––––––––––––––––<br />
Clay, D.E., and K.D. Reitsma. 2009. “<strong>Soil</strong> fertility.” Pp. 39-48. In Clay, D.E., K.D. Reitsma, and S.A, Clay<br />
(eds). Best Management Practices for Corn Production in South Dakota. EC929. South Dakota<br />
State University, South Dakota Cooperative Extension Service, Brookings, SD.<br />
Support for this document was provided by South Dakota State University, South Dakota Cooperative<br />
Extension Service, South Dakota Agricultural Experiment Station; South Dakota Corn Utilization<br />
Council; USDA-CSREES-406; South Dakota Department of Environment and Natural Resources<br />
through EPA-319; South Dakota USGS Water Resources Institute; USDA-North Central Region SARE<br />
program; Colorado Corn Growers Association; and Colorado State University.<br />
CHAPTER 7: <strong>Soil</strong> <strong>Fertility</strong> 47
48<br />
CHAPTER 7: <strong>Soil</strong> <strong>Fertility</strong>