2009 Sunflower South Dakota Hybrid Performance Trials - iGrow
2009 Sunflower South Dakota Hybrid Performance Trials - iGrow
2009 Sunflower South Dakota Hybrid Performance Trials - iGrow

You also want an ePaper? Increase the reach of your titles
YUMPU automatically turns print PDFs into web optimized ePapers that Google loves.
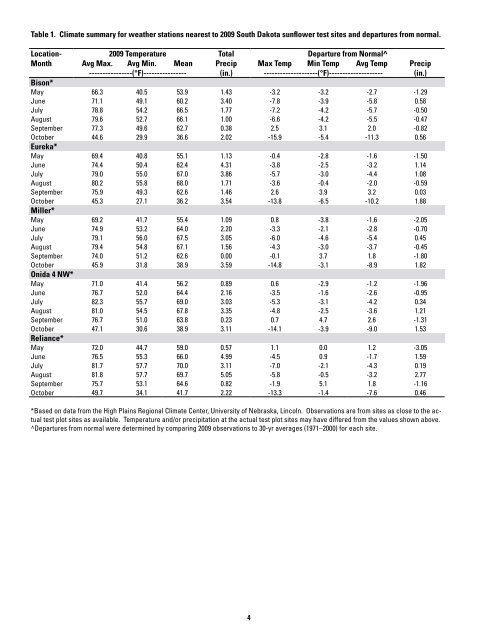
Table 1. Climate summary for weather stations nearest to <strong>2009</strong> <strong>South</strong> <strong>Dakota</strong> sunflower test sites and departures from normal.<br />
Location-<br />
Month<br />
<strong>2009</strong> Temperature Total Departure from Normal^<br />
Avg Max. Avg Min. Mean Precip Max Temp Min Temp Avg Temp Precip<br />
----------------(°F)---------------- (in.) --------------------(°F)-------------------- (in.)<br />
Bison*<br />
May 66.3 40.5 53.9 1.43 -3.2 -3.2 -2.7 -1.29<br />
June 71.1 49.1 60.2 3.40 -7.8 -3.9 -5.8 0.58<br />
July 78.8 54.2 66.5 1.77 -7.2 -4.2 -5.7 -0.50<br />
August 79.6 52.7 66.1 1.00 -6.6 -4.2 -5.5 -0.47<br />
September 77.3 49.6 62.7 0.38 2.5 3.1 2.0 -0.82<br />
October 44.6 29.9 36.6 2.02 -15.9 -5.4 -11.3 0.56<br />
Eureka*<br />
May 69.4 40.8 55.1 1.13 -0.4 -2.8 -1.6 -1.50<br />
June 74.4 50.4 62.4 4.31 -3.8 -2.5 -3.2 1.14<br />
July 79.0 55.0 67.0 3.86 -5.7 -3.0 -4.4 1.08<br />
August 80.2 55.8 68.0 1.71 -3.6 -0.4 -2.0 -0.59<br />
September 75.9 49.3 62.6 1.46 2.6 3.9 3.2 0.03<br />
October 45.3 27.1 36.2 3.54 -13.8 -6.5 -10.2 1.88<br />
Miller*<br />
May 69.2 41.7 55.4 1.09 0.8 -3.8 -1.6 -2.05<br />
June 74.9 53.2 64.0 2.20 -3.3 -2.1 -2.8 -0.70<br />
July 79.1 56.0 67.5 3.05 -6.0 -4.6 -5.4 0.45<br />
August 79.4 54.8 67.1 1.56 -4.3 -3.0 -3.7 -0.45<br />
September 74.0 51.2 62.6 0.00 -0.1 3.7 1.8 -1.80<br />
October 45.9 31.8 38.9 3.59 -14.8 -3.1 -8.9 1.82<br />
Onida 4 NW*<br />
May 71.0 41.4 56.2 0.89 0.6 -2.9 -1.2 -1.96<br />
June 76.7 52.0 64.4 2.16 -3.5 -1.6 -2.6 -0.95<br />
July 82.3 55.7 69.0 3.03 -5.3 -3.1 -4.2 0.34<br />
August 81.0 54.5 67.8 3.35 -4.8 -2.5 -3.6 1.21<br />
September 76.7 51.0 63.8 0.23 0.7 4.7 2.6 -1.31<br />
October 47.1 30.6 38.9 3.11 -14.1 -3.9 -9.0 1.53<br />
Reliance*<br />
May 72.0 44.7 59.0 0.57 1.1 0.0 1.2 -3.05<br />
June 76.5 55.3 66.0 4.99 -4.5 0.9 -1.7 1.59<br />
July 81.7 57.7 70.0 3.11 -7.0 -2.1 -4.3 0.19<br />
August 81.8 57.7 69.7 5.05 -5.8 -0.5 -3.2 2.77<br />
September 75.7 53.1 64.6 0.82 -1.9 5.1 1.8 -1.16<br />
October 49.7 34.1 41.7 2.22 -13.3 -1.4 -7.6 0.46<br />
*Based on data from the High Plains Regional Climate Center, University of Nebraska, Lincoln. Observations are from sites as close to the actual<br />
test plot sites as available. Temperature and/or precipitation at the actual test plot sites may have differed from the values shown above.<br />
^Departures from normal were determined by comparing <strong>2009</strong> observations to 30-yr averages (1971–2000) for each site.<br />
4