Hockey sticks, principal components, and spurious significance
Hockey sticks, principal components, and spurious significance
Hockey sticks, principal components, and spurious significance

You also want an ePaper? Increase the reach of your titles
YUMPU automatically turns print PDFs into web optimized ePapers that Google loves.
GEOPHYSICAL RESEARCH LETTERS, VOL. 32, L20701, doi:10.1029/2005GL022753, 2005<br />
Comment on ‘‘<strong>Hockey</strong> <strong>sticks</strong>, <strong>principal</strong> <strong>components</strong>, <strong>and</strong> <strong>spurious</strong><br />
<strong>significance</strong>’’ by S. McIntyre <strong>and</strong> R. McKitrick<br />
Hans von Storch <strong>and</strong> Eduardo Zorita<br />
GKSS Research Centre, Geesthacht, Germany<br />
Received 18 February 2005; revised 2 September 2005; accepted 2 September 2005; published 21 October 2005.<br />
Citation: von Storch, H., <strong>and</strong> E. Zorita (2005), Comment on<br />
‘‘<strong>Hockey</strong> <strong>sticks</strong>, <strong>principal</strong> <strong>components</strong>, <strong>and</strong> <strong>spurious</strong> <strong>significance</strong>’’<br />
by S. McIntyre <strong>and</strong> R. McKitrick, Geophys. Res. Lett., 32,<br />
L20701, doi:10.1029/2005GL022753.<br />
[1] We analyse a climate simulation of the last millennium<br />
to check whether the ‘‘artificial hockey stick’’ (AHS) effect<br />
introduced by biased centering has a significant bearing on<br />
the performance of historical climate reconstructions. The<br />
‘‘hockey stick’’ shaped reconstructions of the northern<br />
hemisphere temperature has been a contested icon in climate<br />
science since a it was advanced by the IPCC as likely<br />
temperature history, against which the recent warming<br />
trends should be evaluated [Intergovernmental Panel on<br />
Climate Change, 2001]. This reconstruction has by now<br />
faced a number of challenges on different grounds. One of<br />
challenges was brought forward by McIntyre <strong>and</strong> McKitrick<br />
[2005] (hereinafter referred to as MM05), who had noted<br />
that the original code contained an uncommon mathematical<br />
procedure. In this study we examine whether this uncommon<br />
procedure, which under certain circumstances can<br />
result in ‘‘artificial hockey <strong>sticks</strong>’’, would affect the final<br />
result of the reconstruction.<br />
[2] The statistical method behind the ‘‘hockey stick’’<br />
temperature reconstruction [Mann et al., 1998] (hereinafter<br />
referred to as MBH98) is based on an inverted regression<br />
method, which maps proxy data on the Northern Hemisphere<br />
temperature field. The proxy-data are irregularly<br />
distributed over the globe, <strong>and</strong> in some regions their<br />
spatial density (mainly for dendroclimatological data) is<br />
high. To avoid overweighting these regions, a Principal<br />
Component Analysis (PCA) was used to condense these<br />
spatially clustered proxy data into a few <strong>principal</strong> <strong>components</strong>.<br />
MM05 noted that MBH98 normalized their data<br />
unconventionally prior to the PCA, by centering the time<br />
series relative to the instrumental-period mean, 1902–<br />
1980, instead of relative to the whole available period.<br />
Why this was done is unclear. It is, however, not entirely<br />
uncommon in climate sciences.<br />
[3] MM05 performed a Monte Carlo study with a series<br />
of independent red-noise series; they centered their 1000<br />
year-series relative to the mean of the last 100 years, <strong>and</strong><br />
calculated the PCs based on the correlation matrix. It turned<br />
out that very often the leading PCs show a hockey stick<br />
pattern, even if the data field was by construction free of<br />
such structures. This finding was recently confirmed by<br />
others (F. Zwiers, personal communication). The paradox in<br />
Copyright 2005 by the American Geophysical Union.<br />
0094-8276/05/2005GL022753$05.00<br />
the AHS effect is that the true covariance matrix is a unity<br />
matrix, so that no real structures will steer the eventual<br />
selection of the eigenvectors. However, in the biased<br />
centering approach, those time series with largest differences<br />
between their 1000–1901 mean <strong>and</strong> 1902–1980<br />
mean will tend to contribute more strongly to the leading<br />
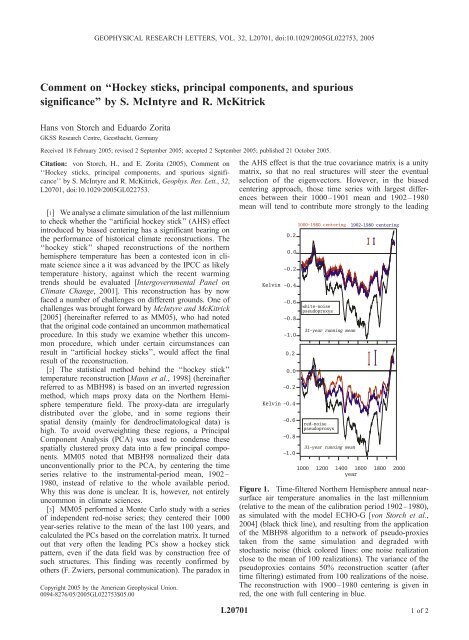
Figure 1. Time-filtered Northern Hemisphere annual nearsurface<br />
air temperature anomalies in the last millennium<br />
(relative to the mean of the calibration period 1902–1980),<br />
as simulated with the model ECHO-G [von Storch et al.,<br />
2004] (black thick line), <strong>and</strong> resulting from the application<br />
of the MBH98 algorithm to a network of pseudo-proxies<br />
taken from the same simulation <strong>and</strong> degraded with<br />
stochastic noise (thick colored lines: one noise realization<br />
close to the mean of 100 realizations). The variance of the<br />
pseudoproxies contains 50% reconstruction scatter (after<br />
time filtering) estimated from 100 realizations of the noise.<br />
The reconstruction with 1900–1980 centering is given in<br />
red, the one with full centering in blue.<br />
L20701 1of2
L20701 VON STORCH AND ZORITA: COMMENTARY L20701<br />
PCs, thus producing an artificial hockey-stick shape. The<br />
MBH98 algorithm, however, involves several other steps<br />
<strong>and</strong> it is not clear if the AHS-effect carries any relevance for<br />
the final temperature reconstructions.<br />
[4] We had previously used multicentennial climate<br />
simulations with the coupled models ECHO-G <strong>and</strong><br />
HadCM3 to test the MBH98 reconstruction method [von<br />
Storch et al., 2004]. The models were driven by estimations<br />
of past solar irradiance, radiative effects of volcanic<br />
eruptions <strong>and</strong> concentrations of greenhouse gases for the<br />
past 1000 years. In that test simulated grid-point temperatures,<br />
collocated with the frozen-in complete proxy network<br />
of MBH98 <strong>and</strong> degraded with statistical noise,<br />
played the role of pseudo-proxies. In the von Storch et<br />
al. [2004] test, the PCA of the pseudoproxies was not<br />
included, as the resolution of the model is coarse enough to<br />
prevent excessive clustering. Thus the AHS effect could<br />
not play a role in that analysis.<br />
[5] We have redone the test, this time including the<br />
previous PCA of the pseudoproxies. The PCA was applied<br />
to the pseudoproxies after AHS-centering or after centering<br />
relative to the millennial mean. The PCA was carried out<br />
with annual values in three areas separately (North America,<br />
South America, <strong>and</strong> Australia). The numbers of PCs<br />
retained for the subsequent steps was decided from the<br />
eigenvalue spectrum following accepted rules [North et al.,<br />
1982], but these (within a reasonable range) had only a very<br />
minor influence on the results. Two types of noise were<br />
tested: white noise <strong>and</strong> red-noise. A guideline for the amount<br />
of added white noise is the local correlation r between real<br />
proxies <strong>and</strong> nearby temperature observations, which usually<br />
lies in the range r = 0.3–0.7 [Jones <strong>and</strong> Mann, 2004]. This<br />
corresponds to a noise variance between 85% <strong>and</strong> 50% of<br />
the total variance [von Storch et al., 2004]. The level of<br />
noise at centennial timescales, or alternatively the steepness<br />
of the spectrum of an AR-1 noise, is very uncertain, so that<br />
only rough guesses can be used.<br />
[6] Figure 1 (top) shows the result of these pseudoreconstructions<br />
for one realization of the white noise (with<br />
noise variance 50%) <strong>and</strong> (bottom) one realization of the red<br />
noise (high-frequency noise variance 50% <strong>and</strong> with 1-year<br />
lag autocorrelation of a = 0.8): in both cases PCA-centerings<br />
has a small relevance for the final result <strong>and</strong> the<br />
differences are within the uncertainty range (Figure 1).<br />
The conclusion is essentially the same for all realizations<br />
2of2<br />
<strong>and</strong> other constructions of noise. For instance, white noise<br />
with r = 0.7 yields a st<strong>and</strong>ard deviation of the differences of<br />
0.006K; r = 0.4 yields 0.007K; red noise with a = 0.5 <strong>and</strong><br />
r = 0.7 (r = 0.4) yields 0.01K (0.02K); red noise with a =0.8<br />
<strong>and</strong> r = 0.7 (r = 0.4) yields 0.02K(0.03K). Therefore, the<br />
differences increase slightly with the amount <strong>and</strong> redness of<br />
the noise, but they remain small, even in the case of high <strong>and</strong><br />
red noise with a steep red spectrum.<br />
[7] Our results, derived in the artificial world of an<br />
extended historical climate simulation, indicate therefore<br />
that the AHS does not have a significant impact but leads<br />
only to very minor deviations. We suggest, however, that<br />
this biased centering should be in future avoided as it may<br />
unnecessarily compromise the final result.<br />
[8] Finally, we note that we have strictly addressed here<br />
the question of the PCA-centering within the MBH98<br />
algorithm. Other concerns raised by MM05 [see, e.g., Crok,<br />
2005] about the MBH methodology have been not dealt<br />
with.<br />
[9] Acknowledgment. This work was accomplished within the EU<br />
project SO&P.<br />
References<br />
Crok, M. (2005), Kyoto Protocol based on flawed statistics, Naturwetenskap<br />
Techniek, 2, 20–31.<br />
Intergovernmental Panel on Climate Change (IPCC) (2001), Climate<br />
Change 2001: The Scientific Basis: Contribution of Working Group I<br />
to the Third Assessment Report of the Intergovernmental Panel on Climate<br />
Change, edited by J. T. Houghton et al., 881 pp., Cambridge Univ.<br />
Press, New York.<br />
Jones, P. D., <strong>and</strong> M. E. Mann (2004), Climate over past millennia, Rev.<br />
Geophys., 42(2), RG2002, doi:10.1029/2003RG000143.<br />
Mann, M. E., R. S. Bradley, <strong>and</strong> M. K. Hughes (1998), Global-scale temperature<br />
patterns <strong>and</strong> climate forcing over the past 6 six centuries, Nature,<br />
392, 779–787.<br />
McIntyre, M., <strong>and</strong> R. McKitrick (2005), <strong>Hockey</strong> <strong>sticks</strong>, <strong>principal</strong> <strong>components</strong><br />
<strong>and</strong> <strong>spurious</strong> <strong>significance</strong>, Geophys. Res. Lett., 32, L03710,<br />
doi:10.1029/2004GL021750.<br />
North, G. R., T. L. Bell, R. F. Cahalan, <strong>and</strong> F. J. Moeng (1982), Sampling<br />
errors in the estimation of empirical orthogonal functions, Mon. Weather<br />
Rev., 110, 699–706.<br />
von Storch, H., E. Zorita, J. Jones, Y. Dimitriev, F. González-Rouco, <strong>and</strong><br />
S. Tett (2004), Reconstructing past climate from noisy data, Science, 306,<br />
679–682.<br />
H. von Storch <strong>and</strong> E. Zorita, GKSS Research Centre, D-21502<br />
Geesthacht, Germany. (storch@gkss.de)