Midterm 00-3 - People.stat.sfu.ca
Midterm 00-3 - People.stat.sfu.ca
Midterm 00-3 - People.stat.sfu.ca

Create successful ePaper yourself
Turn your PDF publications into a flip-book with our unique Google optimized e-Paper software.
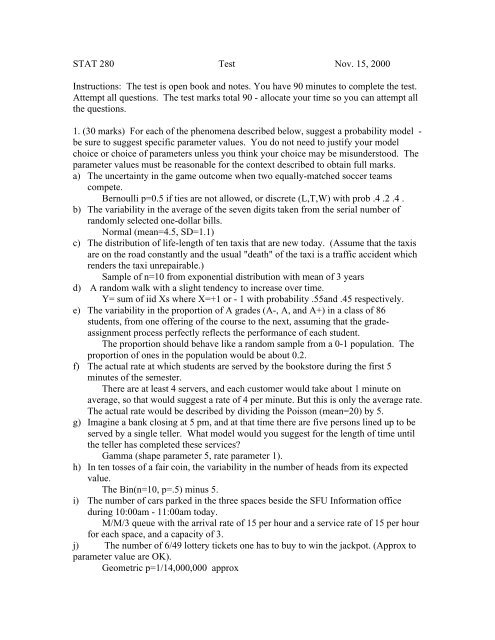
STAT 280 Test Nov. 15, 2<strong>00</strong>0<br />
Instructions: The test is open book and notes. You have 90 minutes to complete the test.<br />
Attempt all questions. The test marks total 90 - allo<strong>ca</strong>te your time so you <strong>ca</strong>n attempt all<br />
the questions.<br />
1. (30 marks) For each of the phenomena described below, suggest a probability model -<br />
be sure to suggest specific parameter values. You do not need to justify your model<br />
choice or choice of parameters unless you think your choice may be misunderstood. The<br />
parameter values must be reasonable for the context described to obtain full marks.<br />
a) The uncertainty in the game outcome when two equally-matched soccer teams<br />
compete.<br />
Bernoulli p=0.5 if ties are not allowed, or discrete (L,T,W) with prob .4 .2 .4 .<br />
b) The variability in the average of the seven digits taken from the serial number of<br />
randomly selected one-dollar bills.<br />
Normal (mean=4.5, SD=1.1)<br />
c) The distribution of life-length of ten taxis that are new today. (Assume that the taxis<br />
are on the road constantly and the usual "death" of the taxi is a traffic accident which<br />
renders the taxi unrepairable.)<br />
Sample of n=10 from exponential distribution with mean of 3 years<br />
d) A random walk with a slight tendency to increase over time.<br />
Y= sum of iid Xs where X=+1 or - 1 with probability .55and .45 respectively.<br />
e) The variability in the proportion of A grades (A-, A, and A+) in a class of 86<br />
students, from one offering of the course to the next, assuming that the gradeassignment<br />
process perfectly reflects the performance of each student.<br />
The proportion should behave like a random sample from a 0-1 population. The<br />
proportion of ones in the population would be about 0.2.<br />
f) The actual rate at which students are served by the bookstore during the first 5<br />
minutes of the semester.<br />
There are at least 4 servers, and each customer would take about 1 minute on<br />
average, so that would suggest a rate of 4 per minute. But this is only the average rate.<br />
The actual rate would be described by dividing the Poisson (mean=20) by 5.<br />
g) Imagine a bank closing at 5 pm, and at that time there are five persons lined up to be<br />
served by a single teller. What model would you suggest for the length of time until<br />
the teller has completed these services?<br />
Gamma (shape parameter 5, rate parameter 1).<br />
h) In ten tosses of a fair coin, the variability in the number of heads from its expected<br />
value.<br />
The Bin(n=10, p=.5) minus 5.<br />
i) The number of <strong>ca</strong>rs parked in the three spaces beside the SFU Information office<br />
during 10:<strong>00</strong>am - 11:<strong>00</strong>am today.<br />
M/M/3 queue with the arrival rate of 15 per hour and a service rate of 15 per hour<br />
for each space, and a <strong>ca</strong>pacity of 3.<br />
j) The number of 6/49 lottery tickets one has to buy to win the jackpot. (Approx to<br />
parameter value are OK).<br />
Geometric p=1/14,<strong>00</strong>0,<strong>00</strong>0 approx
2. (15 marks) Fatal traffic accidents in the City of Vancouver occur at the rate of 2 per<br />
month. Making whatever simplifying assumptions are reasonable and useful, compute<br />
the following (Show your <strong>ca</strong>lculations, or otherwise explain how you arrived at your<br />
numeri<strong>ca</strong>l answers.).<br />
a) The probability that exactly two accidents occur in the next 30 days.<br />
Poisson mean 2 P(X=2)=.27<br />
b) The probability that at least one accident occurs in the next 30 days.<br />
1-.135=.865.<br />
c) The average number of days until three more accidents occur.<br />
Mean of Gamma(3,2) = 3/2 months or 45 days.<br />
d) Given that exactly three accidents have occurred so far this month, what is the<br />
probability that no more accidents will occur this month.<br />
.135 (as in b, be<strong>ca</strong>use of independent increments)<br />
e) The probability that more than 24 accidents occur in the next 12 months.<br />
.5 by normal approximation (bit less if continuity correction used)<br />
3. (18 marks) Students leaving the SFU Bennett Library are classified as turning left,<br />
right or proceeding across the mall towards the Maggie Benston Building. There is the<br />
oc<strong>ca</strong>sional student who is not thinking where they want to go, and instead simply follow<br />
the direction of the person in front of them.<br />
a) Construct a Markov Chain to describe this sequence of students<br />
Let <strong>stat</strong>e space be L,S,R for Left, Straight, and Mall.<br />
1 step trans matrix is .45 .20 .35<br />
.35 .30 .35<br />
.35 .20 .45<br />
b) Compute the proportion of students turning right, assuming your Markov Chain model<br />
to be correct.<br />
.45 x1 + .35 x2 +.35 x3 = x1<br />
.20 x1 + .30 x2 + .20 x3 = x2<br />
x1 + x2 + x3 = 1<br />
which produces x1=x3=.39 x2=.22 (rounded) So x3=.39 is the required proportion.<br />
(For marking, if the equations are right, and the answer reasonable, accept as correct.)<br />
c) Suppose you observe a student who chooses to go across the Mall. Suggest three<br />
ways to compute the average number of steps in the Markov Chain until another student<br />
crosses the Mall. (No <strong>ca</strong>lculations necessary, just write enough to indi<strong>ca</strong>te that you know<br />
the methods.)<br />
i) simulation<br />
ii) Theorem 4.6-4 and use high power of 1-step transition matrix<br />
iii) Theorem 4.6-4 and Theorem 4.6-3<br />
ii) and iii) could be deemed to be the same method, so I guess give full<br />
marks for two ways (bonus for three?).
4. (16 marks)<br />
Customers arrive at a service desk at the rate of 20 per hour. There are three employees<br />
serving customers at the service desk, and each one takes an average of four minutes to<br />
serve a customer. Making whatever simplifying assumptions are reasonable and useful to<br />
answer the following questions:<br />
a) How often will all the servers be busy?<br />
Compute PI0=.29 and PI3=.115 using formulas on pp 309-310<br />
b) How would you <strong>ca</strong>lculate (exactly, not with simulation) the average amount of time a<br />
customer will spend at the service desk (waiting and being served) before his service is<br />
completed?<br />
Use Little's formula on p 312. LambdaA is 20 and E(N) <strong>ca</strong>n be computed from<br />
the PI0, PI1, PI2, and PI3 as in part a).<br />
5. (11 marks)<br />
An M/M/2 queuing system is a model for a service desk. A simulation of the model<br />
produces the following results for the first five customers:<br />
Customer arrivals services<br />
1 2.90 2.71<br />
2 1.24 1.67<br />
3 0.49 1.85<br />
4 1.34 2.27<br />
5 0.50 7.59<br />
The "arrivals" column records the interarrival time in minutes between customer n-1 and<br />
customer n. (2.90 is the time from the start of the process until the first customer arrives.)<br />
The "services" column gives the service time for each customer. Draw a graph of the<br />
queue length for the first 10 minutes the service desk is open. (The graph <strong>ca</strong>n be<br />
freehand, but must be accurate enough to show that you know how to use the data given<br />
to construct the queue-length graph).<br />
5. ANS.<br />
An accurate graph is shown below. Of course the hand-drawn one would be less<br />
precise, but should have the major features for full marks.
Further note to marker:<br />
Concerning the queue graph:<br />
The program produces this:<br />
Tn Dn<br />
1 2.90 5.61<br />
2 4.14 5.81<br />
3 4.63 7.46<br />
4 5.97 8.24<br />
5 6.47 15.05<br />
3<br />
2<br />
1<br />
0<br />
0<br />
the starting and finishing times for each arrival. Here is a detailed<br />
verifi<strong>ca</strong>tion of this.<br />
5<br />
Time<br />
The queue jumps up to 1 at 2.90 and 2 at 4.14, and person #3 <strong>ca</strong>n't start<br />
until #1 finishes at 5.61. So at 4.63, the queue jumps to 3. At 5.61, #1 completes and # 3<br />
starts, dropping the queue to 2. ( So #3 finishes at 5.61 + 1.85 = 7.46.) At 5.81 #2<br />
completes so the queue drops to 1<br />
until # 4 arrives at 5.97, when it jumps back up to 2. When #5 arrives at 6.47, the queue<br />
jumps up to 3 since #3 and #4 are still being served. At 7.46,<br />
#3 completes and # 5 service starting then, so the queue drops to 2. At 8.24,<br />
# 4 completes and the queue drops to 1 and stays there past the 10 minute mark.<br />
I think my graph shows this fairly accurately. When I did a finer grid (1<strong>00</strong>0<br />
points instead of 1<strong>00</strong>) it shows the same pattern but with more abrupt rises and falls.<br />
10<br />
15
Concerning the queue graph:<br />
The program produces this:<br />
Tn Dn<br />
1 2.90 5.61<br />
2 4.14 5.81<br />
3 4.63 7.46<br />
4 5.97 8.24<br />
5 6.47 15.05<br />
the starting and finishing times for each arrival. Here is a detailed<br />
verifi<strong>ca</strong>tion of this.<br />
The queue jumps up to 1 at 2.90 and 2 at 4.14, and person #3 <strong>ca</strong>n't start<br />
until #1 finishes at 5.61. So at 4.63, the queue jumps to 3. At 5.61, #1 completes and # 3<br />
starts, dropping the queue to 2. ( So #3 finishes at 5.61 + 1.85 = 7.46.) At 5.81 #2<br />
completes so the queue drops to 1<br />
until # 4 arrives at 5.97, when it jumps back up to 2. When #5 arrives at 6.47, the queue<br />
jumps up to 3 since #3 and #4 are still being served. At 7.46,<br />
#3 completes and # 5 service starting then, so the queue drops to 2. At 8.24,<br />
# 4 completes and the queue drops to 1 and stays there past the 10 minute mark.<br />
I think my graph shows this fairly accurately. When I did a finer grid (1<strong>00</strong>0<br />
points instead of 1<strong>00</strong>) it shows the same pattern but with more abrupt rises and falls.