Create successful ePaper yourself
Turn your PDF publications into a flip-book with our unique Google optimized e-Paper software.
Review of Operations<br />
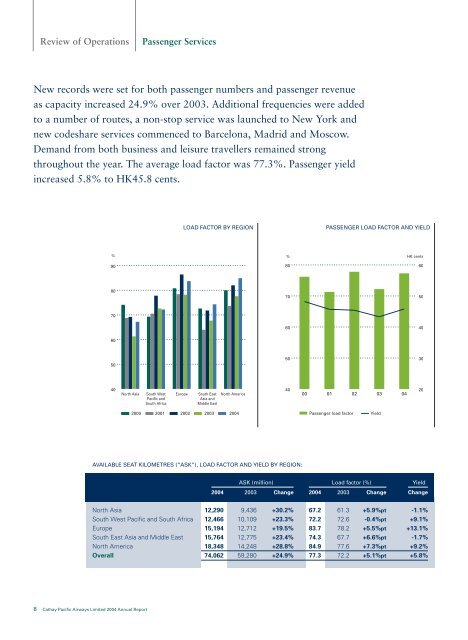
New records were set for both passenger numbers and passenger revenue<br />
as capacity increased 24.9% over 2003. Additional frequencies were added<br />
to a number of routes, a non-stop service was launched to New York and<br />
new codeshare services commenced to Barcelona, Madrid and Moscow.<br />
Demand from both business and leisure travellers remained strong<br />
throughout the year. The average load factor was 77.3%. Passenger yield<br />
increased 5.8% to HK45.8 cents.<br />
<br />
<br />
<br />
<br />
<br />
<br />
<br />
<br />
8 Cathay Pacific Airways Limited <strong>2004</strong> <strong>Annual</strong> <strong>Report</strong><br />
<br />
Passenger Services<br />
<br />
<br />
<br />
<br />
<br />
LOAD FACTOR BY REGION PASSENGER LOAD FACTOR AND YIELD<br />
<br />
<br />
<br />
<br />
AVAILABLE SEAT KILOMETRES (“ASK”), LOAD FACTOR AND YIELD BY REGION:<br />
<br />
<br />
<br />
<br />
<br />
<br />
<br />
<br />
<br />
<br />
<br />
<br />
<br />
<br />
<br />
<br />
ASK (million) Load factor (%) Yield<br />
<strong>2004</strong> 2003 Change <strong>2004</strong> 2003 Change Change<br />
North Asia 12,290 9,436 +30.2% 67.2 61.3 +5.9%pt -1.1%<br />
South West Pacific and South Africa 12,466 10,109 +23.3% 72.2 72.6 -0.4%pt +9.1%<br />
Europe 15,194 12,712 +19.5% 83.7 78.2 +5.5%pt +13.1%<br />
South East Asia and Middle East 15,764 12,775 +23.4% 74.3 67.7 +6.6%pt -1.7%<br />
North America 18,348 14,248 +28.8% 84.9 77.6 +7.3%pt +9.2%<br />
Overall 74,062 59,280 +24.9% 77.3 72.2 +5.1%pt +5.8%


