Optical intensity analyses of Er3+:YAlO3 - PHYSICS & ASTRONOMY
Optical intensity analyses of Er3+:YAlO3 - PHYSICS & ASTRONOMY
Optical intensity analyses of Er3+:YAlO3 - PHYSICS & ASTRONOMY

You also want an ePaper? Increase the reach of your titles
YUMPU automatically turns print PDFs into web optimized ePapers that Google loves.
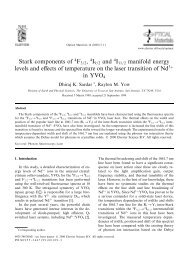
<strong>Optical</strong> <strong>intensity</strong> <strong>analyses</strong> <strong>of</strong> Er 3+ :YAlO 3<br />
Dhiraj K. Sardar, a Sreerenjini Chandrasekharan, Kelly L. Nash, and John B. Gruber<br />
Department <strong>of</strong> Physics and Astronomy, University <strong>of</strong> Texas at San Antonio,<br />
San Antonio, Texas 78249-0697, USA<br />
Received 25 April 2008; accepted 9 May 2008; published online 17 July 2008<br />
Analyses <strong>of</strong> the optical absorption and emission intensities are performed on <strong>Er3+</strong> ions doped into<br />
yttrium orthoaluminate <strong>YAlO3</strong> to assess this material as a laser source. The Judd–Ofelt model is<br />
applied to the room temperature absorption intensities <strong>of</strong> <strong>Er3+</strong> in <strong>YAlO3</strong> to obtain the<br />
phenomenological <strong>intensity</strong> parameters: 2=1.0610−20 cm2 , 4=1.9610−20 cm2 , and 6 =1.4010−20 cm2 . The <strong>intensity</strong> parameters are used to determine the radiative decay rates and<br />
branching ratios <strong>of</strong> the <strong>Er3+</strong> transitions from the upper multiplet manifolds to the corresponding<br />
lower-lying multiplet manifolds 2S+1 LJ <strong>of</strong> <strong>Er3+</strong> in <strong>YAlO3</strong>. Using the radiative decay rates, radiative<br />
lifetimes <strong>of</strong> 13 excited states have been determined. The room temperature fluorescence lifetime <strong>of</strong><br />
the <strong>Er3+</strong> 4 S3/2→ 4 I15/2 transition is measured to be 0.43 ms. Values <strong>of</strong> emission cross section and<br />
peak emission cross section have been obtained for the <strong>Er3+</strong> 4 I13/2→ 4 I15/2 and 4 S3/2→ 4 I15/2 intermanifold transitions. The detailed structure observed in the manifold-to-manifold transitions<br />
allows us to identify the Stark splitting <strong>of</strong> the individual manifolds. © 2008 American Institute <strong>of</strong><br />
Physics. DOI: 10.1063/1.2956331<br />
I. INTRODUCTION<br />
Trivalent erbium <strong>Er3+</strong> 4f 11 has long been considered as<br />
an optical activator or as a sensitizer in a large number <strong>of</strong><br />
midinfrared mid-IR solid-state laser host materials due to<br />
its rich energy level structure. 1–14 Among the entire group <strong>of</strong><br />
rare-earth ions, the <strong>Er3+</strong> ion has been investigated in detail<br />
since intense green emission from <strong>Er3+</strong> is observed in a number<br />
<strong>of</strong> laser hosts. The first continuous-wave upconversion<br />
laser was demonstrated in <strong>Er3+</strong> doped into <strong>YAlO3</strong>. <strong>YAlO3</strong> is<br />
similar to yttrium aluminum garnet, but superior to yttrium<br />
lithium fluoride in terms <strong>of</strong> hardness, thermal conductivity,<br />
and optical properties. 15–17 It is known to be the second most<br />
successful rare-earth laser host material with a band edge<br />
between 0.3 and 5.8 m Ref. 18 and is considered to be<br />
one <strong>of</strong> the most efficient laser hosts. When doped with erbium<br />
ions, it could produce several upconversion laser emissions<br />
between 510 nm and 2.7 m. 19<br />
Yttrium orthoaluminate <strong>YAlO3</strong> has the perovskite<br />
structure, and it is <strong>of</strong>ten referred to as yttrium aluminum<br />
perovskite. It exhibits orthorhombic symmetry having four<br />
16<br />
molecules per unit cell and space group D2h Pbnm. Trivalent<br />
erbium <strong>Er3+</strong> ions substitute the trivalent Y3+ ions on<br />
entering the <strong>YAlO3</strong> lattice, thereby requiring no charge compensation.<br />
Since the point-group symmetry at these sites is<br />
low C1h, radiative transitions between all levels <strong>of</strong> the 4f 11<br />
electronic configuration <strong>of</strong> <strong>Er3+</strong> are allowed. 20 The Er ions<br />
occupy Cs site symmetry when doped into <strong>YAlO3</strong>. 21<br />
In this study, we report an in-depth Judd–Ofelt JO<br />
Refs. 22 and 23 analysis <strong>of</strong> <strong>Er3+</strong> 4f 11 in <strong>YAlO3</strong>. The JO<br />
analysis is performed on the room temperature absorption<br />
intensities <strong>of</strong> the <strong>Er3+</strong> 4f 11 ions in <strong>YAlO3</strong>. The room temperature<br />
fluorescence lifetime <strong>of</strong> the 4 S3/2→ 4 I15/2 transition<br />
a<br />
Author to whom correspondence should be addressed: Electronic mail:<br />
dsardar@utsa.edu.<br />
JOURNAL OF APPLIED <strong>PHYSICS</strong> 104, 023102 2008<br />
has been measured and compared with the radiative lifetime<br />
as predicted by the JO model. The room temperature emission<br />
cross section and peak emission cross section values for<br />
the Er 3+ 4 I 13/2→ 4 I 15/2 and the 4 S 3/2→ 4 I 15/2 transitions have<br />
been determined as well.<br />
II. EXPERIMENTAL DETAILS<br />
A. Materials<br />
Single crystals <strong>of</strong> YAlO 3 containing Er 3+ 1.0 at. %<br />
were grown using the Czochralski pulling method from the<br />
melt in air using platinum crucibles. The crystals used in the<br />
present study were obtained from Kokta <strong>of</strong> Bicron. Based on<br />
a distribution coefficient that allows for 96% <strong>of</strong> the Er 3+ ions<br />
to be incorporated into the crystal and based on the dopant<br />
concentration in the melt, the ion concentration was determined<br />
to be approximately 1.910 20 cm −3 in the crystal.<br />
The spectroscopic sample was optically polished to flat parallel<br />
faces and had dimensions <strong>of</strong> 342 mm 3 .<br />
B. Absorption measurements<br />
An upgraded Cary model 14R spectrophotometer controlled<br />
by a desktop computer was used to acquire the room<br />
temperature absorption spectra for Er 3+ :YAlO 3. The room<br />
temperature absorption spectra covering the wavelength<br />
range between 325 and 700 nm and between 725 and 1700<br />
nm are shown in Figs. 1 and 2, respectively. The spectral<br />
bandwidth was kept fixed at 0.1 nm over the entire wavelength<br />
range to obtain an optimum signal-to-noise ratio.<br />
C. Fluorescence and lifetime measurements<br />
The room temperature fluorescence spectra for the<br />
Er 3+ 4 I 13/2→ 4 I 15/2 transition ranging from 1420 to 1600 nm<br />
and for the Er 3+ 4 S 3/2→ 4 I 15/2 transition ranging from 535 to<br />
565 nm were taken by exciting the sample with the 514.5 nm<br />
0021-8979/2008/1042/023102/8/$23.00 104, 023102-1<br />
© 2008 American Institute <strong>of</strong> Physics<br />
Author complimentary copy. Redistribution subject to AIP license or copyright, see http://jap.aip.org/jap/copyright.jsp
023102-2 Sardar et al. J. Appl. Phys. 104, 023102 2008<br />
FIG. 1. Room temperature absorption spectrum <strong>of</strong> Er 3+ in YAlO 3, ranging<br />
from 325 to 700 nm.<br />
line from a Spectra Physics argon ion laser model 2005.<br />
The fluorescence from the sample was detected by a photomultiplier<br />
tube attached to the entrance slit <strong>of</strong> a SPEX scanning<br />
monochromator model 1250 M. The fluorescence<br />
spectrum for 4 I 13/2→ 4 I 15/2 transition was taken using 600<br />
grooves/mm grating blazed at 1.0 m, and the fluorescence<br />
spectrum for the 4 S 3/2→ 4 I 15/2 transition was taken using<br />
1200 grooves/mm reflection grating blazed at 0.5 m, and<br />
the spectral resolution was 0.1 nm in all measurements. The<br />
wavelength reproducibility <strong>of</strong> the monochromator is better<br />
than 0.01 nm. A desktop computer was employed to control<br />
the monochromator and to acquire and analyze the data in<br />
both cases. The radiative lifetime was taken for the<br />
Er 3+ 4 S 3/2→ 4 I 15/2 transition by pulsing the laser beam with a<br />
chopper at 230 Hz. The fluorescence decay was analyzed<br />
with a 560 MHz Tektronix oscilloscope model TDS 3054B<br />
and found to be a single exponential. The fluorescence lifetime<br />
<strong>of</strong> the Er 3+ 4 S 13/2→ 4 I 15/2 transition was determined to<br />
be 0.43 ms.<br />
FIG. 2. Room temperature absorption spectrum <strong>of</strong> Er 3+ in YAlO 3, ranging<br />
from 725 to 1700 nm.<br />
III. DATA ANALYSIS<br />
A. JO analysis<br />
Nine absorption bands corresponding to the manifolds<br />
2<br />
K15/2+ 4 G9/2+ 4 G11/2, 2 G19/2, 4 F3/2+ 4 F5/2, 4 F7/2, 2 H211/2 + 4 S3/2, 4 F9/2, 4 I9/2, 4 I11/2, and 4 I13/2 in the room temperature<br />
absorption spectra shown in Figs. 1 and 2 were chosen to<br />
determine the JO <strong>intensity</strong> parameters 2, 4, and 6 for the<br />
corresponding <strong>Er3+</strong> 4f 11 transitions in <strong>Er3+</strong> :<strong>YAlO3</strong>. Many<br />
researchers have applied the JO analysis to determine the<br />
important spectroscopic and laser parameters. 24–31 Therefore,<br />
we provide only a short synopsis appropriate to the analysis<br />
<strong>of</strong> the <strong>Er3+</strong> transitions in <strong>Er3+</strong> :<strong>YAlO3</strong>. The measured line strengths SmeasJ→J <strong>of</strong> the chosen<br />
bands are determined using the following expression:<br />
3ch2J +1n<br />
SmeasJ → J =<br />
83 ¯e2 9 N n<br />
0 2 +22, 1<br />
where J and J represent the total angular momentum quantum<br />
numbers <strong>of</strong> the initial and final manifold states, respectively;<br />
N0 is the <strong>Er3+</strong> ion concentration; ¯ is the mean wavelength<br />
<strong>of</strong> the specific absorption band that corresponds to the<br />
J→J transition; n is the refractive index RI, which is a<br />
function <strong>of</strong> wavelength; =d is the integrated absorption<br />
coefficient as a function <strong>of</strong> ; c is the speed <strong>of</strong> light;<br />
and h is Planck’s constant. The factor 9/n 2 +22 in Eq. 1<br />
represents the local field correction for the ion in the dielectric<br />
medium.<br />
The wavelength-dependent index <strong>of</strong> refraction n was determined<br />
using Sellmeier’s dispersion equation,<br />
n2 =1+ S2<br />
2 2 . 2<br />
− 0 For orthorhombic <strong>YAlO3</strong>, Morrison and Leavitt 18 provided<br />
2<br />
Sellmeier’s coefficients S and 0 for the a, b, and c crystallographic<br />
axes as S=2.708 92, 2.677 92, and 2.634 68,<br />
2 2 2 and 0=0.012 607 m , 0.012 282 m , and<br />
0.011 592 m2 , respectively. Since our sample was not oriented,<br />
the mean values <strong>of</strong> the Sellmeier’s coefficients were<br />
used to determine the average refractive index as a function<br />
<strong>of</strong> wavelength. The values <strong>of</strong> refractive indices obtained for<br />
wavelengths <strong>of</strong> interest are given in Table I. These n values<br />
are used to determine the absorption line strengths for the<br />
chosen <strong>Er3+</strong> transitions and are given in Table I.<br />
The JO theory predicts that the absorption line strength<br />
ScalcJ→J for electric-dipole transitions can be written in<br />
the form<br />
ScalcJ → J = tS,LJU t=2,4,6<br />
tS,LJ2 , 3<br />
where Ut is the doubly reduced matrix element <strong>of</strong> rank<br />
tt=2,4,6 between the initial and terminal states characterized<br />
by the quantum numbers S,L,J and S,L,J, respectively.<br />
The values <strong>of</strong> the squared reduced matrix elements<br />
for the chosen <strong>Er3+</strong> transitions are obtained from Ref.<br />
32. A least-squares fitting <strong>of</strong> Smeas to Scalc provides the three<br />
JO parameters 2, 4, and 6 for <strong>Er3+</strong> in <strong>YAlO3</strong> host; these<br />
values are given in Table II. The spectroscopic quality factor<br />
Author complimentary copy. Redistribution subject to AIP license or copyright, see http://jap.aip.org/jap/copyright.jsp
023102-3 Sardar et al. J. Appl. Phys. 104, 023102 2008<br />
X= 4/ 6 for the Er 3+ :YAlO 3 laser material was determined<br />
to be 1.40, which falls within the range <strong>of</strong> 1.06–3.37 reported<br />
for Er 3+ in YAlO 3 from Refs. 32 and 33. Table II shows the<br />
comparison <strong>of</strong> JO parameters obtained for Er 3+ doped into<br />
YAlO 3. These JO parameters were used to recalculate the<br />
transition line strengths <strong>of</strong> the absorption bands using Eq.<br />
3. The measured and calculated absorption line strengths<br />
are tabulated in Table I. The accuracy <strong>of</strong> fit between S meas<br />
and S calc is given by the rms deviation squared S 2 and is<br />
given in Table I.<br />
The JO parameters can then be used to calculate the<br />
radiative decay rates for transitions from the upper manifold<br />
J to the corresponding lower-level manifolds J according<br />
to Eq. 4,<br />
64<br />
AJ → J =<br />
4e2 nn<br />
3h2J +1 ¯ 3<br />
2 +22 ScalcJ → J, 4<br />
9<br />
where S calc represents the line strength for the electric-dipole<br />
transition from the upper multiplet manifold J to the corresponding<br />
lower-lying multiplet manifolds J. The refractive<br />
indices n in Eq. 4 are determined by using Eq. 2. The<br />
radiative lifetime r for an excited state J is calculated by<br />
r =<br />
TABLE I. Values <strong>of</strong> refractive index, and measured and calculated absorption line strengths <strong>of</strong> Er 3+ transitions<br />
in YAlO 3 at 300 K.<br />
Transition from 4 I 15/2 ¯<br />
nm<br />
1<br />
. 5<br />
AJ → J<br />
The fluorescence branching ratios, J→J, were determined<br />
from the radiative decay rates by using the following<br />
expression:<br />
n S meas 10 −20 cm 2 S calc 10 −20 cm 2 S 2 10 −40 cm 4 <br />
4 I13/2 1513.51 1.92 2.3168 2.2513 0.0043<br />
4 I11/2 971.43 1.45 0.5133 0.5829 0.0049<br />
4 I9/2 787.93 1.31 0.2117 0.3535 0.0201<br />
4 F9/2 651.18 1.22 1.6639 1.6953 0.0010<br />
4 S3/2+ 2 H2 11/2 520.85 1.15 1.7332 2.0033 0.0730<br />
4 F7/2 486.04 1.13 1.0765 1.1635 0.0076<br />
4 F5/2+ 4 F 3/2 450.38 1.11 0.5823 0.4898 0.0086<br />
2 G19/2 408.19 1.09 0.3150 0.3524 0.0014<br />
4 G11/2+ 4 G 9/2+ 2 K 15/2 378.51 1.08 3.1588 2.9533 0.0422<br />
TABLE II. JO parameters for Er 3+ doped in single crystal YAlO 3.<br />
Sample 2<br />
10 −20 cm 2 <br />
4<br />
10 −20 cm 2 <br />
6<br />
10 −20 cm 2 <br />
X= 4/ 6<br />
1.06 1.96 1.40 1.40<br />
YAlOb 0.91 0.70 0.56 1.24<br />
b<br />
<strong>YAlO3</strong> 1.06 2.63 0.78 3.37<br />
c<br />
<strong>YAlO3</strong> 0.95 0.58 0.55 1.06<br />
YAlO 3 a<br />
a This work.<br />
b Reference 32.<br />
c Reference 33.<br />
J → J =<br />
AJ → J<br />
AJ → J = AJ → J r, 6<br />
where the sum runs over all final manifold multiplets J. The<br />
values <strong>of</strong> the radiative decay rates, the radiative lifetimes,<br />
and the branching ratios for <strong>Er3+</strong> transitions in <strong>Er3+</strong> :<strong>YAlO3</strong> are given in Table III.<br />
The emission cross section for the 4 I13/2→ 4 I15/2 and the<br />
4<br />
S3/2→ 4 I15/2 transitions can be determined from the following<br />
expression:<br />
J,J;˜ = 2<br />
8cn 2<br />
J,J<br />
g˜, 7<br />
r<br />
where is the central peak wavelength, J,J is the fluorescence<br />
branching ratio from the upper manifold state J to<br />
the lower manifold state J, r is the radiative lifetime <strong>of</strong> the<br />
excited manifold state J, and g˜ is the line shape function.<br />
The line shape function can be obtained from the fluorescence<br />
spectrum using the following relation:<br />
g˜ =<br />
I˜<br />
, 8<br />
I˜d˜<br />
where I˜ is the <strong>intensity</strong> at wave number ˜. According to<br />
Eq. 8, the line shape function g˜ for the chosen transition<br />
was determined by dividing the <strong>intensity</strong> I˜ by the integrated<br />
area <strong>of</strong> the fluorescence spectral band.<br />
The peak emission cross section for the 4 I 13/2→ 4 I 15/2<br />
and the 4 S 3/2→ 4 I 15/2 transitions has been determined using<br />
the following expression for a Gaussian line shape:<br />
pY 1 → Z 1 =<br />
2<br />
p 4cn2 1/2 ln 2<br />
AY1 → Z1, 9<br />
<br />
where AY 1→Z 1 is the radiative transition rate from the<br />
lowest Stark level Y 1 <strong>of</strong> the 4 I 13/2 manifold to the lowest<br />
Stark level Z 1 <strong>of</strong> the 4 I 15/2 manifold, p is the wavelength at<br />
the peak position <strong>of</strong> the emission band, n is the RI, c is the<br />
speed <strong>of</strong> light, and v is the full width at half maximum<br />
linewidth given in cm −1 .<br />
The values for emission cross section and peak emission<br />
cross section were determined to be 1.8210 −20 and 1.44<br />
Author complimentary copy. Redistribution subject to AIP license or copyright, see http://jap.aip.org/jap/copyright.jsp
023102-4 Sardar et al. J. Appl. Phys. 104, 023102 2008<br />
TABLE III. Predicted line strengths, radiative lifetimes, and branching ratios <strong>of</strong> Er 3+ in YAlO 3 at 300 K.<br />
Transition State Energy cm −1 <br />
nm<br />
ed −20 2 Scal 10 cm rad ms J→J<br />
4 I13/2→ 4 I 15/2 6 500 1 538.46 2.8914 3.53 1.0000<br />
4 I11/2→ 4 I 13/2 3 600 2 777.78 1.7077 7.82 0.2580<br />
4 I15/2 10 100 990.10 0.2192 0.7420<br />
4 I9/2→ 4 I 11/2 2 150 4 651.16 0.0315 8.12 0.0013<br />
4 I13/2 5 750 1 739.13 0.7170 0.5517<br />
4 I15/2 12 250 816.33 0.0590 0.4470<br />
4 F9/2→ 4 I 9/2 2 900 3 448.28 0.0185 0.59 0.0001<br />
4 I11/2 5 050 1 980.20 2.3091 0.0868<br />
4 I13/2 8 650 1 156.07 0.0545 0.0104<br />
4 I15/2 15 150 660.07 0.8602 0.9027<br />
4 S3/2→ 4 F 9/2 3 200 3 125.00 0.0010 1.06 0.0000<br />
4 I9/2 6 100 1 639.34 0.1025 0.0308<br />
4 I11/2 8 250 1 212.12 0.0077 0.0057<br />
4 I13/2 11 850 843.88 0.1675 0.3756<br />
4 I15/2 18 350 544.96 0.0683 0.9027<br />
2 H211/2→ 4 S 3/2 800 12 500.00 0.0776 0.36 0.0000<br />
4 F9/2 4 000 2 500.00 0.1408 0.0013<br />
4 I9/2 6 900 1 449.28 0.1686 0.0083<br />
4 I11/2 9 050 1 104.97 0.0407 0.0046<br />
4 I13/2 12 650 790.51 0.0118 0.0036<br />
4 I15/2 19 150 522.19 0.8844 0.9821<br />
4 F7/2→ 2 H2 11/2 1 150 8 695.65 0.2420 0.26 0.0001<br />
4 S3/2 1 950 5 128.21 0.0001 0.0000<br />
4 F9/2 5 150 1 941.75 0.0028 0.0001<br />
4 I9/2 8 050 1 242.24 0.2738 0.0232<br />
4 I11/2 10 200 980.39 0.1696 0.0294<br />
4 I13/2 13 800 724.64 0.2228 0.0970<br />
4 I15/2 20 300 492.61 0.5909 0.8502<br />
4 F5/2→ 4 F 7/2 1 650 6 060.61 0.0256 0.67 0.0001<br />
2 H211/2 2 800 3 571.43 0.0533 0.0006<br />
4 S3/2 3 600 2 777.78 0.0001 0.0000<br />
4 F9/2 6 800 1 470.59 0.2930 0.0512<br />
4 I9/2 9 700 1 030.93 0.0212 0.0108<br />
4 I11/2 11 850 843.88 0.0188 0.0177<br />
4 I13/2 15 450 647.25 0.2267 0.4793<br />
4 I15/2 21 950 455.58 0.0697 0.4403<br />
4 F3/2→ 4 F 5/2 350 28 571.43 0.0065 0.78 0.0000<br />
4 F7/2 2 000 5 000.00 0.0067 0.0001<br />
2 H211/2 3 150 3 174.60 0.0000 0.0000<br />
4 S3/2 3 950 2 531.65 0.0007 0.0000<br />
4 F9/2 7 150 1 398.60 0.0050 0.0018<br />
4 I9/2 10 050 995.02 0.1080 0.1073<br />
4 I11/2 12 200 819.67 0.3471 0.6219<br />
4 I13/2 15 800 632.91 0.0017 0.0066<br />
4 I15/2 22 300 448.43 0.0226 0.2624<br />
2 G19/2→ 4 F 3/2 2 100 4 761.90 0.0010 0.80 0.0000<br />
4 F5/2 2 450 4 081.63 0.0015 0.0000<br />
4 F7/2 4 100 2 439.02 0.0174 0.0005<br />
2 H211/2 5 250 1 904.76 0.0728 0.0042<br />
4 S3/2 6 050 1 652.89 0.0000 0.0000<br />
4 F9/2 9 250 1 081.08 0.0039 0.0012<br />
4 I9/2 12 150 823.05 0.0003 0.0002<br />
4 I11/2 14 300 699.30 0.0330 0.0395<br />
4 I13/2 17 900 558.66 0.2090 0.4992<br />
4 I15/2 24 400 409.84 0.0718 0.4552<br />
4 G11/2→ 2 G1 9/2 2 000 5 000.00 0.1412 0.07 0.0000<br />
4 F3/2 4 100 2 439.02 0.0130 0.0000<br />
4 F5/2 4 450 2 247.19 0.0121 0.0000<br />
4 F7/2 6 100 1 639.34 0.0410 0.0003<br />
Author complimentary copy. Redistribution subject to AIP license or copyright, see http://jap.aip.org/jap/copyright.jsp
023102-5 Sardar et al. J. Appl. Phys. 104, 023102 2008<br />
10 −20 cm 2 for the 4 I 13/2→ 4 I 15/2 intermanifold transition<br />
and 3.9310 −21 and 3.4910 −21 cm 2 for the 4 S 3/2→ 4 I 15/2<br />
intermanifold transition, respectively.<br />
B. Crystal-field analysis<br />
TABLE III. Continued.<br />
Transition State Energy cm −1 <br />
nm<br />
One <strong>of</strong> the remarkable aspects <strong>of</strong> the room temperature<br />
absorption spectrum is the detail that is observed in the in-<br />
FIG. 3. Room temperature absorption spectrum <strong>of</strong> 4 I 15/2→ 4 I 13/2; the Stark<br />
levels are identified in Table IV.<br />
ed −20 2 Scal 10 cm rad ms J→J<br />
2 H211/2 7 250 1 379.31 0.0499 0.0006<br />
4 S3/2 8 050 1 242.24 0.0333 0.0005<br />
4 F9/2 11 250 888.89 0.1949 0.0087<br />
4 I9/2 14 150 706.71 0.0066 0.0006<br />
4 I11/2 16 300 613.50 0.0051 0.0007<br />
4 I13/2 19 900 502.51 0.2427 0.0627<br />
4 I15/2 26 400 378.79 1.4570 0.9258<br />
4 G9/2→ 4 G 11/2 950 10 526.32 0.1176 0.10 0.0000<br />
2 G19/2 2 950 3 389.83 0.0036 0.0000<br />
4 F3/2 5 050 1 980.20 0.0739 0.0005<br />
4 F5/2 5 400 1 851.85 0.0415 0.0003<br />
4 F7/2 7 050 1 418.44 0.4120 0.0075<br />
2 H211/2 8 200 1 219.51 0.2419 0.0070<br />
4 S3/2 9 000 1 111.11 0.0536 0.0021<br />
4 F9/2 12 200 819.67 0.4405 0.0425<br />
4 I9/2 15 100 662.25 0.0001 0.0000<br />
4 I11/2 17 250 579.71 0.0543 0.0152<br />
4 I13/2 20 850 479.62 1.5069 0.7613<br />
4 I15/2 27 350 365.63 0.1356 0.1635<br />
2 K15/2→ 4 G 9/2 350 28 571.43 0.0053 1.36 0.0000<br />
2 G11/2 1 300 7 692.31 0.6453 0.0006<br />
2 G19/2 3 300 3 030.30 0.9982 0.0151<br />
4 F3/2 5 400 1 851.85 0.0000 0.0000<br />
4 F5/2 5 750 1 739.13 0.0030 0.0002<br />
4 F7/2 7 400 1 351.35 0.0000 0.0000<br />
2 H211/2 8 550 1 169.59 1.8448 0.4902<br />
4 S3/2 9 350 1 069.52 0.0000 0.0000<br />
4 F9/2 12 550 796.81 0.0120 0.0102<br />
4 I9/2 15 450 647.25 0.1108 0.1784<br />
4 I11/2 17 600 568.18 0.0888 0.2141<br />
4 I13/2 21 200 471.70 0.0010 0.0041<br />
4 I15/2 27 700 361.01 0.0086 0.0870<br />
dividual manifold spectra that show well resolved structure<br />
attributed to the crystal-field splitting <strong>of</strong> each manifold. 21<br />
Figure 3 shows the spectrum representing transitions between<br />
many <strong>of</strong> the Stark levels <strong>of</strong> the ground-state manifold<br />
4 I15/2 Z 1 through Z 8 to the first excited manifold 4 I 13/2 Y 1<br />
through Y 7 observed between 1450 and 1625 nm. The transitions<br />
between the Stark levels shown in Fig. 3 were analyzed<br />
to give the splitting <strong>of</strong> the 4 I 13/2 and 4 I 15/2 manifolds<br />
reported in Table IV. The values agree within the experimental<br />
error to those reported by Donlan and Santiago. 34 The<br />
calculated splitting for these manifolds is given in Table IV<br />
column 4 and was first reported by O’Hare and Donaln. 35<br />
The room temperature crystal-field splitting is similar to that<br />
reported earlier at 4.2 K. 35<br />
Of equal interest is the detailed structure observed in the<br />
room temperature fluorescence from 4 I 13/2 to 4 I 15/2 shown in<br />
Fig. 4. The analysis <strong>of</strong> this fluorescence is given in Table V<br />
and confirms the crystal-field analysis <strong>of</strong> these two manifolds<br />
shown in absorption in Fig. 3. For some time, it was hoped<br />
that an efficient, low-threshold eye safe laser near 1.5 m<br />
could be developed. 16,20,36,37 With the more recent investigations<br />
on upconversion processes however, it is apparent that<br />
IR stimulated emission can be obtained between other manifolds<br />
as well.<br />
Author complimentary copy. Redistribution subject to AIP license or copyright, see http://jap.aip.org/jap/copyright.jsp
023102-6 Sardar et al. J. Appl. Phys. 104, 023102 2008<br />
TABLE IV. Crystal-field splitting <strong>of</strong> the 4 S 3/2, 4 I 13/2, and 4 I 15/2 manifolds at<br />
room temperature.<br />
2S+1 LJ a<br />
Label b<br />
Ecm −1 obs c<br />
Ecm −1 calc d<br />
4 S3/2 U 2 18 484 18 480<br />
U 1 18 405 18 408<br />
4 I13/2 Y 7 6864 6871<br />
Y 6 6812 6810<br />
Y 5 6770 6767<br />
Y 4 6712 6709<br />
Y 3 6666 6666<br />
Y 2 6639 6637<br />
Y 1 6600 6594<br />
4 I15/2 Z 8 522 519<br />
Z 7 446 440<br />
Z 6 386 391<br />
Z 5 257 267<br />
Z 4 217 214<br />
Z 3 171 172<br />
Z 2 51 45<br />
Z 1 0 0<br />
a Multiplet manifolds <strong>of</strong> Er 3+ 4f 11 .<br />
b Stark level label.<br />
c Energy <strong>of</strong> Stark level cm −1 at room temperature.<br />
d Calculated manifold splitting see Ref. 34.<br />
TABLE V. Room temperature fluorescence from 4 I 13/2 to 4 I 15/2.<br />
Trans. a<br />
b<br />
nm<br />
I c<br />
E d cm −1 E e<br />
cm −1 <br />
E calc f<br />
cm −1 <br />
Y 7→Z 1 1456.45 0.16 6864 0 0<br />
Y 7→Z 2 1467.35 0.10 6813 51 45<br />
Y 6→Z 1 1467.55 0.20 6812 0 0<br />
Y 5→Z 1 1476.65 0.25 6770 0 0<br />
Y 6→Z 2 1478.60 0.21 6761 51 45<br />
Y 5→Z 2 1488.15 0.46 6718 52 45<br />
Y 4→Z 1 1489.40 0.22 6712 0 0<br />
Y 7→Z 3 1493.65 0.23 6693 171 172<br />
Y 3→Z 1 1499.70 0.44 6666 0 0<br />
Y 6→Z 3 1505.38 0.47 6641 171 172<br />
Y 2→Z 1 1505.80 0.40 6639 0 0<br />
Y 3→Z 2 1511.25 0.57 6615 51 45<br />
Y 1→Z 1 1514.70 1.42 6600 0 0<br />
Y 5→Z 3 1514.90 1.16 6599 171 172<br />
Y 6→Z 4 1517.20 1.10 6595 217 214<br />
Y 2→Z 2 1517.20 1.10 6588 51 45<br />
Y 2→Z 3 1526.25 0.53 6550 50 0<br />
Y 3→Z 3 1539.20 0.42 6495 171 172<br />
Y 1→Z 3 1554.70 0.25 6430 170 172<br />
Y 1→Z 4 1566.20 0.10 6383 217 214<br />
a<br />
Emission from Yn see Table IV to Zn Stark levels.<br />
b<br />
Wavelength in nanometers.<br />
c<br />
Relative <strong>intensity</strong>.<br />
d<br />
Energy <strong>of</strong> transition in vacuum wave numbers.<br />
e<br />
Energy difference between emitting and terminal Stark level.<br />
f<br />
Calculated splitting <strong>of</strong> ground-state manifold based on the parameters given in Ref. 34.<br />
FIG. 4. Room temperature fluorescence spectrum <strong>of</strong> the 4 I 13/2→ 4 I 15/2 transition<br />
<strong>of</strong> Er 3+ in YAlO 3.<br />
Author complimentary copy. Redistribution subject to AIP license or copyright, see http://jap.aip.org/jap/copyright.jsp
023102-7 Sardar et al. J. Appl. Phys. 104, 023102 2008<br />
FIG. 5. Room temperature fluorescence spectrum <strong>of</strong> the 4 S 3/2→ 4 I 15/2 transition<br />
<strong>of</strong> Er 3+ in YAlO 3.<br />
The intense green fluorescence observed between 540<br />
and 560 nm for the 4 S 3/2→ 4 I 15/2 intermanifold transition, as<br />
shown in Fig. 5, has been <strong>of</strong> interest for sometime that it<br />
competes with other emissions initiated among 4 I 9/2, 4 I 11/2,<br />
and 4 I 13/2 manifolds. However, this competition can be reduced<br />
by pumping with arrays <strong>of</strong> IR diode lasers at wavelengths<br />
that avoid green IR-pumped 4 S 3/2→ 4 I 15/2 stimulated<br />
emission. In Table VI, we report the room temperature fluorescence<br />
from 4 S 3/2 to 4 I 15/2, where stimulated emission is<br />
observed associated with the U 1→Z 4 transition 549.66 nm,<br />
representing the most intense fluorescence transition in the<br />
spectrum.<br />
IV. CONCLUSIONS<br />
An in-depth spectroscopic analysis <strong>of</strong> Er 3+ 4f 11 in the<br />
Er 3+ :YAlO 3 host has been performed following the JO<br />
TABLE VI. Room temperature fluorescence from 4 S 3/2 to 4 I 15/2.<br />
Trans. a<br />
b<br />
nm<br />
I c<br />
model. The three phenomenological <strong>intensity</strong> parameters 2,<br />
4, and 6 are determined for Er 3+ :YAlO 3. From the values<br />
<strong>of</strong> the JO <strong>intensity</strong> parameters, the spectroscopic quality factor<br />
X= 4/ 6 for Er 3+ in Er 3+ :YAlO 3 host is determined to<br />
be 1.40. The spectroscopic quality factor, first introduced by<br />
Kaminiskii, 32 is an important predictor for stimulated emission<br />
in a laser active medium.<br />
The branching ratio is a critical laser parameter because<br />
it characterizes the possibility <strong>of</strong> attaining stimulated emission<br />
from any specific transition. The branching ratio <strong>of</strong> the<br />
4 I13/2→ 4 I 15/2 transition is 100%, and the radiative lifetime <strong>of</strong><br />
this transition is calculated at 3.54 ms, which is comparable<br />
to the value 4.40 ms reported by Weber. 38 The branching<br />
ratio <strong>of</strong> the 4 S 3/2→ 4 I 15/2 transition is determined to be approximately<br />
90%, thereby suggesting that this transition can<br />
result in strong lasing action the transition that was labeled<br />
as U 1→Z 4 corresponding to 549.66 nm in Table VI. The<br />
room temperature fluorescence lifetime <strong>of</strong> the 4 S 13/2→ 4 I 15/2<br />
transition is measured to be 0.43 ms. Using the measured<br />
lifetime 0.43 ms and the predicted radiative lifetime 1.10<br />
ms for the Er 3+ 4 S 13/2→ 4 I 15/2 transition, the quantum efficiency<br />
is determined to be 39%. The emission cross section<br />
for the 4 I 13/2→ 4 I 15/2 intermanifold transition and the peak<br />
emission cross section within the manifold have been obtained<br />
as 1.8210 −20 and 1.4410 −20 cm 2 , respectively.<br />
Similarly, for the 4 S 3/2→ 4 I 15/2 intermanifold transition, the<br />
value for emission cross section has been obtained as 3.93<br />
10 −21 cm 2 and the peak emission cross section as 3.49<br />
10 −21 cm 2 . Finally, the Stark splittings within the individual<br />
multiplet manifolds have been identified from the detailed<br />
structures observed in the corresponding manifold-tomanifold<br />
transitions.<br />
E d cm −1 E e<br />
cm −1 <br />
E calc f<br />
cm −1 <br />
U 2→Z 1 540.86 11.20 18 484 0 0<br />
U 2→Z 2 542.33 13.69 18 434 50 45<br />
U 1→Z 1 543.18 14.75 18 405 0 0<br />
U 1→Z 2 544.75 20.15 18 352 53 45<br />
U 2→Z 3 546.03 17.25 18 309 175 172<br />
U 2→Z 4 547.47 26.34 18 261 223 214<br />
U 1→Z 3 548.46 15.14 18 228 177 172<br />
U 2→Z 5 548.82 16.20 18 216 268 267<br />
U 1→Z 4 549.66 40.28 18 188 217 214<br />
U 1→Z 5 551.24 27.80 18 136 269 267<br />
U 2→Z 6 552.58 24.63 18 092 392 391<br />
U 2→Z 7 554.39 14.89 18 033 451 440<br />
U 1→Z 6 554.91 15.80 18 016 389 391<br />
U 1→Z 7 556.85 17.25 17 953 452 440<br />
U 1→Z 8 559.16 11.99 17 879 526 519<br />
a<br />
Emission from Un see Table IV to Zn Stark levels.<br />
b<br />
Wavelength in nanometers.<br />
c<br />
Relative <strong>intensity</strong>.<br />
d<br />
Energy <strong>of</strong> transition in vacuum wave numbers.<br />
e<br />
Energy difference between emitting and terminal Stark level.<br />
f<br />
Calculated splitting based on the parameters given in Ref. 34.<br />
Author complimentary copy. Redistribution subject to AIP license or copyright, see http://jap.aip.org/jap/copyright.jsp
023102-8 Sardar et al. J. Appl. Phys. 104, 023102 2008<br />
ACKNOWLEDGMENTS<br />
This research was supported in part by the National Science<br />
Foundation Grant No. DMR-0602649 and the American<br />
Chemical Society Grant No. PRF 43862-B6. The authors<br />
would like to thank Robert C. Dennis UTSA, Laser<br />
Research Laboratory for his assistance in obtaining some<br />
visible emission spectra.<br />
1 J. A. Hutchinson and T. H. Allik, Proc. SPIE 1627, 21992.<br />
2 J. A. Hutchinson and T. H. Allik, Appl. Phys. Lett. 60, 1424 1992.<br />
3 P. Laporta, S. Tauheo, S. Longhi, and O. Svelto, Opt. Lett. 18, 1232<br />
1993.<br />
4 P. Laporta, S. De Silvestri, V. Magni, and O. Svelto, Opt. Lett. 20, 1592<br />
1991.<br />
5 S. Tauheo, P. Laporta, and S. Longhi, Opt. Lett. 20, 889 1995.<br />
6 P. C. Becker, N. A. Olsson, and J. R. Simpson, Erbium-Doped Fiber<br />
Amplifiers: Fundamentals and Technology Academic, New York, 1999.<br />
7 M. G. Drexhage, C. T. Moynihan, and M. S. Boulos, Mater. Res. Bull. 15,<br />
213 1980.<br />
8 S. Jiang, M. Myers, and N. Peyghambarian, J. Non-Cryst. Solids 239, 143<br />
1998.<br />
9 B. C. Hwang, B. Lo, and C. M. Stain, J. Opt. Soc. Am. B 17, 8332000.<br />
10 A. M. Tkachuk, Proc. SPIE 2706, 21996.<br />
11 R. T. Brundage and W. M. Yen, Phys. Rev. B 34, 8810 1986.<br />
12 W. Koechner, Solid State Laser Engineering Springer, New York, 1996.<br />
13 T. S. Rutherford, W. M. Tulloch, E. K. Gustafson, and R. L. Byer, IEEE J.<br />
Quantum Electron. 36, 2052000.<br />
14 J. B. Gruber, A. Kennedy, B. Zandi, and J. A. Hutchinson, Proc. SPIE<br />
3928, 142 2000.<br />
15 M. J. Weber, M. Bass, K. Andringa, R. R. Monchamp, and E. Comperi-<br />
cho, Appl. Phys. Lett. 15, 342 1969.<br />
16 R. Scheps, IEEE J. Quantum Electron. 30, 121994.<br />
17 A. A. Kaminskii, V. S. Mironov, A. Kornienko, S. N. Bagaev, G. Boulon,<br />
A. Brenier, and B. D. Bartolo, Phys. Status Solidi A 151, 2311995.<br />
18 C. A. Morrison and R. P. Leavitt, Handbook on the Physics and Chemistry<br />
<strong>of</strong> Rare Earths North-Holland, Amsterdam, 1982.<br />
19 N. Pelletier-Allard and R. Pelletier, J. Alloys Compd. 275-277, 374<br />
1998.<br />
20 M. J. Weber, M. Bass, and G. A. deMars, J. Appl. Phys. 42, 11971.<br />
21 S. Schnell, W. Luthy, and H. P. Weber, J. Appl. Math. 39, 961988.<br />
22 B. R. Judd, Phys. Rev. 127, 750 1962.<br />
23 G. S. Ofelt, J. Chem. Phys. 37, 5111962.<br />
24 W. F. Krupke and J. B. Gruber, Phys. Rev. 139, A2008 1965.<br />
25 W. F. Krupke, IEEE J. Quantum Electron. 10, 450 1974; W.F.Krupke,<br />
ibid. 7, 153 1971; W. F. Krupke, Phys. Rev. 145, 325 1966.<br />
26 M. J. Weber, J. Chem. Phys. 48, 4774 1968; M. J. Weber, Phys. Rev.<br />
171, 283 1968; M. J. Weber, ibid. 157, 262 1967.<br />
27 D. K. Sardar, F. Castano, J. A. French, J. B. Gruber, T. A. Reynolds, T.<br />
Alekel, D. A. Keszler, and B. L. Clark, J. Appl. Phys. 90, 4997 2001.<br />
28 J. R. Ryan and R. Beach, J. Opt. Soc. Am. B 9, 1883 1992.<br />
29 D. K. Sardar and F. Castano, J. Appl. Phys. 91, 9112002.<br />
30 J. A. Caird and L. G. DeShazer, IEEE J. Quantum Electron. 11,971975.<br />
31 T. S. Lomheim and L. G. DeShazer, J. Appl. Phys. 49, 5517 1978.<br />
32 A. A. Kaminskii, Crystalline Lasers: Physical Process and Operating<br />
Schemes CRC, Florida, 1996.<br />
33 H. Xu, L. Zhou, Z. Dai, and Z. Jiang, Physica B Amsterdam 324, 43<br />
2002.<br />
34 V. L. Donlan and A. A. Santiago, Jr., J. Chem. Phys. 57, 4717 1972.<br />
35 J. M. O’Hare and V. L. Donlan, Phys. Rev. B 15, 101977.<br />
36 A. J. Silversmith, W. Lenth, and R. M. Macfarlane, Appl. Phys. Lett. 51,<br />
1977 1987.<br />
37 M. Stalder and W. Luthy, J. Appl. Phys. 62, 3570 1987.<br />
38 M. J. Weber, Phys. Rev. B 8, 541973.<br />
Author complimentary copy. Redistribution subject to AIP license or copyright, see http://jap.aip.org/jap/copyright.jsp