Haddad, H. , Lyons, G. and Chatterjee, K. (2009) - UWE Research ...
Haddad, H. , Lyons, G. and Chatterjee, K. (2009) - UWE Research ...
Haddad, H. , Lyons, G. and Chatterjee, K. (2009) - UWE Research ...

Create successful ePaper yourself
Turn your PDF publications into a flip-book with our unique Google optimized e-Paper software.
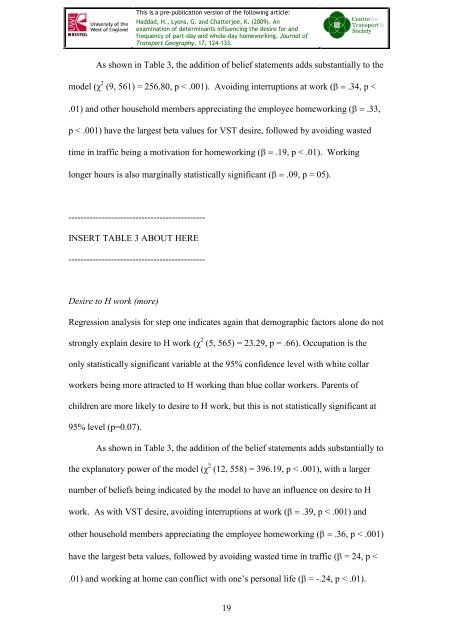
This is a pre-publication version of the following article:<br />
<strong>Haddad</strong>, H., <strong>Lyons</strong>, G. <strong>and</strong> <strong>Chatterjee</strong>, K. (<strong>2009</strong>). An<br />
examination of determinants influencing the desire for <strong>and</strong><br />
frequency of part-day <strong>and</strong> whole-day homeworking. Journal of<br />
Transport Geography, 17, 124-133.<br />
As shown in Table 3, the addition of belief statements adds substantially to the<br />
model (χ 2 (9, 561) = 256.80, p < .001). Avoiding interruptions at work ( 34 p <<br />
.01) <strong>and</strong> other household members appreciating the employee homeworking ( .33,<br />
p < .001) have the largest beta values for VST desire, followed by avoiding wasted<br />
time in traffic being a motivation for homeworking ( 19, p < .01). Working<br />
longer hours is also marginally statistically significant ( .09, p = 05).<br />
---------------------------------------------<br />
INSERT TABLE 3 ABOUT HERE<br />
---------------------------------------------<br />
Desire to H work (more)<br />
Regression analysis for step one indicates again that demographic factors alone do not<br />
strongly explain desire to H work (χ 2 (5, 565) = 23.29, p = .66). Occupation is the<br />
only statistically significant variable at the 95% confidence level with white collar<br />
workers being more attracted to H working than blue collar workers. Parents of<br />
children are more likely to desire to H work, but this is not statistically significant at<br />
95% level (p=0.07).<br />
As shown in Table 3, the addition of the belief statements adds substantially to<br />
the explanatory power of the model (χ 2 (12, 558) = 396.19, p < .001), with a larger<br />
number of beliefs being indicated by the model to have an influence on desire to H<br />
work. As with VST desire, avoiding interruptions at work ( .39, p < .001) <strong>and</strong><br />
other household members appreciating the employee homeworking ( 36 p < .001)<br />
have the largest beta values, followed by avoiding wasted time in traffic ( = 24, p <<br />
.01) <strong>and</strong> working at home can conflict with one‟s personal life ( = -.24, p < .01).<br />
19