US EPA Stabilization of Mercury in Waste Material from the ... - CLU-IN
US EPA Stabilization of Mercury in Waste Material from the ... - CLU-IN
US EPA Stabilization of Mercury in Waste Material from the ... - CLU-IN

You also want an ePaper? Increase the reach of your titles
YUMPU automatically turns print PDFs into web optimized ePapers that Google loves.
<strong>EPA</strong><br />
United States Office <strong>of</strong> <strong>EPA</strong>/540/R-502a<br />
Environmental Protection Research and Development July 2004<br />
Agency C<strong>in</strong>c<strong>in</strong>nati, OH 45268<br />
<strong>Stabilization</strong> <strong>of</strong> <strong>Mercury</strong> <strong>in</strong><br />
<strong>Waste</strong> <strong>Material</strong> <strong>from</strong> <strong>the</strong> Sulfur<br />
Bank <strong>Mercury</strong> M<strong>in</strong>e<br />
Innovative Technology Evaluation Report
<strong>EPA</strong>/540/R-04/502<br />
July 2004<br />
<strong>Stabilization</strong> <strong>of</strong> <strong>Mercury</strong> <strong>in</strong> <strong>Waste</strong><br />
<strong>Material</strong> <strong>from</strong> <strong>the</strong> Sulfur Bank <strong>Mercury</strong><br />
M<strong>in</strong>e<br />
Innovative Technology Evaluation Report<br />
National Risk Management Research Laboratory<br />
Office <strong>of</strong> Research and Development<br />
U.S. Environmental Protection Agency<br />
C<strong>in</strong>c<strong>in</strong>nati, Ohio 45268
Notice<br />
The <strong>in</strong>formation <strong>in</strong> this document has been funded by <strong>the</strong> U.S. Environmental Protection Agency<br />
(<strong>EPA</strong>) under Contract Nos. 68-C5-0036 and 68-COO-179 to Science Applications International<br />
Corporation (SAIC). It has been subjected to <strong>the</strong> Agency’s peer and adm<strong>in</strong>istrative reviews and has<br />
been approved for publication as an <strong>EPA</strong> document. Mention <strong>of</strong> trade names or commercial<br />
products does not constitute an endorsement or recommendation for use.<br />
ii
Foreword<br />
The U.S. Environmental Protection Agency (<strong>EPA</strong>) is charged by Congress with protect<strong>in</strong>g <strong>the</strong> Nation’s<br />
land, air, and water resources. Under a mandate <strong>of</strong> national environmental laws, <strong>the</strong> Agency strives to<br />
formulate and implement actions lead<strong>in</strong>g to a compatible balance between human activities and <strong>the</strong> ability<br />
<strong>of</strong> natural systems to support and nurture life. To meet this mandate, <strong>EPA</strong>’s research program is provid<strong>in</strong>g<br />
data and technical support for solv<strong>in</strong>g environmental problems today and build<strong>in</strong>g a science knowledge<br />
base necessary to manage our ecological resources wisely, understand how pollutants affect our health,<br />
and prevent or reduce environmental risks <strong>in</strong> <strong>the</strong> future.<br />
The National Risk Management Research Laboratory (NRMRL) is <strong>the</strong> Agency’s center for <strong>in</strong>vestigation <strong>of</strong><br />
technological and management approaches for prevent<strong>in</strong>g and reduc<strong>in</strong>g risks <strong>from</strong> pollution that threaten<br />
human health and <strong>the</strong> environment. The focus <strong>of</strong> <strong>the</strong> Laboratory’s research program is on methods and <strong>the</strong>ir<br />
cost-effectiveness for prevention and control <strong>of</strong> pollution to air, land, water, and subsurface resources;<br />
protection <strong>of</strong> water quality <strong>in</strong> public water systems; remediation <strong>of</strong> contam<strong>in</strong>ated sites, sediments and<br />
ground water; prevention and control <strong>of</strong> <strong>in</strong>door air pollution; and restoration <strong>of</strong> ecosystems. NRMRL<br />
collaborates with both public and private sector partners to foster technologies that reduce <strong>the</strong> cost <strong>of</strong><br />
compliance and to anticipate emerg<strong>in</strong>g problems. NRMRL’s research provides solutions to environmental<br />
problems by: develop<strong>in</strong>g and promot<strong>in</strong>g technologies that protect and improve <strong>the</strong> environment; advanc<strong>in</strong>g<br />
scientific and eng<strong>in</strong>eer<strong>in</strong>g <strong>in</strong>formation to support regulatory and policy decisions; and provid<strong>in</strong>g <strong>the</strong> technical<br />
support and <strong>in</strong>formation transfer to ensure implementation <strong>of</strong> environmental regulations and strategies at<br />
<strong>the</strong> national, state, and community levels.<br />
This publication has been produced as part <strong>of</strong> <strong>the</strong> Laboratory’s strategic long-term research plan. It is<br />
published and made available by <strong>EPA</strong>’s Office <strong>of</strong> Research and Development to assist <strong>the</strong> user community<br />
and to l<strong>in</strong>k researchers with <strong>the</strong>ir clients.<br />
Lawrence W. Reiter, Act<strong>in</strong>g Director<br />
National Risk Management Research Laborator<br />
iii
Abstract<br />
This report summarizes <strong>the</strong> f<strong>in</strong>d<strong>in</strong>gs <strong>of</strong> an extensive treatability study <strong>of</strong> three stabilization<br />
technologies for mercury immobilization on materials collected <strong>from</strong> <strong>the</strong> Sulfur Bank <strong>Mercury</strong> M<strong>in</strong>e<br />
(SBMM), located north <strong>of</strong> San Francisco, <strong>in</strong> Lake County, California. The SBMM site is believed to be<br />
contam<strong>in</strong>at<strong>in</strong>g <strong>the</strong> adjacent Clear Lake environment with mercury derived <strong>from</strong> historic m<strong>in</strong><strong>in</strong>g<br />
practices at <strong>the</strong> site. The study was conducted as a jo<strong>in</strong>t effort between <strong>EPA</strong>’s Superfund Innovative<br />
Technology Evaluation (SITE) Program and <strong>the</strong> M<strong>in</strong>e <strong>Waste</strong> Technology Program (MWTP). Two<br />
mercury contam<strong>in</strong>ated materials were selected for treatment by three types <strong>of</strong> stabilization<br />
technologies.<br />
The purpose <strong>of</strong> <strong>the</strong> study was to determ<strong>in</strong>e <strong>the</strong> effectiveness <strong>of</strong> <strong>the</strong> three stabilization technologies for<br />
immobiliz<strong>in</strong>g mercury <strong>in</strong> <strong>the</strong> waste rock materials and <strong>the</strong>refore reduc<strong>in</strong>g leachable mobile mercury <strong>in</strong><br />
<strong>the</strong> effluent. Several mercury-bear<strong>in</strong>g materials <strong>from</strong> <strong>the</strong> site were considered for test<strong>in</strong>g. A material<br />
with high levels <strong>of</strong> leachable mercury was selected as <strong>the</strong> primary target <strong>of</strong> <strong>the</strong> study, and is referred<br />
to as “<strong>Mercury</strong> Ore”. As a secondary objective, treatment effectiveness was evaluated on material<br />
that was lower <strong>in</strong> mercury concentration, but present <strong>in</strong> large quantities and is referred to as “<strong>Waste</strong><br />
Rock”.<br />
Three stabilization technologies were evaluated as part <strong>of</strong> this study: (1) a Silica Micro Encapsulation<br />
(SME) process developed by Klean Earth Environmental Company (KEECO), (2) an <strong>in</strong>organic sulfide<br />
stabilization technology (ENTHRALL ®) developed by E&C Williams, and (3) a generic phosphate<br />
treatment.<br />
The primary objective <strong>of</strong> this study was to determ<strong>in</strong>e <strong>the</strong> effectiveness <strong>of</strong> <strong>the</strong> three stabilization<br />
technologies (silica encapsulation, phosphate, and sulfide) <strong>in</strong> reduc<strong>in</strong>g <strong>the</strong> quantity <strong>of</strong> leachable<br />
mercury <strong>from</strong> SBMM material. <strong>Waste</strong> material evaluated <strong>in</strong> this study consisted <strong>of</strong> “mercury ore” <strong>from</strong><br />
<strong>the</strong> south white gate pile and “waste rock” <strong>from</strong> <strong>the</strong> north yellow pile. The mercury ore was <strong>the</strong><br />
primary test material due to its demonstrated ability to produce consistent and detectable levels <strong>of</strong><br />
leachable mercury. The waste rock was <strong>in</strong>cluded because it is a common material at <strong>the</strong> site, even<br />
though it yields lower levels <strong>of</strong> leachable mercury. In order to evaluate <strong>the</strong> performance <strong>of</strong> <strong>the</strong> three<br />
technologies, <strong>the</strong> leachable and mobile mercury (def<strong>in</strong>ed as <strong>the</strong> mercury <strong>in</strong> <strong>the</strong>
Contents<br />
Notice.................................................................................................................................................. ii<br />
Foreword............................................................................................................................................ iii<br />
Abstract............................................................................................................................................... v<br />
Tables ............................................................................................................................................... viii<br />
Figures ............................................................................................................................................... ix<br />
Abbreviations and Acronyms .............................................................................................................. x<br />
Acknowledgement ............................................................................................................................ xii<br />
Executive Summary.......................................................................................................................... xiii<br />
1.0 Introduction ......................................................................................................................... 1-1<br />
1.1 Background............................................................................................................ 1-1<br />
1.1.1 Description <strong>of</strong> <strong>the</strong> SBMM Site................................................................... 1-1<br />
1.1.2 E&C Williams Enthrall ® Technology ......................................................... 1-1<br />
1.1.3 Kleen Earth Environmental Company Silica Micro Encapsulation (SME)<br />
Process..................................................................................................... 1-2<br />
1.1.4 Phosphate................................................................................................. 1-3<br />
1.2 Brief Description <strong>of</strong> <strong>the</strong> Superfund Innovative Technology (SITE) and M<strong>in</strong>e<br />
<strong>Waste</strong> Technology (MWTP) Programs.................................................................. 1-4<br />
1.3 The SITE Demonstration Program and Reports ....................................................1-4<br />
1.4 Purpose <strong>of</strong> <strong>the</strong> Innovative Technology Evaluation Report (ITER)......................... 1-5<br />
1.5 Sources <strong>of</strong> Fur<strong>the</strong>r Information...............................................................................1-5<br />
2.0 Technology Application Analysis ........................................................................................ 2-1<br />
2.1 Key Features <strong>of</strong> <strong>the</strong> <strong>Stabilization</strong> Process............................................................. 2-1<br />
2.2 Operability <strong>of</strong> <strong>the</strong> Technology................................................................................ 2-2<br />
2.3 Applicable <strong>Waste</strong>s ................................................................................................. 2-2<br />
2.4 Availability and Transportability <strong>of</strong> Equipment....................................................... 2-2<br />
2.5 <strong>Material</strong>s Handl<strong>in</strong>g Requirements ......................................................................... 2-2<br />
2.6 Range <strong>of</strong> Suitable Site Characteristics .................................................................. 2-3<br />
2.7 Limitations <strong>of</strong> <strong>the</strong> Technology................................................................................ 2-4<br />
2.8 Applicable or Relevant and Appropriate Requirements (ARARs) for<br />
<strong>Stabilization</strong> Processes ......................................................................................... 2-3<br />
2.8.1 Comprehensive Environmental Response, Compensation, and<br />
Liability Act (CERCLA) ............................................................................. 2-3<br />
2.8.2 Resource Conservation and Recovery Act .............................................. 2-5<br />
2.8.3 Clean Air Act (CAA ................................................................................... 2-5<br />
2.8.4 Clean Water Act (CWA)............................................................................ 2-6<br />
2.8.5 Safe Dr<strong>in</strong>k<strong>in</strong>g Water Act (SDWA)............................................................. 2-6<br />
2.8.6 Occupational Safety and Health Adm<strong>in</strong>istration (OSHA) Requirements.. 2-6<br />
3.0 Economic Analysis.............................................................................................................. 3-1<br />
3.1 Introduction ............................................................................................................ 3-1<br />
v
3.2 Cost Estimate Scope ............................................................................................. 3-1<br />
3.3 Factors Affect<strong>in</strong>g Estimated Cost ...........................................................................3-1<br />
3.4 Issues and Assumptions........................................................................................ 3-2<br />
3.4.1 Site Characteristics................................................................................... 3-2<br />
3.4.2 Design and Performance Factors............................................................. 3-2<br />
3.4.3 F<strong>in</strong>ancial Assumptions.............................................................................. 3-2<br />
3.5 Basis for Economic Analysis ................................................................................. 3-2<br />
3.5.1 Site Preparation ........................................................................................ 3-2<br />
3.5.2 Permitt<strong>in</strong>g and Regulatory Requirements ................................................ 3-2<br />
3.5.3 Capital Equipment .................................................................................... 3-2<br />
3.5.4 Startup and Fixed Costs ........................................................................... 3-3<br />
3.5.6 Labor......................................................................................................... 3-3<br />
3.5.6 Consumables and Supplies...................................................................... 3-3<br />
3.5.7 Utilities ...................................................................................................... 3-3<br />
3.5.8 Effluent Treatment and Disposal .............................................................. 3-3<br />
3.5.9 Residuals Shipp<strong>in</strong>g and Disposa.............................................................. 3-4<br />
3.5.10 Analytical Services ................................................................................... 3-4<br />
3.5.11 Ma<strong>in</strong>tenance and Modifications ................................................................ 3-4<br />
3.5.12 Demobilization/Site Restoration ............................................................... 3-4<br />
3.6 Vendor Cost Estimates .......................................................................................... 3-4<br />
3.6.1 E&C Williams Enthrall ® Technology ......................................................... 3-4<br />
3.6.2 KEECO’s SME Technology ...................................................................... 3-7<br />
3.7 Cost Summary .................................................................................................... 3-10<br />
4.0 Treatment Effectiveness ..................................................................................................... 4-1<br />
4.1 Pre-demonstration Studies .................................................................................... 4-1<br />
4.1.1 SPLP Characterizations ........................................................................... 4-1<br />
4.1.2 Leachability Studies.................................................................................. 4-2<br />
4.1.3 Geochemical and M<strong>in</strong>eralogical Evaluation <strong>of</strong> Particulates ..................... 4-3<br />
4.1.4 Extended Leachability Study .................................................................... 4-4<br />
4.1.5 Conclusion From Leachability/Characterization Studies .......................... 4-5<br />
4.1.6 Pre-Demonstration K<strong>in</strong>etic Column Studies ............................................. 4-6<br />
4.2 Project Objectives.................................................................................................. 4-6<br />
4.2.1 Primary and Secondary Objectives .......................................................... 4-6<br />
4.2.1.1 Primary Objective ........................................................................ 4-7<br />
4.2.1.2 Secondary Objectives.................................................................. 4-9<br />
4.3 Experimental Design.............................................................................................. 4-9<br />
4.3.1 Column Studies ........................................................................................ 4-9<br />
4.3.2 Humidity Cell Tests................................................................................ 4-11<br />
4.3.3 M<strong>in</strong>eralogical and Geochemical Tests .................................................. 4-11<br />
4.3.4 Humic/Fulvic Acid Tests ........................................................................ 4-11<br />
4.4 Results ................................................................................................................ 4-12<br />
4.4.1 K<strong>in</strong>etic Column Study Results ............................................................... 4-12<br />
4.4.1.1 Column Studies on <strong>Mercury</strong> Ore <strong>Material</strong> – Primary Objective. 4-12<br />
4.4.1.1.1 Control Column ........................................................ 4-15<br />
4.4.1.1.2 Phosphate Treatment............................................... 4-16<br />
4.4.1.1.3 E&C Williams Sulfide Treatment .............................. 4-17<br />
4.4.1.1.4 KEECO In Situ and Ex Situ ...................................... 4-18<br />
4.4.1.2 <strong>Waste</strong> Rock Column Studies.................................................... 4-20<br />
4.4.2 Humidity Cell Tests................................................................................ 4-22<br />
4.4.3 Syn<strong>the</strong>tic Precipitation Leach<strong>in</strong>g Procedure (SPLP)............................. 4-23<br />
4.4.4 Humic/Fulvic Acid Leach<strong>in</strong>g Tests......................................................... 4-23<br />
4.4.5 Geochemical and M<strong>in</strong>eralogical Analyses............................................. 4-25<br />
vi
5.0<br />
4.5 Developer’s Comments ...................................................................................... 4-25<br />
4.5.1 E&C William’s Comments...................................................................... 4-25<br />
4.5.2 KEECO’s Comments ............................................................................. 4-25<br />
Quality Assurance Summary ...............................................................................................5-1<br />
5.1 Introduction ............................................................................................................ 5-1<br />
5.2 Conclusions and Data Quality Limitations ............................................................. 5-1<br />
vii
Tables<br />
Table Page<br />
2-1 Potential Federal and State ARARs for <strong>Stabilization</strong> Remediation Processes .............. 2-4<br />
3-1 Labor Unit Costs ............................................................................................................ 3-9<br />
3-2 Cost Summary .............................................................................................................. 3-10<br />
4-1 SPLP Leachability Results <strong>from</strong> Various SBMM <strong>Material</strong>s ............................................ 4-2<br />
4-2 Replicate SPLP Analyses on Roasted Tail<strong>in</strong>gs .............................................................. 4-2<br />
4-3 Results <strong>of</strong> Triplicate SPLP Leach<strong>in</strong>g Experiment ........................................................... 4-3<br />
4-4 Results <strong>from</strong> <strong>the</strong> Modified MWMP Leachate Test with Variable Filtration ..................... 4-3<br />
4-5 Results <strong>from</strong> <strong>the</strong> Extended Leachability Study ............................................................... 4-5<br />
4-6 <strong>Mercury</strong> <strong>in</strong> Untreated <strong>Mercury</strong> Ore and <strong>Waste</strong> Rock <strong>Material</strong>s...................................... 4-6<br />
4-7 K<strong>in</strong>etic Column Leachability Study ................................................................................. 4-7<br />
4-8 Treatability Study Test Parameters ................................................................................ 4-8<br />
4-9 Total Mass <strong>Mercury</strong> Leached <strong>from</strong> <strong>Mercury</strong> Ore Columns Over Twelve Weeks ......... 4-13<br />
4-10 <strong>Mercury</strong> Ore Leachability Results By Week ................................................................. 4-14<br />
4-11 Weekly Average Mass <strong>Mercury</strong> Leached <strong>from</strong> <strong>Waste</strong> Rock Columns ......................... 4-21<br />
4-12 SPLP Results for <strong>Mercury</strong> Ore and <strong>Waste</strong> Rock <strong>Material</strong>............................................ 4-23<br />
4-13 Results <strong>from</strong> <strong>the</strong> Humic/Fulvic Acid Leach<strong>in</strong>g Tests .................................................... 4-24<br />
5-1 Accuracy Data for <strong>Mercury</strong> for SBMM Column Leachates............................................. 5-1<br />
5-2 Accuracy Data for <strong>Mercury</strong> for SBMM Extended Column Leachates ............................ 5-1<br />
viii
Figures<br />
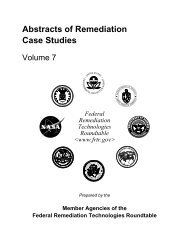
1-1 Features <strong>of</strong> <strong>the</strong> SBMM site ............................................................................................. 1-2<br />
4-1 Locations <strong>of</strong> samples <strong>from</strong> SBMM site ........................................................................... 4-1<br />
4-2 Turbidity and leachable mercury <strong>from</strong> SPLP and MWMP tests ..................................... 4-3<br />
4.3 <strong>Mercury</strong> adsorbed on clay particles as <strong>in</strong>dicated by <strong>the</strong> number <strong>of</strong> x-ray counts<br />
adjusted by <strong>the</strong> sample................................................................................................... 4-4<br />
4-4 Comparison <strong>of</strong> <strong>the</strong> total mass mercury leached <strong>from</strong> <strong>the</strong> mercury ore columns .......... 4-13<br />
4-5 Dissolved and particulate leached Hg (mass) <strong>from</strong> mercury ore control columns ........ 4-16<br />
4-6 Turbidity vs. Hg for <strong>the</strong>
Abbreviations and Acronyms<br />
AQCR Air Quality Control Regions<br />
AQMD Air Quality Management District<br />
ARARs Applicable or Relevant and Appropriate Requirements<br />
ASTM American Society for Test<strong>in</strong>g and <strong>Material</strong>s<br />
CAA Clean Air Act<br />
CCNY City College <strong>of</strong> New York<br />
CERCLA Comprehensive Environmental Response, Compensation, and Liability Act<br />
CFR Code <strong>of</strong> Federal Regulations<br />
CSCT Consortium for site characterization<br />
CV Coefficient <strong>of</strong> variation<br />
CWA Clean Water Act<br />
DI Deionized<br />
DOE U.S. Department <strong>of</strong> Energy<br />
ECWI E&C Williams Incorporated<br />
<strong>EPA</strong> U.S. Environmental Protection Agency<br />
FS Feasibility study<br />
G&A General and adm<strong>in</strong>istrative<br />
HSWA Hazardous and Solid <strong>Waste</strong> Amendments<br />
ICV Internal calibration verification<br />
ITER Innovative Technology Evaluation Report<br />
IM Interim measure<br />
KEECO Kleen Earth Environmental Company<br />
LCS Laboratory control sample<br />
L/hr Liters per hour<br />
mg/Kg Milligrams per kilogram<br />
mg/L Milligrams per liter<br />
mL Milliliter<br />
MS/MSD Matrix spike/matrix spike duplicate<br />
MWMP Meteoric Water Mobility Procedure<br />
MWTP M<strong>in</strong>e <strong>Waste</strong> Technology Program<br />
NA Not analyzed<br />
NAAQS National Ambient Air Quality Standards<br />
NCP National Oil and Hazardous Substances Pollution Cont<strong>in</strong>gency Plan<br />
NPDES National Pollutant Discharge Elim<strong>in</strong>ation System<br />
NRMRL National Risk Management Research Laboratory (<strong>EPA</strong>)<br />
NSCEP National Service Center for Environmental Publications<br />
ND Non-detectable, or not detected at or above <strong>the</strong> method detection limit<br />
NPDWS National primary dr<strong>in</strong>k<strong>in</strong>g water standards<br />
NTU Nephelometric turbidity unit<br />
OSHA Occupational Safety and Health Adm<strong>in</strong>istration<br />
ORD Office <strong>of</strong> Research and Development (<strong>EPA</strong>)<br />
OSWER Office <strong>of</strong> Solid <strong>Waste</strong> and Emergency Response (<strong>EPA</strong>)<br />
PDI Prosonic Drill<strong>in</strong>g Company<br />
ppb Parts per billion<br />
ppm Parts per million<br />
ppmv Parts per million by volume<br />
PPE Personal protective equipment<br />
PQL Practical quantitation limit<br />
PVC Polyv<strong>in</strong>yl chloride<br />
x
POTW Publicly owned treatment works<br />
QA/QC Quality assurance/Quality control<br />
QAPP Quality assurance project plan<br />
RI/FS Remedial Investigation / Feasibility Study<br />
RCRA Resource Conservation and Recovery Act<br />
RPD Relative percent difference<br />
RSD Relative Standard Deviation<br />
SARA Superfund Amendments and Reauthorization Act<br />
SAIC Science Applications International Corporation<br />
SBMM Sulfur Bank <strong>Mercury</strong> M<strong>in</strong>e<br />
SDWA Safe Dr<strong>in</strong>k<strong>in</strong>g Water Act<br />
SEM/EDS Scann<strong>in</strong>g Electron Microscopy/Energy Dispersive Spectroscopy<br />
SME Silica Micro Encapsulation<br />
SVE Soil vapor extraction<br />
SPLP Syn<strong>the</strong>tic Precipitation Leach<strong>in</strong>g Procedure<br />
SW-846 Test methods for evaluat<strong>in</strong>g solid waste, physical/chemical methods<br />
SWDA Solid <strong>Waste</strong> Disposal Act<br />
SITE Superfund Innovative Technology Evaluation<br />
S.U. Standard units<br />
TCLP Toxicity Characteristic Leach<strong>in</strong>g Procedure<br />
TER Technology Evaluation Report<br />
µg Micrograms<br />
µg/L Micrograms per liter<br />
µm Micron<br />
UCL Upper confidence level<br />
<strong>US</strong><strong>EPA</strong> United States Environmental Protection Agency<br />
<strong>US</strong>GS United States Geological Survey<br />
w/w Weight to weight ratio<br />
XRD X-ray diffraction<br />
XRF X-ray fluorescence<br />
xi
Acknowledgments<br />
This report was prepared under <strong>the</strong> direction <strong>of</strong> Mr. Edward Bates, <strong>the</strong> <strong>EPA</strong> Technical Project<br />
Manager for this SITE demonstration, and Mr. Roger Wilmoth, Director <strong>of</strong> <strong>EPA</strong>’s M<strong>in</strong>e <strong>Waste</strong><br />
Technology Program, both <strong>of</strong> <strong>the</strong> National Risk Management Research Laboratory (NRMRL) <strong>in</strong><br />
C<strong>in</strong>c<strong>in</strong>nati, Ohio. <strong>EPA</strong> review <strong>of</strong> this report was conducted by Diana Bless <strong>of</strong> <strong>US</strong><strong>EPA</strong> and Dan<br />
McM<strong>in</strong>des <strong>of</strong> <strong>US</strong>ACE. .<br />
The demonstration required <strong>the</strong> comb<strong>in</strong>ed services <strong>of</strong> several <strong>in</strong>dividuals <strong>from</strong> MSE-Technology<br />
Applications (MSE-TA), and Science Applications International Corporation (SAIC). Ms. Suzzann<br />
Nordwick served as <strong>the</strong> project manager for MSE-TA. Dr. Scott Beckman <strong>of</strong> SAIC served as <strong>the</strong><br />
SITE work assignment manager for <strong>the</strong> implementation <strong>of</strong> treatability study activities and completion<br />
<strong>of</strong> all associated reports. The treatability study was performed at MSE-TA’s facility <strong>in</strong> Butte, Montana.<br />
The cooperation and efforts <strong>of</strong> <strong>the</strong>se organizations and <strong>in</strong>dividuals are gratefully acknowledged.<br />
This report was prepared by Dr. Scott Beckman, Ms. Melissa Hammett, and Ms. Rita Stasik <strong>of</strong> SAIC.<br />
Ms. Stasik also served as <strong>the</strong> SAIC Quality Assurance (QA) Coord<strong>in</strong>ator for data review and<br />
validation. Joseph Evans (<strong>the</strong> SAIC QA Manager) <strong>in</strong>ternally reviewed <strong>the</strong> report.<br />
xii
Three <strong>in</strong>novative technologies for <strong>in</strong> situ stabilization <strong>of</strong><br />
heavy metals were demonstrated <strong>in</strong> a large-scale<br />
treatability study performed on materials <strong>from</strong> <strong>the</strong> Sulfur<br />
Bank <strong>Mercury</strong> M<strong>in</strong>e, a superfund site <strong>in</strong> nor<strong>the</strong>rn<br />
California. The treatability study was jo<strong>in</strong>tly sponsored by<br />
two <strong>EPA</strong> programs; <strong>the</strong> M<strong>in</strong>e <strong>Waste</strong> Technology<br />
Program (MWTP) and <strong>the</strong> Superfund Innovative<br />
Technology Evaluation (SITE) Demonstration Program.<br />
The purpose <strong>of</strong> <strong>the</strong> study was to determ<strong>in</strong>e <strong>the</strong><br />
effectiveness <strong>of</strong> <strong>the</strong>se stabilization technologies for<br />
immobiliz<strong>in</strong>g mercury <strong>in</strong> sulfide m<strong>in</strong>e waste materials<br />
such as those found at <strong>the</strong> Sulphur Bank <strong>Mercury</strong> M<strong>in</strong>e<br />
(SBMM) site and <strong>the</strong>refore reduce <strong>the</strong> potential for<br />
leach<strong>in</strong>g and mobiliz<strong>in</strong>g mercury <strong>in</strong>to <strong>the</strong> environment.<br />
The SBMM is a non-operat<strong>in</strong>g facility located on <strong>the</strong><br />
South shore <strong>of</strong> Clear Lake <strong>in</strong> nor<strong>the</strong>rn California where<br />
some <strong>of</strong> <strong>the</strong> highest mercury concentrations <strong>in</strong> <strong>the</strong> world<br />
have been recorded. Several mercury-bear<strong>in</strong>g materials<br />
<strong>from</strong> <strong>the</strong> site were considered for test<strong>in</strong>g. A waste<br />
material with high levels <strong>of</strong> leachable mercury (mercury<br />
ore) was selected as <strong>the</strong> primary target <strong>of</strong> <strong>the</strong> study. As<br />
a secondary objective, treatment effectiveness was<br />
evaluated on a waste material that was lower <strong>in</strong> mercury<br />
concentration, but present <strong>in</strong> large quantities (waste<br />
rock).<br />
<strong>Stabilization</strong> technologies use chemical reagents to<br />
reduce <strong>the</strong> mobility <strong>of</strong> contam<strong>in</strong>ants <strong>in</strong> a solid matrix.<br />
The three processes used <strong>in</strong> <strong>the</strong> treatability study are:<br />
(1) <strong>the</strong> Silica Micro Encapsulation (SME) process,<br />
developed by Klean Earth Environmental Company<br />
(KEECO) which encapsulates metals <strong>in</strong> an impervious<br />
microscopic silica matrix, thus prevent<strong>in</strong>g metals <strong>in</strong> <strong>the</strong><br />
treated material <strong>from</strong> leach<strong>in</strong>g <strong>in</strong>to <strong>the</strong> environment, (2)<br />
Enthrall ® , developed by E&C Williams, Inc., which uses<br />
an <strong>in</strong>organic sulfide chemical to b<strong>in</strong>d metals with<strong>in</strong> <strong>the</strong><br />
matrix, and (3) a generic phosphate treatment that forms<br />
<strong>in</strong>soluble phosphate salts conta<strong>in</strong><strong>in</strong>g <strong>the</strong> contam<strong>in</strong>ant.<br />
S<strong>in</strong>ce metal contam<strong>in</strong>ants cannot be destroyed, each <strong>of</strong><br />
<strong>the</strong> selected technologies is targeted to <strong>in</strong>hibit <strong>the</strong><br />
release <strong>of</strong> mercury <strong>from</strong> <strong>the</strong> m<strong>in</strong>e materials <strong>in</strong>to <strong>the</strong><br />
environment.<br />
The treatability study took place at <strong>the</strong> research facility <strong>of</strong><br />
MSE <strong>in</strong> Butte Montana, <strong>from</strong> November 15, 2000 to April<br />
Executive Summary<br />
xiii<br />
29, 2001. The primary test procedure was an <strong>in</strong> situ<br />
k<strong>in</strong>etic column leach. The vendors each applied <strong>the</strong>ir<br />
reagent to four-kilogram splits <strong>of</strong> each <strong>of</strong> <strong>the</strong> two test<br />
materials that had been loaded <strong>in</strong>to 3-foot PVC columns.<br />
The SME technology was applied ex situ as well, and<br />
<strong>the</strong>n <strong>the</strong> treated material was loaded <strong>in</strong>to <strong>the</strong> columns.<br />
To evaluate each technology’s ability to reduce <strong>the</strong><br />
amount <strong>of</strong> leachable mercury, s<strong>in</strong>gle pass, low flow<br />
leach<strong>in</strong>g was performed for twelve weeks, with weekly<br />
sampl<strong>in</strong>g for mercury and o<strong>the</strong>r constituents. The<br />
primary objective <strong>of</strong> <strong>the</strong> study was for each technology to<br />
achieve a 90% reduction <strong>in</strong> <strong>the</strong> mass <strong>of</strong> mobile mercury<br />
<strong>in</strong> <strong>the</strong> leachate over <strong>the</strong> twelve week period, as<br />
compared to untreated control columns receiv<strong>in</strong>g a water<br />
leach. Several secondary studies were performed<br />
along with <strong>the</strong> primary column study, <strong>in</strong>clud<strong>in</strong>g humidity<br />
cell test<strong>in</strong>g to simulate extreme wea<strong>the</strong>r<strong>in</strong>g conditions,<br />
and humic/fulvic acid leach<strong>in</strong>g to simulate <strong>the</strong> effect <strong>of</strong><br />
high molecular weight organic constituents <strong>from</strong><br />
vegetative caps. Treated and untreated samples and<br />
leachates were also analyzed to determ<strong>in</strong>e o<strong>the</strong>r<br />
chemical characteristics and m<strong>in</strong>eralogical changes due<br />
to <strong>the</strong> treatments.<br />
Conclusions <strong>from</strong> <strong>the</strong> study are summarized below:<br />
• Pre-demonstration leachability studies revealed that<br />
<strong>the</strong> dom<strong>in</strong>ant form <strong>of</strong> leachable mercury was <strong>in</strong> a<br />
particulate and mobile form. These studies<br />
<strong>in</strong>dicated that leach<strong>in</strong>g with a meteoric solution<br />
released particulates that rema<strong>in</strong>ed suspended <strong>in</strong><br />
solution and <strong>the</strong>refore could be mobile <strong>in</strong> a<br />
groundwater and/or surface water hydraulic system.<br />
Levels <strong>of</strong> dissolved mercury were low <strong>in</strong> <strong>the</strong>se<br />
leach<strong>in</strong>g studies. Based on <strong>the</strong>se tests, a<br />
cont<strong>in</strong>uous column leach<strong>in</strong>g test design was used to<br />
collect effluent samples over a 12-week period to<br />
evaluate leachable mercury <strong>in</strong> mobile (
mass <strong>of</strong> mercury leached occurred relative to <strong>the</strong><br />
control.<br />
• E&C Williams’ sulfide treatment did not appear to be<br />
effective <strong>in</strong> reduc<strong>in</strong>g <strong>the</strong> levels <strong>of</strong> mobile mercury <strong>in</strong><br />
<strong>the</strong> mercury ore column tests. There was no<br />
significant difference <strong>in</strong> <strong>the</strong> cumulative levels <strong>of</strong><br />
mobile mercury <strong>in</strong> <strong>the</strong> effluent <strong>from</strong> <strong>the</strong> sulfide<br />
treatment relative to <strong>the</strong> control.<br />
• KEECO’s Silica Micro Encapsulation Technology<br />
was effective <strong>in</strong> reduc<strong>in</strong>g mobile mercury (
This section provides background <strong>in</strong>formation about <strong>the</strong><br />
Superfund Innovative Technology Evaluation (SITE)<br />
Program and <strong>the</strong> M<strong>in</strong>e <strong>Waste</strong> Technology Program<br />
(MWTP), discusses <strong>the</strong> purpose <strong>of</strong> this Innovative<br />
Technology Evaluation Report (ITER), describes <strong>the</strong><br />
Sulfur Bank <strong>Mercury</strong> M<strong>in</strong>e (SBMM) site, and describes<br />
<strong>the</strong> technologies that were applied <strong>in</strong> <strong>the</strong> treatability<br />
study on <strong>the</strong> SBMM materials. Key contacts are listed at<br />
<strong>the</strong> end <strong>of</strong> this section for <strong>in</strong>quires regard<strong>in</strong>g <strong>the</strong> SITE<br />
and MWTP Programs, <strong>the</strong> technologies, and <strong>the</strong> site for<br />
which <strong>the</strong> treatability study was conducted.<br />
1.1 Background<br />
A treatability test<strong>in</strong>g program was conducted to<br />
determ<strong>in</strong>e <strong>the</strong> effectiveness <strong>of</strong> <strong>in</strong> situ stabilization<br />
technologies on controll<strong>in</strong>g <strong>the</strong> release <strong>of</strong> mobile<br />
mercury <strong>from</strong> <strong>the</strong> Sulfur Bank <strong>Mercury</strong> M<strong>in</strong>e <strong>in</strong> Lake<br />
County, California. Three stabilization technologies<br />
were evaluated dur<strong>in</strong>g this study: (1) E&C Williams’<br />
Enthrall ® sulfide based treatment, (2) Kleen Earth<br />
Environmental Company’s (KEECO) Silica Micro<br />
Encapsulation (SME) process, and (3) a generic<br />
phosphate treatment. Pre-demonstration studies<br />
identified suitable materials <strong>from</strong> <strong>the</strong> site for test<strong>in</strong>g,<br />
identified a potential mercury release mechanism, and<br />
evaluated several leachability protocols. Samples <strong>of</strong> two<br />
types <strong>of</strong> material <strong>from</strong> <strong>the</strong> site (mercury ore <strong>from</strong> <strong>the</strong><br />
south white gate pile and waste rock <strong>from</strong> <strong>the</strong> north<br />
yellow pile) were collected and screened <strong>in</strong> <strong>the</strong> field,<br />
<strong>the</strong>n taken to <strong>the</strong> research facility <strong>of</strong> MSE <strong>in</strong> Butte,<br />
Montana for demonstration test<strong>in</strong>g. K<strong>in</strong>etic column<br />
leach<strong>in</strong>g tests were performed to determ<strong>in</strong>e <strong>the</strong><br />
effectiveness <strong>of</strong> <strong>the</strong> treatments <strong>in</strong> reduc<strong>in</strong>g <strong>the</strong><br />
generation <strong>of</strong> mobile mercury.<br />
1.1.1 Description <strong>of</strong> <strong>the</strong> SBMM Site<br />
The Sulfur Bank <strong>Mercury</strong> M<strong>in</strong>e (SBMM) is an <strong>EPA</strong><br />
Superfund site, located on <strong>the</strong> south shore <strong>of</strong> <strong>the</strong> Oaks<br />
Arm <strong>of</strong> Clear Lake, <strong>in</strong> Lake County, California (Figure 1-<br />
1). With a surface area <strong>of</strong> 68 square miles, Clear Lake<br />
is <strong>the</strong> largest lake entirely <strong>in</strong> California and is a popular<br />
fish<strong>in</strong>g, resort and watersport dest<strong>in</strong>ation; thus <strong>the</strong><br />
mercury contam<strong>in</strong>ation <strong>in</strong> <strong>the</strong> lake has caused great<br />
Section 1.0<br />
Introduction<br />
1-1<br />
concern. Sulfur Bank was m<strong>in</strong>ed periodically <strong>from</strong> 1865<br />
to 1957 with open pit m<strong>in</strong><strong>in</strong>g beg<strong>in</strong>n<strong>in</strong>g <strong>in</strong> 1915. In <strong>the</strong><br />
late 1920’s, heavy earthmov<strong>in</strong>g equipment began to be<br />
used on a large-scale basis, which dramatically<br />
<strong>in</strong>creased <strong>the</strong> environmental impacts <strong>of</strong> m<strong>in</strong><strong>in</strong>g. Various<br />
m<strong>in</strong><strong>in</strong>g activities over <strong>the</strong> years have deposited amounts<br />
<strong>of</strong> mercury <strong>in</strong> <strong>the</strong> Clear Lake ecosystem.<br />
Several pits were excavated at <strong>the</strong> m<strong>in</strong>e, <strong>the</strong> larger<br />
be<strong>in</strong>g Herman Pit, which is located a few hundred feet<br />
<strong>from</strong> <strong>the</strong> lake. Surface run<strong>of</strong>f, subterranean streams,<br />
surface seeps and groundwater have all played a part <strong>in</strong><br />
fill<strong>in</strong>g <strong>the</strong> pit, which seeps through <strong>the</strong> waste rock dam<br />
<strong>in</strong>to Clear Lake. Metal-laden acid m<strong>in</strong>e dra<strong>in</strong>age results<br />
<strong>from</strong> <strong>the</strong> <strong>in</strong>teraction <strong>of</strong> surface and ground waters with<br />
sulfide bear<strong>in</strong>g m<strong>in</strong>e wastes, <strong>in</strong> and around <strong>the</strong> pit.<br />
Degradation <strong>of</strong> water quality <strong>in</strong> Clear Lake may have<br />
been caused largely by sulfate and acidity load<strong>in</strong>g <strong>from</strong><br />
<strong>the</strong> Sulfur Bank <strong>Mercury</strong> M<strong>in</strong>e, though <strong>the</strong> transport<br />
mechanisms rema<strong>in</strong> unclear.<br />
1.1.2 E&C Williams Enthrall ® Technology (as<br />
provided by E&C Williams)<br />
Enthrall ® is a chemical stabilization process that uses<br />
<strong>in</strong>organic sulfide to target heavy metals and/or cyanide<br />
<strong>in</strong> soil, liquid or sludge. The product, available <strong>in</strong> solid,<br />
liquid or granular form, has been developed for use <strong>in</strong> <strong>in</strong>l<strong>in</strong>e<br />
treatment systems. The granular, pelletized form<br />
has also been developed that can be used as a reactive<br />
filter bed, which captures metals by form<strong>in</strong>g sulfide<br />
bonds as <strong>the</strong> contam<strong>in</strong>ated solution flows through <strong>the</strong><br />
pellets. The treatment forms a permanent bond between<br />
<strong>the</strong> Enthrall ® surface and heavy metals. Bonds rema<strong>in</strong><br />
resistant to leach<strong>in</strong>g even though subsequent conditions<br />
may <strong>in</strong>volve harsh pHs, as has been demonstrated by<br />
<strong>the</strong> Multiple Extraction Procedure that subjects materials<br />
repeatedly to an acidic environment. Accord<strong>in</strong>g to E&C<br />
Williams, a typical conventional treatment <strong>in</strong>creases <strong>the</strong><br />
volume <strong>of</strong> <strong>the</strong> treated material by 25 to 200%, whereas<br />
<strong>the</strong> ENTHRALL ® addition <strong>of</strong>ten <strong>in</strong>creases volume by only<br />
5-10%. The smaller volume is advantageous dur<strong>in</strong>g<br />
treatment, as less material must be handled.<br />
Additionally, <strong>the</strong> reduced quantity <strong>of</strong> treated material that<br />
must be transported or stored can significantly lower<br />
costs.
Figure 1-1. Features <strong>of</strong> <strong>the</strong> SBMM site.<br />
The ENTHRALL ® technology is applicable to <strong>in</strong>-l<strong>in</strong>e<br />
process streams and wastes conta<strong>in</strong><strong>in</strong>g heavy metals<br />
and/or cyanide and may be applied by ei<strong>the</strong>r <strong>in</strong> situ or ex<br />
situ methods. The reagent may be applied to <strong>the</strong><br />
surface and mixed <strong>in</strong>, or may be <strong>in</strong>jected under pressure<br />
to achieve contact with deeper materials.<br />
Successful application <strong>of</strong> <strong>the</strong> ENTHRALL ® reagent must<br />
take place <strong>in</strong> a neutral to alkal<strong>in</strong>e environment. When<br />
<strong>the</strong> calcium sulfide reagent is applied under acidic<br />
conditions, some hydrogen sulfide gas is produced,<br />
which reduces <strong>the</strong> effectiveness <strong>of</strong> metals stabilization.<br />
No hazardous residuals are produced by <strong>the</strong> technology.<br />
In an <strong>in</strong>-l<strong>in</strong>e process <strong>the</strong> residual would be a<br />
nonhazardous form <strong>of</strong> <strong>the</strong> orig<strong>in</strong>al potentially hazardous<br />
material, which could <strong>the</strong>n be stored on site or disposed<br />
<strong>of</strong> <strong>in</strong> a Subtitle D landfill.<br />
1.1.3 Kleen Earth Environmental Company Silica<br />
Micro Encapsulation (SME) Process (as<br />
provided by KEECO)<br />
Klean Earth Environmental Company (KEECO) has<br />
developed a Silica Micro Encapsulation (SME) process,<br />
1-2<br />
which encapsulates metals <strong>in</strong> an impervious microscopic<br />
silica matrix, thus elim<strong>in</strong>at<strong>in</strong>g <strong>the</strong> availability <strong>of</strong> <strong>the</strong><br />
metals to have adverse human health or environmental<br />
effects. KEECO has developed three products for<br />
apply<strong>in</strong>g <strong>the</strong> technology to water (KB-1), solid waste<br />
(KB-SEA) and radioactive wastewater (META-LOCK).<br />
KB-SEA was used <strong>in</strong> this treatability study.<br />
The SME process is a high-performance, low-cost<br />
technology for prevent<strong>in</strong>g and treat<strong>in</strong>g metal<br />
contam<strong>in</strong>ation <strong>in</strong> water and soils, as it uses silica, which<br />
is one <strong>of</strong> <strong>the</strong> most common and <strong>in</strong>ert substances on<br />
earth. The durability <strong>of</strong> silica also contributes to <strong>the</strong><br />
value <strong>of</strong> <strong>the</strong> treatment, which works by isolat<strong>in</strong>g <strong>the</strong><br />
metals <strong>in</strong> question <strong>from</strong> contact<strong>in</strong>g <strong>the</strong> environment.<br />
Metals cannot be destroyed, nor can <strong>the</strong>y be broken<br />
down <strong>in</strong>to o<strong>the</strong>r forms, so <strong>the</strong> most effective control<br />
method is to simply isolate <strong>the</strong>m <strong>from</strong> contact<strong>in</strong>g<br />
humans and <strong>the</strong> natural environment. KEECO’s SME<br />
process differs <strong>from</strong> typical stabilization treatments <strong>in</strong><br />
that <strong>the</strong> chemical formulation causes an electrok<strong>in</strong>etic<br />
reaction which facilitates transport <strong>of</strong> <strong>the</strong> metals towards<br />
<strong>the</strong> SME reactive components, thus enhanc<strong>in</strong>g contact<br />
with <strong>the</strong> target metals and reduc<strong>in</strong>g <strong>the</strong> amount <strong>of</strong><br />
chemical required to achieve <strong>the</strong> desired results. The
use <strong>of</strong> silica itself is ano<strong>the</strong>r significant departure <strong>from</strong><br />
more typical stabilization treatments.<br />
The SME reagent is designed to be applied <strong>in</strong> situ by<br />
mix<strong>in</strong>g a small amount, <strong>in</strong> ei<strong>the</strong>r dry or slurry form, <strong>in</strong>to<br />
<strong>the</strong> contam<strong>in</strong>ated soil. Boulder-sized material would be<br />
coated with a slurry <strong>of</strong> <strong>the</strong> reagent. The volume <strong>of</strong> <strong>the</strong><br />
material should only be <strong>in</strong>creased by 1-2% due to <strong>the</strong><br />
quantity <strong>of</strong> reagent added. If <strong>the</strong> reagent is applied dry,<br />
a small amount <strong>of</strong> water may be added to <strong>in</strong>itiate <strong>the</strong><br />
chemical reaction. A reaction period <strong>of</strong> 48 hours is<br />
recommended before <strong>in</strong>itial test<strong>in</strong>g for results. For areas<br />
<strong>of</strong> high metals concentration, a till<strong>in</strong>g device may be<br />
used to produce fur<strong>the</strong>r contact between reagent and<br />
contam<strong>in</strong>ated soil. This may be <strong>in</strong>dicated <strong>in</strong> areas <strong>of</strong><br />
high concentration and hydraulic transport rates.<br />
SME is applicable to wastewater, sediment, sludge, soil,<br />
m<strong>in</strong>e waste, radioactive wastewater and o<strong>the</strong>r complex<br />
media. Silica bridg<strong>in</strong>g between encapsulated particles <strong>in</strong><br />
treated materials <strong>in</strong>creases compressive strength over<br />
time, which can enhance <strong>the</strong> usefulness <strong>of</strong> <strong>the</strong> treated<br />
waste as backfill.<br />
One problem that could be encountered with<br />
stabilization treatments is that wea<strong>the</strong>r<strong>in</strong>g and exposure<br />
to changes <strong>in</strong> pH can break down <strong>the</strong> bond<strong>in</strong>g and allow<br />
metals to be released. The long-term stability<br />
associated with SME treated wastes may <strong>in</strong>dicate<br />
applicability for large <strong>in</strong> situ applications where treated<br />
materials will rema<strong>in</strong> on site, exposed to <strong>the</strong><br />
environment. The SME technology has been designed<br />
to treat metals-contam<strong>in</strong>ated water and soils without<br />
produc<strong>in</strong>g any hazardous by-products.<br />
Where <strong>the</strong> technology is applied correctly and <strong>in</strong> a<br />
manner that allows for thorough contact with <strong>the</strong> metal<br />
contam<strong>in</strong>ants <strong>of</strong> concern, no hazardous wastes should<br />
be produced. Water treatments us<strong>in</strong>g <strong>the</strong> SME products<br />
produce a dense sediment or sludge that can be<br />
separated <strong>from</strong> <strong>the</strong> water and disposed <strong>of</strong> on-site or <strong>in</strong> a<br />
sanitary landfill. Treated soils and o<strong>the</strong>r solids can be<br />
left <strong>in</strong> place or used as backfill material.<br />
The effectiveness <strong>of</strong> <strong>the</strong> SME process is somewhat<br />
dependent on <strong>the</strong> substrate pH. Highly alkal<strong>in</strong>e<br />
substrates (such as unstable sludge <strong>from</strong> water<br />
treatment plants, or soils that have been amended with<br />
lime) hav<strong>in</strong>g a pH greater than 8 may produce<br />
resistance to <strong>the</strong> reactive process. In such an<br />
environment, a pretreatment step to lower <strong>the</strong> pH by<br />
may be necessary prior to <strong>the</strong> addition <strong>of</strong> SME. In this<br />
case, an evaluation <strong>of</strong> <strong>the</strong> effectiveness and economics<br />
<strong>of</strong> <strong>the</strong> multi-step treatment would be required.<br />
1-3<br />
Accord<strong>in</strong>g to KEECO, <strong>the</strong> s<strong>in</strong>gle most limit<strong>in</strong>g factor <strong>in</strong><br />
<strong>the</strong> effectiveness <strong>of</strong> <strong>the</strong> SME technology is contact with<br />
<strong>the</strong> metal-bear<strong>in</strong>g particles. Where <strong>the</strong> chemicals<br />
cannot make contact with all <strong>the</strong> metal bear<strong>in</strong>g<br />
substrate, for example <strong>in</strong> <strong>the</strong> <strong>in</strong> situ treatment <strong>of</strong> large<br />
waste rock or tail<strong>in</strong>gs piles, effectiveness would be<br />
limited. KEECO is <strong>in</strong> <strong>the</strong> process <strong>of</strong> design<strong>in</strong>g deep<br />
subsurface <strong>in</strong>jection methods to more effectively<br />
<strong>in</strong>troduce <strong>the</strong> reagent, <strong>in</strong> an effort to overcome this<br />
<strong>in</strong>herent limitation <strong>of</strong> <strong>in</strong> situ treatment. SME is solely<br />
applicable as a stabilization technology and cannot be<br />
used as a reactive barrier.<br />
1.1.4 Phosphate<br />
Phosphate-based b<strong>in</strong>ders have been used successfully<br />
to reduce solubility <strong>of</strong> heavy metal contam<strong>in</strong>ants,<br />
particularly lead, <strong>in</strong> soils. The reagents form bonds with<br />
metal ions to form <strong>in</strong>soluble metal complexes called<br />
pyromorphites. The k<strong>in</strong>etics <strong>of</strong> <strong>the</strong> reaction depends on<br />
<strong>the</strong> phosphate form <strong>in</strong> <strong>the</strong> reagent. Phosphates have<br />
been used <strong>in</strong> <strong>in</strong> situ remediation by land farm<strong>in</strong>g<br />
(plow<strong>in</strong>g and grad<strong>in</strong>g), <strong>in</strong>jection, and surface application<br />
and augur<strong>in</strong>g.<br />
Dur<strong>in</strong>g <strong>the</strong> design phases <strong>of</strong> <strong>the</strong> treatability study, <strong>the</strong>re<br />
was an <strong>in</strong>terest <strong>in</strong> test<strong>in</strong>g phosphate as a b<strong>in</strong>d<strong>in</strong>g agent<br />
for mercury. A generic phosphate reagent was obta<strong>in</strong>ed<br />
for test<strong>in</strong>g. Phosphates stabilize metals by chemically<br />
b<strong>in</strong>d<strong>in</strong>g <strong>the</strong>m <strong>in</strong>to new stable phosphate phases, such as<br />
apatites, and o<strong>the</strong>r relatively <strong>in</strong>soluble phases <strong>in</strong> <strong>the</strong> soil.<br />
Phosphates have been <strong>in</strong>cluded <strong>in</strong> <strong>the</strong> reagent mixes for<br />
stabiliz<strong>in</strong>g lead dur<strong>in</strong>g remediation <strong>of</strong> several Superfund<br />
sites.<br />
Metals stabilized <strong>in</strong> apatite m<strong>in</strong>erals are durable and<br />
resistant to leach<strong>in</strong>g because <strong>the</strong> m<strong>in</strong>eral structure is<br />
stable <strong>from</strong> pH 2 to 12 and up to 1000 degrees C, <strong>in</strong><br />
liquids or solids and through geologic disruptions.<br />
Previous studies have <strong>in</strong>dicated that as little as 1% (w/w)<br />
phosphate addition could remediate metal-contam<strong>in</strong>ated<br />
soils.<br />
Earlier studies have found phosphates to be effective at<br />
stabiliz<strong>in</strong>g copper, lead, z<strong>in</strong>c, cadmium, nickel,<br />
lanthanides and act<strong>in</strong>ides (Chen et al., 1997).<br />
Generally, <strong>the</strong> process is applicable to <strong>in</strong>organics,<br />
<strong>in</strong>clud<strong>in</strong>g radionuclides, but not to organic contam<strong>in</strong>ants<br />
or pesticides.<br />
As with all stabilization remediations, <strong>the</strong> success <strong>of</strong> <strong>the</strong><br />
process is dependent on <strong>the</strong> reagent and <strong>the</strong> waste.<br />
Generally, site-specific treatability studies are required.
Additionally, long-term stability has not been identified<br />
for very many comb<strong>in</strong>ations, so durability studies may be<br />
required. Lead phosphate is toxic by <strong>in</strong>halation, so <strong>the</strong><br />
formation <strong>of</strong> that compound would also have to be<br />
evaluated. While phosphate-b<strong>in</strong>d<strong>in</strong>g has been well<br />
documented for lead remediation, <strong>the</strong>re is little<br />
<strong>in</strong>formation on mercury stabilization.<br />
1.2 Brief Description <strong>of</strong> <strong>the</strong> Superfund Innovative<br />
Technology Evaluation (SITE) and M<strong>in</strong>e<br />
<strong>Waste</strong> Technology (MWTP) Programs<br />
The SITE Program is a formal program established by<br />
<strong>the</strong> <strong>EPA</strong>'s Office <strong>of</strong> Solid <strong>Waste</strong> and Emergency<br />
Response (OSWER) and Office <strong>of</strong> Research and<br />
Development (ORD) <strong>in</strong> response to <strong>the</strong> Superfund<br />
Amendments and Reauthorization Act <strong>of</strong> 1986 (SARA).<br />
The SITE Program promotes <strong>the</strong> development,<br />
demonstration, and use <strong>of</strong> new or <strong>in</strong>novative<br />
technologies to clean up Superfund sites across <strong>the</strong><br />
country.<br />
The SITE Program's primary purpose is to maximize <strong>the</strong><br />
use <strong>of</strong> alternatives <strong>in</strong> clean<strong>in</strong>g hazardous waste sites by<br />
encourag<strong>in</strong>g <strong>the</strong> development and demonstration <strong>of</strong><br />
new, <strong>in</strong>novative treatment and monitor<strong>in</strong>g technologies.<br />
It consists <strong>of</strong> three major elements:<br />
• Demonstration Program,<br />
• Consortium for Site Characterization<br />
Technologies (CSCT)<br />
• Technology Transfer Program.<br />
The objective <strong>of</strong> <strong>the</strong> Demonstration Program is to<br />
develop reliable performance and cost data on<br />
<strong>in</strong>novative technologies so that potential users can<br />
assess <strong>the</strong> technology's site-specific applicability.<br />
Technologies evaluated are ei<strong>the</strong>r available<br />
commercially or close to be<strong>in</strong>g available for full-scale<br />
remediation <strong>of</strong> Superfund sites. SITE demonstrations<br />
usually are conducted at hazardous waste sites under<br />
conditions that closely simulate full-scale remediation<br />
conditions, thus assur<strong>in</strong>g <strong>the</strong> usefulness and reliability <strong>of</strong><br />
<strong>the</strong> <strong>in</strong>formation collected. Data collected are used to<br />
assess: (1) <strong>the</strong> performance <strong>of</strong> <strong>the</strong> technology; (2) <strong>the</strong><br />
potential need for pre- and post-treatment <strong>of</strong> wastes; (3)<br />
potential operat<strong>in</strong>g problems; and (4) <strong>the</strong> approximate<br />
costs. The demonstration also provides opportunities to<br />
evaluate <strong>the</strong> long-term risks and limitations <strong>of</strong> a<br />
technology.<br />
Exist<strong>in</strong>g and new technologies and test procedures that<br />
improve field monitor<strong>in</strong>g and site characterizations are<br />
explored <strong>in</strong> <strong>the</strong> CSCT Program. New monitor<strong>in</strong>g<br />
1-4<br />
technologies, or analytical methods that provide faster,<br />
more cost-effective contam<strong>in</strong>ation and site assessment<br />
data are supported by this program. The CSCT<br />
Program also formulates <strong>the</strong> protocols and standard<br />
operat<strong>in</strong>g procedures for demonstration methods and<br />
equipment.<br />
The Technology Transfer Program dissem<strong>in</strong>ates<br />
technical <strong>in</strong>formation on <strong>in</strong>novative technologies <strong>in</strong> <strong>the</strong><br />
Demonstration and CSCT Programs through various<br />
activities. These activities <strong>in</strong>crease awareness and<br />
promote <strong>the</strong> use <strong>of</strong> <strong>in</strong>novative technologies for<br />
assessment and remediation at Superfund sites. The<br />
goal <strong>of</strong> technology transfer activities is to develop<br />
<strong>in</strong>teractive communication among <strong>in</strong>dividuals requir<strong>in</strong>g<br />
up-to-date technical <strong>in</strong>formation.<br />
The M<strong>in</strong>e <strong>Waste</strong> Technology Program (MWTP) is an<br />
<strong>in</strong>teragency effort by <strong>the</strong> <strong>EPA</strong> and U.S. Department <strong>of</strong><br />
Energy (DOE) focused on develop<strong>in</strong>g and prov<strong>in</strong>g<br />
technologies that provide solutions to <strong>the</strong> remedial<br />
problems <strong>of</strong> abandoned m<strong>in</strong>es and <strong>the</strong> compliance<br />
issues <strong>of</strong> active m<strong>in</strong>es throughout <strong>the</strong> United States.<br />
Exclud<strong>in</strong>g coal production, <strong>the</strong> m<strong>in</strong><strong>in</strong>g <strong>in</strong>dustry produces<br />
between 1 and 2 billion tons <strong>of</strong> m<strong>in</strong>e waste annually.<br />
The 1985 Report to Congress estimated <strong>the</strong> total<br />
noncoal m<strong>in</strong>e waste volume <strong>in</strong> <strong>the</strong> United States at 50<br />
billion tons. MWTP priorities <strong>in</strong>clude at-source control<br />
technologies, improvements <strong>of</strong> short-term technologies<br />
for <strong>the</strong> alleviation <strong>of</strong> extreme environmental problems<br />
and implement<strong>in</strong>g resource recovery methods to help<br />
alleviate <strong>the</strong> costs <strong>of</strong> remediation.<br />
1.3 The SITE Demonstration Program<br />
and Reports<br />
Technologies are selected for <strong>the</strong> SITE Demonstration<br />
Program through annual requests for proposals. This<br />
solicitation ended <strong>in</strong> 1995. <strong>EPA</strong> Office <strong>of</strong> Research and<br />
Development (ORD) staff review <strong>the</strong> proposals to<br />
determ<strong>in</strong>e which technologies show <strong>the</strong> most promise<br />
for use at Superfund sites. Technologies chosen must<br />
be at <strong>the</strong> pilot- or full-scale stage, must be <strong>in</strong>novative,<br />
and must have some technological and/or cost<br />
advantage over exist<strong>in</strong>g technologies. Mobile<br />
technologies are <strong>of</strong> particular <strong>in</strong>terest.<br />
Once <strong>the</strong> <strong>EPA</strong> has accepted a proposal, cooperative<br />
agreements between <strong>the</strong> <strong>EPA</strong> and <strong>the</strong> developer<br />
establish responsibilities for conduct<strong>in</strong>g <strong>the</strong><br />
demonstration and evaluat<strong>in</strong>g <strong>the</strong> technology. The<br />
developer is responsible for demonstrat<strong>in</strong>g <strong>the</strong><br />
technology at <strong>the</strong> selected site and is expected to pay<br />
any costs for transport, operation, and removal <strong>of</strong> <strong>the</strong>
equipment. The <strong>EPA</strong> is responsible for project plann<strong>in</strong>g,<br />
sampl<strong>in</strong>g and analysis, quality assurance and quality<br />
control, prepar<strong>in</strong>g reports, dissem<strong>in</strong>at<strong>in</strong>g <strong>in</strong>formation,<br />
and provides arrangements for transport<strong>in</strong>g and<br />
dispos<strong>in</strong>g <strong>of</strong> treated waste materials. Usually, results <strong>of</strong><br />
Demonstration Programs are published <strong>in</strong> three<br />
documents: <strong>the</strong> SITE Demonstration Bullet<strong>in</strong>, <strong>the</strong><br />
Technology Capsule, and <strong>the</strong> Innovative Technology<br />
Evaluation Report (ITER). The Bullet<strong>in</strong> describes <strong>the</strong><br />
technology and provides prelim<strong>in</strong>ary results <strong>of</strong> <strong>the</strong> field<br />
demonstration. The Technology Capsule provides more<br />
detailed <strong>in</strong>formation about <strong>the</strong> technology, and<br />
emphasizes key results <strong>of</strong> <strong>the</strong> SITE demonstration. The<br />
ITER provides detailed <strong>in</strong>formation on <strong>the</strong> technology<br />
<strong>in</strong>vestigated, a categorical cost estimate, and all<br />
pert<strong>in</strong>ent results <strong>of</strong> <strong>the</strong> SITE demonstration. An<br />
additional report, <strong>the</strong> Technology Evaluation Report<br />
(TER), is not formally published. The TER conta<strong>in</strong>s <strong>the</strong><br />
raw data collected dur<strong>in</strong>g <strong>the</strong> demonstration and<br />
provides a detailed quality assurance review <strong>of</strong> <strong>the</strong> data.<br />
For <strong>the</strong> treatability study us<strong>in</strong>g KEECO’s SME, E&C<br />
Williams’ Enthrall ®, and a generic phosphate technology,<br />
a SITE Capsule and ITER have been prepared; all for<br />
use by remedial managers <strong>in</strong> mak<strong>in</strong>g detailed<br />
evaluations <strong>of</strong> <strong>the</strong> technologies for applications to<br />
specific sites and wastes. A TER is also submitted for<br />
this demonstration to serve as verification<br />
documentation.<br />
1.4 Purpose <strong>of</strong> <strong>the</strong> Innovative<br />
Technology Evaluation Report (ITER)<br />
This ITER provides <strong>in</strong>formation on a treatability study<br />
performed us<strong>in</strong>g KEECO’s SME, E&C Williams’<br />
Enthrall ® , and a generic phosphate treatment. This<br />
report <strong>in</strong>cludes a comprehensive description <strong>of</strong> <strong>the</strong> study<br />
and its results. The ITER is <strong>in</strong>tended for use by <strong>EPA</strong><br />
remedial project managers (RPMs), <strong>EPA</strong> on-scene<br />
coord<strong>in</strong>ators (OSCs), contractors, and o<strong>the</strong>r decisionmakers<br />
carry<strong>in</strong>g out specific remedial actions. The ITER<br />
is designed to aid decision-makers <strong>in</strong> evaluat<strong>in</strong>g specific<br />
technologies for fur<strong>the</strong>r consideration as applicable<br />
options <strong>in</strong> a particular cleanup operation. This report<br />
represents a critical step <strong>in</strong> <strong>the</strong> development and<br />
commercialization <strong>of</strong> a treatment technology.<br />
To encourage <strong>the</strong> general use <strong>of</strong> demonstrated<br />
technologies, <strong>the</strong> <strong>EPA</strong> provides <strong>in</strong>formation regard<strong>in</strong>g<br />
<strong>the</strong> applicability <strong>of</strong> each technology to specific sites and<br />
1-5<br />
wastes. The ITER <strong>in</strong>cludes <strong>in</strong>formation on cost and<br />
desirable site-specific characteristics. It also discusses<br />
advantages, disadvantages, and limitations <strong>of</strong> <strong>the</strong><br />
technology.<br />
Each SITE demonstration evaluates <strong>the</strong> performance <strong>of</strong><br />
a technology <strong>in</strong> treat<strong>in</strong>g a specific waste matrix. The<br />
characteristics <strong>of</strong> o<strong>the</strong>r wastes and o<strong>the</strong>r sites may differ<br />
<strong>from</strong> <strong>the</strong> characteristics <strong>of</strong> <strong>the</strong> treated waste. Therefore,<br />
a successful demonstration <strong>of</strong> a technology at one site<br />
does not necessarily ensure that it will be applicable at<br />
o<strong>the</strong>r sites. Data <strong>from</strong> <strong>the</strong> demonstration may require<br />
extrapolation for estimat<strong>in</strong>g <strong>the</strong> operat<strong>in</strong>g ranges <strong>in</strong><br />
which <strong>the</strong> technology will perform satisfactorily. Only<br />
limited conclusions can be drawn <strong>from</strong> a s<strong>in</strong>gle field<br />
demonstration.<br />
1.5 Sources <strong>of</strong> Fur<strong>the</strong>r Information<br />
<strong>EPA</strong> Work Assignment Manager<br />
Ed Bates<br />
U.S. <strong>EPA</strong><br />
National Risk Management Research Laboratory<br />
(NRMRL)<br />
26 W. Mart<strong>in</strong> Lu<strong>the</strong>r K<strong>in</strong>g Dr.<br />
C<strong>in</strong>c<strong>in</strong>nati, OH 45268<br />
(513) 569-7774<br />
M<strong>in</strong>e <strong>Waste</strong> Technology Program<br />
Roger Wilmoth<br />
U.S. <strong>EPA</strong><br />
National Risk Management Research Laboratory<br />
(NRMRL)<br />
26 W. Mart<strong>in</strong> Lu<strong>the</strong>r K<strong>in</strong>g Dr.<br />
C<strong>in</strong>c<strong>in</strong>nati, OH 45268<br />
(513) 569-7509<br />
E & C Williams Project Manager<br />
Charlie Williams<br />
E & C Williams, Inc.<br />
120 Varnfield Dr, Ste. A<br />
Summerville, SC 29483<br />
(843) 821-4200<br />
KEECO Project manager<br />
Amy Anderson<br />
19023 36 th Ave. West, Ste. E<br />
Lynnwood, WA 98036<br />
(425) 778-7165
This section addresses <strong>the</strong> general applicability <strong>of</strong><br />
stabilization processes to sites conta<strong>in</strong><strong>in</strong>g mercury<br />
contam<strong>in</strong>ation, with specific <strong>in</strong>formation regard<strong>in</strong>g <strong>the</strong><br />
technologies evaluated <strong>in</strong> <strong>the</strong> SBMM treatability study<br />
where appropriate. S<strong>in</strong>ce <strong>the</strong> report is based on a<br />
treatability study ra<strong>the</strong>r than a field scale demonstration,<br />
<strong>the</strong>re is no actual treatment system to describe; however,<br />
<strong>the</strong> vendors were asked to conceive and provide cost<br />
estimates for a full scale application to two piles at <strong>the</strong><br />
SBMM site. Details on <strong>the</strong> selected piles can be found <strong>in</strong><br />
Section 3.2.<br />
<strong>Stabilization</strong> technologies <strong>in</strong>clude a broad range <strong>of</strong><br />
treatment options that are designed to immobilize<br />
contam<strong>in</strong>ants <strong>in</strong> <strong>the</strong> exist<strong>in</strong>g material, ra<strong>the</strong>r than reduc<strong>in</strong>g<br />
or remov<strong>in</strong>g <strong>the</strong>m. <strong>Stabilization</strong> processes depend on a<br />
chemical reaction between <strong>the</strong> reagent and <strong>the</strong><br />
contam<strong>in</strong>ant <strong>of</strong> concern to stabilize <strong>the</strong> contam<strong>in</strong>ant with<strong>in</strong><br />
<strong>the</strong> matrix. All <strong>of</strong> <strong>the</strong> technologies <strong>in</strong> this treatability study<br />
are stabilization methods, each comprised <strong>of</strong> a unique<br />
chemical system. The technologies <strong>in</strong> <strong>the</strong> study are also<br />
<strong>in</strong>novative <strong>in</strong> that a reduced volume <strong>of</strong> reagent is required<br />
as compared to traditional stabilization processes. This is<br />
beneficial <strong>in</strong> that it reduces <strong>the</strong> amount <strong>of</strong> material that<br />
must be handled and stored dur<strong>in</strong>g treatment, and<br />
generally produces treated material with a m<strong>in</strong>imal<br />
<strong>in</strong>crease <strong>in</strong> volume.<br />
Limited <strong>in</strong>formation on mercury stabilization is available;<br />
<strong>the</strong>refore, <strong>the</strong> analysis is based on <strong>the</strong> body <strong>of</strong> data that is<br />
available, and on <strong>the</strong> more widely available <strong>in</strong>formation on<br />
stabilization treatments for o<strong>the</strong>r heavy metals, as well as<br />
<strong>in</strong>formation provided by <strong>the</strong> technology vendors who<br />
participated <strong>in</strong> <strong>the</strong> treatability study.<br />
2.1 Key Features <strong>of</strong> <strong>the</strong> <strong>Stabilization</strong><br />
Process<br />
The primary components <strong>of</strong> a stabilization treatment<br />
system are <strong>the</strong> reagents and equipment used to mix it <strong>in</strong>to<br />
<strong>the</strong> treatment matrix. In addition to <strong>the</strong> treatment reagent,<br />
<strong>the</strong> matrix characteristics and depth <strong>of</strong> <strong>the</strong> material and <strong>the</strong><br />
application type (<strong>in</strong> situ or ex situ) would determ<strong>in</strong>e <strong>the</strong><br />
equipment requirements. Unless ground or surface water<br />
Section 2.0<br />
Technology Application Analysis<br />
2-1<br />
contam<strong>in</strong>ation is an immediate concern (e.g. very shallow<br />
water table beneath treatment zone), monitor<strong>in</strong>g can be as<br />
simple as augur<strong>in</strong>g samples <strong>from</strong> <strong>the</strong> treated pile after <strong>the</strong><br />
treatment has been performed <strong>in</strong> order to determ<strong>in</strong>e <strong>the</strong><br />
success <strong>of</strong> <strong>the</strong> treatment.<br />
The application design for ECWI’s ENTHRALL ® process<br />
would use a proprietary sonic drill<strong>in</strong>g rig subcontracted<br />
<strong>from</strong> Prosonic Drill<strong>in</strong>g Company, Inc (PDI) <strong>of</strong> Phoenix,<br />
Arizona. The reagent would be <strong>in</strong>jected directly <strong>in</strong>to <strong>the</strong><br />
pile at 15 foot <strong>in</strong>tervals, which should allow <strong>the</strong> reagent to<br />
thoroughly permeate <strong>the</strong> material.<br />
KEECO’s design calls for a modified ex-situ approach<br />
where<strong>in</strong> a mix<strong>in</strong>g facility would be constructed adjacent to<br />
each pile. The material would be hauled by dump trucks to<br />
<strong>the</strong> facility where it would be dumped onto a mix<strong>in</strong>g pad,<br />
reagent would be mixed <strong>in</strong> by a front end loader and <strong>the</strong><br />
material would be hauled back to <strong>the</strong> pile by dump truck<br />
and <strong>the</strong>n replaced and compressed <strong>in</strong> place. Each mix<strong>in</strong>g<br />
facility would be enclosed to prevent fugitive dust<br />
emissions.<br />
2.2 Operability <strong>of</strong> <strong>the</strong> Technology<br />
<strong>Stabilization</strong> processes are among <strong>the</strong> simplest <strong>of</strong><br />
remediation technologies, consist<strong>in</strong>g ma<strong>in</strong>ly <strong>of</strong> a chemical<br />
reagent and <strong>the</strong> mix<strong>in</strong>g/drill<strong>in</strong>g equipment required to apply<br />
it. The effectiveness <strong>of</strong> stabilization technologies is largely<br />
dependent on <strong>the</strong> degree <strong>of</strong> contact between <strong>the</strong> reagent<br />
and <strong>the</strong> contam<strong>in</strong>ated matrix. Thorough mix<strong>in</strong>g is desirable<br />
to ensure <strong>the</strong> maximum particle contact, though <strong>in</strong> <strong>in</strong> situ<br />
treatments, mix<strong>in</strong>g may not be practical and application <strong>of</strong><br />
<strong>the</strong> chemical would have to be accomplished by drill<strong>in</strong>g and<br />
<strong>in</strong>jection <strong>in</strong>to <strong>the</strong> material. In such cases, care would have<br />
to be taken <strong>in</strong> design<strong>in</strong>g <strong>the</strong> application to ensure complete<br />
contact between <strong>the</strong> reagent and <strong>the</strong> treated matrix.<br />
Exist<strong>in</strong>g environmental conditions are generally not a<br />
problem and may be <strong>in</strong>corporated <strong>in</strong>to <strong>the</strong> process (e.g.<br />
natural moisture content <strong>of</strong> <strong>the</strong> matrix). In most<br />
stabilization technologies, <strong>the</strong> chemical reaction takes<br />
place quickly, mak<strong>in</strong>g wea<strong>the</strong>r and temperature much less<br />
significant factors than <strong>in</strong> o<strong>the</strong>r methods with longer<br />
treatment times.
Ensur<strong>in</strong>g thorough contact with contam<strong>in</strong>ants <strong>in</strong> <strong>the</strong> matrix<br />
is easier <strong>in</strong> ex situ applications due to <strong>the</strong> ease <strong>of</strong> mix<strong>in</strong>g<br />
when material is moved to <strong>the</strong> treatment locale, which can<br />
consist <strong>of</strong> mov<strong>in</strong>g to a l<strong>in</strong>ed pad near <strong>the</strong> area <strong>of</strong><br />
contam<strong>in</strong>ation. In situ treatments are <strong>in</strong>herently more<br />
complicated, but develop<strong>in</strong>g technologies for this form <strong>of</strong><br />
application is desirable because <strong>of</strong> <strong>the</strong> reduced cost,<br />
reduced contact with contam<strong>in</strong>ants, and lowered risk <strong>of</strong><br />
spillage and air contam<strong>in</strong>ation dur<strong>in</strong>g transport <strong>of</strong> <strong>the</strong><br />
material to a treatment facility.<br />
The chemical reagents used <strong>in</strong> stabilization technologies<br />
are usually applied dry or are available <strong>in</strong> a concentrated<br />
form that can be mixed with water on site, thus m<strong>in</strong>imiz<strong>in</strong>g<br />
<strong>the</strong> amount <strong>of</strong> chemical that must be transported. For<br />
smaller applications, where equipment is likely to be used<br />
for only a few days, portable generators and mixers can be<br />
rented, reduc<strong>in</strong>g capital <strong>in</strong>vestments. At large treatment<br />
sites it may be more cost effective to purchase equipment;<br />
however, <strong>the</strong> treatments designed by <strong>the</strong> technology<br />
vendors for <strong>the</strong> Sulfur Bank <strong>Mercury</strong> M<strong>in</strong>e site use ei<strong>the</strong>r<br />
specialized equipment that would be subcontracted, or<br />
heavy equipment <strong>in</strong> such quantity that purchase would not<br />
be feasible. In addition to environmental remediation<br />
applications, stabilization treatment is also applicable to<br />
<strong>in</strong>dustrial waste products and to contam<strong>in</strong>ated waters, as<br />
discussed <strong>in</strong> detail <strong>in</strong> Section 2.3.<br />
2.3 Applicable <strong>Waste</strong>s<br />
As discussed <strong>in</strong> <strong>the</strong> previous section, stabilization<br />
technologies are applicable to solid matrices such as<br />
contam<strong>in</strong>ated soil or m<strong>in</strong>e wastes. <strong>Stabilization</strong> treatment<br />
is also applicable to <strong>in</strong>dustrial waste products that are still<br />
<strong>in</strong> <strong>the</strong> production system and to contam<strong>in</strong>ated waters,<br />
though this is more likely to be used <strong>in</strong> a conta<strong>in</strong>ed system,<br />
as opposed to a natural environment, because <strong>the</strong> result<strong>in</strong>g<br />
contam<strong>in</strong>ated sludge would have to be removed. S<strong>in</strong>ce <strong>the</strong><br />
process works by b<strong>in</strong>d<strong>in</strong>g an environmentally neutral<br />
element with contam<strong>in</strong>ants <strong>in</strong> <strong>the</strong> environment, <strong>the</strong>re are<br />
m<strong>in</strong>imal hazardous byproducts. The process is also<br />
applicable <strong>in</strong> situations where subsurface utilities limit or<br />
preclude <strong>the</strong> use <strong>of</strong> technologies requir<strong>in</strong>g excavation,<br />
though special care would have to be taken when drill<strong>in</strong>g<br />
was used <strong>in</strong> <strong>the</strong> product application.<br />
2.4 Availability and Transportability <strong>of</strong><br />
Equipment<br />
<strong>Stabilization</strong> technologies can be implemented anywhere<br />
<strong>the</strong> chemical can be delivered and a drill rig/mix<strong>in</strong>g<br />
equipment can be used. S<strong>in</strong>ce all-terra<strong>in</strong> drill rigs are<br />
available, most locations would be accessible. KEECO’s<br />
2-2<br />
silica technology would be applied by mix<strong>in</strong>g with front end<br />
loaders <strong>in</strong> a facility constructed on site for that purpose.<br />
Standard earth-mov<strong>in</strong>g, heavy equipment that is normally<br />
moved <strong>from</strong> site to site would be used. Application <strong>of</strong> <strong>the</strong><br />
ENTHRALL ® technology as used <strong>in</strong> <strong>the</strong> SBMM treatability<br />
study would require <strong>the</strong> use <strong>of</strong> a sonic drill rig. The rig is<br />
truck-mounted and easily transportable to <strong>the</strong> site.<br />
2.5 <strong>Material</strong>s Handl<strong>in</strong>g Requirements<br />
<strong>Material</strong>s handl<strong>in</strong>g for stabilization processes are generally<br />
limited to transport<strong>in</strong>g <strong>the</strong> reagent to <strong>the</strong> site, and mix<strong>in</strong>g<br />
and apply<strong>in</strong>g it to <strong>the</strong> contam<strong>in</strong>ated matrix. There should be<br />
no residuals or waste products that have to be removed<br />
<strong>from</strong> <strong>the</strong> site, o<strong>the</strong>r than a small quantity <strong>of</strong> personal<br />
protection equipment (PPE), which could be removed <strong>from</strong><br />
<strong>the</strong> site <strong>in</strong> a sealed drum, by a facility qualified to dispose<br />
<strong>of</strong> hazardous waste.<br />
For an application such as <strong>the</strong> piles at SBMM, where <strong>the</strong><br />
treatment matrix is unconsolidated rock, m<strong>in</strong>imal site<br />
preparation would be required. The size <strong>of</strong> <strong>the</strong> piles can be<br />
measured, with <strong>the</strong> depth <strong>of</strong> <strong>the</strong> piles be<strong>in</strong>g estimated <strong>from</strong><br />
pre-m<strong>in</strong><strong>in</strong>g topographic maps. Where dump<strong>in</strong>g records are<br />
not available, core samples may be taken to verify<br />
consistency <strong>of</strong> material <strong>in</strong> <strong>the</strong> piles, and some sampl<strong>in</strong>g<br />
should be done regardless <strong>of</strong> records to check for changes<br />
<strong>in</strong> <strong>the</strong> material s<strong>in</strong>ce it was deposited.<br />
Drill<strong>in</strong>g services are generally subcontracted to a company<br />
that has both <strong>the</strong> required equipment (drill rigs, augers,<br />
samplers) and personnel tra<strong>in</strong>ed <strong>in</strong> drill<strong>in</strong>g operation. If<br />
work is to be performed on a hazardous waste site, drill<strong>in</strong>g<br />
personnel must have <strong>the</strong> OSHA-required 40-hour health<br />
and safety tra<strong>in</strong><strong>in</strong>g. Process monitor<strong>in</strong>g would be required<br />
<strong>in</strong>itially to ensure that <strong>the</strong> reagent was mak<strong>in</strong>g full contact<br />
with <strong>the</strong> contam<strong>in</strong>ated matrix, and samples <strong>of</strong> posttreatment<br />
material would be collected at <strong>in</strong>tervals<br />
throughout <strong>the</strong> application to determ<strong>in</strong>e <strong>the</strong> success <strong>of</strong> <strong>the</strong><br />
technology, and any modifications that were required.<br />
ECWI would subcontract drill<strong>in</strong>g and <strong>in</strong>jection <strong>of</strong> <strong>the</strong><br />
reagent for <strong>the</strong> SBMM project. All personnel work<strong>in</strong>g on<br />
site would be required to complete safety tra<strong>in</strong><strong>in</strong>g. The<br />
SBMM treatment designed by ECWI calls for one weekly<br />
sample <strong>of</strong> treated material to be collected and analyzed for<br />
leachable mercury. This would ensure that sufficient<br />
reagent was be<strong>in</strong>g applied and that complete contact<br />
between reagent and contam<strong>in</strong>ated material was be<strong>in</strong>g<br />
achieved.<br />
KEECO’s design <strong>in</strong>cludes two mix<strong>in</strong>g facilities, each <strong>of</strong><br />
which would be operated two shifts per day. Their
sampl<strong>in</strong>g plan calls for one sample <strong>of</strong> treated material to be<br />
collected daily by each shift.<br />
2.6 Range <strong>of</strong> Suitable Site Characteristics<br />
<strong>Stabilization</strong> technologies can be applied at any site that is<br />
accessible to <strong>the</strong> drill<strong>in</strong>g and mix<strong>in</strong>g equipment. Electrical<br />
power and water would be required at most sites, but if<br />
necessary, a generator could provide electricity and water<br />
could be hauled <strong>in</strong>. Application <strong>of</strong> reagents would need to<br />
be done when temperatures were above freez<strong>in</strong>g to avoid<br />
<strong>the</strong> reagent solidify<strong>in</strong>g before full contact with <strong>the</strong> targeted<br />
contam<strong>in</strong>ant was made.<br />
2.7 Limitations <strong>of</strong> <strong>the</strong> Technology<br />
The ma<strong>in</strong> limitation <strong>of</strong> stabilization technologies is that<br />
while <strong>the</strong> process is easily applied to most solid wastes, <strong>the</strong><br />
success <strong>of</strong> <strong>the</strong> treatment depends on a very specific<br />
chemical reaction. To ensure complete stabilization, <strong>the</strong><br />
reagent must be mixed <strong>in</strong>to <strong>the</strong> soil thoroughly enough to<br />
ensure complete contact; <strong>the</strong>refore success is limited by<br />
mechanical access to materials. Very deep or relatively<br />
impermeable bodies <strong>of</strong> material would not be thoroughly<br />
treated without specialized equipment and application<br />
techniques, which could make <strong>in</strong> situ treatment difficult.<br />
The pH <strong>of</strong> <strong>the</strong> material be<strong>in</strong>g treated can limit <strong>the</strong><br />
effectiveness <strong>of</strong> <strong>the</strong> reagent, but this can <strong>of</strong>ten be remedied<br />
by add<strong>in</strong>g <strong>the</strong> appropriate buffer<strong>in</strong>g material to <strong>the</strong> reagent<br />
before it is applied.<br />
In a diverse waste body, such as <strong>the</strong> piles found at SBMM,<br />
<strong>the</strong> majority <strong>of</strong> <strong>the</strong> material be<strong>in</strong>g treated is not necessarily<br />
<strong>the</strong> same as <strong>the</strong> relatively small amount <strong>of</strong> material that<br />
was sampled prior to treatment application. Heterogeneous<br />
matrices may require extensive test<strong>in</strong>g to <strong>in</strong>sure that <strong>the</strong><br />
mode <strong>of</strong> treatment is applicable to <strong>the</strong> entire volume. If<br />
heterogeneity affects performance, than separate<br />
treatment scenarios may need to be developed for each<br />
component. This may impact cost and schedule.<br />
As with any technology, results <strong>in</strong> <strong>the</strong> field <strong>of</strong>ten differ <strong>from</strong><br />
lab scale results, so modifications to <strong>the</strong> process may be<br />
required dur<strong>in</strong>g application. <strong>Stabilization</strong> treatments are<br />
generally designed to be one-time applications, but due to<br />
<strong>the</strong> variability <strong>of</strong> <strong>the</strong> reaction and potential <strong>in</strong>terferences,<br />
additional applications may be <strong>in</strong>dicated.<br />
2-3<br />
2.8 Applicable or Relevant and<br />
Appropriate Requirements (ARARS)<br />
for <strong>Stabilization</strong> Processes<br />
The National Cont<strong>in</strong>gency Plan (NCP) <strong>of</strong> 1985, codified <strong>in</strong><br />
Title 40 Code <strong>of</strong> Federal Regulations (CFR) Part 300,<br />
del<strong>in</strong>eates <strong>the</strong> methods and criteria used to determ<strong>in</strong>e <strong>the</strong><br />
appropriate extent <strong>of</strong> removal and cleanup for hazardous<br />
waste contam<strong>in</strong>ation. The NCP required compliance with<br />
Federal applicable or relevant and appropriate<br />
requirements (ARARs) <strong>in</strong> order to make use <strong>of</strong> o<strong>the</strong>r<br />
programs’ or agencies’ standards. The Comprehensive<br />
Environmental Responsibility, Compensation and Liability<br />
Act (CERCLA), as amended by <strong>the</strong> Superfund<br />
Amendments and Reauthorization Act (SARA) <strong>of</strong> 1986<br />
codified and expanded <strong>the</strong> provisions.<br />
This subsection discusses specific federal ARARs that are<br />
pert<strong>in</strong>ent to <strong>the</strong> application <strong>of</strong> stabilization technologies,<br />
<strong>in</strong>clud<strong>in</strong>g <strong>the</strong> transport, treatment, storage, and disposal <strong>of</strong><br />
wastes and treatment residuals. State and local regulatory<br />
requirements, which may be more str<strong>in</strong>gent than those set<br />
by <strong>the</strong> federal agencies, must also be addressed by<br />
remedial managers. ARARs that apply to stabiliation<br />
remedial technologies have been promulgated <strong>in</strong> various<br />
regulatory acts, <strong>in</strong>clud<strong>in</strong>g: (1) <strong>the</strong> Comprehensive<br />
Environmental Response, Compensation, and Liability Act;<br />
(2) <strong>the</strong> Resource Conservation and Recovery Act; (3) <strong>the</strong><br />
Clean Air Act; (4) <strong>the</strong> Clean Water Act; (5) <strong>the</strong> Safe<br />
Dr<strong>in</strong>k<strong>in</strong>g Water Act, and (6) <strong>the</strong> Occupational Safety and<br />
Health Adm<strong>in</strong>istration regulations. These six regulatory<br />
acts are discussed below; with specific ARARs that may be<br />
applicable to <strong>the</strong> stabilization process be<strong>in</strong>g identified <strong>in</strong><br />
Table 2-1.<br />
2.8.1 Comprehensive Environmental Response,<br />
Compensation, and Liability Act (CERCLA)<br />
The CERCLA <strong>of</strong> 1980, as amended by SARA <strong>of</strong> 1986,<br />
provides for federal fund<strong>in</strong>g to respond to releases or<br />
potential releases <strong>of</strong> any hazardous substance <strong>in</strong>to <strong>the</strong><br />
environment, as well as to releases <strong>of</strong> pollutants or<br />
contam<strong>in</strong>ants that may present an imm<strong>in</strong>ent or significant<br />
danger to public health and welfare or to <strong>the</strong> environment.<br />
SARA states a strong statutory preference for remedies<br />
that are highly reliable and provide long-term protection. It<br />
directs <strong>EPA</strong> to do <strong>the</strong> follow<strong>in</strong>g:<br />
• use remedial alternatives that permanently and<br />
significantly reduce <strong>the</strong> volume, toxicity, or <strong>the</strong><br />
mobility <strong>of</strong> hazardous substances, pollutants, or<br />
contam<strong>in</strong>ants;
Table 2-1. Potential Federal and State ARARs for <strong>Stabilization</strong> Remediation Processes.<br />
Process Activity ARAR Description Basis Response<br />
<strong>Waste</strong> RCRA: 40 Standards that apply to Chemical and physical Chemical and physical<br />
Characterization <strong>of</strong><br />
Untreated <strong>Waste</strong><br />
CFR Part 261<br />
(or State<br />
equivalent)<br />
RCRA: 40<br />
CFR Part 264<br />
(or State<br />
equivalent)<br />
<strong>Waste</strong><br />
Process<strong>in</strong>g CAA: 40 CFR<br />
Part 50<br />
(or State<br />
equivalent)<br />
Determ<strong>in</strong>ation <strong>of</strong><br />
Cleanup<br />
Standards<br />
<strong>Waste</strong> Disposal<br />
Worker Safety<br />
identification and<br />
characterization <strong>of</strong><br />
wastes.<br />
Standards apply to<br />
treatment <strong>of</strong> wastes <strong>in</strong> a<br />
treatment facility.<br />
Regulations govern toxic<br />
pollutants, visible<br />
emissions and<br />
particulates.<br />
properties <strong>of</strong> waste<br />
determ<strong>in</strong>e <strong>the</strong> suitability<br />
<strong>of</strong> treatment by a<br />
stabilization/solidification<br />
process.<br />
Applicable to stabilization<br />
processes only when<br />
applied <strong>in</strong> a waste<br />
treatment facility.<br />
Mix<strong>in</strong>g reagent <strong>in</strong>to soil<br />
could create particulate<br />
dust <strong>in</strong> <strong>the</strong> air.<br />
analyses must be<br />
performed to determ<strong>in</strong>e if<br />
waste is a hazardous<br />
waste.<br />
Compliance with<br />
requirements for<br />
operations, record keep<strong>in</strong>g,<br />
and cont<strong>in</strong>gency plann<strong>in</strong>g.<br />
Where materials be<strong>in</strong>g<br />
treated cause dust<br />
particulate, surface should<br />
be wetted, or dust<br />
conta<strong>in</strong>ment facilities<br />
<strong>in</strong>stalled.<br />
SARA: Standards that apply to Applicable to stabilization Application must be<br />
Section<br />
121(d)(2)(ii);<br />
SDWA: 40<br />
CFR Part 141<br />
RCRA: 40<br />
CFR Part 262<br />
surface & groundwater<br />
sources that may be used<br />
as dr<strong>in</strong>k<strong>in</strong>g water.<br />
Standards that perta<strong>in</strong> to<br />
generators <strong>of</strong> hazardous<br />
waste.<br />
processes only when<br />
run<strong>of</strong>f or seepage <strong>of</strong><br />
solutions <strong>from</strong> treatment<br />
may contact surface and<br />
groundwaters.<br />
Generated hazardous<br />
wastes would, <strong>in</strong> most<br />
cases, be limited to PPE,<br />
o<strong>the</strong>r contam<strong>in</strong>ated<br />
supplies and possibly<br />
washwater.<br />
OSHA: 29 Worker health and safety CERCLA remedial<br />
CFR Parts standards<br />
actions and RCRA<br />
1900-1926;<br />
corrective actions must<br />
or State<br />
follow requirements for<br />
equivalent <strong>the</strong> health and safety <strong>of</strong><br />
on-site workers.<br />
2-4<br />
designed to ensure no<br />
significant amounts <strong>of</strong><br />
run<strong>of</strong>f or seepage <strong>in</strong>to<br />
groundwater.<br />
Generators must dispose <strong>of</strong><br />
wastes at facilities that are<br />
permitted to handle <strong>the</strong><br />
waste. Generators must<br />
obta<strong>in</strong> an <strong>EPA</strong> ID number<br />
prior to waste disposal.<br />
Workers must have up to<br />
date tra<strong>in</strong><strong>in</strong>g and medical<br />
monitor<strong>in</strong>g; use <strong>of</strong><br />
appropriate protective<br />
equipment is required.
• select remedial actions that protect human health<br />
and <strong>the</strong> environment, are cost-effective, and<br />
<strong>in</strong>volve permanent solutions and alternative<br />
treatment or resource recovery technologies to <strong>the</strong><br />
maximum extent possible; and<br />
• avoid <strong>of</strong>f-site transport and disposal <strong>of</strong> untreated<br />
hazardous substances or contam<strong>in</strong>ated materials<br />
when practicable treatment technologies exist<br />
[Section 121(b)].<br />
In general, two types <strong>of</strong> responses are possible under<br />
CERCLA: removal and remedial actions. Superfund<br />
removal actions are conducted <strong>in</strong> response to an<br />
immediate threat caused by a release <strong>of</strong> a hazardous<br />
substance. Remedial actions are governed by <strong>the</strong> SARA<br />
amendments to CERCLA. As stated above, <strong>the</strong>se<br />
amendments promote remedies that permanently reduce<br />
<strong>the</strong> volume, toxicity, and mobility <strong>of</strong> hazardous substances<br />
or pollutants.<br />
<strong>Stabilization</strong> technologies qualify for use <strong>in</strong> CERCLA<br />
remedial actions as <strong>the</strong> process may permanently reduce<br />
<strong>the</strong> mobility <strong>of</strong> <strong>the</strong> contam<strong>in</strong>ants <strong>of</strong> concern. Most<br />
stabilization processes also reduce toxicity <strong>in</strong> <strong>the</strong> treated<br />
matrix by b<strong>in</strong>d<strong>in</strong>g contam<strong>in</strong>ants <strong>in</strong> a neutral compound.<br />
On-site remedial actions must comply with federal and<br />
state ARARs, which are determ<strong>in</strong>ed on a site-by-site basis.<br />
These regulations may be waived under six conditions: (1)<br />
<strong>the</strong> action is an <strong>in</strong>terim measure, and <strong>the</strong> ARAR will be met<br />
at completion; (2) compliance with <strong>the</strong> ARAR would pose a<br />
greater risk to health and <strong>the</strong> environment than<br />
noncompliance; (3) it is technically impracticable to meet<br />
<strong>the</strong> ARAR; (4) <strong>the</strong> standard <strong>of</strong> performance <strong>of</strong> an ARAR<br />
can be met by an equivalent method; (5) a state ARAR has<br />
not been consistently applied elsewhere; and (6) meet<strong>in</strong>g<br />
<strong>the</strong> standard for that particular ARAR, with respect to <strong>the</strong><br />
degree <strong>of</strong> protection or reduction <strong>of</strong> risk afforded by it,<br />
would <strong>in</strong>cur such costs that standard and remedial actions<br />
at o<strong>the</strong>r sites would be jeopardized. These waiver options<br />
apply only to on-site actions, and justification for <strong>the</strong> waiver<br />
must be clearly demonstrated.<br />
2.8.2 Resource Conservation and Recovery Act<br />
(RCRA)<br />
RCRA, an amendment to <strong>the</strong> Solid <strong>Waste</strong> Disposal Act<br />
(SWDA), was passed <strong>in</strong> 1976 to provide a framework for<br />
achiev<strong>in</strong>g environmentally sound management <strong>of</strong> both<br />
hazardous and nonhazardous wastes. Subtitle C <strong>of</strong> RCRA<br />
regulates <strong>the</strong> generation and handl<strong>in</strong>g <strong>of</strong> hazardous waste,<br />
with most <strong>of</strong> <strong>the</strong> regulations also be<strong>in</strong>g applicable to<br />
CERCLA activities. The Hazardous and Solid <strong>Waste</strong><br />
2-5<br />
Amendments (HSWA) <strong>of</strong> 1984 greatly expanded <strong>the</strong> scope<br />
and requirements <strong>of</strong> RCRA.<br />
RCRA def<strong>in</strong>es two types <strong>of</strong> hazardous wastes:<br />
characteristic and listed. Criteria for identify<strong>in</strong>g<br />
characteristic hazardous wastes, given <strong>in</strong> 40 CFR Part 261<br />
Subpart C, are: ignitability, corrosivity, reactivity, and<br />
toxicity. 40 CFR Part 261 Subpart D provides a list <strong>of</strong><br />
wastes <strong>from</strong> specific and nonspecific <strong>in</strong>dustrial sources,<br />
which comprise <strong>the</strong> “listed” wastes. RCRA regulations do<br />
not apply to sites where RCRA-def<strong>in</strong>ed wastes are not<br />
present.<br />
RCRA regulations def<strong>in</strong>e hazardous wastes and regulate<br />
<strong>the</strong>ir transport, treatment, storage, and disposal. These<br />
regulations are only applicable to stabilization processes if<br />
RCRA def<strong>in</strong>ed hazardous wastes are present.<br />
In a typical stabilization application, hazardous wastes<br />
would be limited to <strong>the</strong> material be<strong>in</strong>g treated, and a small<br />
amount <strong>of</strong> personal protective equipment (PPE) that may<br />
have become contam<strong>in</strong>ated dur<strong>in</strong>g treatment. If wastes<br />
were determ<strong>in</strong>ed to be hazardous accord<strong>in</strong>g to RCRA,<br />
essentially all RCRA requirements regard<strong>in</strong>g <strong>the</strong><br />
management and disposal <strong>of</strong> this hazardous waste would<br />
have to be addressed by <strong>the</strong> remedial managers.<br />
In order to legally generate any hazardous waste, <strong>the</strong><br />
responsible party must obta<strong>in</strong> an <strong>EPA</strong> identification<br />
number. O<strong>the</strong>r applicable RCRA requirements may<br />
<strong>in</strong>clude a Uniform Hazardous <strong>Waste</strong> Manifest (if <strong>the</strong> waste<br />
is transported <strong>of</strong>f-site), restrictions on plac<strong>in</strong>g <strong>the</strong> waste <strong>in</strong><br />
land disposal units, time limits on accumulat<strong>in</strong>g waste, and<br />
permits for stor<strong>in</strong>g <strong>the</strong> waste.<br />
Requirements for corrective action at RCRA-regulated<br />
facilities are provided <strong>in</strong> 40 CFR Part 264, Subpart F and<br />
Subpart S. These subparts also generally apply to<br />
remediation at Superfund sites. Subparts F and S <strong>in</strong>clude<br />
requirements for <strong>in</strong>itiat<strong>in</strong>g and conduct<strong>in</strong>g RCRA corrective<br />
action, remediat<strong>in</strong>g groundwater, and ensur<strong>in</strong>g that<br />
corrective actions comply with o<strong>the</strong>r environmental<br />
regulations. Subpart S also details conditions under which<br />
particular RCRA requirements may be waived for<br />
temporary treatment units operat<strong>in</strong>g at corrective action<br />
sites and provides <strong>in</strong>formation regard<strong>in</strong>g requirements for<br />
modify<strong>in</strong>g permits to adequately describe <strong>the</strong> subject<br />
treatment unit.<br />
2.8.3 Clean Air Act (CAA)<br />
The CAA establishes national primary and secondary<br />
ambient air quality standards for sulfur oxides, particulate<br />
matter, carbon monoxide, ozone, nitrogen dioxide, and
lead. It also limits <strong>the</strong> emission <strong>of</strong> 189 listed hazardous<br />
pollutants such as v<strong>in</strong>yl chloride, arsenic, asbestos and<br />
benzene. States are responsible for enforc<strong>in</strong>g <strong>the</strong> CAA.<br />
To assist <strong>in</strong> this, Air Quality Control Regions (AQCR) were<br />
established. Allowable emission limits are determ<strong>in</strong>ed by<br />
<strong>the</strong> AQCR, or its sub-unit, <strong>the</strong> Air Quality Management<br />
District (AQMD). These emission limits are based on<br />
whe<strong>the</strong>r or not <strong>the</strong> region is currently with<strong>in</strong> atta<strong>in</strong>ment for<br />
National Ambient Air Quality Standards (NAAQS).<br />
The CAA requires that treatment, storage, and disposal<br />
facilities comply with primary and secondary ambient air<br />
quality standards. Provided that <strong>the</strong> stabilization reagents<br />
are mixed <strong>in</strong>to <strong>the</strong> soil matrix without generat<strong>in</strong>g excessive<br />
dust, <strong>the</strong>re should be no clean air issues associated with<br />
<strong>the</strong> process.<br />
2.8.4 Clean Water Act (CWA)<br />
The objective <strong>of</strong> <strong>the</strong> Clean Water Act is to restore and<br />
ma<strong>in</strong>ta<strong>in</strong> <strong>the</strong> chemical, physical and biological <strong>in</strong>tegrity <strong>of</strong><br />
<strong>the</strong> nation's waters by establish<strong>in</strong>g federal, state, and local<br />
discharge standards. If treated water is discharged to<br />
surface water bodies or Publicly Owned Treatment Works<br />
(POTWs), CWA regulations will apply. A facility desir<strong>in</strong>g to<br />
discharge water to a navigable waterway must apply for a<br />
permit under <strong>the</strong> National Pollutant Discharge Elim<strong>in</strong>ation<br />
System (NPDES). When a NPDES permit is issued, it<br />
<strong>in</strong>cludes waste discharge requirements. Discharges to<br />
POTWs also must comply with general pretreatment<br />
regulations outl<strong>in</strong>ed <strong>in</strong> 40 CFR Part 403, as well as o<strong>the</strong>r<br />
applicable state and local adm<strong>in</strong>istrative and substantive<br />
requirements. <strong>Stabilization</strong> technology applications <strong>in</strong>volve<br />
m<strong>in</strong>imal amounts <strong>of</strong> water, and should produce no excess<br />
solution; <strong>the</strong>refore, CWA criteria would not generally apply.<br />
2.8.5 Safe Dr<strong>in</strong>k<strong>in</strong>g Water Act (SDWA)<br />
The SDWA <strong>of</strong> 1974, as most recently amended by <strong>the</strong> Safe<br />
Dr<strong>in</strong>k<strong>in</strong>g Water Amendments <strong>of</strong> 1986, requires <strong>the</strong> <strong>EPA</strong> to<br />
establish regulations to protect human health <strong>from</strong><br />
contam<strong>in</strong>ants <strong>in</strong> dr<strong>in</strong>k<strong>in</strong>g water. The legislation authorized<br />
national dr<strong>in</strong>k<strong>in</strong>g water standards and a jo<strong>in</strong>t federal-state<br />
system for ensur<strong>in</strong>g compliance with <strong>the</strong>se standards. The<br />
National Primary Dr<strong>in</strong>k<strong>in</strong>g Water Standards (NPDWS) are<br />
found <strong>in</strong> 40 CFR Parts 141 through 149. There should be<br />
m<strong>in</strong>imal effluent <strong>from</strong> <strong>the</strong> treated material dur<strong>in</strong>g a<br />
stabilization process, so safe dr<strong>in</strong>k<strong>in</strong>g water regulations<br />
would only apply where any effluent, if produced, could<br />
impact surface or groundwater dr<strong>in</strong>k<strong>in</strong>g water sources.<br />
2-6<br />
2.8.6 Occupational Safety and Health Adm<strong>in</strong>istration<br />
(OSHA) Requirements<br />
CERCLA remedial actions and RCRA corrective actions<br />
must be performed <strong>in</strong> accordance with <strong>the</strong> OSHA<br />
requirements detailed <strong>in</strong> 20 CFR Parts 1900 through 1926,<br />
especially Part 1910.120, which provides for <strong>the</strong> health and<br />
safety <strong>of</strong> workers at hazardous waste sites. On-site<br />
construction activities at Superfund or RCRA corrective<br />
action sites must be performed <strong>in</strong> accordance with Part<br />
1926 <strong>of</strong> OSHA, which describes safety and health<br />
regulations for construction sites. State OSHA<br />
requirements, which may be significantly stricter than<br />
federal standards, must also be met.<br />
All personnel who are work<strong>in</strong>g at a hazardous waste site<br />
are required to have completed an OSHA tra<strong>in</strong><strong>in</strong>g course<br />
and must be familiar with all OSHA requirements relevant<br />
to hazardous waste sites. Workers at hazardous waste<br />
sites must also be enrolled <strong>in</strong> a medical monitor<strong>in</strong>g<br />
program. An acceptable program must <strong>in</strong>clude: (1) a<br />
health history, (2) an <strong>in</strong>itial exam before hazardous waste<br />
work starts to establish fitness for duty and as a medical<br />
basel<strong>in</strong>e, (3) periodic exam<strong>in</strong>ations (usually performed<br />
annually) to determ<strong>in</strong>e whe<strong>the</strong>r changes due to exposure<br />
may have occurred and to ensure cont<strong>in</strong>ued fitness for <strong>the</strong><br />
job, (4) appropriate medical exam<strong>in</strong>ations after a suspected<br />
or known overexposure, and (5) an exam<strong>in</strong>ation at<br />
term<strong>in</strong>ation.<br />
For most sites, m<strong>in</strong>imum PPE for workers will <strong>in</strong>clude<br />
gloves, hard hats, steel-toed boots, and Tyvek7 coveralls.<br />
Depend<strong>in</strong>g on contam<strong>in</strong>ant types and concentrations,<br />
additional PPE may be required, <strong>in</strong>clud<strong>in</strong>g <strong>the</strong> use <strong>of</strong> air<br />
purify<strong>in</strong>g respirators or supplied air. At <strong>the</strong> sites where<br />
stabilization treatments will be applied, <strong>the</strong> m<strong>in</strong>imal list <strong>of</strong><br />
PPE will usually be sufficient. Noise levels are not<br />
expected to be high, except dur<strong>in</strong>g <strong>the</strong> operation <strong>of</strong> mix<strong>in</strong>g<br />
and drill<strong>in</strong>g equipment. Dur<strong>in</strong>g <strong>the</strong>se activities, noise levels<br />
should be monitored to ensure that workers are not<br />
exposed to noise levels above a time-weighted average <strong>of</strong><br />
85 decibels over an eight-hour day. If noise levels were to<br />
exceed this limit, <strong>the</strong>n workers would be required to wear<br />
hear<strong>in</strong>g protection, however, hear<strong>in</strong>g protection should be<br />
available for any level <strong>of</strong> discomfort <strong>from</strong> noise. The levels<br />
<strong>of</strong> noise anticipated are not expected to adversely affect<br />
<strong>the</strong> community, but this will depend on proximity to <strong>the</strong><br />
treatment site.
3.1 Introduction<br />
The purpose <strong>of</strong> this economic analysis is to estimate<br />
costs (not <strong>in</strong>clud<strong>in</strong>g pr<strong>of</strong>its) for commercial treatment <strong>of</strong><br />
mercury-contam<strong>in</strong>ated material at <strong>the</strong> Sulfur Bank<br />
<strong>Mercury</strong> M<strong>in</strong>e <strong>in</strong> Nor<strong>the</strong>rn California us<strong>in</strong>g <strong>the</strong> Enthrall ®<br />
and SME technologies that were demonstrated <strong>in</strong> <strong>the</strong><br />
treatability study. S<strong>in</strong>ce a field-scale demonstration has<br />
not been performed, best efforts to reasonably estimate<br />
costs have been based on past experience <strong>of</strong> <strong>the</strong><br />
vendors and reasonable eng<strong>in</strong>eer<strong>in</strong>g assumptions. The<br />
cost figures provided <strong>in</strong> this economic analysis are<br />
considered “order-<strong>of</strong>-magnitude” estimates, and may<br />
significantly change if field test<strong>in</strong>g is performed.<br />
The technology vendors were asked to provide cost<br />
estimates based on twelve categories <strong>of</strong> costs that are<br />
associated with typical cleanup activities at Superfund<br />
sites. Where <strong>the</strong> vendor did not supply costs, an<br />
estimate has been <strong>in</strong>cluded based on past SITE<br />
program experience, or generic treatment costs. The<br />
phosphate treatment was applied <strong>in</strong> <strong>the</strong> treatability study<br />
as a generic treatment, and based on <strong>the</strong> results, fur<strong>the</strong>r<br />
experimentation and product modification would have to<br />
be performed before <strong>the</strong> reagent would be considered<br />
for use at <strong>the</strong> SBMM site; <strong>the</strong>refore, vendor costs for a<br />
full scale treatment us<strong>in</strong>g phosphate were not <strong>in</strong>cluded<br />
<strong>in</strong> <strong>the</strong> estimates.<br />
3.2 Cost Estimate Scope<br />
The technology vendors were asked to provide cost<br />
estimates for treatment <strong>of</strong> two piles at <strong>the</strong> site, <strong>the</strong> North<br />
<strong>Waste</strong> Pile and <strong>the</strong> <strong>Waste</strong> Rock Dam. For purposes <strong>of</strong><br />
<strong>the</strong> cost estimate, <strong>the</strong> mercury content <strong>in</strong> <strong>the</strong> piles was<br />
assumed to be <strong>the</strong> same as that <strong>in</strong> <strong>the</strong> mercury ore used<br />
<strong>in</strong> <strong>the</strong> treatability study.<br />
The vendors were asked to estimate costs based on <strong>the</strong><br />
follow<strong>in</strong>g dimensions:<br />
North <strong>Waste</strong> Pile:<br />
Surface area = 894,000 square feet<br />
Volume = 877,000 cubic yards<br />
Section 3<br />
Economic Analysis<br />
3-1<br />
Estimated maximum depth = 75 feet<br />
Calculated average depth = 26.5 feet<br />
<strong>Waste</strong> Rock Dam:<br />
Surface area = 1,034,000 square feet<br />
Volume = 556,000 cubic yards<br />
Estimated maximum depth = 70 feet<br />
Calculated average depth = 14.5 feet<br />
The costs associated with typical cleanup activities at<br />
Superfund sites have been broken down <strong>in</strong>to 12<br />
categories:<br />
(1) Site Preparation<br />
(2) Permitt<strong>in</strong>g and Regulatory Activities<br />
(3) Capital Equipment<br />
(4) Start-up and Fixed<br />
(5) Labor<br />
(6) Consumables and Supplies<br />
(7) Utilities<br />
(8) Effluent Treatment and Disposal<br />
(9) Residuals Shipp<strong>in</strong>g & Disposal<br />
(10) Analytical Services<br />
(11) Ma<strong>in</strong>tenance and Modifications<br />
(12) Demobilization/Site Restoration<br />
The technology vendors were asked to estimate costs<br />
for treat<strong>in</strong>g <strong>the</strong> specified piles based on <strong>the</strong> above<br />
categories.<br />
3.3 Factors Affect<strong>in</strong>g Estimated Cost<br />
S<strong>in</strong>ce <strong>the</strong> technologies have only been applied to SBMM<br />
materials <strong>in</strong> <strong>the</strong> small scale <strong>of</strong> <strong>the</strong> treatability study,<br />
ra<strong>the</strong>r than a field scale demonstration, it is understood<br />
that <strong>the</strong> costs presented here are estimates only, based<br />
on past experience <strong>of</strong> <strong>the</strong> vendors and eng<strong>in</strong>eer<strong>in</strong>g<br />
assumptions as specified <strong>in</strong> <strong>the</strong> follow<strong>in</strong>g descriptions.<br />
There are a number <strong>of</strong> factors that could affect <strong>the</strong><br />
actual cost <strong>of</strong> treatment <strong>of</strong> mercury-contam<strong>in</strong>ated<br />
material us<strong>in</strong>g stabilization technologies. Cost estimates<br />
<strong>in</strong> this report have been provided by <strong>the</strong> vendors based<br />
on <strong>the</strong> assumption that <strong>the</strong> mercury and o<strong>the</strong>r metals<br />
content is <strong>the</strong> same as that <strong>in</strong> <strong>the</strong> material that was
treated <strong>in</strong> <strong>the</strong> treatability study. A larger sampl<strong>in</strong>g <strong>of</strong> <strong>the</strong><br />
material <strong>in</strong> <strong>the</strong> piles would be required prior to an actual<br />
application and <strong>the</strong> results could <strong>in</strong>dicate significantly<br />
different concentrations. Analytical evaluation <strong>of</strong> <strong>the</strong><br />
actual materials to be treated may also <strong>in</strong>dicate that<br />
modifications to <strong>the</strong> reagents are necessary, which could<br />
impact costs. The characteristics <strong>of</strong> <strong>the</strong> material may<br />
also be a factor. Estimates are based on “typical<br />
material” characteristics; however, <strong>the</strong> actual material<br />
may require special handl<strong>in</strong>g depend<strong>in</strong>g on particle size,<br />
stability and compaction. Should <strong>the</strong> <strong>in</strong>itial sampl<strong>in</strong>g<br />
results vary widely, additional sampl<strong>in</strong>g po<strong>in</strong>ts would be<br />
required <strong>in</strong> order to ensure that <strong>the</strong> proper reagents and<br />
ratios were applied.<br />
3.4 Issues and Assumptions<br />
This section summarizes <strong>the</strong> major issues and<br />
assumptions used <strong>in</strong> estimat<strong>in</strong>g <strong>the</strong> cost <strong>of</strong> implement<strong>in</strong>g<br />
<strong>the</strong> Enthrall ® and SME technologies at full-scale. The<br />
vendors were given <strong>the</strong> dimensions <strong>of</strong> <strong>the</strong> piles and told<br />
that <strong>the</strong> material would be assumed to match <strong>the</strong><br />
mercury ore material. Additional assumptions were<br />
specified by ECWI and KEECO <strong>in</strong> present<strong>in</strong>g <strong>the</strong>ir costs.<br />
3.4.1 Site Characteristics<br />
The Sulfur Bank <strong>Mercury</strong> M<strong>in</strong>e is comprised <strong>of</strong> two pits<br />
and extensive piles composed <strong>of</strong> various materials.<br />
Cost estimates have been prepared for two exist<strong>in</strong>g piles<br />
at <strong>the</strong> site, but characteristics <strong>of</strong> <strong>the</strong> material <strong>in</strong> <strong>the</strong> piles<br />
were assumed to be <strong>the</strong> same as that <strong>in</strong> <strong>the</strong> mercury ore<br />
<strong>from</strong> <strong>the</strong> treatability study. The maximum depth at any<br />
po<strong>in</strong>t <strong>in</strong> <strong>the</strong> pile has been estimated based on pre-m<strong>in</strong><strong>in</strong>g<br />
maps. S<strong>in</strong>ce <strong>the</strong> volume <strong>of</strong> both piles was estimated<br />
<strong>from</strong> maps, <strong>the</strong> actual volume could differ due to map<br />
scal<strong>in</strong>g or errors, and changes <strong>in</strong> <strong>the</strong> heap topography<br />
over time.<br />
For purposes <strong>of</strong> cost estimation, characteristics for a<br />
typical site material were assumed. These <strong>in</strong>cluded <strong>the</strong><br />
assumptions that <strong>the</strong> material is unconsolidated, with<br />
sizes rang<strong>in</strong>g <strong>from</strong> f<strong>in</strong>es to large gravels and that <strong>the</strong><br />
rock can be completely treated by <strong>the</strong> methods<br />
described <strong>in</strong> <strong>the</strong> follow<strong>in</strong>g vendor sections.<br />
3.4.2 Design and Performance Factors<br />
ECWI and KEECO each designed <strong>the</strong> application<br />
technique for <strong>the</strong>ir respective reagents. These<br />
processes are described <strong>in</strong> later sections with details <strong>of</strong><br />
each vendor’s cost estimates. Both processes <strong>in</strong>clude<br />
monitor<strong>in</strong>g or pilot test<strong>in</strong>g to verify complete contact<br />
between <strong>the</strong> reagent and <strong>the</strong> contam<strong>in</strong>ated material <strong>in</strong><br />
3-2<br />
order to optimize treatment performance. The products<br />
used <strong>in</strong> <strong>the</strong> treatability study are all designed to be a<br />
one-time application.<br />
3.4.3 F<strong>in</strong>ancial Assumptions<br />
All costs are presented <strong>in</strong> 2001 U.S. dollars without<br />
account<strong>in</strong>g for <strong>in</strong>terest rates, <strong>in</strong>flation or <strong>the</strong> time value <strong>of</strong><br />
money. Insurance and taxes are assumed to be fixed<br />
costs lumped <strong>in</strong>to <strong>the</strong> Startup and Fixed Costs category<br />
(see subsection 3.5.4).<br />
3.5 Basis for Economic Analysis<br />
In this section, each <strong>of</strong> <strong>the</strong> 12 cost categories that reflect<br />
typical clean-up activities encountered at Superfund<br />
sites, will be def<strong>in</strong>ed and discussed. These 12 cost<br />
categories form <strong>the</strong> basis for <strong>the</strong> estimated costs<br />
submitted by <strong>the</strong> vendors and presented <strong>in</strong> sections<br />
3.6.1 and 3.6.2.<br />
3.5.1 Site Preparation<br />
S<strong>in</strong>ce <strong>the</strong> material be<strong>in</strong>g treated is already <strong>in</strong> piles and<br />
will be treated on site, <strong>the</strong> site preparation for<br />
implement<strong>in</strong>g <strong>the</strong> stabilization technologies would be<br />
limited to br<strong>in</strong>g<strong>in</strong>g <strong>the</strong> necessary equipment for<br />
application and monitor<strong>in</strong>g to <strong>the</strong> site, and construct<strong>in</strong>g<br />
usage and storage facilities. Storage facilities for<br />
chemicals and fuels would have to comply with<br />
environmental regulations govern<strong>in</strong>g <strong>the</strong> site. The<br />
SBMM site is already fenced so no additional security<br />
costs should be <strong>in</strong>curred.<br />
3.5.2 Permitt<strong>in</strong>g and Regulatory Requirements<br />
Several types <strong>of</strong> permits may be required for<br />
implement<strong>in</strong>g a full-scale remediation. The types <strong>of</strong><br />
permits required will be dependent on <strong>the</strong> type and<br />
concentration <strong>of</strong> <strong>the</strong> contam<strong>in</strong>ation, <strong>the</strong> regulations<br />
cover<strong>in</strong>g <strong>the</strong> specific location, and <strong>the</strong> site’s proximity to<br />
residential neighborhoods. Extensive studies have<br />
previously been conducted on contam<strong>in</strong>ation <strong>in</strong> Clear<br />
Lake, so pretreatment site characterization should also<br />
be m<strong>in</strong>imal for permitt<strong>in</strong>g purposes.<br />
If site characterization were required for permitt<strong>in</strong>g, <strong>the</strong><br />
non-analytical costs <strong>in</strong>curred for receiv<strong>in</strong>g approval <strong>from</strong><br />
<strong>the</strong> regulatory agency to <strong>in</strong>stall <strong>the</strong> treatment system<br />
would be <strong>in</strong>cluded under <strong>the</strong> Permitt<strong>in</strong>g and Regulatory<br />
Activities category. These costs would <strong>in</strong>clude <strong>the</strong><br />
preparation <strong>of</strong> site characterization reports that establish<br />
a basel<strong>in</strong>e for <strong>the</strong> site contam<strong>in</strong>ation, <strong>the</strong> design
feasibility study for <strong>the</strong> pilot system, and meet<strong>in</strong>gs with<br />
regulators for discuss<strong>in</strong>g comments and supply<strong>in</strong>g<br />
related documentation for acquir<strong>in</strong>g approval for<br />
<strong>in</strong>stall<strong>in</strong>g and implement<strong>in</strong>g <strong>the</strong> treatment.<br />
Depend<strong>in</strong>g upon <strong>the</strong> classification <strong>of</strong> a site, certa<strong>in</strong><br />
RCRA requirements may have to be satisfied as<br />
discussed <strong>in</strong> section two <strong>of</strong> this report. S<strong>in</strong>ce <strong>the</strong> SBMM<br />
site is an active Superfund site, it is possible that <strong>the</strong><br />
technology could be implemented under <strong>the</strong> umbrella <strong>of</strong><br />
exist<strong>in</strong>g permits and plans. Certa<strong>in</strong> regions or states<br />
have more rigorous environmental policies that may<br />
result <strong>in</strong> higher costs for permits and verification <strong>of</strong><br />
cleanup. Added costs may result <strong>from</strong> <strong>in</strong>vestigat<strong>in</strong>g all<br />
<strong>of</strong> <strong>the</strong> regulations and policies relat<strong>in</strong>g to <strong>the</strong> location <strong>of</strong><br />
<strong>the</strong> site, and for conduct<strong>in</strong>g a historical background<br />
check for fully understand<strong>in</strong>g <strong>the</strong> scope <strong>of</strong> <strong>the</strong><br />
contam<strong>in</strong>ation.<br />
3.5.3 Capital Equipment<br />
Capital equipment <strong>in</strong>cludes all equipment for <strong>the</strong><br />
treatment process, whe<strong>the</strong>r it is purchased or rented.<br />
Different specialized equipment is required for each <strong>of</strong><br />
<strong>the</strong> technologies as specified <strong>in</strong> <strong>the</strong> follow<strong>in</strong>g vendor’s<br />
cost estimates. For this particular project, all equipment<br />
costs were based on rental or subcontract<strong>in</strong>g rates<br />
ra<strong>the</strong>r than purchases.<br />
3.5.4 Startup and Fixed Costs<br />
Startup and Fixed costs can <strong>in</strong>clude such variables as<br />
<strong>in</strong>surance, taxes, <strong>in</strong>itiation <strong>of</strong> monitor<strong>in</strong>g programs,<br />
cont<strong>in</strong>gency funds, and <strong>the</strong> cost <strong>of</strong> physically start<strong>in</strong>g <strong>the</strong><br />
treatment such as build<strong>in</strong>g facilities, transport<strong>in</strong>g<br />
equipment, etc. In request<strong>in</strong>g cost estimates <strong>from</strong> <strong>the</strong><br />
vendors for <strong>the</strong> SBMM piles, <strong>the</strong> list <strong>of</strong> cost categories<br />
was provided, but develop<strong>in</strong>g and categoriz<strong>in</strong>g costs<br />
was left up to <strong>the</strong> vendors. Physical startup costs have<br />
been <strong>in</strong>cluded <strong>in</strong> <strong>the</strong> site preparation category, leav<strong>in</strong>g<br />
<strong>in</strong>surance, taxes, etc. <strong>in</strong> <strong>the</strong> startup costs, where <strong>the</strong>y<br />
were <strong>in</strong>cluded <strong>in</strong> <strong>the</strong> vendor’s estimate.<br />
Often, <strong>in</strong>surance and taxes are estimated to be 10% <strong>of</strong><br />
<strong>the</strong> total annual purchased equipment costs.<br />
Cont<strong>in</strong>gency costs that allow for unforeseen<br />
circumstances such as strikes, floods and price<br />
variations, are <strong>of</strong>ten estimated at <strong>the</strong> same cost as<br />
<strong>in</strong>surance and taxes.<br />
3.5.5 Labor<br />
Included <strong>in</strong> this subsection are <strong>the</strong> labor costs <strong>of</strong><br />
implement<strong>in</strong>g <strong>the</strong> technologies and <strong>the</strong> associated<br />
3-3<br />
monitor<strong>in</strong>g that would be required to verify <strong>the</strong> results <strong>of</strong><br />
<strong>the</strong> process. Where labor is performed but accounted<br />
for <strong>in</strong> o<strong>the</strong>r categories, an explanation has been <strong>in</strong>cluded<br />
<strong>in</strong> those categories. The hourly labor rates presented <strong>in</strong><br />
this subsection are loaded, which means <strong>the</strong>y <strong>in</strong>clude<br />
base salary, benefits, overhead, and general and<br />
adm<strong>in</strong>istrative (G&A) expenses. Travel and per diem<br />
expenses are additional costs <strong>in</strong>cluded <strong>in</strong> this section.<br />
Monitor<strong>in</strong>g requirements for this project are based on <strong>the</strong><br />
assumption that <strong>the</strong> material characterization has<br />
already been done, and costs are required only for <strong>the</strong><br />
tests that would be necessary to determ<strong>in</strong>e <strong>the</strong> degree<br />
to which <strong>the</strong> process is work<strong>in</strong>g, and to satisfy<br />
environmental monitor<strong>in</strong>g requirements. Sampl<strong>in</strong>g labor<br />
would <strong>in</strong>clude collect<strong>in</strong>g and appropriately pack<strong>in</strong>g<br />
samples for shipp<strong>in</strong>g to <strong>the</strong> analytical lab and <strong>the</strong>n<br />
deliver<strong>in</strong>g <strong>the</strong> samples to <strong>the</strong> nearest shipp<strong>in</strong>g <strong>of</strong>fice.<br />
3.5.6 Consumables & Supplies<br />
The category <strong>of</strong> consumables and supplies consists <strong>of</strong><br />
materials used <strong>in</strong> <strong>the</strong> treatment process and supplies<br />
bought to support <strong>the</strong> treatment effort. In <strong>the</strong> SBMM<br />
treatments, <strong>the</strong> reagent and diesel fuel account for <strong>the</strong><br />
consumables and supplies would consist primarily <strong>of</strong><br />
personal protective equipment (PPE) and miscellaneous<br />
supplies.<br />
PPE is rout<strong>in</strong>ely used by <strong>in</strong>dividuals who are active <strong>in</strong><br />
treatment application, sample collection, and dur<strong>in</strong>g any<br />
activity <strong>in</strong> which <strong>the</strong>re is a potential for be<strong>in</strong>g exposed to<br />
contam<strong>in</strong>ated soil or groundwater. Expendable items<br />
would primarily <strong>in</strong>clude nitrile gloves and tyvek coveralls;<br />
and possibly spent respirator cartridges if <strong>the</strong> work is<br />
conducted <strong>in</strong> Level C or higher.<br />
3.5.7 Utilities<br />
Utilities are generally comprised <strong>of</strong> electricity and water.<br />
At <strong>the</strong> SBMM site, <strong>the</strong> equipment <strong>in</strong> both treatment<br />
scenarios is diesel fueled, so only a small electrical cost<br />
to supply light<strong>in</strong>g and possibly for a phone and facsimile<br />
hookup would be needed. A water source would be<br />
needed for decontam<strong>in</strong>ation and <strong>in</strong>cidental activities;<br />
however those costs are considered negligible.<br />
3.5.8 Effluent Treatment and Disposal<br />
For <strong>the</strong>se technologies <strong>the</strong>re is no effluent produced;<br />
<strong>the</strong>refore, it is assumed that <strong>the</strong>re will be no effluent<br />
treatment and disposal expense.
3.5.9 Residuals Shipp<strong>in</strong>g and Disposal<br />
No residuals would be anticipated <strong>from</strong> an <strong>in</strong> situ<br />
stabilization process conducted accord<strong>in</strong>g to <strong>the</strong> method<br />
used <strong>in</strong> <strong>the</strong> treatability study. For <strong>the</strong> modified ex situ<br />
process designed by KEECO, material is removed <strong>from</strong><br />
<strong>the</strong> pile to an adjacent mix<strong>in</strong>g facility where it is mixed<br />
with reagent. At this po<strong>in</strong>t <strong>in</strong> <strong>the</strong> treatment process,<br />
KEECO considers <strong>the</strong> treated material to be residuals<br />
and <strong>in</strong>cluded <strong>the</strong> cost <strong>of</strong> return<strong>in</strong>g <strong>the</strong> material to <strong>the</strong><br />
orig<strong>in</strong>al location <strong>in</strong> <strong>the</strong> residual handl<strong>in</strong>g costs. Disposal<br />
<strong>of</strong> small amounts <strong>of</strong> decontam<strong>in</strong>ation wastewater that<br />
may be generated <strong>from</strong> clean<strong>in</strong>g sampl<strong>in</strong>g equipment is<br />
considered negligible.<br />
3.5.10 Analytical Services<br />
All samples <strong>of</strong> treated material would be sent to an <strong>of</strong>fsite<br />
analytical laboratory. The level <strong>of</strong> test<strong>in</strong>g required to<br />
substantiate site cleanup was specified by each <strong>of</strong> <strong>the</strong><br />
vendors <strong>in</strong> <strong>the</strong>ir respective treatment scenarios. Both<br />
vendors based costs on analysis <strong>of</strong> leachable mercury<br />
only. Unlike <strong>the</strong> treatability study, which determ<strong>in</strong>ed<br />
success by percent reduction <strong>in</strong> comparison with a<br />
water-leach control, actual remediation projects focus on<br />
atta<strong>in</strong><strong>in</strong>g a specific cleanup concentration target level.<br />
3.5.11 Ma<strong>in</strong>tenance and Modifications<br />
Remediation efforts <strong>of</strong>ten <strong>in</strong>clude <strong>in</strong>stallation <strong>of</strong> a<br />
treatment system that would require ongo<strong>in</strong>g<br />
ma<strong>in</strong>tenance. Us<strong>in</strong>g heavy equipment to apply <strong>the</strong><br />
reagent directly to portions <strong>of</strong> <strong>the</strong> material would perform<br />
both treatment scenarios designed for <strong>the</strong> SBMM site.<br />
Ma<strong>in</strong>tenance on <strong>the</strong> equipment would be performed as<br />
required and no significant amounts <strong>of</strong> ma<strong>in</strong>tenance<br />
should be required elsewhere on <strong>the</strong> project.<br />
Modifications would be determ<strong>in</strong>ed by analytical results,<br />
and should only be necessary <strong>in</strong> <strong>the</strong> volume or<br />
technique <strong>of</strong> reagent application.<br />
3.5.12 Demobilization/Site Restoration<br />
Demobilization and site restoration are performed at <strong>the</strong><br />
conclusion <strong>of</strong> <strong>the</strong> treatment project, and would <strong>the</strong>refore<br />
be a one time cost. Restoration <strong>of</strong> a m<strong>in</strong>e site <strong>of</strong>ten<br />
<strong>in</strong>cludes capp<strong>in</strong>g and revegetation; however, this is<br />
beyond <strong>the</strong> scope <strong>of</strong> <strong>the</strong> treatment designs for <strong>the</strong><br />
SBMM site. For <strong>the</strong>se cost estimates, it was assumed<br />
that demobilization/site restoration would consist <strong>of</strong><br />
return<strong>in</strong>g <strong>the</strong> equipment to <strong>the</strong> appropriate locations, and<br />
dismantl<strong>in</strong>g <strong>the</strong> mix<strong>in</strong>g facilities <strong>in</strong> KEECO’s design. It<br />
should be noted that boreholes <strong>in</strong> ECWI’s design are not<br />
3-4<br />
cased wells and it was assumed that no abandonment<br />
procedures would be required.<br />
3.6 Vendor Cost Estimates<br />
This section presents <strong>the</strong> cost estimates provided by <strong>the</strong><br />
technology vendors. The estimates were to be based on<br />
<strong>the</strong> twelve cost categories specified above. In sections<br />
where a cost was not estimated by <strong>the</strong> vendor, an<br />
estimate has been <strong>in</strong>cluded based on available<br />
<strong>in</strong>formation.<br />
3.6.1 E&C Williams Enthrall ® Technology<br />
ECWI designed an <strong>in</strong> situ treatment that was based on<br />
an application strategy related to <strong>the</strong> techniques used <strong>in</strong><br />
<strong>the</strong> treatability study. In this method, a truck-mounted<br />
sonic drill rig would be used to drill <strong>in</strong>to <strong>the</strong> pile and<br />
<strong>in</strong>ject <strong>the</strong> ENTHRALL ® reagent at depth <strong>in</strong>tervals that<br />
were calculated to allow for complete permeation <strong>of</strong> <strong>the</strong><br />
material. ECWI would provide <strong>the</strong> chemical reagent and<br />
serve as technical consultants, but would subcontract<br />
<strong>the</strong> actual drill<strong>in</strong>g and <strong>in</strong>jection to Prosonic Drill<strong>in</strong>g<br />
Company, Inc (PDI) <strong>of</strong> Phoenix, Arizona. Drill<strong>in</strong>g costs<br />
<strong>in</strong> this estimate are based on <strong>in</strong>formation supplied by<br />
PDI.<br />
Based on previous experience, ECWI has estimated<br />
costs on <strong>the</strong> assumptions that application at each<br />
borehole will treat a radius <strong>of</strong> 15 feet, and that <strong>in</strong>jection<br />
to <strong>the</strong> average depth <strong>of</strong> <strong>the</strong> pile will provide sufficient<br />
treatment. Two rigs would operate concurrently on <strong>the</strong><br />
heap, with one tanker truck supply<strong>in</strong>g reagent to both.<br />
The rig would drill to <strong>the</strong> specified depth, <strong>in</strong>ject <strong>the</strong><br />
reagent and pull out <strong>the</strong> shaft, leav<strong>in</strong>g a dispensable<br />
drive po<strong>in</strong>t <strong>in</strong> each hole. The treatment design calls for<br />
two eight-hour shifts on each rig per day. It was<br />
assumed that boreholes could be left <strong>in</strong> <strong>the</strong> pile and<br />
would not require abandonment procedures. Prior to<br />
beg<strong>in</strong>n<strong>in</strong>g full-scale application, on-site pilot <strong>in</strong>jection<br />
holes would be required to test <strong>the</strong> design assumptions.<br />
Costs were estimated by ECWI for each <strong>of</strong> <strong>the</strong> specified<br />
piles, based on <strong>the</strong> assumption that treatment <strong>of</strong> <strong>the</strong><br />
piles would take place sequentially, requir<strong>in</strong>g only one<br />
mobilization and demobilization cycle. The follow<strong>in</strong>g<br />
cost estimate is based on <strong>the</strong> 12 cost categories<br />
described above, and was provided by ECWI, except<br />
where o<strong>the</strong>rwise <strong>in</strong>dicated.<br />
(1) Site Preparation: There is m<strong>in</strong>imal site preparation<br />
required for <strong>the</strong> work<strong>in</strong>g site s<strong>in</strong>ce <strong>the</strong> drill rigs are<br />
mobile and designed for field work. Prior to beg<strong>in</strong>n<strong>in</strong>g<br />
treatment at <strong>the</strong> site, ECWI personnel would obta<strong>in</strong>
tra<strong>in</strong><strong>in</strong>g <strong>in</strong> spill conta<strong>in</strong>ment and remediation procedures<br />
at ECWI’s expense, and would visit <strong>the</strong> site to determ<strong>in</strong>e<br />
requirements and costs to construct storage areas with<br />
secondary conta<strong>in</strong>ment for diesel fuel and <strong>the</strong> chemical<br />
reagent. ECWI would provide poly storage tanks with<br />
secondary conta<strong>in</strong>ment as work<strong>in</strong>g storage for <strong>the</strong><br />
drill<strong>in</strong>g/<strong>in</strong>ject<strong>in</strong>g teams at no charge to <strong>the</strong> project.<br />
ECWI did not <strong>in</strong>clude a cost for <strong>the</strong> fuel and chemical<br />
storage and secondary conta<strong>in</strong>ments <strong>in</strong> <strong>the</strong>ir estimate.<br />
Based on general <strong>in</strong>formation available <strong>from</strong><br />
miscellaneous vendor publications a rough estimate for<br />
<strong>the</strong> fuel and reagent conta<strong>in</strong>ers and secondary<br />
conta<strong>in</strong>ments has been made at $40,000.<br />
(2) Permitt<strong>in</strong>g and Regulatory Activities: PDI is<br />
licensed to work <strong>in</strong> California. Any additional required<br />
bus<strong>in</strong>ess licenses or permits would be <strong>the</strong> responsibility<br />
<strong>of</strong> ECWI, and <strong>the</strong>y would have to be <strong>in</strong>formed <strong>of</strong> such<br />
requirements <strong>in</strong> advance <strong>of</strong> a site application with<br />
sufficient lead time to procure <strong>the</strong> appropriate permits.<br />
As discussed <strong>in</strong> Section 3.5.2, permit requirements are<br />
very site specific, and may be modified by <strong>the</strong> exist<strong>in</strong>g<br />
status <strong>of</strong> <strong>the</strong> project as a superfund site. ECWI has not<br />
been to <strong>the</strong> site, or been <strong>in</strong>formed <strong>of</strong> permitt<strong>in</strong>g<br />
requirements so a cost for this budget item was not<br />
<strong>in</strong>cluded <strong>in</strong> <strong>the</strong>ir estimate.<br />
RCRA and State regulations may have to be satisfied <strong>in</strong><br />
addition to Superfund requirements. S<strong>in</strong>ce <strong>the</strong> site is an<br />
active Superfund site, it is possible that <strong>the</strong> technology<br />
could be implemented under <strong>the</strong> umbrella <strong>of</strong> exist<strong>in</strong>g<br />
permits and plans held by <strong>the</strong> site owner or o<strong>the</strong>r<br />
responsible party. Added costs may result <strong>from</strong><br />
<strong>in</strong>vestigat<strong>in</strong>g <strong>the</strong> regulations and policies relat<strong>in</strong>g to <strong>the</strong><br />
location <strong>of</strong> <strong>the</strong> site. Based on past experience with<br />
similar projects, <strong>the</strong> cost associated with permitt<strong>in</strong>g<br />
activities was estimated at $20,000.<br />
(3) Capital Equipment: Major equipment for <strong>the</strong><br />
treatment at SBMM would consist <strong>of</strong> two rotosonic drill<br />
rigs and a fluid tanker with pump<strong>in</strong>g equipment, both to<br />
be supplied by PDI. Costs for use and operation <strong>of</strong> this<br />
equipment was provided on a per-diem basis. The cost<br />
per day for <strong>the</strong> rigs, <strong>in</strong>clud<strong>in</strong>g operators, is $5,300. The<br />
cost for <strong>the</strong> fluid tanker, <strong>in</strong>clud<strong>in</strong>g an operator who would<br />
transport and assist <strong>in</strong> <strong>in</strong>ject<strong>in</strong>g fluid is $750.00 per day.<br />
The comb<strong>in</strong>ed total costs for capital equipment would be<br />
$1,633,500 accord<strong>in</strong>g to <strong>the</strong> <strong>in</strong>dividual pile costs as<br />
follows:<br />
North <strong>Waste</strong> Pile<br />
The estimated time for set up, drill<strong>in</strong>g, <strong>in</strong>jection <strong>of</strong><br />
reagent, mov<strong>in</strong>g between holes and tear<strong>in</strong>g down is 160<br />
3-5<br />
man-days for <strong>the</strong> North <strong>Waste</strong> Pile, based on 12-hour<br />
day maximums. This equates to $848,000 for drill<strong>in</strong>g<br />
equipment and $120,000 for <strong>the</strong> fluid tanker, total<strong>in</strong>g<br />
$968,000 <strong>in</strong> capital equipment costs.<br />
<strong>Waste</strong> Rock Dam<br />
For treatment <strong>of</strong> <strong>the</strong> <strong>Waste</strong> Rock Dam, <strong>the</strong> estimated<br />
time for set up, drill<strong>in</strong>g, <strong>in</strong>jection <strong>of</strong> reagent, mov<strong>in</strong>g<br />
between holes and tear<strong>in</strong>g down is 110 man-days,<br />
based on 12-hour day maximums, which would amount<br />
to $583,000 for drill<strong>in</strong>g equipment and $82,500 for <strong>the</strong><br />
fluid tanker, total<strong>in</strong>g $665,500 <strong>in</strong> capital equipment<br />
costs.<br />
(4) Start-up and Fixed Costs: This category typically<br />
<strong>in</strong>cludes mobilization costs and <strong>in</strong>itial supplies to beg<strong>in</strong><br />
operations. Mobilization costs to transport <strong>the</strong> drill rigs<br />
and support equipment <strong>from</strong> PDI’s <strong>of</strong>fice <strong>in</strong> Arizona to<br />
<strong>the</strong> site would be $25,000. Mobiliz<strong>in</strong>g ECWI’s tanks and<br />
o<strong>the</strong>r equipment to <strong>the</strong> site would cost ano<strong>the</strong>r $20,000,<br />
br<strong>in</strong>g<strong>in</strong>g <strong>the</strong> total to $45,000.<br />
(5) Labor: The treatment design calls for two shifts per<br />
day. The term “days” <strong>in</strong> <strong>the</strong> labor costs refers to mandays<br />
consist<strong>in</strong>g <strong>of</strong> 8 hours. Labor costs for <strong>the</strong> crews<br />
who run <strong>the</strong> rigs have been <strong>in</strong>cluded <strong>in</strong> <strong>the</strong><br />
subcontractor’s costs for <strong>the</strong> rigs under capital<br />
equipment. ECWI would also provide labor, which<br />
would <strong>in</strong>clude ten full-time workers with regular<br />
supervisory visits <strong>from</strong> ECWI management. ECWI<br />
would also contract pr<strong>of</strong>essional assistance, <strong>in</strong>clud<strong>in</strong>g<br />
geologists and project managers. A safety <strong>of</strong>ficer would<br />
be appo<strong>in</strong>ted for on-site process<strong>in</strong>g periods, and ECWI<br />
would be responsible for ensur<strong>in</strong>g that site personnel<br />
were current <strong>in</strong> <strong>the</strong> 40 Hour HAZWOPER tra<strong>in</strong><strong>in</strong>g.<br />
ECWI considers <strong>the</strong> cost <strong>of</strong> safety tra<strong>in</strong><strong>in</strong>g to be an<br />
overhead expense and not a cost <strong>the</strong> project would pay.<br />
Workers would be employed to work 8-hour days at an<br />
hourly rate <strong>of</strong> $15 plus $80 per diem. [Note: An hourly<br />
rate <strong>of</strong> $15 hour (loaded) is considered low. Anticipate<br />
higher labor rates. Also, a supervisor will be required at<br />
a higher rate.] Three pr<strong>of</strong>essionals would be hired at <strong>the</strong><br />
rate <strong>of</strong> $150 per hour, but would only be needed for 2<br />
hours a day, and would not be required for <strong>the</strong> entire<br />
duration <strong>of</strong> <strong>the</strong> project. The per diem rate for <strong>the</strong><br />
pr<strong>of</strong>essionals would be $100 per day. The comb<strong>in</strong>ed<br />
labor total is $903,300, which breaks down as follows:<br />
North <strong>Waste</strong> Pile<br />
The required ten workers for 160 days would cost<br />
$320,000. Three additional pr<strong>of</strong>essionals for two hours<br />
per day, plus per diem, for 100 days would add ano<strong>the</strong>r<br />
$120,000 <strong>in</strong> consultation fees. The wages for <strong>the</strong> PDI
drill<strong>in</strong>g crew were <strong>in</strong>cluded <strong>in</strong> <strong>the</strong> cost <strong>of</strong> <strong>the</strong> rig, which<br />
was listed under capital costs, but an additional per diem<br />
<strong>of</strong> $85.00 for each member <strong>of</strong> <strong>the</strong> four-man crew over<br />
<strong>the</strong> period <strong>of</strong> 160 days would add $54,400. Provid<strong>in</strong>g for<br />
shift travel for <strong>of</strong>f-work days at $2,500 every ten days<br />
equals $40,000. The total labor costs would equal<br />
$534,400.<br />
<strong>Waste</strong> Rock Dam<br />
Ten workers for 110 days would cost $220,000. Three<br />
additional pr<strong>of</strong>essionals would be needed for an<br />
estimated 70 days for two hours per day with per diem,<br />
which would add ano<strong>the</strong>r $84,000 <strong>in</strong> consultation fees.<br />
The wages for <strong>the</strong> PDI drill<strong>in</strong>g crew were <strong>in</strong>cluded with<br />
<strong>the</strong> rig under capital costs, but an additional per diem <strong>of</strong><br />
$85.00 for each member <strong>of</strong> <strong>the</strong> four-man crew over <strong>the</strong><br />
110 days period would add $37,400. Provid<strong>in</strong>g for shift<br />
travel for <strong>of</strong>f-work days at $2,500 every ten days equals<br />
$27,500. The total labor costs would equal $368,900.<br />
(6) Consumables and Supplies: Costs predom<strong>in</strong>ately<br />
consist <strong>of</strong> <strong>the</strong> chemical reagent. Additional costs also<br />
<strong>in</strong>clude diesel fuel, an expendable drive po<strong>in</strong>t for each<br />
borehole and a small quantity <strong>of</strong> o<strong>the</strong>r supplies<br />
necessary for adm<strong>in</strong>istrative and safety concerns. The<br />
unspecified supplies would constitute a very m<strong>in</strong>or cost<br />
and are not detailed here.<br />
The required quantity <strong>of</strong> reagent has been determ<strong>in</strong>ed<br />
by 1:10 w/w ratio <strong>of</strong> reagent to material. The weight <strong>of</strong><br />
<strong>the</strong> material was calculated by multiply<strong>in</strong>g <strong>the</strong> volume <strong>of</strong><br />
each pile by a typical density for a mixed soil type, 1.5<br />
tons/cubic yard. If <strong>the</strong> density <strong>of</strong> <strong>the</strong> material <strong>in</strong> <strong>the</strong> pile<br />
were determ<strong>in</strong>ed to be higher, <strong>the</strong>n more reagent would<br />
have to be applied to ma<strong>in</strong>ta<strong>in</strong> <strong>the</strong> same ratio. The<br />
ENTHRALL ® addition rate was determ<strong>in</strong>ed <strong>from</strong> its<br />
weight <strong>of</strong> 9.2 pounds/gallon, which converts to 217.39<br />
gallons per ton <strong>of</strong> reagent.<br />
Diesel fuel usage was estimated at 100 gallons/day for a<br />
total <strong>of</strong> 110 days. Fuel costs are highly variable, but<br />
based on an anticipated maximum <strong>of</strong> $2.00/gallon, this<br />
br<strong>in</strong>gs <strong>the</strong> total diesel cost to $22,000.<br />
The expendable drive po<strong>in</strong>ts, which would be required<br />
for drill<strong>in</strong>g and would be left <strong>in</strong> <strong>the</strong> borehole, cost $14<br />
each. Based on <strong>the</strong> assumption that each borehole will<br />
treat an area with a radius <strong>of</strong> 15 feet, <strong>the</strong> number <strong>of</strong><br />
boreholes that would be required to <strong>in</strong>ject <strong>the</strong> reagent<br />
<strong>in</strong>to each pile was calculated <strong>from</strong> <strong>the</strong> specified surface<br />
areas. The category total costs would be $57,008,477<br />
for <strong>the</strong> reagent and $50,840 for o<strong>the</strong>r supplies and<br />
consumables.<br />
3-6<br />
North <strong>Waste</strong> Pile<br />
Apply<strong>in</strong>g <strong>the</strong> ENTHRALL ® reagent at a 1:10 w/w ratio to<br />
<strong>the</strong> 1,315,500 tons <strong>of</strong> material <strong>in</strong> <strong>the</strong> North <strong>Waste</strong> Pile<br />
would require 28,597,826 gallons which would cost<br />
$34,889,348. This equates to a reagent cost <strong>of</strong> $26.52<br />
per ton <strong>of</strong> material. If <strong>the</strong> density <strong>of</strong> <strong>the</strong> material <strong>in</strong> <strong>the</strong><br />
pile was determ<strong>in</strong>ed to be higher than 1.5, more reagent<br />
would have to be applied to ma<strong>in</strong>ta<strong>in</strong> <strong>the</strong> same ratio.<br />
Based on a density <strong>of</strong> 1.7 tons per cubic yard, <strong>the</strong> cost<br />
would be $39,541,261.<br />
The surface <strong>of</strong> <strong>the</strong> North <strong>Waste</strong> Pile was specified as<br />
approximately 894,000 square feet. This would require<br />
960 boreholes, each <strong>of</strong> which would be 25 feet deep<br />
based on <strong>the</strong> average depth <strong>of</strong> <strong>the</strong> pile be<strong>in</strong>g 26.5 ft.<br />
The cost <strong>of</strong> 960 expendable drive po<strong>in</strong>ts, at $14 each,<br />
would be $13,440.<br />
<strong>Waste</strong> Rock Dam<br />
Apply<strong>in</strong>g <strong>the</strong> ENTHRALL ® reagent at a 1:10 w/w ratio to<br />
<strong>the</strong> 834,000 tons <strong>of</strong> material <strong>in</strong> <strong>the</strong> <strong>Waste</strong> Rock Dam<br />
would require 18,130,435 gallons which would cost<br />
$22,119,130. This equates to a reagent cost <strong>of</strong> $26.52<br />
per ton <strong>of</strong> material.<br />
The surface <strong>of</strong> <strong>the</strong> <strong>Waste</strong> Rock Dam was specified as<br />
be<strong>in</strong>g approximately 1,034,000 square feet. This would<br />
require 1,100 boreholes, each <strong>of</strong> which would be 15 feet<br />
deep based on <strong>the</strong> average depth <strong>of</strong> <strong>the</strong> pile be<strong>in</strong>g 14.5<br />
ft. The cost <strong>of</strong> 1,100 expendable drive po<strong>in</strong>ts, at $14<br />
each, would be $15,400.<br />
(7) Utilities: Electricity and water are usually <strong>the</strong><br />
primary utilities required for a remediation project. An<br />
overall electrical requirement was estimated at<br />
$500/month for four months, or $2,000. Incidental<br />
amounts <strong>of</strong> water would be required for clean<strong>in</strong>g and<br />
human usage, but <strong>the</strong> cost should be small and was not<br />
<strong>in</strong>cluded <strong>in</strong> <strong>the</strong> estimate.<br />
In order to have a night shift runn<strong>in</strong>g, a light plant would<br />
need to be provided, and could be rented for $175 per<br />
day. A reduced cost for light<strong>in</strong>g may be achieved if <strong>the</strong><br />
commercial power grid is accessible <strong>from</strong> <strong>the</strong> treatment<br />
site. Portable generators may provide electricity for<br />
<strong>in</strong>cidental usage also, but access to <strong>the</strong> commercial<br />
power grid is preferred. Portable toilets should be<br />
provided for field workers, and can be rented for $65 a<br />
month, which would total $520 for <strong>the</strong> life <strong>of</strong> <strong>the</strong> project,<br />
treat<strong>in</strong>g both piles.<br />
North <strong>Waste</strong> Pile<br />
Utilities for <strong>the</strong> project were not separated by piles with<br />
<strong>the</strong> exception <strong>of</strong> light plant rental, which would cost
$14,000 for <strong>the</strong> 80 calendar days that would be required<br />
for <strong>the</strong> North <strong>Waste</strong> Pile.<br />
<strong>Waste</strong> Rock Dam<br />
Runn<strong>in</strong>g <strong>the</strong> light plant on <strong>the</strong> <strong>Waste</strong> Rock Dam for <strong>the</strong><br />
duration <strong>of</strong> treatment application, 55 days, would run<br />
approximately $9,652.<br />
(8) Effluent, Treatment and Disposal: In this <strong>in</strong> situ<br />
application <strong>of</strong> <strong>the</strong> technology, no effluent requir<strong>in</strong>g<br />
treatment or disposal would be generated.<br />
(9) Residuals, Shipp<strong>in</strong>g and Disposal: As this is an <strong>in</strong><br />
situ technology, no residuals requir<strong>in</strong>g treatment or<br />
disposal would be anticipated.<br />
(10) Analytical Costs: Fur<strong>the</strong>r <strong>in</strong>vestigation <strong>of</strong> <strong>the</strong> site<br />
would be required <strong>in</strong> order to def<strong>in</strong>e required monitor<strong>in</strong>g<br />
parameters. Assum<strong>in</strong>g that mercury is <strong>the</strong> only<br />
constituent requir<strong>in</strong>g analysis, and that TCLP or SPLP<br />
followed by cold-vapor analysis is to be performed, <strong>the</strong><br />
cost for each sample <strong>in</strong>clud<strong>in</strong>g <strong>the</strong> fees for a one-week<br />
turnaround time should be approximately $200 for each<br />
sample. A flow model would be used to estimate <strong>the</strong><br />
time for <strong>the</strong> reagent to permeate <strong>the</strong> material and for <strong>the</strong><br />
treatment reaction to occur. Sampl<strong>in</strong>g <strong>of</strong> treated material<br />
would beg<strong>in</strong> on a weekly basis when <strong>the</strong> model <strong>in</strong>dicated<br />
that <strong>the</strong> treatment was complete. ECWI would be<br />
responsible for sample collection and for gett<strong>in</strong>g <strong>the</strong><br />
analysis performed Copies <strong>of</strong> <strong>the</strong> analytical report would<br />
be sent <strong>from</strong> <strong>the</strong> laboratory to a designated third party<br />
for review and storage, while <strong>the</strong> orig<strong>in</strong>als would be<br />
ma<strong>in</strong>ta<strong>in</strong>ed by ECWI until <strong>the</strong> treatment phase <strong>of</strong> <strong>the</strong><br />
project was closed. Based on <strong>the</strong> $200 per sample,<br />
ECWI estimated <strong>the</strong> analytical costs to be approximately<br />
$10,400. This was based on approximately one year <strong>of</strong><br />
weekly sampl<strong>in</strong>g, with one target metal <strong>of</strong> mercury and a<br />
one-week turnaround on results.<br />
(11) Ma<strong>in</strong>tenance and modifications: Ma<strong>in</strong>ta<strong>in</strong><strong>in</strong>g<br />
equipment owned by ECWI and PDI would be <strong>the</strong><br />
responsibility <strong>of</strong> <strong>the</strong> respective owners. No modification<br />
<strong>of</strong> equipment is anticipated; however, modifications to<br />
<strong>the</strong> process may be found necessary <strong>in</strong> technique or<br />
reagent application, but <strong>the</strong>se should not significantly<br />
impact costs. ECWI allocates approximately<br />
$25,000/year for ma<strong>in</strong>tenance.<br />
(12) Demobilization/Site Restoration: ECWI<br />
estimated <strong>the</strong> cost <strong>of</strong> demobiliz<strong>in</strong>g <strong>the</strong>ir own equipment<br />
<strong>from</strong> Clear Lake back to Summerville, SC to be $20,000.<br />
Demobiliz<strong>in</strong>g PDI’s rigs would cost approximately<br />
$25,000. No site restoration costs were estimated.<br />
3-7<br />
3.6.2 KEECO’s SME Technology<br />
KEECO refers to <strong>the</strong> approach that was designed for<br />
use at <strong>the</strong> SBMM site as a modified ex situ process, <strong>in</strong><br />
that <strong>the</strong> material is removed <strong>from</strong> its location for<br />
treatment, but only to an adjacent on-site facility for <strong>the</strong><br />
addition and mix<strong>in</strong>g <strong>of</strong> <strong>the</strong> reagent. The cost<strong>in</strong>g is based<br />
on a design that <strong>in</strong>cludes build<strong>in</strong>g a mix<strong>in</strong>g facility<br />
adjacent to each <strong>of</strong> <strong>the</strong> piles. Each facility would consist<br />
<strong>of</strong> a concrete mix<strong>in</strong>g corral with raised side berms <strong>in</strong>side<br />
an enclosed portable build<strong>in</strong>g. Each facility was<br />
designed for an hourly throughput <strong>of</strong> 300+ tons per hour<br />
per facility and would be equipped with an air handl<strong>in</strong>g<br />
unit, reagent delivery silos and a water storage tank to<br />
wet <strong>the</strong> soils <strong>in</strong> order to prevent fugitive dusts dur<strong>in</strong>g <strong>the</strong><br />
mix<strong>in</strong>g process.<br />
Excavators and dump trucks would be employed to<br />
move <strong>the</strong> material <strong>from</strong> <strong>the</strong> pile to <strong>the</strong> mix<strong>in</strong>g facility. The<br />
material would be dumped <strong>in</strong> <strong>the</strong> mix<strong>in</strong>g facility where a<br />
measured amount <strong>of</strong> reagent would be applied <strong>from</strong> <strong>the</strong><br />
silo. Water would be applied to control fugitive dusts as<br />
a front end loader mixed <strong>the</strong> reagent <strong>in</strong>to <strong>the</strong> material.<br />
In KEECO’s design, <strong>the</strong> treated material is considered<br />
“residual” and costs for return<strong>in</strong>g it to <strong>the</strong> heap and<br />
compact<strong>in</strong>g it after treatment has been performed are<br />
covered under <strong>the</strong> residuals category.<br />
KEECO used a typical density for mixed soil types, 1.5<br />
tons per cubic yard, to calculate <strong>the</strong> weights that were<br />
used <strong>in</strong> <strong>the</strong> cost estimate. The calculated weights are<br />
1,315,500 tons, <strong>in</strong> <strong>the</strong> North <strong>Waste</strong> Pile and 834,000<br />
tons <strong>in</strong> <strong>the</strong> <strong>Waste</strong> Rock Dam. The cost estimate<br />
provided by KEECO was based on <strong>the</strong> comb<strong>in</strong>ed mass<br />
<strong>of</strong> <strong>the</strong> two piles; <strong>the</strong>refore figures are presented for<br />
treatment <strong>of</strong> 2,149,500 tons without differentiat<strong>in</strong>g time<br />
and effort between <strong>the</strong> two piles. The treatment time<br />
required to treat <strong>the</strong> entire mass is 247 work<strong>in</strong>g days,<br />
based on an average daily throughput <strong>of</strong> 8,700 tons per<br />
day.<br />
The cost estimates for KEECO’s application were based<br />
on <strong>the</strong> assumption that mix<strong>in</strong>g operations would be<br />
scheduled to operate on a 16 hours (consist<strong>in</strong>g <strong>of</strong> two 8hour<br />
shifts) per day, five days per week basis. A daily<br />
use factor <strong>of</strong> 90 percent <strong>of</strong> <strong>the</strong> design capacity was used<br />
based on <strong>the</strong> simplicity <strong>of</strong> <strong>the</strong> operation and reliability <strong>of</strong><br />
<strong>the</strong> standard equipment selected. Based on an<br />
expected daily throughput <strong>of</strong> 8,700 tons per day, it is<br />
estimated that <strong>the</strong> mix<strong>in</strong>g operations will be completed <strong>in</strong><br />
247 work<strong>in</strong>g days (one year). An additional tra<strong>in</strong><strong>in</strong>g<br />
period <strong>of</strong> five days prior to treatment beg<strong>in</strong>n<strong>in</strong>g and ten<br />
days at <strong>the</strong> end for demobilization should also be<br />
<strong>in</strong>cluded <strong>in</strong> <strong>the</strong> schedule.
The cost estimate provided by KEECO is based on a<br />
prelim<strong>in</strong>ary design, which was produced without <strong>the</strong><br />
benefit <strong>of</strong> data <strong>from</strong> a pilot project; <strong>the</strong>refore, cost ranges<br />
presented <strong>in</strong> this estimate may be wider than would<br />
normally be expected <strong>in</strong> a fully developed cost estimate.<br />
It should also be noted that SME reagent use rates <strong>in</strong><br />
this cost estimate were taken <strong>from</strong> <strong>the</strong> lab scale<br />
treatability study, whereas historically, field use rates are<br />
considerably lower than lab use rates result<strong>in</strong>g <strong>in</strong><br />
reduced reagent costs.<br />
The cost estimate has been developed accord<strong>in</strong>g to <strong>the</strong><br />
twelve categories specified <strong>in</strong> Section 3.2 above.<br />
(1) Site Preparation: The primary preparation cost<br />
would be <strong>the</strong> construction <strong>of</strong> <strong>the</strong> mix<strong>in</strong>g facilities, which<br />
was estimated at $420,000 each. The total site<br />
preparation costs for facilities at both piles would be<br />
$840,000.<br />
(2) Permitt<strong>in</strong>g and Regulatory Activities: The cost for<br />
State and Federal air treatment permits for <strong>the</strong> mix<strong>in</strong>g<br />
facilities is estimated to be $20,000 <strong>in</strong>clud<strong>in</strong>g labor for<br />
data review, estimat<strong>in</strong>g emissions and permitt<strong>in</strong>g fees.<br />
Construction permits were estimated to be $2,500 and<br />
permitt<strong>in</strong>g costs for onsite disposition <strong>of</strong> <strong>the</strong> treated<br />
material were estimated at $40,000. Costs for<br />
permitt<strong>in</strong>g, regulatory activities, monitor<strong>in</strong>g and waste<br />
transportation and disposal are highly dependent on <strong>the</strong><br />
site, and as such could be significantly higher than <strong>the</strong><br />
estimated total <strong>of</strong> $62,500.<br />
(3) Capital Equipment: Heavy equipment would be<br />
rented or leased for <strong>the</strong> project. The follow<strong>in</strong>g<br />
equipment list <strong>in</strong>cludes monthly rental rates for each<br />
piece <strong>of</strong> equipment: 2 excavator/backhoes at $15,000, 2<br />
10-KW generators at $1,000, 4 dump trucks at $4,000, 4<br />
front end loaders at $14,000 and 1 water truck at<br />
$3,000. The total monthly equipment rental would be<br />
$107,000, br<strong>in</strong>g<strong>in</strong>g <strong>the</strong> total for <strong>the</strong> estimated 12-month<br />
project duration to $1,284,000.<br />
3-8<br />
(4) Start-up and Fixed Costs: This category <strong>in</strong>cludes<br />
transportation <strong>of</strong> personnel and equipment, safety<br />
tra<strong>in</strong><strong>in</strong>g, work<strong>in</strong>g capital, <strong>in</strong>surance, monitor<strong>in</strong>g, and a<br />
cont<strong>in</strong>gency fund. Transportation costs for 14 pieces <strong>of</strong><br />
rental equipment were assumed to be $7,000. The<br />
transportation <strong>of</strong> personnel cost was based on <strong>the</strong><br />
purchase <strong>of</strong> six $1,200 round trip airl<strong>in</strong>e tickets for a total<br />
<strong>of</strong> $7,200. The rema<strong>in</strong><strong>in</strong>g project staff would be hired<br />
locally. Safety tra<strong>in</strong><strong>in</strong>g would consist <strong>of</strong> a 40 hour<br />
HAZWOPER course, which each member <strong>of</strong> <strong>the</strong> site<br />
team would be required to complete. Based on a crew<br />
size <strong>of</strong> 32 persons, <strong>the</strong> estimated cost <strong>of</strong> <strong>the</strong> tra<strong>in</strong><strong>in</strong>g<br />
would be $57,000. Total transportation and tra<strong>in</strong><strong>in</strong>g<br />
costs are estimated at $71,200.<br />
Work<strong>in</strong>g capital consists <strong>of</strong> <strong>the</strong> costs <strong>of</strong> borrow<strong>in</strong>g capital<br />
for operat<strong>in</strong>g supplies, utilities, and labor necessary to<br />
keep <strong>the</strong> project runn<strong>in</strong>g without f<strong>in</strong>ancial constra<strong>in</strong>ts.<br />
Work<strong>in</strong>g capital for this project is estimated at<br />
$1,000,000, based on ma<strong>in</strong>ta<strong>in</strong><strong>in</strong>g 2 months <strong>of</strong> payroll,<br />
and sufficient <strong>in</strong>ventory for all o<strong>the</strong>r items. The cost <strong>of</strong><br />
capital is assumed to be 9% <strong>of</strong> <strong>the</strong> work<strong>in</strong>g capital,<br />
mak<strong>in</strong>g <strong>the</strong> estimated work<strong>in</strong>g capital cost $90,000 per<br />
annum. Insurance was estimated at $50,000 per year<br />
and a cont<strong>in</strong>gency factor should be <strong>in</strong>cluded <strong>in</strong> <strong>the</strong><br />
budget to cover unforeseen events, for which KEECO<br />
estimated $150,000 as an appropriate figure.<br />
Environmental monitor<strong>in</strong>g is assumed to be required for<br />
fugitive dust emissions <strong>from</strong> <strong>the</strong> mix<strong>in</strong>g facility only, and<br />
was estimated to cost $6,000. The comb<strong>in</strong>ed total <strong>of</strong><br />
costs <strong>in</strong> this category is $367,200.<br />
(5) Labor: It is assumed that treatment operations<br />
would be conducted over 247 days, work<strong>in</strong>g <strong>in</strong> two<br />
shifts, for a total <strong>of</strong> 16 hours per day, 5 days per week.<br />
Total labor cost for treatment is estimated to be<br />
$2,986,800. Table 3-1 gives a breakdown <strong>of</strong> <strong>the</strong><br />
number and types <strong>of</strong> employees, expected pay rates<br />
and <strong>the</strong> number <strong>of</strong> hours that would be required for each<br />
type <strong>of</strong> labor.
Table 3-1. Labor Unit Costs.<br />
Description Number <strong>of</strong><br />
Persons<br />
Cost Per<br />
Hour<br />
Total Hours Total Cost<br />
Site Manager 1 $90 2096 $188,640<br />
Foreman 2 $55 4192 $230,560<br />
Truck Driver 8 $40 16768 $670,720<br />
Excavator Operator 4 $45 8384 $377,280<br />
Front End Loader Operator 8 $45 16768 $754,560<br />
Water Truck Driver 2 $40 4192 $167,680<br />
Laborer 4 $35 8384 $293,440<br />
SSHO 1 $65 2096 $136,240<br />
Facility Operator 2 $40 4192 $167,680<br />
TOTAL $2,986,800<br />
(6) Consumables and Supplies: The most significant<br />
cost <strong>in</strong> <strong>the</strong> treatment estimate is <strong>the</strong> chemical reagent.<br />
The material requires a 5% by weight add ratio. The<br />
estimated cost <strong>of</strong> $23,107,000 assumes that a<br />
temporary batch mix<strong>in</strong>g plant would be established on<br />
site to defray excessive transportation costs. This also<br />
assumes that utilities are available to support <strong>the</strong><br />
operation <strong>of</strong> a temporary batch mix<strong>in</strong>g plant.<br />
Diesel fuel is required to operate <strong>the</strong> earth mov<strong>in</strong>g<br />
equipment and generators. It was estimated that fuel<br />
consumption would be 50 gallons <strong>of</strong> fuel per piece <strong>of</strong><br />
equipment per day. This amounts to 650 gallons <strong>of</strong> fuel<br />
per day. Us<strong>in</strong>g a rate <strong>of</strong> $1.40 per gallon, daily fuel cost<br />
was estimated to be $910. Assum<strong>in</strong>g 247 operat<strong>in</strong>g<br />
days, total fuel costs were estimated to be $224,770.<br />
Supplies consist <strong>of</strong> operat<strong>in</strong>g supplies and SME reagent.<br />
Operat<strong>in</strong>g supplies consist <strong>of</strong> items such as safety<br />
equipment, PPE, <strong>of</strong>fice supplies, custodial supplies,<br />
potable water and <strong>the</strong> like. Operat<strong>in</strong>g supplies were<br />
estimated at 1 percent <strong>of</strong> annual labor, or $29,600.<br />
Comb<strong>in</strong><strong>in</strong>g <strong>the</strong> three costs for consumables and supplies<br />
br<strong>in</strong>gs <strong>the</strong> category total to $23,361,370 for<br />
consumables and supplies.<br />
(7) Utilities: Water is used to m<strong>in</strong>imize fugitive dust<br />
emissions dur<strong>in</strong>g operations. Assum<strong>in</strong>g a water use rate<br />
<strong>of</strong> 2 percent <strong>of</strong> <strong>the</strong> volume be<strong>in</strong>g treated, and a cost <strong>of</strong><br />
$2 per 1000 gallons, <strong>the</strong> total cost <strong>of</strong> water for <strong>the</strong><br />
project would be estimated at $20,600. Electricity would<br />
be required, but <strong>in</strong>cidental usage should not add<br />
significant costs.<br />
(8) Effluent, Treatment and Disposal: The treatment<br />
process produces no effluent, however, clean<strong>in</strong>g PPE<br />
and equipment may produce wash water that requires<br />
decontam<strong>in</strong>ation. It was assumed <strong>in</strong> <strong>the</strong> cost estimate<br />
3-9<br />
that this would be a small enough quantity that any<br />
associated costs could be absorbed <strong>in</strong>to <strong>the</strong> overall<br />
project costs.<br />
(9) Residuals, Shipp<strong>in</strong>g, & Disposal: Residuals <strong>from</strong><br />
<strong>the</strong> SME process can <strong>in</strong>clude treated waste, waters and<br />
sludge and waste <strong>from</strong> decontam<strong>in</strong>ation activities. It<br />
was estimated that treated material could be moved<br />
<strong>from</strong> <strong>the</strong> treatment facility, replaced and compacted<br />
onsite for $3 per ton or $6,448,500 for <strong>the</strong> entire project.<br />
This figure <strong>in</strong>cludes <strong>the</strong> equipment and labor used to<br />
return <strong>the</strong> treated material to <strong>the</strong> pile (not <strong>in</strong>cluded <strong>in</strong> <strong>the</strong><br />
previous cost sections) as KEECO differentiated<br />
treatment <strong>from</strong> residuals handl<strong>in</strong>g <strong>in</strong> <strong>the</strong>se costs. It is<br />
expected that <strong>the</strong> project would generate one drum <strong>of</strong><br />
contam<strong>in</strong>ated PPE each week. Assum<strong>in</strong>g a disposal<br />
cost <strong>of</strong> $500 per drum, <strong>the</strong> disposal cost for PPE was<br />
estimated at $26,000. The total cost <strong>of</strong> residuals, waste<br />
shipp<strong>in</strong>g, handl<strong>in</strong>g and transport was estimated to be<br />
$6,474,500.<br />
(10) Analytical Services: It was assumed that 4<br />
composite samples would be taken each day: one per<br />
shift per facility. It was also assumed that <strong>the</strong> sample<br />
number would be <strong>in</strong>creased by 10% to provide QA/QC<br />
samples. With an assumed cost <strong>of</strong> $90 per sample to<br />
analyze for leachable mercury, <strong>the</strong> estimated cost for<br />
analytical services is $97,800.<br />
(11) Ma<strong>in</strong>tenance and Modifications: Ma<strong>in</strong>tenance<br />
costs vary with <strong>the</strong> nature <strong>of</strong> <strong>the</strong> wastes, and <strong>the</strong> time<br />
between failures <strong>of</strong> <strong>the</strong> equipment. For <strong>the</strong> purposes <strong>of</strong><br />
this cost estimate, <strong>the</strong>se costs were assumed to be 2%<br />
<strong>of</strong> <strong>the</strong> cost <strong>of</strong> facilities and equipment and were<br />
estimated at $38,480.<br />
(12) Demobilization/Site Restoration: It was assumed<br />
that a total <strong>of</strong> 10 days would be required for
demobilization activities. It was fur<strong>the</strong>r assumed that <strong>the</strong><br />
entire project staff would be <strong>in</strong>volved <strong>in</strong> <strong>the</strong><br />
demobilization effort. Demobilization efforts will <strong>in</strong>clude<br />
facility dismantlement, equipment decontam<strong>in</strong>ation, and<br />
transportation. It is assumed that demolition <strong>of</strong> <strong>the</strong><br />
mix<strong>in</strong>g pads would not be required. Costs for <strong>the</strong><br />
demobilization effort were estimated at $157,000.<br />
3.7 Cost Summary<br />
Table 3-2 presents <strong>the</strong> summarized costs by category<br />
for treat<strong>in</strong>g <strong>the</strong> SBMM piles. The volume <strong>of</strong> material at<br />
<strong>the</strong> SBMM site is extremely high compared to most<br />
waste sites, result<strong>in</strong>g <strong>in</strong> very large figures <strong>in</strong> <strong>the</strong> cost<br />
estimates; however <strong>the</strong> cost per cubic yard <strong>of</strong> treated<br />
material by ei<strong>the</strong>r technology is <strong>in</strong> <strong>the</strong> low end <strong>of</strong> <strong>the</strong> cost<br />
range for comparable stabilization technologies. A study<br />
Table 3-2. Cost Summary.<br />
ITEM<br />
Category<br />
Cost*<br />
conducted for <strong>EPA</strong> <strong>in</strong> 1997 entitled “Recent<br />
Developments for In Situ Treatment <strong>of</strong> Metal<br />
Contam<strong>in</strong>ated Soils” reported that, accord<strong>in</strong>g to vendors<br />
<strong>of</strong> stabilization technologies, <strong>in</strong> situ applications range<br />
<strong>from</strong> $20 to $40 per cubic yard for treatment under<br />
optimum conditions, rang<strong>in</strong>g upwards to $200 to treat<br />
high concentrations at great depths.<br />
The cost estimates were developed <strong>in</strong>dependently by<br />
<strong>the</strong> vendors (with additions as noted) and because <strong>of</strong><br />
differences <strong>in</strong> exclusions and assumptions, cannot be<br />
used for direct cost comparisons, but do provide an<br />
overview <strong>of</strong> cost magnitudes and a breakdown <strong>in</strong>to cost<br />
categories and percentages <strong>of</strong> total costs. KEECO<br />
<strong>in</strong>cluded work<strong>in</strong>g capital and cont<strong>in</strong>gency f<strong>in</strong>anc<strong>in</strong>g <strong>in</strong><br />
<strong>the</strong>ir startup costs, and ECWI did not <strong>in</strong>clude <strong>the</strong>se <strong>in</strong><br />
<strong>the</strong>ir estimate, but <strong>the</strong>y would be relevant costs to any<br />
ECWI KEECO<br />
Percent <strong>of</strong> Total<br />
Cost<br />
Category<br />
Cost*<br />
Percent <strong>of</strong> Total<br />
Cost<br />
Site Preparation $40,000** 0.1% $840,000 2.4%<br />
Permitt<strong>in</strong>g and Regulatory $20,000** 0.0% $62,500 0.2%<br />
Equipment $1,633,500 2.7% $1,284,000 3.6%<br />
Startup and Fixed $45,000 0.1% $367,200 1.0%<br />
Labor $903,300 1.5% $2,986,800 8.4%<br />
Chemical Reagent $57,008,000 95.3% $23,107,000 64.7%<br />
O<strong>the</strong>r Supplies & Consumables $50,840 0.1% $254,370 0.7%<br />
Utilities $26,145 0.0% $20,600 0.1%<br />
Effluent Treatment & Disposal $0 0.0% $0 0.0%<br />
Residuals and <strong>Waste</strong> Handl<strong>in</strong>g $0 0.0% $6,474,500 18.1%<br />
Analytical $10,400 0.0% $97,800 0.3%<br />
Ma<strong>in</strong>tenance & Modifications $25,000 0.0% $38,480 0.1%<br />
Site Demobilization $45,000 0.1% $157,000 0.4%<br />
Total Operat<strong>in</strong>g Costs $59,807,000 100.0% $35,690,000 100.0%<br />
Cost per Ton $27.82 $16.60<br />
*Costs rounded to a maximum <strong>of</strong> five significant digits.<br />
**Costs for this category not provided by vendor; assumed value as described <strong>in</strong> Section 3.6.1.<br />
3-10
project. The largest area <strong>of</strong> discrepancy, residuals<br />
handl<strong>in</strong>g, is a legitimate difference between <strong>the</strong> two<br />
processes, however, as <strong>the</strong> ENTHRALL ® process would<br />
not generate residuals whereas handl<strong>in</strong>g treated<br />
material is a major element <strong>of</strong> KEECO’s SME process.<br />
It is clear for both treatments that <strong>the</strong> chemical reagent<br />
is <strong>the</strong> largest cost factor, at $26,700,000 (68% <strong>of</strong> total<br />
costs) for SME and $57,008,000 (93.5% <strong>of</strong> total costs)<br />
for ENTHRALL ® . The vendors based <strong>the</strong>ir application<br />
ratios on <strong>the</strong> amounts used <strong>in</strong> <strong>the</strong> treatability study, and<br />
if it was determ<strong>in</strong>ed that <strong>the</strong> quantity required for a field<br />
application was reduced, <strong>the</strong>n associated reagent costs<br />
would also be lower. Nei<strong>the</strong>r vendor <strong>in</strong>dicated any cost<br />
reduction for high volume usage.<br />
The equipment cost <strong>of</strong> $1,633,500 for <strong>the</strong> Enthrall ®<br />
treatment constitutes only 2.7% <strong>of</strong> <strong>the</strong> total, but is <strong>the</strong><br />
second highest cost category. KEECO’s process is<br />
unusual <strong>in</strong> that it requires residual handl<strong>in</strong>g to <strong>the</strong> extent<br />
that it is <strong>the</strong> second highest cost factor, lower<strong>in</strong>g <strong>the</strong><br />
equipment costs to <strong>the</strong> fourth highest category despite<br />
<strong>the</strong> $1,283,000 estimated cost.<br />
3-11
4.1 Pre-demonstration Studies<br />
Pre-demonstration studies were undertaken to: (1) atta<strong>in</strong><br />
a suitable test material with sufficient mercury<br />
leachability for treatability test<strong>in</strong>g; (2) elucidate <strong>the</strong><br />
mechanism(s) <strong>of</strong> mercury leach<strong>in</strong>g to develop<br />
appropriate test<strong>in</strong>g procedures; and (3) provide samples<br />
<strong>of</strong> material to vendors, along with <strong>the</strong> test<strong>in</strong>g criteria, to<br />
optimize <strong>the</strong>ir processes prior to <strong>the</strong> large-scale<br />
treatability studies.<br />
Leachability methods for solid waste were developed to<br />
simulate <strong>the</strong> leach<strong>in</strong>g behavior <strong>of</strong> <strong>the</strong> material when<br />
subjected to specific solutions and conditions. For<br />
example, <strong>the</strong> Toxicity Characteristics Leachability<br />
Procedure (TCLP) and <strong>the</strong> Syn<strong>the</strong>tic Precipitation<br />
Leachability Procedure (SPLP) were developed for<br />
simulat<strong>in</strong>g <strong>the</strong> leach<strong>in</strong>g conditions for landfilled wastes.<br />
The Meteoric Water Mobility Procedure (MWMP) and<br />
<strong>the</strong> Humidity Cell Procedure were developed specifically<br />
to simulate <strong>the</strong> conditions encountered by m<strong>in</strong><strong>in</strong>g waste.<br />
Each leachability procedure may provide different<br />
results, based on <strong>the</strong> leach<strong>in</strong>g fluids used, duration,<br />
leachate preparation, and nature <strong>of</strong> <strong>the</strong> waste material.<br />
In order to quantitatively evaluate <strong>the</strong> effectiveness <strong>of</strong><br />
<strong>the</strong> stabilization technologies tested for <strong>the</strong> mercury<br />
contam<strong>in</strong>ated SBMM material, it was necessary to<br />
identify both a suitable material and leach<strong>in</strong>g protocol.<br />
The objectives for <strong>the</strong> study required a material with<br />
leachable levels <strong>of</strong> mercury so that a reduction <strong>of</strong> 90%<br />
<strong>from</strong> a control could be observed. Fur<strong>the</strong>rmore, <strong>the</strong><br />
leach<strong>in</strong>g protocol would need to simulate <strong>the</strong> generation<br />
<strong>of</strong> mercury <strong>from</strong> <strong>the</strong> SBMM material so that <strong>the</strong><br />
stabilization technologies could appropriately control <strong>the</strong><br />
types and levels <strong>of</strong> mercury be<strong>in</strong>g generated <strong>from</strong> <strong>the</strong><br />
site.<br />
4.1.1 SPLP Characterizations<br />
Leachability characterizations <strong>of</strong> materials <strong>from</strong> several<br />
locations at <strong>the</strong> SBMM site us<strong>in</strong>g <strong>the</strong> SPLP method<br />
Section 4.0<br />
Treatment Effectiveness<br />
4-1<br />
demonstrated generally low overall mercury leachability.<br />
Figure 4-1 is an aerial photograph <strong>of</strong> <strong>the</strong> SBMM<br />
depict<strong>in</strong>g <strong>the</strong> locations <strong>of</strong> samples collected for SPLP<br />
characterization. Table 4-1 presents <strong>the</strong> SPLP results<br />
as well as <strong>the</strong> whole rock mercury values. The levels <strong>of</strong><br />
leachable mercury generated by <strong>the</strong> SPLP method for<br />
<strong>the</strong> tested materials were too low to be used <strong>in</strong> this<br />
technology evaluation. SPLP leachability was low even<br />
for materials exhibit<strong>in</strong>g high whole rock mercury values<br />
<strong>of</strong> 1,000 mg/Kg.<br />
Figure 4-1. Locations <strong>of</strong> samples <strong>from</strong> SBMM site.<br />
The lack <strong>of</strong> appreciable leachable mercury <strong>from</strong> SBMM<br />
materials despite high levels <strong>of</strong> whole rock mercury<br />
prompted additional studies to determ<strong>in</strong>e a suitable<br />
material and leach<strong>in</strong>g protocol for <strong>the</strong> technology<br />
evaluation. Fur<strong>the</strong>rmore, <strong>the</strong> additional studies<br />
<strong>in</strong>vestigated possible mechanisms <strong>of</strong> mercury<br />
leachability <strong>from</strong> SBMM materials.
Table 4-1. SPLP Leachability Results <strong>from</strong> Various SBMM <strong>Material</strong>s.<br />
LOCATION Total SPLP <strong>Mercury</strong><br />
<strong>Mercury</strong><br />
#1 <strong>Waste</strong> Rock - Shorel<strong>in</strong>e <strong>Material</strong> #1 (Middle Shorel<strong>in</strong>e Pile) 762 mg/Kg ND (0.2) µg/L<br />
#2 <strong>Waste</strong> Rock - Shorel<strong>in</strong>e <strong>Material</strong> #2 (Northwest Pit Shore) 37.5 mg/Kg ND (0.2) µg/L<br />
#3 <strong>Waste</strong> Rock - Shorel<strong>in</strong>e <strong>Material</strong> #3 (West Shorel<strong>in</strong>e Pile) 175 mg/Kg ND (0.2) µg/L<br />
#4 Drill Cutt<strong>in</strong>gs MW11D 0 to 25 feet 41.9 mg/Kg ND (0.2) µg/L<br />
#5 Drill Cutt<strong>in</strong>gs MW11D 25 to 45 feet 58.5 mg/Kg ND (0.2) µg/L<br />
#6 Drill Cutt<strong>in</strong>gs MW15D 0 to 20 feet 76.1 mg/Kg 1.39 µg/L<br />
#7 <strong>Mercury</strong> Ore (South Hill White Pile) 1000 mg/Kg 19.9 µg/L<br />
#8 <strong>Waste</strong> Rock (South Hill <strong>Waste</strong> rock Pile) 905 mg/Kg 10.5 µg/L<br />
#9 <strong>Waste</strong> Rock (North Side Gray Pile) 35 mg/Kg 0.47 µg/L<br />
#10 <strong>Waste</strong> Rock (North Side <strong>Waste</strong> rock Pile) 484 mg/Kg 9.84 µg/L<br />
4.1.2 Leachability Studies<br />
Roasted tail<strong>in</strong>gs <strong>from</strong> <strong>the</strong> site were used <strong>in</strong> a series <strong>of</strong><br />
studies to determ<strong>in</strong>e mechanisms <strong>of</strong> mercury<br />
leachability. The roasted tail<strong>in</strong>gs are material derived<br />
<strong>from</strong> <strong>the</strong> retort<strong>in</strong>g <strong>of</strong> <strong>the</strong> ore. This material was used<br />
because it exhibits consistent levels <strong>of</strong> whole rock<br />
mercury and constant particle size.<br />
Replicate analyses us<strong>in</strong>g <strong>the</strong> SPLP method on <strong>the</strong><br />
roasted material revealed consistent whole rock mercury<br />
values, but highly variable SPLP leachates (Table 4-2).<br />
Visual observations <strong>of</strong> <strong>the</strong> leachate <strong>from</strong> <strong>the</strong> SPLP<br />
extraction revealed a correlation between <strong>the</strong> visual<br />
turbidity <strong>of</strong> <strong>the</strong> sample and <strong>the</strong> concentration <strong>of</strong> mercury.<br />
This association prompted a more thorough evaluation<br />
<strong>of</strong> <strong>the</strong> relationship between leached particulates and<br />
extractable mercury.<br />
Table 4-2. Replicate SPLP Analyses on Roasted<br />
Tail<strong>in</strong>gs<br />
Total Hg SPLP Hg<br />
Replicate<br />
(mg/Kg) (µg/L)<br />
SBMM-RF#1 25.7 60<br />
SBMM-RF#2 26.6 195<br />
SBMM-RF#3 37.8 487<br />
The orig<strong>in</strong>al roasted tail<strong>in</strong>gs material tested <strong>in</strong> triplicate<br />
was fur<strong>the</strong>r studied. Triplicate samples <strong>of</strong> <strong>the</strong> roasted<br />
tail<strong>in</strong>gs were analyzed for total mercury (whole rock) and<br />
SPLP extractions. The extracts were filtered through a<br />
0.7µm filter (standard for <strong>the</strong> method) and analyzed for<br />
SPLP Hg, pH, total solids, and turbidity. The rema<strong>in</strong><strong>in</strong>g<br />
extract was filtered through a 0.45µm filter and analyzed<br />
for <strong>the</strong> same analytes, as well as a 0.2µm filter. The<br />
experiment resulted <strong>in</strong> <strong>the</strong> generation <strong>of</strong> n<strong>in</strong>e leachate<br />
samples (triplicate analyses at three levels <strong>of</strong> filtration).<br />
4-2<br />
Results form <strong>the</strong> experiment (Table 4-3) <strong>in</strong>dicates that<br />
total mercury was consistent between <strong>the</strong> three<br />
replicates (as observed <strong>in</strong> <strong>the</strong> orig<strong>in</strong>al analysis). SPLP<br />
mercury at <strong>the</strong> standard filtration (0.7µm) was lower but<br />
exhibited much lower variability as compared to <strong>the</strong><br />
orig<strong>in</strong>al triplicate analyses. SPLP mercury at <strong>the</strong> 0.45µm<br />
and 0.2µm levels produced ND at <strong>the</strong> 1.0 µg/L level.<br />
The results <strong>from</strong> <strong>the</strong> study suggested that leachable<br />
mercury is associated with particulates. Fur<strong>the</strong>rmore,<br />
<strong>the</strong>re is a strong association between <strong>the</strong> turbidity <strong>in</strong> <strong>the</strong><br />
sample and <strong>the</strong> level <strong>of</strong> filtration. Although <strong>the</strong> f<strong>in</strong>er<br />
filters produced non-detect values, <strong>the</strong>re is a correlation<br />
between <strong>the</strong> SPLP mercury and turbidity. The results<br />
<strong>from</strong> this experiment prompted an additional experiment<br />
to determ<strong>in</strong>e <strong>the</strong> relationship between particle size,<br />
turbidity, and leachable mercury.<br />
Results <strong>from</strong> <strong>the</strong> test are presented <strong>in</strong> Table 4-4. There<br />
is a strong relationship between level <strong>of</strong> filtration,<br />
turbidity, and mercury content. Fur<strong>the</strong>rmore, <strong>the</strong><br />
relationship between turbidity and mercury content is<br />
illustrated by plott<strong>in</strong>g <strong>the</strong> mercury values for <strong>the</strong> filtered<br />
samples <strong>from</strong> both <strong>the</strong> SPLP and modified MWMP test<br />
(Figure 4-2). There is a high correlation between <strong>the</strong><br />
turbidity <strong>of</strong> <strong>the</strong> sample and <strong>the</strong> mercury content <strong>of</strong> <strong>the</strong><br />
leachate. This suggests that mercury <strong>in</strong> leachate<br />
samples is associated with particulates <strong>of</strong> various sizes,<br />
and is not predom<strong>in</strong>ately found <strong>in</strong> a dissolved state.
Turbidity (NTU)<br />
160<br />
140<br />
120<br />
100<br />
80<br />
60<br />
Table 4-3. Results <strong>of</strong> Triplicate SPLP Leach<strong>in</strong>g Experiment<br />
Total Hg<br />
(mg/Kg)<br />
Report<strong>in</strong>g SPLP Report<strong>in</strong>g pH Total<br />
Limit (µg/L) Limit (SU) Solids<br />
(mg/Kg) (µg/L) (mg/L)<br />
Turbidity<br />
(NTU)<br />
Replicate 1 24 0.049<br />
0.7µm 3.0 1.00 6.15 64 29.2<br />
0.45µm ND 1.00 3.26 48 7.24<br />
0.2µm ND 1.00 2.85 58 0.35<br />
Replicate 2 23 0.052<br />
0.7µm 5.2 1.00 7.09 24 40.2<br />
0.45µm ND 1.00 3.63 24 0.58<br />
0.2µm ND 1.00 3.19 10 0.43<br />
Replicate 3 22 0.049<br />
0.7µm 3.6 1.00 6.89 34 36.1<br />
0.45µm ND 1.00 3.85 26 0.59<br />
0.2µm ND 1.00 6.13 ND 0.49<br />
R 2 = 0.9863<br />
Table 4-4. Results <strong>from</strong> <strong>the</strong> Modified MWMP Leachate<br />
Test with Variable Filtration<br />
40 All filter blanks, Hg = ND<br />
0.7 µm filter blank had turbidity = 0.28<br />
20<br />
0<br />
0 5 10<br />
Leachable Hg (ug/L)<br />
15 20<br />
Figure 4-2. Turbidity and leachable mercury<br />
<strong>from</strong> SPLP and MWMP tests.<br />
4-3<br />
Filtration Hg pH Turbidity<br />
Level<br />
µg/L<br />
(NTU)<br />
Unfiltered 402 4.07 362<br />
25 µm 18.2 4.31 140<br />
8 µm 7.4 4.25 64<br />
2.5 µm 1.2 4.25 3.5<br />
1 µm 0.7 4.25 0.76<br />
0.7 µm 0.6 4.65 1.17<br />
4.1.3 Geochemical and M<strong>in</strong>eralogical Evaluation <strong>of</strong><br />
Particulates<br />
A m<strong>in</strong>eralogical and geochemical study was performed<br />
at <strong>the</strong> City College <strong>of</strong> New York to characterize <strong>the</strong><br />
particulate fractions generated dur<strong>in</strong>g leach<strong>in</strong>g and to<br />
identify potential mechanisms for release and transport.<br />
Roasted tail<strong>in</strong>gs were placed <strong>in</strong> distilled water for three<br />
weeks without agitation. The water immediately became
cloudy, and <strong>the</strong> degree <strong>of</strong> turbidity appeared to per sist<br />
unchanged throughout <strong>the</strong> three week period.<br />
Characterizations were performed both on f<strong>in</strong>es that<br />
were suspended <strong>in</strong> <strong>the</strong> water and on particles re-<br />
suspended by stirr<strong>in</strong>g <strong>the</strong> mixture. Both <strong>the</strong> suspended<br />
particles and <strong>the</strong> particles re-suspended (stirred) are<br />
termed auto-released solids due to <strong>the</strong>ir ability to easily<br />
dissociate <strong>from</strong> <strong>the</strong> solid matrix.<br />
C background is <strong>the</strong> number <strong>of</strong> counts at ± 1 degree<br />
<strong>of</strong> <strong>the</strong> peak maximum, and<br />
W is <strong>the</strong> microgram weight <strong>of</strong> <strong>the</strong> clay.<br />
The adjusted counts <strong>in</strong>dicate <strong>the</strong> distribution <strong>of</strong> mercury<br />
with<strong>in</strong> <strong>the</strong> sample irrespective <strong>of</strong> <strong>the</strong> amount captured on<br />
a given sieve. S<strong>in</strong>ce <strong>the</strong> actual weight <strong>of</strong> sample is<br />
greater toward <strong>the</strong> larger sieve sizes, <strong>the</strong> relative error<br />
<strong>in</strong>creases as <strong>the</strong> sieve-size decreases. The plot <strong>of</strong> this<br />
distribution (Figure 4-3) <strong>in</strong>dicates that <strong>the</strong> bulk <strong>of</strong> <strong>the</strong><br />
mercury is carried by <strong>the</strong> 10 to 20 micron clay fraction,<br />
but that a given amount <strong>of</strong> mercury is present <strong>in</strong> all sieve<br />
fractions, <strong>in</strong>clud<strong>in</strong>g <strong>the</strong>
The follow<strong>in</strong>g tests were performed:<br />
Matrix # <strong>of</strong> Tests Test Duration<br />
Roasted tail<strong>in</strong>gs 5 24 hrs<br />
72 hrs<br />
1 week<br />
2 weeks<br />
4 weeks<br />
<strong>Waste</strong> Rock (spl#1) 2 24 hrs<br />
2 weeks<br />
<strong>Waste</strong> Rock (spl#10) 2 24 hrs<br />
2 weeks<br />
The leachate <strong>from</strong> each test was split, with one-half <strong>of</strong><br />
<strong>the</strong> sample set-aside for unfiltered analyses, while <strong>the</strong><br />
second-half <strong>of</strong> <strong>the</strong> leachate sample was filtered through<br />
a 0.45µm filter. The leachate samples (unfiltered and<br />
filtered) were analyzed for <strong>the</strong> follow<strong>in</strong>g analytes:<br />
mercury, sulfate, pH, turbidity, and total solids.<br />
Analytical results <strong>from</strong> <strong>the</strong> study are presented <strong>in</strong> Table<br />
4-5. For <strong>the</strong> roasted tail<strong>in</strong>gs, and as <strong>in</strong> previous studies,<br />
mercury appears to be associated with <strong>the</strong> particulate<br />
fraction (>0.45µm). For <strong>the</strong> unfiltered samples, mercury<br />
leachability is lower for <strong>the</strong> two week and 4 week<br />
samples. <strong>Mercury</strong> leachability, <strong>the</strong>refore, does not<br />
<strong>in</strong>crease with longer leach<strong>in</strong>g cycles, and actually<br />
decreases. For <strong>the</strong> filtered samples, mercury<br />
concentration is low and variable. There is no <strong>in</strong>dication<br />
that extended leach<strong>in</strong>g results <strong>in</strong> <strong>the</strong> generation <strong>of</strong><br />
significant dissolved mercury.<br />
<strong>Waste</strong> Rock spl#1 exhibited <strong>the</strong> highest leachable<br />
mercury concentration <strong>of</strong> <strong>the</strong> unfiltered samples.<br />
Table 4-5. Results <strong>from</strong> <strong>the</strong> Extended Leachability Study<br />
Although high particulate mercury concentrations were<br />
encountered, filtered mercury was low. The sample<br />
completely dissociated after five days <strong>in</strong>to a hydrous<br />
clay, necessitat<strong>in</strong>g cessation <strong>of</strong> <strong>the</strong> leach<strong>in</strong>g tests. The<br />
hydrous clay was submitted to CCNY for<br />
characterization. The sample was characterized as a<br />
mixture <strong>of</strong> two clays with properties similar to <strong>the</strong> autoreleased<br />
clays <strong>from</strong> <strong>the</strong> first roaster f<strong>in</strong>e study.<br />
Fur<strong>the</strong>rmore, <strong>the</strong> sample conta<strong>in</strong>ed very high mercury<br />
content as measured by X-ray fluorescence. The<br />
complete dissociation <strong>of</strong> <strong>the</strong> sample and <strong>the</strong> presence <strong>of</strong><br />
high mercury content <strong>in</strong> <strong>the</strong> clay fraction provide fur<strong>the</strong>r<br />
evidence for a particulate transport mechanism.<br />
Extended leach<strong>in</strong>g <strong>of</strong> <strong>the</strong> waste rock spl #10 failed to<br />
provide significant concentrations <strong>of</strong> mercury <strong>in</strong> ei<strong>the</strong>r<br />
<strong>the</strong> unfiltered and filtered fractions. There is some limited<br />
evidence that mercury content decreases over time <strong>in</strong><br />
both fractions.<br />
4.1.5 Conclusions <strong>from</strong> Leachability and<br />
Characterization Studies<br />
The follow<strong>in</strong>g conclusions are based on <strong>the</strong> results <strong>from</strong><br />
<strong>the</strong> previously discussed studies:<br />
• <strong>Mercury</strong> is found associated with particulates that<br />
auto-release <strong>from</strong> SBMM material and can rema<strong>in</strong><br />
suspended, and <strong>the</strong>refore mobile, <strong>in</strong> solution. There<br />
is no strong evidence <strong>from</strong> any <strong>of</strong> <strong>the</strong> leach<strong>in</strong>g<br />
studies that a dissolved mercury fraction exists <strong>in</strong><br />
<strong>the</strong> leachate.<br />
• There may be clays <strong>in</strong> <strong>the</strong> material that are easily<br />
dissociable, conta<strong>in</strong> mercury, and can be suspended<br />
and transported <strong>in</strong> an aqueous medium. S<strong>in</strong>ce <strong>the</strong><br />
clays are expanded layer smectites, <strong>the</strong> mercury<br />
Unfiltered Filtered (0.45um)<br />
Total Total<br />
Hg pH Sulfate Turbidity Solids Hg pH Sulfate Turbidity Solids<br />
Sample (ug/L) (m g/L) N TU (m g/L) (ug/L) (m g/L) NT U (m g/L)<br />
Roasted T ail<strong>in</strong>gs 24 hrs 20.0 6.86 9.7 434 333 3.30 7.26 10.2 19.4 NA<br />
RoastedT ail<strong>in</strong>gs 72 hrs 14.0 7.52 10 154 250 2.30 7.4 10.1 5.77 NA<br />
Roasted T ail<strong>in</strong>gs 1 week 16.0 7.25 10.4 188 190 1.50 7.71 7.8 4.42 NA<br />
Roasted T ail<strong>in</strong>gs 2 weeks 8.3 7.38 10.2 90.1 220 ND (1.2) 7.12 10.3 25.1 NA<br />
Roasted T ail<strong>in</strong>gs 4 weeks 2.5 7.18 15.1 99.6 200 8.3 7.32 13.9 36.2 NA<br />
W aste Rock (spl #10) 24 hrs ** 96.1 3.11 7010 155 9110 2.20 3.13 5270 0.42 NA<br />
W aste Rock (spl #10) 24 hrs 9.0 3.04 2630 4.9 3440 6.00 3.09 2350 0.52 NA<br />
W aste Rock (spl#10) 2 W eeks 7.5 3.15 2360 8.15 3300 ND (2.5) 3.24 2210 0.1 NA<br />
** spl #1 was observed to com pletely dissociate to a clay-m ud after approx. 5 days<br />
NA = Not Applicable<br />
ND = N on detectable at level <strong>in</strong> paren<strong>the</strong>ses<br />
NR = Not Reported<br />
4-5
may be bonded with<strong>in</strong> <strong>the</strong> <strong>in</strong>terlayers. These clays<br />
may be associated with <strong>the</strong> ore and rock, or may<br />
exist as discrete deposits that were segregated<br />
dur<strong>in</strong>g <strong>the</strong> m<strong>in</strong><strong>in</strong>g process.<br />
• <strong>Mercury</strong> associated with <strong>the</strong> particulates may<br />
undergo fur<strong>the</strong>r chemical and biological diagenetic<br />
changes <strong>in</strong> <strong>the</strong> groundwater and/or lake environment<br />
that release dissolved mercury dur<strong>in</strong>g transport.<br />
• The remedial solution may require technologies that<br />
can control <strong>the</strong> release <strong>of</strong> particulates <strong>from</strong> SBMM<br />
materials.<br />
• The leach<strong>in</strong>g protocol for <strong>the</strong> stabilization evaluation<br />
should simulate <strong>the</strong> generation <strong>of</strong> mercury-laden<br />
particulates <strong>from</strong> a solid matrix.<br />
4.1.6 Pre-demonstration K<strong>in</strong>etic Column Studies<br />
A k<strong>in</strong>etic column configuration was <strong>in</strong>vestigated as a<br />
leach<strong>in</strong>g protocol for evaluat<strong>in</strong>g <strong>the</strong> effectiveness <strong>of</strong> <strong>the</strong><br />
stabilization technologies. In <strong>the</strong> k<strong>in</strong>etic column,<br />
leach<strong>in</strong>g solutions are cont<strong>in</strong>uously passed over <strong>the</strong><br />
material. For this evaluiation material <strong>from</strong> <strong>the</strong> south<br />
white gate pile (“mercury ore”) and “waste rock” were<br />
tested. For <strong>the</strong> mercury ore material, whole rock<br />
mercury concentrations ranged <strong>from</strong> 300-1360 mg/Kg<br />
and SPLP mercury concentrations as high as 113 µg/L<br />
were encountered (Table 4-6). For <strong>the</strong> waste rock<br />
material, whole rock mercury concentrations ranged<br />
<strong>from</strong> 130 to 450 mg/Kg with leachable mercury below 10<br />
µg/L <strong>in</strong> all three samples. Two k<strong>in</strong>etic column studies<br />
were <strong>in</strong>itiated for each <strong>of</strong> <strong>the</strong> materials. For one set <strong>of</strong><br />
experiments, leachant (15 L de-ionized water adjusted to<br />
a pH <strong>of</strong> 5) was applied to <strong>the</strong> column <strong>in</strong> flow-through<br />
Table 4-6. <strong>Mercury</strong> <strong>in</strong> Untreated <strong>Mercury</strong> Ore and<br />
<strong>Waste</strong> Rock<br />
Matrix<br />
<strong>Mercury</strong><br />
Ore<br />
<strong>Waste</strong><br />
Rock<br />
mode<br />
Total Hg SPLP Hg<br />
(mg/Kg)<br />
(µg/L)<br />
751 37<br />
312 0.5<br />
1360 113<br />
447 1.5<br />
441 0.9<br />
130 5.6<br />
as a s<strong>in</strong>gle-pass leach. The second set <strong>of</strong> experiments<br />
used approximately 15 liters <strong>of</strong> <strong>the</strong> solution <strong>in</strong> a recycle<br />
mode. Leachate was analyzed for mercury both as <strong>in</strong> an<br />
4-6<br />
unfiltered sample and filtered through a 0.45µm filter.<br />
The results, presented <strong>in</strong> Table 4-7, <strong>in</strong>dicated that: (1)<br />
<strong>the</strong> flow-through method generated higher and more<br />
consistent leachable mercury, (2) <strong>the</strong> unfiltered samples<br />
conta<strong>in</strong>ed significantly higher levels <strong>of</strong> mercury, and (3)<br />
<strong>the</strong> mercury ore material generated significantly higher<br />
levels <strong>of</strong> leachable mercury. Based on <strong>the</strong>se results a<br />
k<strong>in</strong>etic column leach<strong>in</strong>g protocol us<strong>in</strong>g mercury ore<br />
material <strong>from</strong> <strong>the</strong> site and focus<strong>in</strong>g on control <strong>of</strong> <strong>the</strong><br />
particulate fraction would be relevant for evaluat<strong>in</strong>g <strong>the</strong><br />
performance <strong>of</strong> <strong>the</strong> stabilization technologies.<br />
4.2 Project Objectives<br />
For all MWTP and SITE projects, specific objectives are<br />
def<strong>in</strong>ed <strong>in</strong> a Quality Assurance Project Plan (QAPP)<br />
prior to <strong>the</strong> <strong>in</strong>itiation <strong>of</strong> treatability studies or fieldwork.<br />
The QAPP specifies <strong>the</strong> objectives to be achieved and<br />
provides experimental design. This section states <strong>the</strong><br />
project objectives and summarizes each <strong>of</strong> <strong>the</strong><br />
experiments performed as part <strong>of</strong> <strong>the</strong> treatability study.<br />
4.2.1 Primary and Secondary Objectives<br />
Objectives are subdivided <strong>in</strong>to two categories: primary<br />
and secondary. Primary objectives are those goals <strong>of</strong><br />
<strong>the</strong> project that must be achieved <strong>in</strong> order to adequately<br />
compare demonstration results with <strong>the</strong> claims made by<br />
<strong>the</strong> developer(s). The analytical results and field<br />
measurements required for achiev<strong>in</strong>g primary objectives<br />
are referred to as critical measurements. Secondary<br />
objectives are specified to obta<strong>in</strong> additional <strong>in</strong>formation<br />
<strong>of</strong> <strong>in</strong>terest about <strong>the</strong> technology, but are not imperative<br />
for validat<strong>in</strong>g developer claims. The data and field<br />
measurements required for achiev<strong>in</strong>g secondary<br />
objectives are referred to as noncritical measurements.<br />
Immobilization <strong>of</strong> mercury <strong>in</strong> material <strong>from</strong> <strong>the</strong> Sulfur<br />
Bank <strong>Mercury</strong> M<strong>in</strong>e (SBMM) was <strong>the</strong> goal <strong>of</strong> <strong>the</strong><br />
treatments used <strong>in</strong> this treatability study. The objectives<br />
<strong>of</strong> <strong>the</strong> study are to evaluate <strong>the</strong> technologies’ ability to<br />
achieve this end. Primary objective satisfaction was<br />
evaluated by treat<strong>in</strong>g “mercury ore” material <strong>from</strong> <strong>the</strong><br />
site. The same test<strong>in</strong>g process was applied to “waste<br />
rock” material to achieve secondary objectives. The<br />
actual test<strong>in</strong>g procedures are described <strong>in</strong> <strong>the</strong>ir<br />
respective sections below. The success <strong>of</strong> <strong>the</strong> various<br />
treatments was evaluated by measur<strong>in</strong>g <strong>the</strong> parameters<br />
as specified <strong>in</strong> Table 4-8.
Table 4-7: K<strong>in</strong>etic Column Leachability Study<br />
Unfiltered<br />
Table 4-8. Treatability Study Test Parameters<br />
Matrix Parameter Classification Type Purpose<br />
K<strong>in</strong>etic Test Column <strong>Mercury</strong>-dissolved Non-critical Analytical Primary objective: evaluat<strong>in</strong>g<br />
Leachates - (
4.2.1.2 Secondary Objectives<br />
Secondary objectives are designed to provide<br />
<strong>in</strong>formation, <strong>in</strong> addition to <strong>the</strong> critical parameters, for<br />
evaluat<strong>in</strong>g <strong>the</strong> effectiveness <strong>of</strong> technology applications.<br />
The secondary objectives are:<br />
Assess <strong>Mercury</strong> Contam<strong>in</strong>ant Reduction <strong>in</strong> Treated<br />
<strong>Waste</strong> Rock Test <strong>Material</strong>: The same k<strong>in</strong>etic column<br />
leach test that was described for <strong>the</strong> primary mercury<br />
ore material was also run on <strong>the</strong> waste rock material,<br />
with results be<strong>in</strong>g evaluated <strong>in</strong> <strong>the</strong> manner described<br />
above. The waste rock material columns were not run <strong>in</strong><br />
triplicate, but were run <strong>in</strong> duplicate for <strong>the</strong> control and<br />
s<strong>in</strong>gle for <strong>the</strong> treatments.<br />
Evaluate Leachate Quality After Treatment and<br />
Dur<strong>in</strong>g Column Test<strong>in</strong>g: Dur<strong>in</strong>g and at <strong>the</strong> end <strong>of</strong> <strong>the</strong><br />
column leach tests, filtered samples were analyzed for<br />
parameters <strong>in</strong> addition to mercury, <strong>in</strong> order to assess<br />
changes <strong>in</strong> <strong>the</strong> leachate chemistry. Samples were<br />
analyzed for <strong>the</strong> additional metals: arsenic, iron, and<br />
antimony, as well as pH, redox potential, sulfate, sulfide,<br />
conductivity, alkal<strong>in</strong>ity/acidity, and turbidity. This<br />
analysis was done on both mercury ore and waste rock<br />
column effluents.<br />
Evaluate M<strong>in</strong>eralogical Changes <strong>in</strong> <strong>the</strong> Treated<br />
<strong>Material</strong>: Samples <strong>of</strong> <strong>the</strong> mercury ore material were<br />
collected after reagents had been applied, but before<br />
leach<strong>in</strong>g was begun for <strong>the</strong> evaluation <strong>of</strong> <strong>the</strong><br />
m<strong>in</strong>eralogical changes that may have occurred dur<strong>in</strong>g<br />
treatment. M<strong>in</strong>eralogical analyses <strong>in</strong>cluded x-ray<br />
diffraction, x-ray fluorescence and optical m<strong>in</strong>eralogy.<br />
Humidity Cell Test Protocol Us<strong>in</strong>g <strong>the</strong> <strong>Mercury</strong> Ore<br />
<strong>Material</strong>: <strong>Mercury</strong> ore material that had been treated<br />
but not leached was subjected to <strong>the</strong> Humidity Cell Test<br />
procedure. Leachate <strong>from</strong> <strong>the</strong> test was evaluated for<br />
both dissolved (
triplicate samples and an additional quantity <strong>of</strong> treated<br />
material for physical and chemical <strong>in</strong>vestigations, SPLP<br />
and humidity cell test<strong>in</strong>g. In situ application was<br />
accomplished by load<strong>in</strong>g <strong>the</strong> material <strong>in</strong>to <strong>the</strong> columns <strong>in</strong><br />
“lifts” <strong>of</strong> approximately 5 to 7 <strong>in</strong>ches, with first and last<br />
lifts hav<strong>in</strong>g somewhat more variability <strong>in</strong> depth. As each<br />
lift was placed, a liquid form <strong>of</strong> <strong>the</strong> reagent was added<br />
by <strong>the</strong> use <strong>of</strong> a garden sprayer, which allowed <strong>the</strong><br />
solution to be <strong>in</strong>jected <strong>in</strong>to <strong>the</strong> material. This procedure<br />
was repeated until four kilograms had been treated <strong>in</strong><br />
each column.<br />
E&C Williams provided <strong>the</strong> ENTHRALL ® reagent <strong>in</strong> a<br />
concentrated form, which was diluted with three parts<br />
deionized water to one part product. The four treatment<br />
columns with mercury ore material were each loaded <strong>in</strong><br />
seven lifts. A total <strong>of</strong> 300 ml treatment solution was<br />
applied to each column as described above.<br />
Phosphate treatment was provided <strong>in</strong> liquid form and<br />
was diluted with one part deionized water to three parts<br />
phosphate. Four columns were loaded with mercury ore<br />
material and treated <strong>in</strong> six lifts, as described above and<br />
300 ml <strong>of</strong> <strong>the</strong> diluted phosphate was applied to each<br />
column.<br />
KEECO’s KB-1 product was applied to <strong>the</strong> mercury ore<br />
material for <strong>the</strong> <strong>in</strong> situ treatments. The reagent was<br />
applied as-supplied, with 1,184 ml be<strong>in</strong>g applied to each<br />
4,000 gram column load. The first and last lifts were 3<br />
<strong>in</strong>ches deep, with <strong>in</strong>termediate lifts be<strong>in</strong>g 6 to 6.5 <strong>in</strong>ches<br />
thick. Aga<strong>in</strong>, four columns were treated <strong>in</strong> this manner<br />
to allow for leachability test<strong>in</strong>g <strong>in</strong> triplicate and enough<br />
treated material for fur<strong>the</strong>r test<strong>in</strong>g.<br />
S<strong>in</strong>ce test<strong>in</strong>g on <strong>the</strong> waste rock material was secondary<br />
to test<strong>in</strong>g on <strong>the</strong> mercury ore, a less <strong>in</strong>tensive regimen<br />
was prescribed. Columns were loaded and treated as<br />
above for leachability test<strong>in</strong>g, but <strong>in</strong>stead <strong>of</strong> treat<strong>in</strong>g an<br />
entire column to provide SPLP and laboratory analysis,<br />
a small amount <strong>of</strong> material was treated. A 500-gram<br />
sample <strong>of</strong> material was placed <strong>in</strong> a 500-ml sample jar<br />
and treated with <strong>the</strong> same ratio <strong>of</strong> reagent to material as<br />
was used <strong>in</strong> <strong>the</strong> columns with mercury ore material.<br />
Two columns were loaded with waste rock material and<br />
treated with E&C Williams’ ENTHRALL ® process as<br />
described above. As with <strong>the</strong> mercury ore material,<br />
each column was loaded with 4,000 grams <strong>of</strong> material<br />
and treated with a total <strong>of</strong> 300 ml ENTHRALL ® solution.<br />
A 500-gram portion <strong>of</strong> <strong>the</strong> material was treated with 37.5<br />
ml ENTHRALL ® for SPLP and laboratory analysis. The<br />
phosphate product was demonstrated on <strong>the</strong> waste rock<br />
material <strong>in</strong> <strong>the</strong> same manner, with <strong>the</strong> same quantities<br />
4-10<br />
be<strong>in</strong>g applied. Products were diluted as described for<br />
mercury ore material above.<br />
The KEECO treatments on <strong>the</strong> waste rock material were<br />
only tested <strong>in</strong> one column each. For <strong>the</strong> ex situ<br />
application, 217.84 grams <strong>of</strong> KB-Sea was mixed <strong>in</strong>to<br />
4,000 grams <strong>of</strong> waste rock material, and loaded <strong>in</strong>to a<br />
column. A 500 gram portion was treated with 27.23<br />
grams <strong>of</strong> reagent for lab analysis. In situ treatment <strong>of</strong><br />
<strong>the</strong> waste rock material was performed by load<strong>in</strong>g <strong>the</strong><br />
column <strong>in</strong> lifts, as previously described, and apply<strong>in</strong>g<br />
KB-1 reagent to each lift. The <strong>in</strong>itial and f<strong>in</strong>al lifts were<br />
three <strong>in</strong>ches deep, with <strong>in</strong>termediate lifts be<strong>in</strong>g 6-6.5<br />
<strong>in</strong>ches thick. A total <strong>of</strong> 1,305 ml <strong>of</strong> KB-1 was applied to<br />
<strong>the</strong> column.<br />
Three columns were each loaded with 4,000 grams <strong>of</strong><br />
mercury ore material and two columns were loaded with<br />
<strong>the</strong> same amount <strong>of</strong> waste rock material. These were<br />
<strong>the</strong> experimental controls for <strong>the</strong> test<strong>in</strong>g that was to<br />
follow.<br />
K<strong>in</strong>etic leach test<strong>in</strong>g was <strong>the</strong>n used to determ<strong>in</strong>e <strong>the</strong><br />
success <strong>of</strong> <strong>the</strong> treatments. Deionized-distilled water, pH<br />
adjusted to 5.0, was applied at a constant rate <strong>of</strong> 0.09<br />
L/hr, with leachate be<strong>in</strong>g collected weekly. The orig<strong>in</strong>al<br />
design called for leach<strong>in</strong>g to cont<strong>in</strong>ue for a m<strong>in</strong>imum <strong>of</strong> 8<br />
weeks. The entire volume <strong>of</strong> effluent was collected and<br />
mixed weekly. After record<strong>in</strong>g <strong>the</strong> volume, <strong>the</strong> effluent<br />
was taken to <strong>the</strong> lab where measurements <strong>of</strong> turbidity,<br />
pH, conductivity and redox potential were taken.<br />
Approximately 3 to 4 liters <strong>of</strong> leachate was <strong>the</strong>n filtered<br />
through a 25µm filter for analysis <strong>of</strong> mobile mercury and<br />
through a 0.45µm filter for dissolved mercury analysis.<br />
Unfiltered samples <strong>from</strong> weeks 1, 4 and 8 were analyzed<br />
for total mercury to provide data on <strong>the</strong> relationship<br />
between total, dissolved and mobile mercury. Where<br />
necessary to satisfy secondary parameters, additional<br />
analysis was also performed, as detailed below.<br />
After <strong>the</strong> <strong>in</strong>itial eight week leach period, <strong>the</strong> columns<br />
were allowed to rest for four weeks. This was <strong>in</strong>tended<br />
to simulate a dry<strong>in</strong>g period dur<strong>in</strong>g which oxidation<br />
reactions would naturally occur <strong>in</strong> a dump or pile. If <strong>the</strong><br />
mercury leachability was due to chemical reactions,<br />
<strong>the</strong>re should have been a peak <strong>in</strong> mercury when<br />
leach<strong>in</strong>g was restarted. Follow<strong>in</strong>g <strong>the</strong> rest period, one<br />
column <strong>of</strong> each treatment type and one control was<br />
leached for ano<strong>the</strong>r four weeks.<br />
The column studies on <strong>the</strong> waste rock material were<br />
similar to <strong>the</strong> mercury ore column studies with <strong>the</strong><br />
exception that <strong>the</strong> KEECO treatments were tested on<br />
only one column each and E&C Williams’ columns and
<strong>the</strong> phosphate columns were run <strong>in</strong> duplicate. The<br />
waste rock material control columns were also run <strong>in</strong><br />
duplicate. Application rates and sampl<strong>in</strong>g were identical<br />
to <strong>the</strong> study on <strong>the</strong> mercury ore material.<br />
In addition to mercury analysis, weekly samples were<br />
analyzed for sulfate, sulfide, alkal<strong>in</strong>ity and acidity to<br />
satisfy secondary objectives. Sample splits for weeks 1,<br />
4 and 8 were also analyzed for <strong>the</strong> metals antimony,<br />
arsenic and iron.<br />
4.3.2 Humidity Cell Tests<br />
“Humidity cell” test<strong>in</strong>g, detailed <strong>in</strong> ASTM D 5744-96, is a<br />
protocol designed to meet k<strong>in</strong>etic test<strong>in</strong>g regulatory<br />
requirements for m<strong>in</strong><strong>in</strong>g wastes and ores. In this test<br />
method, <strong>the</strong> sample is subjected to alternate periods <strong>of</strong><br />
dry air, moist air and water leach<strong>in</strong>g <strong>in</strong> an effort to<br />
simulate <strong>the</strong> wea<strong>the</strong>r<strong>in</strong>g process that <strong>the</strong> ore would<br />
undergo <strong>in</strong> a natural environment. The rigorous<br />
conditions applied <strong>in</strong> <strong>the</strong> test design subject <strong>the</strong> material<br />
to potential worst-case scenarios <strong>in</strong> that <strong>the</strong> extreme<br />
changes <strong>from</strong> moist to dry air and complete wett<strong>in</strong>g <strong>of</strong><br />
<strong>the</strong> ore.<br />
For <strong>the</strong> treatability study, humidity cell test<strong>in</strong>g was<br />
performed on <strong>the</strong> mercury ore material only. A 1,000<br />
gram aliquot <strong>of</strong> each <strong>of</strong> <strong>the</strong> treated materials and <strong>the</strong><br />
untreated material was placed <strong>in</strong> each cell. To perform<br />
<strong>the</strong> <strong>in</strong>itial leach, one liter <strong>of</strong> deionized water was slowly<br />
added to each <strong>in</strong> a manner that would avoid hydraulic<br />
agitation. The flooded sample was allowed to sit for one<br />
hour, and <strong>the</strong>n <strong>the</strong> cell was dra<strong>in</strong>ed overnight <strong>in</strong>to a<br />
sample collection vessel. Dry air was <strong>the</strong>n <strong>in</strong>troduced<br />
<strong>in</strong>to <strong>the</strong> cell at a rate <strong>of</strong> two to three liters per m<strong>in</strong>ute for<br />
three days. This was followed by a wet air purge for <strong>the</strong><br />
follow<strong>in</strong>g three days. Wet air was created by us<strong>in</strong>g a<br />
humidifier with DI water at a temperature <strong>of</strong> 30+ 2°C.<br />
The wet air was supplied for three days at approximately<br />
<strong>the</strong> same rate. The first week’s test<strong>in</strong>g was completed<br />
by a Deionized water leach, as described above. The<br />
cycle <strong>of</strong> dry-air purge, wet-air purge and water leach was<br />
repeated weekly for a total <strong>of</strong> seven weeks after <strong>the</strong><br />
<strong>in</strong>itial water leach. Leachate was collected and analyzed<br />
for dissolved and mobile mercury, pH and turbidity,<br />
sulfate, sulfide and acidity/alkal<strong>in</strong>ity.<br />
4.3.3 M<strong>in</strong>eralogical and Geochemical Tests<br />
<strong>Mercury</strong> ore and waste rock samples were analyzed for<br />
m<strong>in</strong>eralogical parameters by optical microscopy, x-ray<br />
diffraction (XRD) and x-ray fluorescence (XRF) <strong>in</strong> <strong>the</strong><br />
Department <strong>of</strong> Earth and Atmospheric Sciences at <strong>the</strong><br />
City College <strong>of</strong> New York (CCNY).<br />
4-11<br />
X-ray diffraction is a technique for ga<strong>the</strong>r<strong>in</strong>g <strong>in</strong>formation<br />
about <strong>the</strong> structural state, <strong>in</strong>clud<strong>in</strong>g <strong>the</strong> degree <strong>of</strong><br />
crystall<strong>in</strong>ity <strong>of</strong> <strong>the</strong> materials <strong>in</strong> a sample. At <strong>the</strong> CCNY<br />
lab, <strong>the</strong> samples were pulverized <strong>in</strong> an agate mortar and<br />
pestle and mixed with a lanthanum boride standard.<br />
The samples were <strong>the</strong>n mounted on a quartz nonreflect<strong>in</strong>g<br />
holder and step-scanned at 0.02 degrees two<br />
<strong>the</strong>ta over <strong>the</strong> appropriate range at 40kv/20 milliamps<br />
with a count<strong>in</strong>g time <strong>of</strong> 1-4 seconds per step. For unit<br />
cell ref<strong>in</strong>ements, peak locations were obta<strong>in</strong>ed us<strong>in</strong>g a<br />
Philips APD package for s<strong>in</strong>gle peak fits, or by a<br />
modified Pearson-VII peak fitt<strong>in</strong>g or related algorithm.<br />
Upon correction for peak position error, reflections were<br />
analyzed for unit cell parameters us<strong>in</strong>g ei<strong>the</strong>r a Philips<br />
unit cell program or an <strong>in</strong>-house program that provides<br />
estimations <strong>of</strong> cell axes and angles and standard errors.<br />
For m<strong>in</strong>eral identification, peak positions were obta<strong>in</strong>ed<br />
us<strong>in</strong>g <strong>the</strong> Philips APD package for fitt<strong>in</strong>g all spectral<br />
positions.<br />
Samples were prepared for analysis by x-ray<br />
fluorescence by pulveriz<strong>in</strong>g under methanol <strong>in</strong> an agate<br />
mortar and pestle to a gra<strong>in</strong> size <strong>of</strong> less than 50 microns.<br />
The pulverized material was <strong>the</strong>n mixed <strong>in</strong> a 40:60<br />
(rock:flux) ratio with lithium tetraborate and fused at<br />
1000 degrees centigrade for 20 m<strong>in</strong>utes. The material<br />
was <strong>the</strong>n poured onto a hot alum<strong>in</strong>um plate and pressed<br />
<strong>in</strong>to a pellet, approximately 0.6 <strong>in</strong>ches <strong>in</strong> diameter. The<br />
pellets were epoxyed <strong>in</strong>to one <strong>in</strong>ch cyl<strong>in</strong>drical holders<br />
leav<strong>in</strong>g a glass face exposed. The glass is polished to a<br />
smooth face us<strong>in</strong>g silicon carbide polish, <strong>the</strong>n corundum,<br />
and f<strong>in</strong>ally diamond micro-polish. For quantitative<br />
analysis, an automated Philips 1400 series x-ray<br />
fluorescence spectrometer was used under standard<br />
conditions, typically 50kv 50 ma for 50-100 seconds.<br />
Oxide values were determ<strong>in</strong>ed us<strong>in</strong>g l<strong>in</strong>ear least squares<br />
corrections <strong>of</strong> data. Semi-quantitative XRD was also<br />
performed on samples that had been pulverized as<br />
above, <strong>the</strong>n dispersed <strong>in</strong> distilled water and collected on<br />
0.2 or 0.4 µm polycarbonate filters. The dried filters<br />
were <strong>the</strong>n pressed <strong>in</strong>to borax holders at about 20 tons<br />
pressure. The samples were analyzed us<strong>in</strong>g <strong>the</strong><br />
spectrometer and compared to l<strong>in</strong>ear least squares<br />
corrections based on <strong>US</strong>GS pellets and standard<br />
analyzed m<strong>in</strong>erals.<br />
4.3.4 Humic/Fulvic Acid Tests<br />
All natural environmental systems conta<strong>in</strong> some amount<br />
<strong>of</strong> decomposed plant and animal matter called humus.<br />
The soluble portion <strong>of</strong> humus is called humic acids, and<br />
is fur<strong>the</strong>r broken down <strong>in</strong>to three fractions: humic acid,<br />
ulmic acid and fulvic acid. Humic acid is a long cha<strong>in</strong><br />
molecule, high <strong>in</strong> molecular weight, dark brown and
soluble <strong>in</strong> alkal<strong>in</strong>e solutions and is <strong>in</strong>soluble <strong>in</strong> water,<br />
acids, ethanol and acetone. Fulvic acid is a short cha<strong>in</strong>,<br />
low molecular weight molecule. It is soluble <strong>in</strong> acid, alkali<br />
and water and is waste rock <strong>in</strong> color.<br />
<strong>Mercury</strong> and methyl mercury b<strong>in</strong>d strongly to soil and<br />
sediments by form<strong>in</strong>g strong complexes with organic<br />
substances, <strong>in</strong>clud<strong>in</strong>g humic acids. Previous studies<br />
have <strong>in</strong>dicated that humic and fulvic acids dissolve<br />
mercury <strong>from</strong> c<strong>in</strong>nabar <strong>in</strong> <strong>the</strong> environment, and<br />
subsequently release it <strong>in</strong>to aqueous systems.<br />
Vegetative caps can be used on tail<strong>in</strong>gs and piles to<br />
<strong>in</strong>hibit <strong>the</strong> downward migration <strong>of</strong> meteoric waters<br />
through evapo-transpiration, and help stabilize <strong>the</strong> pile<br />
<strong>from</strong> erosion and collapse. A vegetative cap may<br />
produce <strong>the</strong>se organic acids, which could <strong>the</strong>n seep<br />
down and mobilize mercury <strong>in</strong> <strong>the</strong> underly<strong>in</strong>g material.<br />
In order to determ<strong>in</strong>e whe<strong>the</strong>r this would be a concern at<br />
SBMM if a vegetative cap would be considered, a<br />
supplemental test was added to <strong>the</strong> orig<strong>in</strong>al<br />
experimental design. The additional test for humic/fulvic<br />
acid leachability was a modification <strong>of</strong> <strong>the</strong> MWMP<br />
described earlier. The design used glass columns 50<br />
cm tall and 2.5 cm <strong>in</strong> diameter. Five identical columns<br />
were loaded with untreated mercury ore material. Three<br />
<strong>of</strong> <strong>the</strong>se columns were leached with a syn<strong>the</strong>tic<br />
dissolved organic carbon mixture consist<strong>in</strong>g <strong>of</strong> 20 mg/L<br />
<strong>of</strong> humic acid and 10 mg/L <strong>of</strong> fulvic acid <strong>in</strong> deionized<br />
water. To ensure complete dissolution <strong>of</strong> <strong>the</strong> acids, <strong>the</strong><br />
pH <strong>of</strong> <strong>the</strong> solution was brought to 9.0 with a sodium<br />
hydroxide addition, and <strong>the</strong>n adjusted to a pH <strong>of</strong> 6.0 by<br />
add<strong>in</strong>g acetic acid. The rema<strong>in</strong><strong>in</strong>g two columns were<br />
leached with deionized water adjusted to a pH <strong>of</strong> 6.0 as<br />
a duplicate control. The 1:1 ratio <strong>from</strong> <strong>the</strong> MWMP was<br />
ma<strong>in</strong>ta<strong>in</strong>ed, so <strong>the</strong> design called for <strong>the</strong> columns to be<br />
slowly leached with one solution volume equal<strong>in</strong>g one<br />
material volume over each 24-hour period. The columns<br />
were loaded with 150 grams <strong>of</strong> material.<br />
Leachate was collected on days 3 and 7 and <strong>the</strong>n<br />
weekly for weeks 2, 3 and 4. The entire volume <strong>of</strong><br />
leachate was collected, mixed and filtered. Each sample<br />
was analyzed after filtration through 25µm and 0.1µm<br />
with additional filtration at 0.45µm performed on day<br />
seven and week four. Turbidity and pH were measured<br />
immediately after each sample was filtered.<br />
4.4 Results<br />
Results are presented <strong>in</strong> this section for each set <strong>of</strong><br />
tests.<br />
4-12<br />
4.4.1 K<strong>in</strong>etic Column Study Results<br />
The column studies were <strong>the</strong> primary leach<strong>in</strong>g method to<br />
evaluate <strong>the</strong> effectiveness <strong>of</strong> <strong>the</strong> stabilization<br />
technologies on SBMM material. In particular, column<br />
tests us<strong>in</strong>g <strong>the</strong> mercury ore material were used to<br />
evaluate <strong>the</strong> primary objective, i.e. 90% reduction <strong>in</strong> <strong>the</strong><br />
cumulative mass <strong>of</strong> mercury leached <strong>from</strong> <strong>the</strong>
Table 4-9. Total Mass <strong>Mercury</strong> Leached <strong>from</strong> <strong>Mercury</strong> Ore Columns Over Twelve Weeks<br />
Treatment<br />
Mass Hg (µg)<br />
Leached<br />
Table 4-10. <strong>Mercury</strong> Ore Leachability Results By Week<br />
Week Treatment<br />
Average Whole<br />
Rock Hg<br />
Concentration<br />
<strong>Mercury</strong><br />
Mass Removed<br />
(µg)<br />
(mg/Kg) Particulate Dissolved<br />
25µm -0.45µm
Table 4-10 cont<strong>in</strong>ued. <strong>Mercury</strong> Ore Leachability Results By Week<br />
Week Treatment<br />
Average Whole<br />
Rock Hg<br />
Concentration<br />
(mg/Kg)<br />
Particulate<br />
25µm -0.45µm<br />
<strong>Mercury</strong><br />
Mass Removed<br />
(µg)<br />
Dissolved<br />
Detectable levels <strong>of</strong> mercury were encountered <strong>in</strong> all<br />
weekly effluent fractions with mass means (<strong>of</strong> <strong>the</strong> three<br />
columns) rang<strong>in</strong>g <strong>from</strong> 573 µg to 1,627 µg for <strong>the</strong>
Mass Hg Leached (ug)<br />
5000<br />
4000<br />
3000<br />
2000<br />
1000<br />
0<br />
Phosphate <strong>Mercury</strong> Ore Column Phosphate - White<br />
x Particulate<br />
G Dissolved<br />
1 2 3 4 5 6 7 8 9 10 11 12<br />
Week<br />
Figure 4-7. Dissolved and particulate leached Hg<br />
(mass) <strong>from</strong> mercury ore phosphate<br />
columns.<br />
weeks, so <strong>the</strong>se values are not shown on this graph <strong>in</strong><br />
order to ma<strong>in</strong>ta<strong>in</strong> scale for subsequent weeks.<br />
Although approximately 88% <strong>of</strong> <strong>the</strong> total leached<br />
mercury <strong>in</strong> both <strong>the</strong> dissolved and particulate fractions<br />
was leached out <strong>in</strong> <strong>the</strong> first week, significantly higher<br />
levels <strong>of</strong> mercury were still leached <strong>from</strong> <strong>the</strong> phosphate<br />
treatment dur<strong>in</strong>g subsequent weeks as compared to <strong>the</strong><br />
control. For example, <strong>from</strong> weeks 2 through 12 <strong>the</strong><br />
total mass mercury leached <strong>from</strong> <strong>the</strong> phosphate<br />
treatment’s dissolved fraction was 7,893 µg as<br />
compared to 473 µg <strong>from</strong> <strong>the</strong> control over <strong>the</strong> same<br />
period.<br />
The pH <strong>of</strong> <strong>the</strong> solutions averaged 6.7 (6.38 to 6.87) and<br />
exhibited very low variability (CV=2%). The pH <strong>of</strong> <strong>the</strong><br />
phosphate effluents was higher than <strong>the</strong> control. The<br />
average Eh <strong>of</strong> <strong>the</strong> solutions was slightly lower (338) than<br />
<strong>the</strong> control but still exhibited oxic leach<strong>in</strong>g conditions.<br />
The Eh ranged <strong>from</strong> 166 to 420.<br />
As with <strong>the</strong> control column, <strong>the</strong>re is evidence that <strong>the</strong><br />
mercury <strong>in</strong> <strong>the</strong>
Mass Hg Leached (ug)<br />
2000<br />
1750<br />
1500<br />
1250<br />
1000<br />
E&C Williams <strong>Mercury</strong> Sulfide Ore Sulfide - White<br />
Particulate<br />
750<br />
250<br />
500<br />
225<br />
250<br />
0<br />
Dissolved<br />
200<br />
175<br />
150<br />
1 2 3 4 5 6 7 8 9 10 11 12<br />
Week<br />
125<br />
100<br />
75<br />
Figure 4-8. Dissolved and particulate leached Hg<br />
50<br />
(mass) <strong>from</strong> mercury ore sulfide<br />
25<br />
columns. 0<br />
treatment. Overall variability was very low with a CV <strong>of</strong><br />
16% for <strong>the</strong> <strong>in</strong> situ and 15% for <strong>the</strong> ex situ. The<br />
calculated total mass mercury <strong>in</strong> <strong>the</strong> particulate fraction<br />
(25µm to 0.45µm) was extremely low, i.e. 80 µg for <strong>the</strong><br />
<strong>in</strong> situ treatment and 72 µg for <strong>the</strong> ex situ treatment.<br />
Keeco <strong>Mercury</strong> In Ore Situ KEECO Column In Situ - White<br />
Particulate<br />
Dissolved 4.4.1.1.4 KEECO In Situ and Ex Situ 1 2 3 4 5 6 7 8 9 10 11 12<br />
Week<br />
Both <strong>of</strong> <strong>the</strong> KEECO treatments (<strong>in</strong> situ and ex situ) will<br />
be discussed <strong>in</strong> this section, s<strong>in</strong>ce performance results Figure 4-9. Dissolved and particulate leached Hg<br />
for both modes <strong>of</strong> treatment were similar. The total<br />
(mass) <strong>from</strong> mercury ore KEECO <strong>in</strong><br />
mass mercury leached <strong>from</strong> each <strong>of</strong> <strong>the</strong> KECCO<br />
treatment columns was compared to <strong>the</strong> control columns<br />
situ columns.<br />
to evaluate <strong>the</strong> primary objective. Figures 4-9 and 4-10<br />
present <strong>the</strong> temporal mass mercury leachability results<br />
for <strong>the</strong> <strong>in</strong> situ and ex situ columns, respectively. Note<br />
that <strong>the</strong> overall level <strong>of</strong> mercury leached was much lower<br />
than <strong>the</strong> control and o<strong>the</strong>r treatments, but unlike <strong>the</strong><br />
o<strong>the</strong>r tests, <strong>the</strong> mass <strong>of</strong> mercury was much higher <strong>in</strong> <strong>the</strong><br />
mercury (
is important to note that <strong>the</strong> amount <strong>of</strong> mercury<br />
dissolved by <strong>the</strong> KEECO treatment is still significantly<br />
less than <strong>the</strong> mass <strong>of</strong> particulate mercury leached <strong>from</strong><br />
<strong>the</strong> control. The KEECO treatment may have bound <strong>the</strong><br />
matrix, <strong>the</strong>reby reduc<strong>in</strong>g <strong>the</strong> overall reactive surface<br />
area available for mercury dissolution. It is suggested<br />
that <strong>in</strong> order to <strong>in</strong>hibit <strong>the</strong> dissolution <strong>of</strong> mercury due to<br />
elevated pH, <strong>the</strong> vendor should consider iron<br />
amendments as part <strong>of</strong> <strong>the</strong>ir process for this material.<br />
4.4.1.2 <strong>Waste</strong> Rock Column Studies<br />
Results <strong>from</strong> <strong>the</strong> columns studies on <strong>the</strong> waste rock<br />
material are presented <strong>in</strong> Table 4-11. The whole rock<br />
mercury concentration <strong>in</strong> <strong>the</strong> waste rock was<br />
approximately one-half <strong>the</strong> levels <strong>in</strong> <strong>the</strong> mercury ore<br />
material, yield<strong>in</strong>g lower levels <strong>of</strong> leachable mercury as<br />
compared to <strong>the</strong> mercury ore material. However, <strong>the</strong><br />
levels <strong>of</strong> leachable mercury <strong>in</strong> <strong>the</strong> particulate fraction<br />
<strong>from</strong> <strong>the</strong> mercury ore material control columns were two<br />
orders <strong>of</strong> magnitude greater than <strong>from</strong> <strong>the</strong> waste rock<br />
control columns. This <strong>in</strong>dicates that <strong>the</strong> waste rock may<br />
be less prone to releas<strong>in</strong>g particulates when exposed to<br />
a leach<strong>in</strong>g solution. The average pH <strong>from</strong> <strong>the</strong> waste<br />
rock control column leachates was 3.36 (3.06 to 3.61)<br />
and was lower than <strong>the</strong> pH <strong>from</strong> <strong>the</strong> mercury ore column<br />
controls (4.16). The Eh <strong>of</strong> <strong>the</strong> leachate solutions<br />
<strong>in</strong>dicated oxic conditions throughout <strong>the</strong> 8-week period<br />
(mean=522, range 485-573).<br />
Although <strong>the</strong>re was significantly less mercury <strong>in</strong> <strong>the</strong><br />
leachate <strong>from</strong> <strong>the</strong> waste rock column studies, <strong>the</strong> tests<br />
revealed similar technology performance results. The<br />
large number <strong>of</strong> non-detect values <strong>in</strong> <strong>the</strong> tests makes<br />
quantitative assessments and numerical comparisons<br />
difficult. However, a semi-quantitative discussion <strong>of</strong><br />
each technology application follows.<br />
A demonstrated <strong>in</strong> <strong>the</strong> mercury ore material columns,<br />
<strong>the</strong> phosphate treatment greatly <strong>in</strong>creased <strong>the</strong> levels <strong>of</strong><br />
mercury <strong>from</strong> <strong>the</strong> waste rock material (as compared to<br />
<strong>the</strong> control) <strong>in</strong> both <strong>the</strong> particulate (25µm to 0.45µm) and<br />
dissolved (
Table 4-11. Weekly Average Mass <strong>Mercury</strong> Leached <strong>from</strong> <strong>Waste</strong> Rock Columns<br />
Week Treatment Average Whole<br />
<strong>Mercury</strong><br />
Mass Removed<br />
Rock Hg Conc. (µg)<br />
(mg/Kg)<br />
Particulate<br />
25µm -0.45µm<br />
Dissolved<br />
generated <strong>in</strong> <strong>the</strong>
<strong>in</strong> pH may be responsible for <strong>the</strong> <strong>in</strong>creased levels <strong>of</strong><br />
dissolved mercury (
conta<strong>in</strong>ed 10 mg/L humic acid and 5 mg/L fulvic acid,<br />
adjusted to a pH <strong>of</strong> 6. The control solution consisted <strong>of</strong><br />
DI water adjusted to a pH <strong>of</strong> 6. All samples were filtered<br />
through ei<strong>the</strong>r a 25µm or 0.1µm filter to determ<strong>in</strong>e <strong>the</strong><br />
relative amounts <strong>of</strong> mobile (
600<br />
500<br />
400<br />
Hg (ppb) 700<br />
300<br />
200<br />
100<br />
0<br />
< 25 um<br />
to achieve <strong>the</strong> desired results. We are comfortable with<br />
<strong>the</strong> application by <strong>in</strong>jection, although we will recommend<br />
that <strong>the</strong> po<strong>in</strong>ts <strong>of</strong> <strong>in</strong>jection be slightly <strong>in</strong>creased so as to<br />
slightly overlap <strong>the</strong> treated areas.<br />
4.5.2 KEECO’s Comments<br />
Project Methods and Observations<br />
In an effort to provide a comparison <strong>of</strong> <strong>in</strong>-situ treatment<br />
versus ex-situ treatment <strong>of</strong> <strong>the</strong> m<strong>in</strong><strong>in</strong>g waste rock <strong>from</strong><br />
<strong>the</strong> Sulfur Bank <strong>Mercury</strong> M<strong>in</strong>e Superfund site, KEECO<br />
performed two dist<strong>in</strong>ctly different process application<br />
techniques for <strong>the</strong> SITE project test program. The<br />
overall goals established by <strong>EPA</strong> were to demonstrate<br />
non-aggressive, realistic methods <strong>of</strong> chemical<br />
amendment <strong>in</strong>to <strong>the</strong> m<strong>in</strong>e waste while produc<strong>in</strong>g<br />
significantly decreased mercury mobility. Effectiveness<br />
would be verified throughout <strong>the</strong> series <strong>of</strong> tests outl<strong>in</strong>ed<br />
<strong>in</strong> <strong>the</strong> project Test Plan. Therefore, <strong>in</strong> truth, <strong>the</strong><br />
challenge was not only one <strong>of</strong> demonstrat<strong>in</strong>g that <strong>the</strong><br />
technology was able to achieve <strong>the</strong> goals <strong>of</strong> mercury<br />
stability under a variety <strong>of</strong> leach<strong>in</strong>g conditions, but that it<br />
was able to do so us<strong>in</strong>g less-than-ideal techniques for<br />
chemical <strong>in</strong>corporation.<br />
Project Approach<br />
The SME product KB-SEA was utilized for <strong>the</strong>se tests.<br />
For <strong>the</strong> ex-situ column samples, <strong>the</strong> dry chemical was<br />
evenly broadcast over <strong>the</strong> test material followed by<br />
gentle blend<strong>in</strong>g us<strong>in</strong>g a spoon to represent <strong>the</strong> type <strong>of</strong><br />
mix<strong>in</strong>g that may be expected through <strong>the</strong> use <strong>of</strong> an<br />
excavator to blend <strong>the</strong> material on site.<br />
For <strong>the</strong> <strong>in</strong>-situ treatment, a slurry form <strong>of</strong> <strong>the</strong> product<br />
was prepared by mix<strong>in</strong>g <strong>the</strong> dry chemical with deionized<br />
water. The untreated materials were loaded <strong>in</strong>to <strong>the</strong><br />
columns prior to chemical amendment. A predeterm<strong>in</strong>ed<br />
volume <strong>of</strong> chemical slurry was <strong>the</strong>n applied<br />
to each column and allowed to <strong>in</strong>filtrate through <strong>the</strong> pore<br />
spaces. Although this technique is limited <strong>in</strong> its ability to<br />
make effective contact between <strong>the</strong> metal contam<strong>in</strong>ants<br />
<strong>of</strong> concern and <strong>the</strong> reactive components <strong>of</strong> <strong>the</strong> SME<br />
chemical, <strong>the</strong> results proved better than anticipated, as<br />
outl<strong>in</strong>ed <strong>in</strong> Sections 2 and 3. Despite favorable results<br />
<strong>from</strong> <strong>the</strong>se laboratory tests, KEECO believes that it is<br />
unlikely that <strong>the</strong> conditions present <strong>in</strong> <strong>the</strong> column would<br />
accurately represent <strong>the</strong> conditions encountered on-site<br />
us<strong>in</strong>g <strong>in</strong>-situ treatment techniques. Geochemical<br />
conditions and transport mechanisms <strong>in</strong> <strong>the</strong> waste piles<br />
are complex and not properly replicated <strong>in</strong> <strong>the</strong>se<br />
laboratory test cells. As such, a pilot test on-site would<br />
be highly encouraged prior to full-scale treatment.<br />
4-26<br />
KEECO Objectives<br />
In addition to <strong>the</strong> objectives <strong>of</strong> <strong>the</strong> study as outl<strong>in</strong>ed <strong>in</strong><br />
<strong>the</strong> project Test Plan, KEECO established fur<strong>the</strong>r<br />
objectives for <strong>the</strong> technology performance. They<br />
<strong>in</strong>cluded:<br />
A comparison <strong>of</strong> <strong>in</strong>-situ versus ex-situ treatment for<br />
comparable trends, ability to control total metal<br />
contam<strong>in</strong>ant release, stability under each <strong>of</strong> <strong>the</strong><br />
project test methods and consistency <strong>of</strong> test results<br />
<strong>from</strong> column to column;<br />
Verification <strong>of</strong> previously established <strong>the</strong>ories that<br />
materials treated with <strong>the</strong> SME Technology will<br />
exhibit greater stability over time.<br />
While this project proved useful <strong>in</strong> assess<strong>in</strong>g <strong>in</strong>-situ<br />
versus ex-situ chemical amendment and <strong>the</strong> ability <strong>of</strong><br />
<strong>the</strong> process to withstand various leach test conditions,<br />
<strong>the</strong> tests will not however, demonstrate <strong>the</strong> optimum<br />
performance <strong>of</strong> <strong>the</strong> SME Technology when <strong>in</strong>corporated<br />
<strong>in</strong>to materials us<strong>in</strong>g more aggressive mix<strong>in</strong>g techniques.<br />
Therefore, <strong>the</strong> differences between optimum technology<br />
performance and performance as achieved with limited<br />
mix<strong>in</strong>g cannot be assessed <strong>from</strong> this study.<br />
Effectiveness <strong>of</strong> SME Technology Application -<br />
<strong>Mercury</strong> ore (Primary) Test <strong>Material</strong><br />
Despite <strong>the</strong> fact that <strong>the</strong> average whole rock mercury<br />
concentration <strong>of</strong> <strong>the</strong> KEECO sample materials were<br />
slightly higher (about 200 mg/kg) than <strong>the</strong> control, <strong>the</strong><br />
sulfide and <strong>the</strong> phosphate samples, effectiveness <strong>of</strong> <strong>the</strong><br />
SME application is evident as compared to results <strong>from</strong><br />
all o<strong>the</strong>r tests.<br />
When applied to <strong>the</strong> mercury ore samples, <strong>the</strong> SME<br />
chemical produced higher <strong>in</strong>itial pH values than <strong>the</strong><br />
established target end po<strong>in</strong>ts identified by KEECO Lab<br />
for optimum performance. This suggests that <strong>the</strong><br />
samples were slightly over-treated. This could be due to<br />
<strong>the</strong> mild mix<strong>in</strong>g technique employed for <strong>the</strong> test, thus<br />
releas<strong>in</strong>g unreacted chemical <strong>in</strong>to <strong>the</strong> leachate ra<strong>the</strong>r<br />
than expend<strong>in</strong>g it <strong>in</strong> <strong>the</strong> reactive process typically<br />
accomplished through vigorous mix<strong>in</strong>g. However, both<br />
<strong>the</strong> selected application techniques and <strong>the</strong> higher <strong>in</strong>itial<br />
pH appear to have only m<strong>in</strong>or impacts on sample<br />
stability.<br />
Column Test<strong>in</strong>g Observations<br />
There are a number <strong>of</strong> observations that can be made<br />
<strong>from</strong> <strong>the</strong> column tests. Comparisons between <strong>in</strong>-situ
versus ex-situ performance are discussed <strong>in</strong> Section 2.5.<br />
Overall, <strong>the</strong> SME treated columns achieved a significant<br />
reduction <strong>in</strong> leachable mercury as compared to <strong>the</strong><br />
control columns. The objectives <strong>of</strong> <strong>the</strong> Test Plan were to<br />
achieve a 90% reduction <strong>in</strong> <strong>the</strong> cumulative mass <strong>of</strong><br />
mercury <strong>in</strong> <strong>the</strong> test leachates relative to <strong>the</strong> control<br />
column leachates. For <strong>the</strong> <strong>in</strong>-situ columns, as observed<br />
<strong>in</strong> weeks 4, 8, 9 and 12, <strong>the</strong> total mass <strong>of</strong> mercury<br />
released was reduced by an average <strong>of</strong> 90.8% relative<br />
to <strong>the</strong> control, thus meet<strong>in</strong>g <strong>the</strong> primary project objective.<br />
For <strong>the</strong> ex-situ columns, an average <strong>of</strong> 88.2% reduction<br />
<strong>of</strong> <strong>the</strong> mercury released <strong>in</strong>to <strong>the</strong> leachate was observed<br />
relative to <strong>the</strong> control. 2 These figures were derived<br />
us<strong>in</strong>g <strong>the</strong> formula for %Hg reduction as outl<strong>in</strong>ed <strong>in</strong> <strong>the</strong><br />
project Test Plan.<br />
Ano<strong>the</strong>r observation that can be made <strong>from</strong> <strong>the</strong> column<br />
test<strong>in</strong>g is that <strong>the</strong> majority <strong>of</strong> <strong>the</strong> mercury released <strong>from</strong><br />
<strong>the</strong> SME treated material was <strong>in</strong> a dissolved state.<br />
Therefore, while <strong>the</strong> unfiltered and 25µm fraction results<br />
are more favorable with SME, results collected solely<br />
<strong>from</strong> <strong>the</strong> 0.45µm fraction <strong>in</strong>dicate that <strong>the</strong> SME columns<br />
leached a greater mass <strong>of</strong> dissolved mercury than both<br />
<strong>the</strong> control and sulfide treated columns. This is likely<br />
due to <strong>the</strong> method utilized to amend <strong>the</strong> samples,<br />
leav<strong>in</strong>g some <strong>of</strong> <strong>the</strong> material untreated. Dissolved<br />
mercury will readily percolate under <strong>the</strong> <strong>in</strong>fluence <strong>of</strong><br />
filtration due to precipitation <strong>from</strong> untreated material<br />
when <strong>the</strong> irrigation water is applied. Whereas,<br />
suspended particulates that may be liberated <strong>from</strong> <strong>the</strong><br />
untreated material upon <strong>the</strong> outset <strong>of</strong> irrigation readily<br />
adsorb to neighbor<strong>in</strong>g silica-encapsulated materials<br />
before percolat<strong>in</strong>g completely through <strong>the</strong> column;<br />
<strong>the</strong>reby m<strong>in</strong>imiz<strong>in</strong>g <strong>the</strong> release <strong>of</strong> mercury <strong>from</strong> <strong>the</strong><br />
material that may not have received a thorough<br />
application <strong>of</strong> SME product. Typically, <strong>the</strong> goals <strong>of</strong><br />
treatment for any project are to reduce <strong>the</strong> metal release<br />
to background levels. By week 12, after gradual<br />
improvement over time, <strong>the</strong> average mean concentration<br />
<strong>of</strong> dissolved mercury <strong>in</strong> <strong>the</strong> SME leachate was with<strong>in</strong> 1.8<br />
µg/L <strong>of</strong> <strong>the</strong> control columns.<br />
As previously mentioned, one <strong>of</strong> <strong>the</strong> objectives that<br />
KEECO established for this study was to verify <strong>the</strong><br />
<strong>the</strong>ory that SME treated materials will exhibit <strong>in</strong>creased<br />
stability over time. Results ga<strong>the</strong>red <strong>from</strong> both <strong>the</strong><br />
unfiltered and dissolved fraction data support this <strong>the</strong>ory.<br />
In addition, <strong>the</strong> coefficient <strong>of</strong> variation improved over<br />
2 Week 1 results were not <strong>in</strong>cluded due to <strong>the</strong> high variability<br />
<strong>of</strong> <strong>the</strong> results, suggest<strong>in</strong>g that <strong>the</strong> reactive process was not yet<br />
complete. However, <strong>in</strong> week 1, <strong>the</strong> <strong>in</strong>-situ columns produced<br />
a 96.3% reduction <strong>in</strong> <strong>the</strong> mass <strong>of</strong> mercury release relative to<br />
<strong>the</strong> control; <strong>the</strong> ex-situ columns exhibited a 75.5% reduction.<br />
4-27<br />
time, demonstrat<strong>in</strong>g <strong>the</strong> ability <strong>of</strong> <strong>the</strong> chemical to control<br />
<strong>the</strong> mercury release to consistent levels despite<br />
variations <strong>of</strong> total mercury present <strong>in</strong> <strong>the</strong> untreated<br />
material. This supports <strong>the</strong> prediction that material<br />
conta<strong>in</strong><strong>in</strong>g widely variable mercury concentrations or<br />
“hot spots” can be effectively treated with a s<strong>in</strong>gle<br />
application <strong>of</strong> SME chemical to <strong>the</strong> entire material<br />
volume without hav<strong>in</strong>g to separately treat <strong>the</strong> highly<br />
concentrated portions.<br />
The dry<strong>in</strong>g phase that was undertaken between test<br />
weeks 8 and 9 did not show any significant impact on<br />
mercury stability <strong>in</strong> <strong>the</strong> SME-treated columns. A 1.5<br />
µg/L <strong>in</strong>crease <strong>in</strong> mean Hg concentration <strong>in</strong> <strong>the</strong> ex-situ<br />
columns was observed after <strong>the</strong> rest period, with a 4.6<br />
µg/L <strong>in</strong>crease evident <strong>from</strong> <strong>the</strong> <strong>in</strong>-situ columns. This<br />
suggests that <strong>the</strong> onset <strong>of</strong> irrigation after <strong>the</strong> dry<strong>in</strong>g<br />
period may have released a small amount <strong>of</strong> mercury<br />
<strong>in</strong>to <strong>the</strong> leachate <strong>from</strong> <strong>the</strong> untreated material that may<br />
have been near <strong>the</strong> lower portion <strong>of</strong> <strong>the</strong> columns. As<br />
compared to <strong>the</strong> o<strong>the</strong>r test columns, <strong>the</strong> SME column<br />
<strong>in</strong>creases were m<strong>in</strong>imal, with a 19.1 µg/L <strong>in</strong>crease <strong>from</strong><br />
<strong>the</strong> control column, a 75.3 µg/L <strong>from</strong> <strong>the</strong> phosphate<br />
column and a 35.1 µg/L <strong>from</strong> <strong>the</strong> sulfide column. The<br />
m<strong>in</strong>imal amount <strong>of</strong> total release evident <strong>from</strong> <strong>the</strong> SME<br />
treated columns suggests that a large contam<strong>in</strong>ant<br />
plume is unlikely <strong>from</strong> SME stabilized materials after<br />
exposure to atmospheric oxygen.<br />
SPLP Test Observations<br />
The stability <strong>of</strong> mercury under static test conditions<br />
follow<strong>in</strong>g treatment with SME was evident as compared<br />
to <strong>the</strong> control sample material. The control sample<br />
released a mean mercury concentration <strong>of</strong> 2143.6 µg/L,<br />
while <strong>the</strong> SME samples released 7.2 µg/L and 10.1 µg/L<br />
Hg, a 99.6% average decrease <strong>in</strong> leachable mercury<br />
relative to <strong>the</strong> untreated sample. The samples also<br />
exhibited greater than a 99% improvement <strong>in</strong> mercury<br />
stability relative to <strong>the</strong> sulfide and phosphate treated<br />
material.<br />
Humidity Cell Test Observations<br />
The released mercury <strong>in</strong> <strong>the</strong> humidity cell tests is<br />
primarily <strong>in</strong> a dissolved state. This is likely due to <strong>the</strong><br />
limited mix<strong>in</strong>g technique not allow<strong>in</strong>g for effective<br />
contact and encapsulation <strong>of</strong> portions <strong>of</strong> <strong>the</strong> mercurybear<strong>in</strong>g<br />
material. Particulate or suspended mercury, if<br />
not encapsulated, will tend to adsorb to neighbor<strong>in</strong>g<br />
encapsulated material; <strong>the</strong>refore, <strong>the</strong> release <strong>of</strong> larger<br />
fraction particulate mercury is m<strong>in</strong>imized. Even <strong>in</strong> this<br />
adsorbed state <strong>the</strong> mercury is quite resistant to leach<strong>in</strong>g.<br />
This is evident when compar<strong>in</strong>g <strong>the</strong> total mercury
eleased <strong>from</strong> <strong>the</strong> control, sulfide and phosphate cells to<br />
that released <strong>from</strong> <strong>the</strong> SME-treated cells. Although <strong>the</strong><br />
dissolved mercury concentrations were slightly higher<br />
<strong>from</strong> <strong>the</strong> SME cells, <strong>the</strong> total mercury released <strong>in</strong> <strong>the</strong> 25<br />
µm and 0.45 µm samples comb<strong>in</strong>ed was much lower<br />
overall.<br />
In-situ versus Ex-situ<br />
Overall <strong>the</strong> SME Technology appears to be a viable<br />
option for stabilization <strong>of</strong> mercury <strong>in</strong> <strong>the</strong> mercury ore pile<br />
material, regardless <strong>of</strong> whe<strong>the</strong>r <strong>the</strong> technology is applied<br />
“<strong>in</strong>-situ” or “ex-situ.” Both techniques exhibited<br />
comparable stability that rema<strong>in</strong>ed consistent throughout<br />
<strong>the</strong> test<strong>in</strong>g period. The greatest variations were<br />
observed with<strong>in</strong> <strong>the</strong> data ga<strong>the</strong>red dur<strong>in</strong>g week 1 <strong>of</strong> <strong>the</strong><br />
column tests. The <strong>in</strong>-situ columns appeared to release a<br />
much lower mean concentration <strong>of</strong> mercury immediately<br />
after treatment than <strong>the</strong> ex-situ columns (19.8 versus<br />
125 µg/L respectively). However, <strong>from</strong> week 2<br />
throughout <strong>the</strong> conclusion <strong>of</strong> <strong>the</strong> test<strong>in</strong>g, <strong>the</strong> mean<br />
concentrations <strong>of</strong> mercury <strong>in</strong> <strong>the</strong> <strong>in</strong>-situ versus ex-situ<br />
samples were typically with<strong>in</strong> 1 to 3 µg/L <strong>of</strong> each o<strong>the</strong>r.<br />
The robust nature <strong>of</strong> <strong>the</strong> technology reaction despite<br />
substantially different treatment methods is evident <strong>in</strong><br />
<strong>the</strong>se test results.<br />
After <strong>the</strong> dry<strong>in</strong>g period between test weeks 8 and 9, <strong>the</strong><br />
ex-situ columns produced slightly better results, with an<br />
<strong>in</strong>crease <strong>in</strong> <strong>the</strong> mean mercury concentration <strong>of</strong> only 1.5<br />
µg/L <strong>from</strong> week 8 to week 9. In-situ columns produced a<br />
mean mercury concentration <strong>in</strong>crease <strong>of</strong> 4.6 µg/L over<br />
<strong>the</strong> same period. By <strong>the</strong> end <strong>of</strong> <strong>the</strong> 12-week test<strong>in</strong>g<br />
period, when compar<strong>in</strong>g mean concentrations <strong>of</strong><br />
mercury evident <strong>in</strong> <strong>the</strong> leachate <strong>of</strong> <strong>the</strong> <strong>in</strong>-situ versus exsitu<br />
columns, a difference <strong>of</strong> only 0.2 µg/L was evident.<br />
With <strong>the</strong> exception <strong>of</strong> week 1 data, similar trends were<br />
also observed <strong>in</strong> regards to dissolved versus mobile,<br />
suspended mercury <strong>in</strong> <strong>the</strong> leachate. Of <strong>the</strong> total mercury<br />
released <strong>in</strong>to <strong>the</strong> leachate, <strong>the</strong> majority <strong>of</strong> <strong>the</strong> mercury<br />
was present <strong>in</strong> <strong>the</strong> 0.45 µm fraction for both <strong>the</strong> <strong>in</strong>-situ<br />
and ex-situ columns.<br />
Because contact between <strong>the</strong> metal contam<strong>in</strong>ants <strong>of</strong><br />
concern and <strong>the</strong> SME product is essential <strong>in</strong> order to<br />
achieve proper stability, effective mix<strong>in</strong>g techniques are<br />
critical for <strong>the</strong> overall long-term stability <strong>of</strong> <strong>the</strong> treated<br />
substrate.<br />
4-28<br />
Effectiveness <strong>of</strong> SME Technology Application -<br />
<strong>Waste</strong> rock (Secondary) Test <strong>Material</strong><br />
Treatment <strong>of</strong> <strong>the</strong> waste rock pile test material with <strong>the</strong><br />
SME chemical KB-SEA was conducted to replicate an<br />
ex-situ treatment method as well as an <strong>in</strong>-situ treatment<br />
method as outl<strong>in</strong>ed <strong>in</strong> Section 1. Initial results, based<br />
upon <strong>the</strong> pH <strong>of</strong> <strong>the</strong> leachate immediately after treatment,<br />
showed that <strong>the</strong> <strong>in</strong>-situ material successfully achieved<br />
<strong>the</strong> targeted pH end po<strong>in</strong>t <strong>of</strong> approximately 9.0. The exsitu<br />
material appeared to be slightly overtreated with a<br />
pH <strong>of</strong> approximately 11.5 evident <strong>in</strong> week 1.<br />
S<strong>in</strong>ce each test method <strong>in</strong>volved treatment <strong>of</strong> only one<br />
column <strong>of</strong> waste rock pile material, statistical averag<strong>in</strong>g<br />
and <strong>the</strong> ability to identify data spikes and anomalies<br />
cannot be accomplished.<br />
Column Test<strong>in</strong>g Observations<br />
The SME treated waste rock pile samples all released a<br />
higher concentration <strong>of</strong> mercury <strong>in</strong>to <strong>the</strong> leachate as<br />
compared to <strong>the</strong> control column results for all samples<br />
evaluated, with <strong>the</strong> exception <strong>of</strong> some <strong>of</strong> <strong>the</strong> week 1leachate<br />
samples.<br />
The liberated mercury evident <strong>in</strong> <strong>the</strong> SME column<br />
leachate appears to be predom<strong>in</strong>antly <strong>in</strong> <strong>the</strong> 0.45 µm or<br />
dissolved fraction. This was also evident <strong>in</strong> <strong>the</strong> mercury<br />
ore pile test<strong>in</strong>g.<br />
Over <strong>the</strong> 8-week column test, a reduction <strong>in</strong> <strong>the</strong><br />
concentration <strong>of</strong> <strong>the</strong> mercury <strong>in</strong> <strong>the</strong> leachate was<br />
achieved <strong>in</strong> <strong>the</strong> SME-treated columns, suggest<strong>in</strong>g<br />
enhanced stability over time. However, <strong>the</strong> control<br />
sample leachate rema<strong>in</strong>ed at or below <strong>the</strong> detection limit<br />
<strong>of</strong> 0.2 µg/L for <strong>the</strong> majority <strong>of</strong> <strong>the</strong> 8-week test period.<br />
While <strong>the</strong> SME treated materials never exceeded a<br />
mercury concentration <strong>of</strong> 6.1 µg/L <strong>in</strong> <strong>the</strong> leachate, <strong>the</strong><br />
sulfide sample performed better with most <strong>of</strong> <strong>the</strong><br />
samples at or below <strong>the</strong> detection limit. Unfortunately,<br />
s<strong>in</strong>ce <strong>the</strong> control column also rema<strong>in</strong>ed with<strong>in</strong> detection<br />
limits for <strong>the</strong> majority <strong>of</strong> <strong>the</strong> sample test<strong>in</strong>g, no<br />
technology could clearly be identified as successful for<br />
<strong>the</strong>se tests.<br />
The ex-situ and <strong>in</strong>-situ columns appeared to generate<br />
similar results after week 3, and by <strong>the</strong> conclusion <strong>of</strong> <strong>the</strong><br />
8-week test period, <strong>the</strong> concentrations <strong>of</strong> mercury were<br />
with 2-4 µg/L <strong>of</strong> each o<strong>the</strong>r.
SPLP Test Observations<br />
The SME <strong>in</strong>-situ column material did not undergo SPLP<br />
test<strong>in</strong>g. The ex-situ column test material performed<br />
better under SPLP test conditions than <strong>the</strong> control<br />
samples, <strong>the</strong> phosphate samples and <strong>the</strong> sulfide<br />
samples. However, <strong>the</strong> mercury leached <strong>from</strong> <strong>the</strong><br />
control sample material (only 3 µg/L) was aga<strong>in</strong> quite<br />
low; <strong>the</strong>refore, no s<strong>in</strong>gle technology could be identified<br />
as hav<strong>in</strong>g achieved a significant reduction <strong>in</strong> <strong>the</strong><br />
leachable mercury as compared to <strong>the</strong> untreated<br />
materials.<br />
The results <strong>of</strong> <strong>the</strong> waste rock pile tests were fairly<br />
<strong>in</strong>conclusive, but suggest that fur<strong>the</strong>r characterization <strong>of</strong><br />
<strong>the</strong> waste rock pile material should be undertaken to<br />
determ<strong>in</strong>e whe<strong>the</strong>r chemical stabilization or any o<strong>the</strong>r<br />
treatment is warranted.<br />
4-29
5.1 Introduction<br />
Quality Assurance (QA) may be def<strong>in</strong>ed as a system <strong>of</strong><br />
activities <strong>the</strong> purpose <strong>of</strong> which is to provide assurance<br />
that def<strong>in</strong>ed standards <strong>of</strong> quality are met with a stated<br />
level <strong>of</strong> confidence. A QA program is a means <strong>of</strong><br />
<strong>in</strong>tegrat<strong>in</strong>g <strong>the</strong> quality plann<strong>in</strong>g, quality assessment,<br />
quality control (QC), and quality improvement efforts to<br />
meet user requirements. This <strong>in</strong>cludes all actions taken<br />
by project personnel, and <strong>the</strong> documentation <strong>of</strong><br />
laboratory and field performance as specified <strong>in</strong> <strong>the</strong><br />
QAPP. The objective <strong>of</strong> <strong>the</strong> quality assurance program<br />
is to reduce measurement errors to agreed upon limits<br />
and to produce results <strong>of</strong> acceptable and known quality.<br />
The QAPP specified <strong>the</strong> necessary guidel<strong>in</strong>es to ensure<br />
that <strong>the</strong> measurement system was <strong>in</strong> control and<br />
provided detailed <strong>in</strong>formation on <strong>the</strong> analytical approach<br />
to ensure that data <strong>of</strong> high quality could be obta<strong>in</strong>ed to<br />
achieve project objectives. The results <strong>of</strong> <strong>the</strong> QA<br />
processes applied to <strong>the</strong> Suulfur Bank project are<br />
summarized below.<br />
5.2 Conclusions and Data Quality<br />
Limitations<br />
A review <strong>of</strong> <strong>the</strong> critical sample data and associated QC<br />
analyses was performed to determ<strong>in</strong>e whe<strong>the</strong>r <strong>the</strong> data<br />
collected were <strong>of</strong> adequate quality to provide proper<br />
evaluation <strong>of</strong> <strong>the</strong> project's technical objectives. The<br />
critical parameters <strong>in</strong>cluded mercury <strong>in</strong> <strong>the</strong> leachates<br />
<strong>from</strong> <strong>the</strong> k<strong>in</strong>etic column studies. The results <strong>of</strong> <strong>the</strong><br />
measurements designed to assess <strong>the</strong> data quality<br />
objectives are summarized below, along with a<br />
discussion <strong>of</strong> <strong>the</strong> impact <strong>of</strong> <strong>the</strong> data quality on achiev<strong>in</strong>g<br />
<strong>the</strong> project’s technical objectives.<br />
Accuracy: Samples were collected and analyzed <strong>from</strong><br />
each <strong>of</strong> <strong>the</strong> test columns over an <strong>in</strong>itial 8-week period.<br />
Spiked duplicate samples were analyzed and recovery<br />
data were compared to <strong>the</strong> control limits established <strong>in</strong><br />
<strong>the</strong> QAPP (80-120% recovery). All spikes (36 MS/MSD<br />
pairs) met QA objectives, as summarized below <strong>in</strong> Table<br />
Section 5.0<br />
Quality Assurance Summary<br />
5-1<br />
5-1. In addition, spiked blanks, or laboratory control<br />
samples (LCSs), also met recovery limits <strong>of</strong> 85-115%.<br />
A select number <strong>of</strong> test columns were allowed to sit<br />
undisturbed for several weeks and <strong>the</strong> leach<strong>in</strong>g process<br />
was <strong>the</strong>n cont<strong>in</strong>ued for an additional 4 weeks. These<br />
extended column leachate samples were also spiked,<br />
LCSs were analyzed and accuracy assessed. These<br />
data <strong>in</strong>dicated as well that accuracy objectives were<br />
achieved, as noted <strong>in</strong> Table 5-2.<br />
Table 5-1. Accuracy Data for <strong>Mercury</strong> for SBMM<br />
Column Leachates<br />
Leachate Fraction<br />
MS/MSD<br />
Average %<br />
Recovery<br />
LCS<br />
Average %<br />
Recovery<br />
Total 102 100<br />
25µm filter 102 102<br />
0.45µm filter 104 100<br />
Table 5-2. Accuracy Data for <strong>Mercury</strong> for SBMM<br />
Extended Column Leachates<br />
Leachate Fraction<br />
MS/MSD<br />
Average %<br />
Recovery<br />
LCS<br />
Average %<br />
Recovery<br />
Total 107 106<br />
25µm filter 100 102<br />
0.45µm filter 100 104<br />
Accuracy was fur<strong>the</strong>r assessed through <strong>the</strong> analysis <strong>of</strong><br />
second-source standards, or Initial Calibration<br />
Verification (ICV) standards. These standards were<br />
analyzed after each <strong>in</strong>itial multi-po<strong>in</strong>t calibration curve<br />
and all ICV concentrations were with<strong>in</strong> 10% <strong>of</strong> <strong>the</strong> “true”<br />
concentration, as required <strong>in</strong> <strong>the</strong> QAPP.<br />
Precision <strong>of</strong> <strong>the</strong> mercury analyses was assessed by <strong>the</strong><br />
Relative Percent Difference (RPD) between <strong>the</strong> spiked
duplicate sample concentrations. Data quality objectives<br />
were established <strong>in</strong> <strong>the</strong> QAPP as RPD <strong>of</strong> less than 20%.<br />
All spiked duplicates, <strong>in</strong> both <strong>the</strong> orig<strong>in</strong>al 8-week study<br />
and <strong>the</strong> extended study, had RPD values less than 10%,<br />
<strong>the</strong>refore data met <strong>the</strong> objectives for precision.<br />
Sensitivity objectives <strong>in</strong> terms <strong>of</strong> detection limits and<br />
practical quantitiation limits were met for all samples.<br />
Completeness objectives for <strong>the</strong> project were met. A<br />
few non-critical parameters were not analyzed for some<br />
leachates due to sample volume; this did not affect<br />
overall data collection efforts.<br />
Comparability was addressed <strong>in</strong> <strong>the</strong> QAPP through <strong>the</strong><br />
use <strong>of</strong> <strong>EPA</strong> approved methodology. <strong>Mercury</strong> was<br />
determ<strong>in</strong>ed <strong>in</strong> accordance with SW846 Method 7470 for<br />
all critical column study leachates.<br />
Representativeness refers to <strong>the</strong> degree with which a<br />
sample exhibits average properties <strong>of</strong> <strong>the</strong> site at <strong>the</strong><br />
particular time be<strong>in</strong>g evaluated. This is assessed <strong>in</strong> part<br />
by <strong>the</strong> analysis <strong>of</strong> field duplicates, which also provide<br />
<strong>in</strong>sight <strong>in</strong>to <strong>the</strong> homogeneity, or heterogeneity, <strong>of</strong> <strong>the</strong><br />
matrix. Field duplicate samples have <strong>in</strong>herent <strong>in</strong> <strong>the</strong><br />
result comb<strong>in</strong>ed field and analytical variability.<br />
Periodically throughout <strong>the</strong> 8-week column study,<br />
leachate samples were collected <strong>in</strong> duplicate. <strong>Mercury</strong><br />
analysis <strong>of</strong> <strong>the</strong>se samples <strong>in</strong>dicated that reproducibility<br />
between <strong>the</strong> samples was with<strong>in</strong> guidel<strong>in</strong>es (RPD <<br />
20%), with <strong>the</strong> exception <strong>of</strong> three duplicate leachate<br />
samples (see Table 2-3) filtered through 0.45 um filters<br />
that had RPD values >50%.<br />
5-2