Download PDF
Download PDF
Download PDF

Create successful ePaper yourself
Turn your PDF publications into a flip-book with our unique Google optimized e-Paper software.
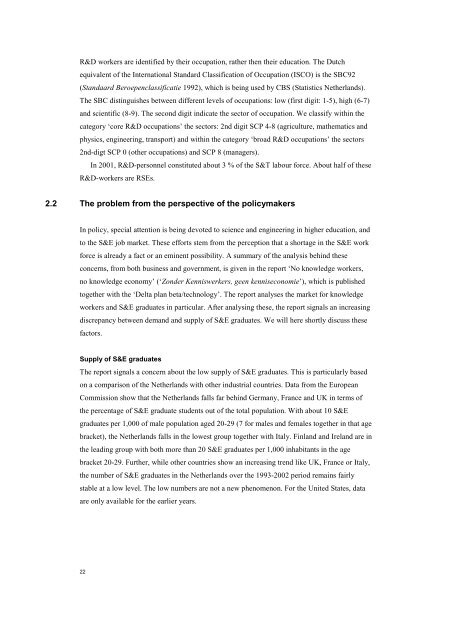
R&D workers are identified by their occupation, rather then their education. The Dutch<br />
equivalent of the International Standard Classification of Occupation (ISCO) is the SBC92<br />
(Standaard Beroepenclassificatie 1992), which is being used by CBS (Statistics Netherlands).<br />
The SBC distinguishes between different levels of occupations: low (first digit: 1-5), high (6-7)<br />
and scientific (8-9). The second digit indicate the sector of occupation. We classify within the<br />
category ‘core R&D occupations’ the sectors: 2nd digit SCP 4-8 (agriculture, mathematics and<br />
physics, engineering, transport) and within the category ‘broad R&D occupations’ the sectors<br />
2nd-digt SCP 0 (other occupations) and SCP 8 (managers).<br />
22<br />
In 2001, R&D-personnel constituted about 3 % of the S&T labour force. About half of these<br />
R&D-workers are RSEs.<br />
2.2 The problem from the perspective of the policymakers<br />
In policy, special attention is being devoted to science and engineering in higher education, and<br />
to the S&E job market. These efforts stem from the perception that a shortage in the S&E work<br />
force is already a fact or an eminent possibility. A summary of the analysis behind these<br />
concerns, from both business and government, is given in the report ‘No knowledge workers,<br />
no knowledge economy’ (‘Zonder Kenniswerkers, geen kenniseconomie’), which is published<br />
together with the ‘Delta plan beta/technology’. The report analyses the market for knowledge<br />
workers and S&E graduates in particular. After analysing these, the report signals an increasing<br />
discrepancy between demand and supply of S&E graduates. We will here shortly discuss these<br />
factors.<br />
Supply of S&E graduates<br />
The report signals a concern about the low supply of S&E graduates. This is particularly based<br />
on a comparison of the Netherlands with other industrial countries. Data from the European<br />
Commission show that the Netherlands falls far behind Germany, France and UK in terms of<br />
the percentage of S&E graduate students out of the total population. With about 10 S&E<br />
graduates per 1,000 of male population aged 20-29 (7 for males and females together in that age<br />
bracket), the Netherlands falls in the lowest group together with Italy. Finland and Ireland are in<br />
the leading group with both more than 20 S&E graduates per 1,000 inhabitants in the age<br />
bracket 20-29. Further, while other countries show an increasing trend like UK, France or Italy,<br />
the number of S&E graduates in the Netherlands over the 1993-2002 period remains fairly<br />
stable at a low level. The low numbers are not a new phenomenon. For the United States, data<br />
are only available for the earlier years.