Download PDF
Download PDF
Download PDF

Create successful ePaper yourself
Turn your PDF publications into a flip-book with our unique Google optimized e-Paper software.
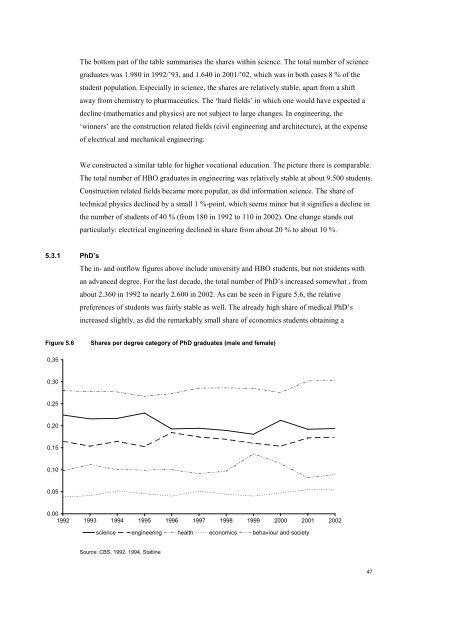
5.3.1 PhD’s<br />
The bottom part of the table summarises the shares within science. The total number of science<br />
graduates was 1.980 in 1992/’93, and 1.640 in 2001/’02, which was in both cases 8 % of the<br />
student population. Especially in science, the shares are relatively stable, apart from a shift<br />
away from chemistry to pharmaceutics. The ‘hard fields’ in which one would have expected a<br />
decline (mathematics and physics) are not subject to large changes. In engineering, the<br />
‘winners’ are the construction related fields (civil engineering and architecture), at the expense<br />
of electrical and mechanical engineering.<br />
We constructed a similar table for higher vocational education. The picture there is comparable.<br />
The total number of HBO graduates in engineering was relatively stable at about 9.500 students.<br />
Construction related fields became more popular, as did information science. The share of<br />
technical physics declined by a small 1 %-point, which seems minor but it signifies a decline in<br />
the number of students of 40 % (from 180 in 1992 to 110 in 2002). One change stands out<br />
particularly: electrical engineering declined in share from about 20 % to about 10 %.<br />
The in- and outflow figures above include university and HBO students, but not students with<br />
an advanced degree. For the last decade, the total number of PhD’s increased somewhat , from<br />
about 2.360 in 1992 to nearly 2.600 in 2002. As can be seen in Figure 5.6, the relative<br />
preferences of students was fairly stable as well. The already high share of medical PhD’s<br />
increased slightly, as did the remarkably small share of economics students obtaining a<br />
Figure 5.6 Shares per degree category of PhD graduates (male and female)<br />
0,35<br />
0,30<br />
0,25<br />
0,20<br />
0,15<br />
0,10<br />
0,05<br />
0,00<br />
1992 1993 1994 1995 1996 1997 1998 1999 2000 2001 2002<br />
science engineering health economics behaviour and society<br />
Source: CBS, 1992, 1994, Statline<br />
47