Reed CSR 2007.indd - Reed Elsevier
Reed CSR 2007.indd - Reed Elsevier
Reed CSR 2007.indd - Reed Elsevier

You also want an ePaper? Increase the reach of your titles
YUMPU automatically turns print PDFs into web optimized ePapers that Google loves.
40 <strong>Reed</strong> <strong>Elsevier</strong> Corporate Responsibility Report 2007 Workplace<br />
Health and Safety continued<br />
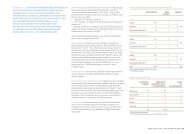
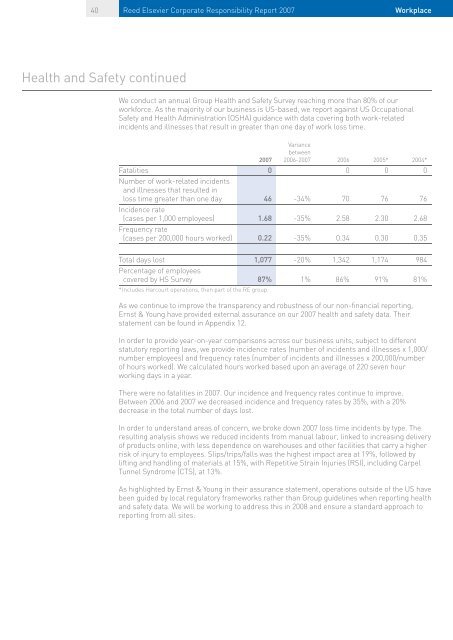
We conduct an annual Group Health and Safety Survey reaching more than 80% of our<br />
workforce. As the majority of our business is US-based, we report against US Occupational<br />
Safety and Health Administration (OSHA) guidance with data covering both work-related<br />
incidents and illnesses that result in greater than one day of work loss time.<br />
Variance<br />
between<br />
2007 2006-2007 2006 2005* 2004*<br />
Fatalities 0 0 0 0<br />
Number of work-related incidents<br />
and illnesses that resulted in<br />
loss time greater than one day 46 -34% 70 76 76<br />
Incidence rate<br />
(cases per 1,000 employees) 1.68 -35% 2.58 2.30 2.68<br />
Frequency rate<br />
(cases per 200,000 hours worked) 0.22 -35% 0.34 0.30 0.35<br />
Total days lost 1,077 -20% 1,342 1,174 984<br />
Percentage of employees<br />
covered by HS Survey 87% 1% 86% 91% 81%<br />
* Includes Harcourt operations, then part of the RE group<br />
As we continue to improve the transparency and robustness of our non-fi nancial reporting,<br />
Ernst & Young have provided external assurance on our 2007 health and safety data. Their<br />
statement can be found in Appendix 12.<br />
In order to provide year-on-year comparisons across our business units, subject to different<br />
statutory reporting laws, we provide incidence rates (number of incidents and illnesses x 1,000/<br />
number employees) and frequency rates (number of incidents and illnesses x 200,000/number<br />
of hours worked). We calculated hours worked based upon an average of 220 seven hour<br />
working days in a year.<br />
There were no fatalities in 2007. Our incidence and frequency rates continue to improve.<br />
Between 2006 and 2007 we decreased incidence and frequency rates by 35%, with a 20%<br />
decrease in the total number of days lost.<br />
In order to understand areas of concern, we broke down 2007 loss time incidents by type. The<br />
resulting analysis shows we reduced incidents from manual labour, linked to increasing delivery<br />
of products online, with less dependence on warehouses and other facilities that carry a higher<br />
risk of injury to employees. Slips/trips/falls was the highest impact area at 19%, followed by<br />
lifting and handling of materials at 15%, with Repetitive Strain Injuries (RSI), including Carpel<br />
Tunnel Syndrome (CTS), at 13%.<br />
As highlighted by Ernst & Young in their assurance statement, operations outside of the US have<br />
been guided by local regulatory frameworks rather than Group guidelines when reporting health<br />
and safety data. We will be working to address this in 2008 and ensure a standard approach to<br />
reporting from all sites.