Accepted Manuscript
Accepted Manuscript
Accepted Manuscript

You also want an ePaper? Increase the reach of your titles
YUMPU automatically turns print PDFs into web optimized ePapers that Google loves.
Page 7 of 12 Physical Chemistry Chemical Physics<br />
Downloaded by UNIVERSIDAD COMPLUTENSE MADRID on 04 June 2012<br />
Published on 22 May 2012 on http://pubs.rsc.org | doi:10.1039/C2CP40962C<br />
E/N (kcal.mol −1 )<br />
−12<br />
−12.2<br />
−12.4<br />
−12.6<br />
−12.8<br />
−13<br />
−13.2<br />
−13.4<br />
0.0⋅10 0<br />
266 K<br />
2.5⋅10 6<br />
5.0⋅10 6<br />
7.5⋅10 6<br />
Monte Carlo cycles<br />
262 K<br />
252 K<br />
240 K<br />
1.0⋅10 7<br />
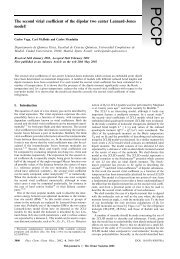
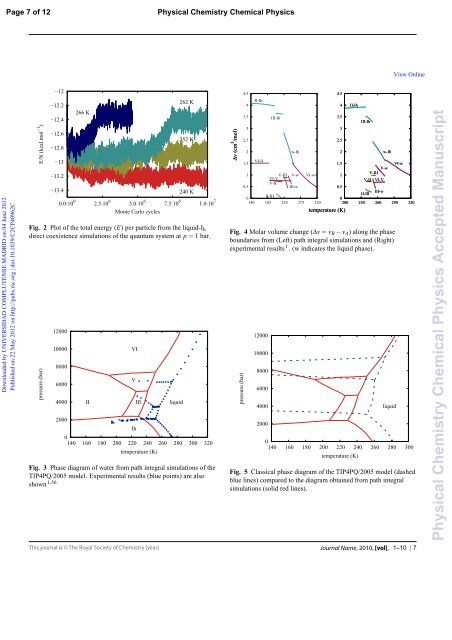
Fig. 2 Plot of the total energy (E) per particle from the liquid-Ih<br />
direct coexistence simulations of the quantum system at p=1 bar.<br />
pressure (bar)<br />
12000<br />
10000<br />
8000<br />
6000<br />
4000<br />
2000<br />
VI<br />
V<br />
II III<br />
Ih<br />
0<br />
140 160 180 200 220 240 260 280 300 320<br />
temperature (K)<br />
liquid<br />
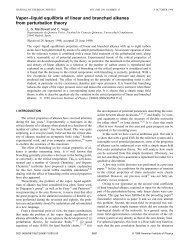
Fig. 3 Phase diagram of water from path integral simulations of the<br />
TIP4PQ/2005 model. Experimental results (blue points) are also<br />
shown 1,56<br />
Δv (cm 3 Δv (cm /mol)<br />
3 /mol)<br />
4.5<br />
4<br />
3.5<br />
3<br />
2.5<br />
2<br />
1.5<br />
1<br />
0.5<br />
II-Ih<br />
VI-II<br />
III-Ih<br />
V-III<br />
VI-V<br />
V-II<br />
w-Ih<br />
V-w<br />
III-w<br />
VI-w<br />
II-III<br />
0<br />
140 160 180 185 200 220 240 230 260 280 275 300 320 340 320<br />
4.5<br />
4<br />
3.5<br />
3<br />
2.5<br />
2<br />
1.5<br />
1<br />
temperature (K)<br />
II-Ih<br />
III-Ih<br />
w-Ih<br />
V-w<br />
V-III<br />
V-II VI-V<br />
VI-w<br />
0.5<br />
II-III<br />
III-w<br />
0<br />
200 230 260 290 320<br />
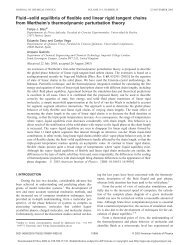
Fig. 4 Molar volume change (Δv=vB− vA) along the phase<br />
boundaries from (Left) path integral simulations and (Right)<br />
experimental results 1 . (w indicates the liquid phase).<br />
pressure (bar)<br />
12000<br />
10000<br />
8000<br />
6000<br />
4000<br />
2000<br />
0<br />
140 160 180 200 220 240 260 280 300<br />
temperature (K)<br />
liquid<br />
View Online<br />
Fig. 5 Classical phase diagram of the TIP4PQ/2005 model (dashed<br />
blue lines) compared to the diagram obtained from path integral<br />
simulations (solid red lines).<br />
1–10 | 7<br />
Physical Chemistry Chemical Physics <strong>Accepted</strong> <strong>Manuscript</strong>