Download (3001Kb) - Covenant University Repository
Download (3001Kb) - Covenant University Repository
Download (3001Kb) - Covenant University Repository

You also want an ePaper? Increase the reach of your titles
YUMPU automatically turns print PDFs into web optimized ePapers that Google loves.
Folasade Abiola Semire, Rosmiwati Mohd-Mokhtar, Temidayo Victor Omotosho, Widad Ismail, Norizah Mohamad,<br />
and J.S. Mandeep<br />
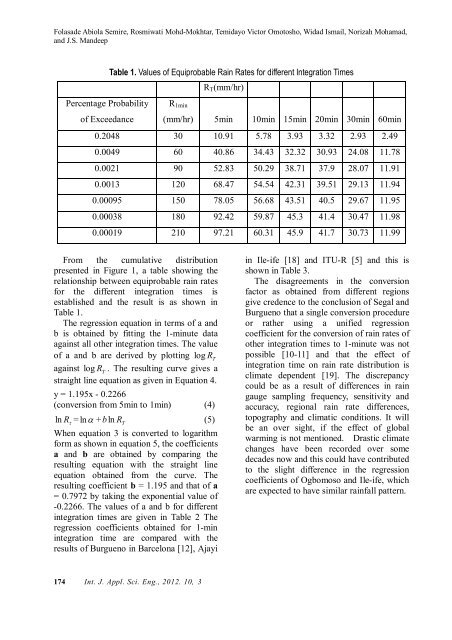
Percentage Probability<br />
of Exceedance<br />
Table 1. Values of Equiprobable Rain Rates for different Integration Times<br />
R1min<br />
174 Int. J. Appl. Sci. Eng., 2012. 10, 3<br />
RT(mm/hr)<br />
(mm/hr) 5min 10min 15min 20min 30min 60min<br />
0.2048 30 10.91 5.78 3.93 3.32 2.93 2.49<br />
0.0049 60 40.86 34.43 32.32 30.93 24.08 11.78<br />
0.0021 90 52.83 50.29 38.71 37.9 28.07 11.91<br />
0.0013 120 68.47 54.54 42.31 39.51 29.13 11.94<br />
0.00095 150 78.05 56.68 43.51 40.5 29.67 11.95<br />
0.00038 180 92.42 59.87 45.3 41.4 30.47 11.98<br />
0.00019 210 97.21 60.31 45.9 41.7 30.73 11.99<br />
From the cumulative distribution<br />
presented in Figure 1, a table showing the<br />
relationship between equiprobable rain rates<br />
for the different integration times is<br />
established and the result is as shown in<br />
Table 1.<br />
The regression equation in terms of a and<br />
b is obtained by fitting the 1-minute data<br />
against all other integration times. The value<br />
of a and b are derived by plotting log R T<br />
against log R T . The resulting curve gives a<br />
straight line equation as given in Equation 4.<br />
y = 1.195x - 0.2266<br />
(conversion from 5min to 1min) (4)<br />
ln R<br />
= ln + T R bln (5)<br />
When equation 3 is converted to logarithm<br />
form as shown in equation 5, the coefficients<br />
a and b are obtained by comparing the<br />
resulting equation with the straight line<br />
equation obtained from the curve. The<br />
resulting coefficient b = 1.195 and that of a<br />
= 0.7972 by taking the exponential value of<br />
-0.2266. The values of a and b for different<br />
integration times are given in Table 2 The<br />
regression coefficients obtained for 1-min<br />
integration time are compared with the<br />
results of Burgueno in Barcelona [12], Ajayi<br />
in Ile-ife [18] and ITU-R [5] and this is<br />
shown in Table 3.<br />
The disagreements in the conversion<br />
factor as obtained from different regions<br />
give credence to the conclusion of Segal and<br />
Burgueno that a single conversion procedure<br />
or rather using a unified regression<br />
coefficient for the conversion of rain rates of<br />
other integration times to 1-minute was not<br />
possible [10-11] and that the effect of<br />
integration time on rain rate distribution is<br />
climate dependent [19]. The discrepancy<br />
could be as a result of differences in rain<br />
gauge sampling frequency, sensitivity and<br />
accuracy, regional rain rate differences,<br />
topography and climatic conditions. It will<br />
be an over sight, if the effect of global<br />
warming is not mentioned. Drastic climate<br />
changes have been recorded over some<br />
decades now and this could have contributed<br />
to the slight difference in the regression<br />
coefficients of Ogbomoso and Ile-ife, which<br />
are expected to have similar rainfall pattern.