Maternal nutritional risk factors for small for gestational age babies ...
Maternal nutritional risk factors for small for gestational age babies ...
Maternal nutritional risk factors for small for gestational age babies ...

Create successful ePaper yourself
Turn your PDF publications into a flip-book with our unique Google optimized e-Paper software.
ORIGINAL ARTICLE<br />
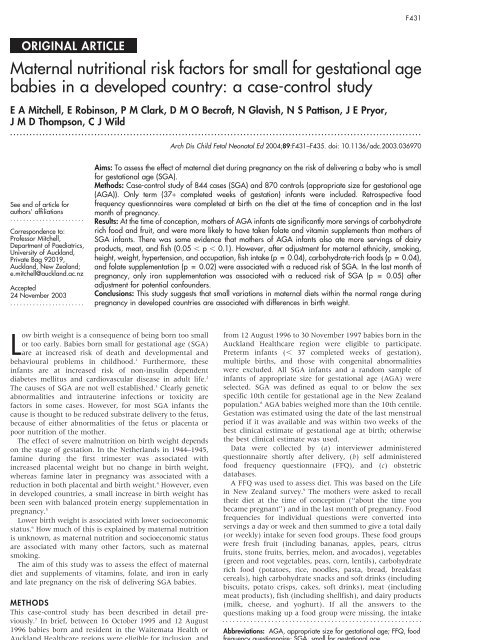
<strong>Maternal</strong> <strong>nutritional</strong> <strong>risk</strong> <strong>factors</strong> <strong>for</strong> <strong>small</strong> <strong>for</strong> <strong>gestational</strong> <strong>age</strong><br />
<strong>babies</strong> in a developed country: a case-control study<br />
E A Mitchell, E Robinson, P M Clark, D M O Becroft, N Glavish, N S Pattison, J E Pryor,<br />
J M D Thompson, C J Wild<br />
...............................................................................................................................<br />
See end of article <strong>for</strong><br />
authors’ affiliations<br />
.......................<br />
Correspondence to:<br />
Professor Mitchell,<br />
Department of Paediatrics,<br />
University of Auckland,<br />
Private Bag 92019,<br />
Auckland, New Zealand;<br />
e.mitchell@auckland.ac.nz<br />
Accepted<br />
24 November 2003<br />
.......................<br />
L ow<br />
Arch Dis Child Fetal Neonatal Ed 2004;89:F431–F435. doi: 10.1136/adc.2003.036970<br />
Aims: To assess the effect of maternal diet during pregnancy on the <strong>risk</strong> of delivering a baby who is <strong>small</strong><br />
<strong>for</strong> <strong>gestational</strong> <strong>age</strong> (SGA).<br />
Methods: Case-control study of 844 cases (SGA) and 870 controls (appropriate size <strong>for</strong> <strong>gestational</strong> <strong>age</strong><br />
(AGA)). Only term (37+ completed weeks of gestation) infants were included. Retrospective food<br />
frequency questionnaires were completed at birth on the diet at the time of conception and in the last<br />
month of pregnancy.<br />
Results: At the time of conception, mothers of AGA infants ate significantly more servings of carbohydrate<br />
rich food and fruit, and were more likely to have taken folate and vitamin supplements than mothers of<br />
SGA infants. There was some evidence that mothers of AGA infants also ate more servings of dairy<br />
products, meat, and fish (0.05 , p , 0.1). However, after adjustment <strong>for</strong> maternal ethnicity, smoking,<br />
height, weight, hypertension, and occupation, fish intake (p = 0.04), carbohydrate-rich foods (p = 0.04),<br />
and folate supplementation (p = 0.02) were associated with a reduced <strong>risk</strong> of SGA. In the last month of<br />
pregnancy, only iron supplementation was associated with a reduced <strong>risk</strong> of SGA (p = 0.05) after<br />
adjustment <strong>for</strong> potential confounders.<br />
Conclusions: This study suggests that <strong>small</strong> variations in maternal diets within the normal range during<br />
pregnancy in developed countries are associated with differences in birth weight.<br />
birth weight is a consequence of being born too <strong>small</strong><br />
or too early. Babies born <strong>small</strong> <strong>for</strong> <strong>gestational</strong> <strong>age</strong> (SGA)<br />
are at increased <strong>risk</strong> of death and developmental and<br />
behavioural problems in childhood. 1 Furthermore, these<br />
infants are at increased <strong>risk</strong> of non-insulin dependent<br />
diabetes mellitus and cardiovascular disease in adult life. 2<br />
The causes of SGA are not well established. 3 Clearly genetic<br />
abnormalities and intrauterine infections or toxicity are<br />
<strong>factors</strong> in some cases. However, <strong>for</strong> most SGA infants the<br />
cause is thought to be reduced substrate delivery to the fetus,<br />
because of either abnormalities of the fetus or placenta or<br />
poor nutrition of the mother.<br />
The effect of severe malnutrition on birth weight depends<br />
on the st<strong>age</strong> of gestation. In the Netherlands in 1944–1945,<br />
famine during the first trimester was associated with<br />
increased placental weight but no change in birth weight,<br />
whereas famine later in pregnancy was associated with a<br />
reduction in both placental and birth weight. 4 However, even<br />
in developed countries, a <strong>small</strong> increase in birth weight has<br />
been seen with balanced protein energy supplementation in<br />
pregnancy. 5<br />
Lower birth weight is associated with lower socioeconomic<br />
status. 6 How much of this is explained by maternal nutrition<br />
is unknown, as maternal nutrition and socioeconomic status<br />
are associated with many other <strong>factors</strong>, such as maternal<br />
smoking.<br />
The aim of this study was to assess the effect of maternal<br />
diet and supplements of vitamins, folate, and iron in early<br />
and late pregnancy on the <strong>risk</strong> of delivering SGA <strong>babies</strong>.<br />
METHODS<br />
This case-control study has been described in detail previously.<br />
7 In brief, between 16 October 1995 and 12 August<br />
1996 <strong>babies</strong> born and resident in the Waitemata Health or<br />
Auckland Healthcare regions were eligible <strong>for</strong> inclusion, and<br />
F431<br />
from 12 August 1996 to 30 November 1997 <strong>babies</strong> born in the<br />
Auckland Healthcare region were eligible to participate.<br />
Preterm infants (, 37 completed weeks of gestation),<br />
multiple births, and those with congenital abnormalities<br />
were excluded. All SGA infants and a random sample of<br />
infants of appropriate size <strong>for</strong> <strong>gestational</strong> <strong>age</strong> (AGA) were<br />
selected. SGA was defined as equal to or below the sex<br />
specific 10th centile <strong>for</strong> <strong>gestational</strong> <strong>age</strong> in the New Zealand<br />
population. 8 AGA <strong>babies</strong> weighed more than the 10th centile.<br />
Gestation was estimated using the date of the last menstrual<br />
period if it was available and was within two weeks of the<br />
best clinical estimate of <strong>gestational</strong> <strong>age</strong> at birth; otherwise<br />
the best clinical estimate was used.<br />
Data were collected by (a) interviewer administered<br />
questionnaire shortly after delivery, (b) self administered<br />
food frequency questionnaire (FFQ), and (c) obstetric<br />
databases.<br />
A FFQ was used to assess diet. This was based on the Life<br />
in New Zealand survey. 9 The mothers were asked to recall<br />
their diet at the time of conception (‘‘about the time you<br />
became pregnant’’) and in the last month of pregnancy. Food<br />
frequencies <strong>for</strong> individual questions were converted into<br />
servings a day or week and then summed to give a total daily<br />
(or weekly) intake <strong>for</strong> seven food groups. These food groups<br />
were fresh fruit (including bananas, apples, pears, citrus<br />
fruits, stone fruits, berries, melon, and avocados), vegetables<br />
(green and root vegetables, peas, corn, lentils), carbohydrate<br />
rich food (potatoes, rice, noodles, pasta, bread, breakfast<br />
cereals), high carbohydrate snacks and soft drinks (including<br />
biscuits, potato crisps, cakes, soft drinks), meat (including<br />
meat products), fish (including shellfish), and dairy products<br />
(milk, cheese, and yoghurt). If all the answers to the<br />
questions making up a food group were missing, the intake<br />
Abbreviations: AGA, appropriate size <strong>for</strong> <strong>gestational</strong> <strong>age</strong>; FFQ, food<br />
frequency questionnaire; SGA, <strong>small</strong> <strong>for</strong> <strong>gestational</strong> <strong>age</strong><br />
www.archdischild.com
F432 Mitchell, Robinson, Clark, et al<br />
was specified as missing. If only some of the answers were<br />
missing, they were designated as ‘‘not at all’’—that is, given a<br />
zero intake score—and the total intake calculated. Vitamin,<br />
folate, and iron supplements were recorded as taken at least<br />
once a week.<br />
Mann-Witney U tests were used to investigate differences<br />
in daily intake of the food groups between mothers of SGA<br />
and AGA infants. x 2 tests were used to investigate the<br />
association between having an SGA infant and the use of<br />
supplements. Logistic regression models were used to<br />
investigate whether maternal food intake had an effect on<br />
whether or not the infant was SGA after controlling <strong>for</strong><br />
socioeconomic status, ethnicity, maternal height, maternal<br />
weight be<strong>for</strong>e pregnancy, maternal hypertension, and maternal<br />
smoking. In the logistic regressions, the daily intake was<br />
categorised.<br />
The occupation of the mother and her partner was self<br />
reported. Socioeconomic status was defined using the<br />
subject’s occupation, or that of her partner if higher using<br />
the Elly Irving classification of occupation. 10 Social classes I<br />
and II were categorised as high, III and IV as middle, and V,<br />
VI, and others as low. Ethnic group was the self reported<br />
ethnicity collected by the obstetric hospitals from the<br />
mothers during their pregnancy. The options available were<br />
Maori, European, Pacific Islanders, Indian, Chinese, other.<br />
The study was approved by the North Health research<br />
ethics committee.<br />
Diet recall study<br />
Ninety one women were recruited early in pregnancy and<br />
completed a FFQ about their dietary intake around the time<br />
of conception. At the time of the birth of the child, they were<br />
asked to complete the same questionnaire recalling the same<br />
time period. For each food group, the median number of<br />
servings was compared, as was the distribution of the<br />
responses.<br />
RESULTS<br />
A total of 2182 infants were eligible <strong>for</strong> this study, and the<br />
parents of 1714 (78.6%) completed the interviewer administered<br />
questionnaire (844 SGA and 870 AGA). Of these 1714,<br />
1691 (98.7%) allowed access to their obstetric records and the<br />
records were found. Table 1 shows the characteristics of the<br />
mothers in the study population. Overall, 67% and 66% of<br />
www.archdischild.com<br />
subjects completed the FFQ <strong>for</strong> the time relating to the time<br />
of conception and <strong>for</strong> the last month of pregnancy<br />
respectively.<br />
Around the time of conception, mothers of AGA infants ate<br />
significantly more servings of carbohydrate rich foods, fruit,<br />
and dairy products (univariate analyses, table 2), and were<br />
more likely to take folate (odds ratio (OR) 1.61; 95%<br />
confidence interval (CI) 1.22 to 2.08) and vitamin (OR<br />
1.35; 95%CI 1.02 to 1.78) supplements than mothers of SGA<br />
infants. There was some evidence that mothers of AGA<br />
infants also ate more servings of meat and fish (0.05 , p , 0.1)<br />
(table 2). However, after adjustment <strong>for</strong> ethnicity, smoking,<br />
height, weight, hypertension, and socioeconomic status, fish<br />
intake (p = 0.04), carbohydrate rich foods (p = 0.04), and<br />
folate supplementation (table 3, p = 0.02) were associated<br />
with a reduced <strong>risk</strong> of SGA.<br />
In the last month of pregnancy at the univariate level<br />
mothers of AGA infants consumed significantly more<br />
servings of carbohydrate rich foods, high carbohydrate<br />
snacks and soft drinks, fruit, dairy products, and vitamin<br />
Table 1 Characteristics of the mothers of 844 <strong>small</strong> <strong>for</strong> <strong>gestational</strong> <strong>age</strong> (SGA) and 870<br />
appropriate size <strong>for</strong> <strong>gestational</strong> <strong>age</strong> (AGA) infants<br />
SGA AGA<br />
n (%) n (%)<br />
Table 2 Median number of servings <strong>for</strong> mothers of <strong>small</strong><br />
<strong>for</strong> <strong>gestational</strong> <strong>age</strong> (SGA) and appropriate size <strong>for</strong><br />
<strong>gestational</strong> <strong>age</strong> (AGA) infants at the time of conception<br />
and last month of pregnancy<br />
OR (95% CI)<br />
Socioeconomic group x 2 = 25.2, p,0.001<br />
High 348 (41.2) 464 (53.4) 1.00<br />
Middle 319 (37.8) 266 (30.5) 1.60 (1.29 to 1.98)<br />
Low 177 (19.0) 140 (15.1) 1.69 (1.30 to 2.19)<br />
Ethnicity x 2 = 89.9, p,0.001<br />
European 385 (45.7) 486 (56.0) 1.00<br />
Maori 106 (12.6) 72 (8.3) 1.86 (1.34 to 2.58)<br />
Pacific 106 (12.6) 185 (21.3) 0.72 (0.55 to 0.95)<br />
Indian 107 (12.7) 31 (3.6) 4.36 (2.86 to 6.64)<br />
Chinese, other Asian, others 139 (16.5) 94 (10.8) 1.87 (1.38 to 2.53)<br />
Smoking x 2 = 43.3, p,0.001<br />
No 547 (66.4) 683 (80.5) 1.00<br />
Yes 277 (33.6) 165 (19.5) 2.11 (1.69 to 2.64)<br />
Mean (SD) Mean (SD) t Value, p value<br />
Age (years) 29.1 (5.7) 30.3 (5.5) 4.75, ,0.001<br />
Height (m) 1.62 (0.07) 1.65 (0.07) 10.08, ,0.001<br />
Weight (kg) 59.8 (13.7) 66.5 (14.5) 9.85, ,0.001<br />
SGA AGA p Value*<br />
At the time of conception<br />
Fruit per day 1.4 1.5 0.03<br />
Vegetables per day 1.4 1.6 0.11<br />
Meat per week 4.0 4.5 0.09<br />
Fish per week 0.5 1.0 0.08<br />
Dairy products per day 2.2 2.5 0.056<br />
Carbohydrate rich foods per day 2.8 3.1 0.004<br />
High carbohydrate snacks and soft<br />
drinks per day<br />
Last month of pregnancy<br />
1.4 1.4 0.10<br />
Fruit per day 1.9 2.1 0.007<br />
Vegetables per day 1.6 1.6 0.30<br />
Meat per week 4.2 4.2 0.64<br />
Fish per week 0.5 0.5 0.48<br />
Dairy products per day 2.8 3.0 0.05<br />
Carbohydrate rich foods per day 3.0 3.3 0.002<br />
High carbohydrate snacks and soft<br />
drinks per day<br />
1.5 1.8 0.046<br />
*Mann-Whitney U test.
<strong>Maternal</strong> diet and birth weight F433<br />
Table 3 Number and multivariate odds ratios <strong>for</strong> <strong>small</strong> <strong>for</strong> <strong>gestational</strong> <strong>age</strong> (SGA) <strong>for</strong><br />
servings <strong>for</strong> each food group at the time of conception<br />
Food group SGA AGA Multivariate OR (95% CI)<br />
Fruit n = 542 n = 600 p = 0.12, df = 4, x 2 = 7.27<br />
0–0.75 132 104 1.49 (1.00 to 2.24)<br />
.0.75–1.25 107 144 0.99 (0.67 to 1.47)<br />
.1.25–2.0 115 117 1.44 (0.96 to 2.17)<br />
.2.0–3.0 84 96 1.23 (0.80 to 1.90)<br />
.3 104 139 1<br />
Vegetables n = 539 n = 598 p = 0.32, df = 4, x 2 = 4.71<br />
0–0.75 138 137 1.25 (0.79 to 1.97)<br />
.0.75–1.25 93 81 1.58 (0.97 to 2.58)<br />
.1.25–2.0 87 104 1.12 (0.70 to 1.80)<br />
.2.0–3.0 126 190 1.40 (0.91 to 2.14)<br />
.3 99 86 1<br />
Meat n = 533 n = 598 p = 0.79, df = 4, x 2 = 1.71<br />
0–2 60 42 1.36 (0.80 to 2.29)<br />
.2–4 180 193 1.07 (0.76 to 1.51)<br />
.4–5 85 114 0.97 (0.64 to 1.45)<br />
.5–6 71 81 1.01 (0.65 to 1.56)<br />
.6 137 168 1<br />
Fish n = 529 n = 592 p = 0.04, df = 2, x 2 = 6.68<br />
None 110 84 1.69 (1.07–2.69)<br />
Up to one 312 382 1.09 (0.75 to 1.58)<br />
More than one 107 126 1<br />
Dairy products n = 533 n = 597 p = 0.21, df = 4, x 2 = 5.83<br />
0–1.25 108 92 1.13 (0.75 to 1.72)<br />
.1.25–2.0 115 121 1.09 (0.73 to 1.62)<br />
.2.0–3.0 114 152 0.81 (0.55 to 1.19)<br />
.3.0–4.0 70 103 0.74 (0.48 to 1.14)<br />
.4.0 117 125 1<br />
Carbohydrate rich<br />
foods<br />
n = 538 n = 598 p = 0.04, df = 4, x 2 = 10.37<br />
0–1.5 154 127 1.31 (0.88 to 1.97)<br />
.1.5–2.25 114 109 1.22 (0.80 to 1.86)<br />
.2.25–2.75 105 147 0.81 (0.54 to 1.23)<br />
.2.75–3.5 70 108 0.77 (0.49 to 1.21)<br />
.3.5 96 107 1<br />
High carbohydrate<br />
snacks and soft drinks<br />
n = 538 n = 597 p = 0.35, df = 3, x 2 = 3.31<br />
0–,1 189 197 1.27 (0.85 to 1.91)<br />
1–,2 172 171 1.37 (0.91 to 2.06)<br />
2–,3 101 132 1.06 (0.68 to 1.65)<br />
>3 72 97 1<br />
Vitamins n = 529 n = 593 p = 0.09, df = 1, x 2 = 2.81<br />
Yes 124 173 0.78 (0.58 to 1.04)<br />
No 405 420 1<br />
Folate supplement n = 503 n = 573 p = 0.02, df = 1, x 2 = 5.58<br />
Yes 139 220 0.70 (0.52 to 0.94)<br />
No 349 345 1<br />
Iron supplement n = 497 n = 562 p = 0.81, df = 1, x 2 = 0.06<br />
Yes 98 90 1.05 (0.73 to 1.50)<br />
No 399 472 1<br />
Food groups are analysed according to servings a day, except <strong>for</strong> meat and fish which are analysed according to<br />
servings a week.<br />
supplementation (OR 1.35:95%CI 1.01 to 1.85) than mothers<br />
of SGA infants (table 2). However, after adjustment <strong>for</strong><br />
potential confounders only iron supplementation was associated<br />
with a reduced <strong>risk</strong> of SGA (table 4, p = 0.05).<br />
Diet recall study<br />
Eighty women completed questionnaires during early pregnancy<br />
(mean (SD) gestation 8.2 (1.9) weeks) and after the<br />
birth of the child (mean (SD) <strong>age</strong> 1.4 (1.3) weeks).<br />
The median number of servings <strong>for</strong> each food group did not<br />
differ markedly between the two recorded times; however,<br />
there was a tendency <strong>for</strong> mothers to recall slightly lower<br />
quantities of dairy products, meat, and carbohydrate rich<br />
foods (table 5).<br />
DISCUSSION<br />
Limitations in this study must be recognised. We have<br />
previously shown that non-respondents were more likely to<br />
be mothers of SGA infants than mothers of AGA <strong>babies</strong><br />
(22.3% v 16.6%) and that non responders are more likely to<br />
be smokers. 7 Furthermore, among the subjects who were<br />
interviewed, non-Europeans were less likely to complete the<br />
FFQs. Secondly, FFQs have considerable measurement error,<br />
as do most dietary assessment tools. 11 Studies of <strong>nutritional</strong><br />
effects using FFQs tend to be notoriously underpowered even<br />
when conventional methods of adjusting <strong>for</strong> measurement<br />
error are used. However, FFQ was chosen as we were<br />
particularly interested in the diet around the time of<br />
conception, and it would not have been feasible to identify<br />
sufficient women in early pregnancy to use the seven day<br />
semiquantitative food diary or weighed food records.<br />
Furthermore, diet at the time of conception was recalled<br />
about nine months later. However, we have shown that this<br />
does not introduce a systematic error, although it does<br />
increase measurement error. The strengths of this study are<br />
the large sample size and large number of SGA <strong>babies</strong>.<br />
After adjustment <strong>for</strong> potential confounders, mothers of<br />
AGA infants ate more servings of fish (p = 0.04) and<br />
carbohydrate rich foods (p = 0.04) and more used<br />
supplements of folic acid (p = 0.02) in early pregnancy.<br />
www.archdischild.com
F434 Mitchell, Robinson, Clark, et al<br />
Table 4 Number and multivariate odds ratios <strong>for</strong> <strong>small</strong> <strong>for</strong> <strong>gestational</strong> <strong>age</strong> (SGA) <strong>for</strong><br />
servings <strong>for</strong> each food group in the last month of pregnancy<br />
Food group SGA AGA Multivariate OR (95% CI)<br />
Fruit n = 540 n = 598 p = 0.19, df = 4, x 2 = 6.11<br />
0–0.75 95 62 1.53 (0.99 to 2.35)<br />
.0.75–1.25 82 83 1.08 (0.72 to 1.63)<br />
.1.25–2.0 111 136 0.93 (0.61 to 1.40)<br />
.2.0–3.0 89 123 1.04 (0.69 to 1.57)<br />
.3 163 194 1<br />
Vegetables n = 539 n = 598 p = 0.12, df = 4, x 2 = 7.25<br />
0–0.75 146 126 1.20 (0.76 to 1.92)<br />
.0.75–1.25 76 84 0.94 (0.57 to 1.56)<br />
.1.25–2.0 91 132 0.69 (0.43 to 1.10)<br />
.2.0–3.0 159 183 0.98 (0.64 to 1.51)<br />
.3.0 67 73 1<br />
Meat n = 534 n = 597 p = 0.66, df = 4, x 2 = 2.44<br />
0–2 56 57 0.70 (0.43 to 1.16)<br />
.2–4 177 202 0.84 (0.59 to 1.19)<br />
.4–5 102 123 0.85 (0.57 to 1.26)<br />
.5–6 66 72 0.97 (0.62 to 1.53)<br />
.6 133 143 1<br />
Fish n = 529 n = 593 p = 0.39, df = 2, x 2 = 1.90<br />
None 138 137 1.29 (0.83 to 1.99)<br />
Up to one 284 344 1.07 (0.73 to 1.57)<br />
More than one 144 112 1<br />
Dairy products n = 536 n = 596 p = 0.38, df = 4, x 2 = 4.22<br />
0–1.25 77 64 1.21 (0.78 to 1.87)<br />
.1.25–2.0 81 85 1.08 (0.72 to 1.63)<br />
.2.0–3.0 130 144 0.98 (0.69 to 1.40)<br />
.3.0–4.0 158 124 0.76 (0.52 to 1.19)<br />
.4.0 102 175 1<br />
Carbohydrate rich<br />
foods<br />
n = 539 n = 598 p = 0.17, df = 4, x 2 = 6.48<br />
0–1.5 123 101 1.52 (0.99 to 2.33)<br />
.1.5–2.25 96 100 1.36 (0.87 to 2.13)<br />
.2.25–2.75 114 125 1.08 (0.71 to 1.65)<br />
.2.75–3.5 118 170 1.00 (0.67 to 1.51)<br />
.3.5 89 102 1<br />
High carbohydrate<br />
snacks and soft drinks<br />
n = 538 n = 597 p = 0.22, df = 3, x 2 = 4.40<br />
0–,1 173 155 1.26 (0.86 to 1.85)<br />
1–,2 165 184 1.18 (0.81 to 1.71)<br />
2–,3 100 137 0.88 (0.58 to 1.32)<br />
>3 100 121 1<br />
Vitamins n = 526 n = 591 p = 0.1, df = 1, x 2 = 2.78<br />
Yes 97 139 0.76 (0.55–1.05)<br />
No 429 452 1<br />
Folate supplement n = 473 n = 546 p = 0.2, df = 1, x 2 = 1.65<br />
Yes 33 38 0.70 (0.41 to 1.20)<br />
No 440 508 1<br />
Iron supplement n = 507 n = 579 p = 0.05, df = 1, x 2 = 3.71<br />
Yes 185 220 0.76 (0.57 to 1.01)<br />
No 322 359 1<br />
Food groups are analysed according to servings a day, except <strong>for</strong> meat and fish which are analysed according to<br />
servings a week.<br />
The strongest association was found with folic acid supplementation.<br />
Folic acid is thought to be important <strong>for</strong> fetal<br />
growth. 12 Our finding is consistent with some randomised<br />
Table 5 Diet recall study: difference in servings at the<br />
time of conception recorded in early pregnancy<br />
compared with that recalled at the time of the birth of child<br />
Median<br />
Lower quartile,<br />
upper quartile<br />
Fruit a day 0.0 20.57, 0.57<br />
Vegetables a day 0.0 20.82, 0.25<br />
Meat a week 0.5 21.0, 1.5<br />
Fish a week 0.0 20.5, 0.0<br />
Dairy products a day 0.40 20.09, 1.04<br />
Carbohydrate rich foods a day 0.25 20.14, 0.96<br />
High carbohydrate snacks and soft<br />
drinks a day<br />
0.07 20.28, 0.78<br />
www.archdischild.com<br />
controlled studies which have shown that folic acid<br />
supplementation increases birth weight, 13 although a<br />
Cochrane review found a non- significant reduction in low<br />
birth weight in controlled trials of folate supplementation. 14<br />
In developed countries, there is a well established association<br />
between folate status of pregnant women and the birth<br />
weight of their infant. 15 Folic acid intake from the diet is<br />
thought to be marginal in many pregnant women in<br />
developed countries. 16<br />
The finding that fish intake in early pregnancy was<br />
associated with a lower <strong>risk</strong> of SGA was in keeping with<br />
observations from Scandinavia that women who eat a lot of<br />
fish tend to have heavier <strong>babies</strong>. 17 18 It is postulated that the<br />
high intake of omega-3 oils affects prostaglandin synthesis,<br />
leading to prolonged pregnancies as well as <strong>babies</strong> that are<br />
heavier <strong>for</strong> <strong>gestational</strong> <strong>age</strong>. An interventional study found<br />
that a fish oil supplementation reduced the recurrence <strong>risk</strong> of<br />
preterm birth, but had no effect on intrauterine growth<br />
retardation. 19 Fish is expensive in New Zealand, and the<br />
amount of fish eaten in our cohort was generally <strong>small</strong>. Our
<strong>Maternal</strong> diet and birth weight F435<br />
findings suggest that in New Zealand even a modest fish<br />
intake in pregnancy is associated with a reduced <strong>risk</strong> of<br />
having a growth restricted baby.<br />
The number of servings of carbohydrate rich foods in early<br />
pregnancy was associated with a reduced <strong>risk</strong> of SGA<br />
(p = 0.04). The evidence linking variations in carbohydrate<br />
intake of supposedly well nourished women with size of their<br />
<strong>babies</strong> at birth is contradictory. Our results contrast with the<br />
prospective observational study of Godfrey et al. 20 That study<br />
found that mothers with a high carbohydrate intake in early<br />
pregnancy had lighter <strong>babies</strong>. Matthews et al, 21 in another<br />
prospective study set like that of Godfrey et al in the south of<br />
England, failed to find any relation between size at birth and<br />
the intake of any macronutrient. The authors looked at<br />
macronutrients and micronutrients derived from a semiquantitative<br />
seven day food diary and from extensive FFQs<br />
respectively. Given the retrospective nature of this part of our<br />
study, we felt it prudent to describe the foods eaten, rather<br />
than extrapolate to their constituent parts. Thus our measure<br />
of carbohydrate intake will not be directly comparable to that<br />
of Godfrey et al. In rural India where maternal undernutrition<br />
is common, no association was seen with maternal energy<br />
intake and size at birth. 15<br />
In contrast with the findings at the time of conception,<br />
there were few associations with SGA when the diet in the<br />
last month of pregnancy was considered. Only oral iron<br />
supplementation was significantly associated with a reduced<br />
<strong>risk</strong> of SGA after adjustment <strong>for</strong> potential confounders<br />
(p = 0.05). This finding contrasts with the conclusion of a<br />
review that iron supplementation of anaemic or non-anaemic<br />
pregnant women does not increase birth weight. 22 It is also<br />
consistent with previous studies in developed countries that<br />
have assessed diet in late pregnancy, which have concluded<br />
that maternal nutrition does not have an important effect on<br />
birth weight. Godfrey et al 20 also found that there was no<br />
univariate association between nutrient intake in late<br />
pregnancy and either birth weight or placental weight.<br />
In summary, after allowing <strong>for</strong> <strong>factors</strong> known to be<br />
associated with SGA in this cohort, we have shown that<br />
eating more fish and carbohydrate rich foods and taking<br />
folate supplements around the time of conception is<br />
associated with a reduced <strong>risk</strong> of having an SGA baby. Iron<br />
supplements in late pregnancy are also associated with a<br />
reduced <strong>risk</strong>. This study suggests that <strong>small</strong> variations in<br />
maternal diet in early pregnancy could have important effects<br />
on birth weight and even on later health outcomes.<br />
ACKNOWLEDGEMENTS<br />
This study was funded by the Health Research Council of New<br />
Zealand (HRC), the Foundation <strong>for</strong> the Newborn, and the Hawkes<br />
Bay Medical Research Foundation. EAM is supported in part by the<br />
Child Health Research Foundation. The study was coordinated by Ms<br />
K Rees. We sincerely thank the mothers who took part.<br />
.....................<br />
Authors’ affiliations<br />
E A Mitchell, P M Clark, J M D Thompson, D M O Becroft, Department of<br />
Paediatrics, University of Auckland, Auckland, New Zealand<br />
E Robinson, Department of Community Health, Private Bag 92019,<br />
University of Auckland<br />
C J Wild, Department of Statistics, University of Auckland<br />
D M O Becroft, N S Pattison, Department of Obstetrics & Gynaecology,<br />
University of Auckland<br />
N Glavish, He Kamaka Oranga, Maori Health Man<strong>age</strong>ment, Green<br />
Lane Hospital, Auckland<br />
J E Pryor, Department of Behavioural and Developmental Psychology,<br />
University of Auckland<br />
REFERENCES<br />
1 Allen MC. Developmental outcomes and follow-up of <strong>small</strong>-<strong>for</strong>-<strong>gestational</strong><br />
infants. Semin Perinatol 1984;8:123–56.<br />
2 Barker DJ, Gluckman PD, Godfrey KM, et al. Fetal nutrition and<br />
cardiovascular disease in adult life. Lancet 1993;341:938–41.<br />
3 Kramer MS. Determinants of low birth weight: methodological assessment and<br />
meta-analysis. Bull WHO 1987;65:663–737.<br />
4 Lumey LH. Compensatory placental growth after restricted maternal nutrition<br />
in early pregnancy. Placenta 1998;19:105–11.<br />
5 Kramer MS. Balanced protein/energy supplementation in pregnancy<br />
(Cochrane Review). Cochrane Library. Issue 4. Ox<strong>for</strong>d: Update Software,<br />
2002.<br />
6 Spencer N, Logan S. Social influences on birth weight. Arch Dis Child Fetal<br />
Neonatal Ed 2002;86:F6–7.<br />
7 Thompson JMD, Clark PM, Robinson E, et al. Risk <strong>factors</strong> <strong>for</strong> <strong>small</strong> <strong>for</strong><br />
<strong>gestational</strong> <strong>age</strong> <strong>babies</strong>: the Auckland Birth weight Collaborative (ABC) Study.<br />
J Paediatr Child Health 2001;37:369–75.<br />
8 Thompson JMD, Mitchell EA. Sex specific birthweight percentiles by<br />
<strong>gestational</strong> <strong>age</strong> <strong>for</strong> New Zealand. N Z Med J 1994;107:1–3.<br />
9 Life in New Zealand. Commission report prepared by University of Otago.<br />
Wellington: Hillary Commission <strong>for</strong> Recreation and Sport, 1991.<br />
10 Elley WB, Irving JC. Revised socioeconomic index <strong>for</strong> New Zealand. New<br />
Zealand Journal of Educational Studies 1976;11:25–30.<br />
11 Kipnis V, Subar A, Midthune D, et al. Dietary measurement error and its<br />
implications: results of the OPEN biomarker study. FASEB J 2002;16:A27.<br />
12 Tamura T. Nutrient interactions between folate and zinc or copper: their<br />
possible implications to pregnancy outcome. In: Massaro EJ, Rogers JM, eds.<br />
Folate and human development. Clifton, NJ: Humana Press, 2002:219–40.<br />
13 Rolschau J, Kristoffersen K, Ulrich M, et al. The influence of folic acid<br />
supplement on the outcome of pregnancies in the county of Funen in Denmark.<br />
Part I. Eur J Obstet Gynecol Reprod Biol 1999;87:105–10.<br />
14 Mahomed K. Folate supplementation in pregnancy (Cochrane Review).<br />
Cochrane Library. Issue 4. Ox<strong>for</strong>d: Update Software, 2002.<br />
15 Ek J. Plasma and red cell folate in mothers and infants in normal pregnancies.<br />
Relation to birth weight. Acta Obstet Gynecol Scand 1982;61:17–20.<br />
16 Gonzalez-Gross M, Prinz-Langenohl R, Pietrzik K. Folate status in Germany<br />
1997–2000. Int J Vitam Nutr Res 2002;72:351–9.<br />
17 Olsen SF, Olsen J, Frische G. Does fish consumption during pregnancy<br />
increase fetal growth? A study of the size of the newborn, placental weight<br />
and <strong>gestational</strong> <strong>age</strong> in relation to fish consumption during pregnancy.<br />
Int J Epidemiol 1990;19:971–7.<br />
18 Olsen SF, Secher NJ. Low consumption of seafood in early pregnancy as a <strong>risk</strong><br />
factor <strong>for</strong> preterm delivery: prospective cohort study. BMJ 2002;324:447.<br />
19 Olsen SF, Secher NJ, Tabor A, et al. Randomised clinical trials of fish oil<br />
supplementation in high <strong>risk</strong> pregnancies. Fish Oil Trials In Pregnancy (FOTIP)<br />
Team. BJOG 2000;107:382–95.<br />
20 Godfrey K, Robinson S, Barker DJP, et al. <strong>Maternal</strong> nutrition in early and late<br />
pregnancy in relation to placental and fetal growth. BMJ 1996;312:410–14.<br />
21 Mathews F, Yudkin P, Neil A. Influence of maternal nutrition on outcome of<br />
pregnancy: prospective cohort study. BMJ 1999;319:339–43.<br />
22 Rasmussen KM. Is there a causal relationship between iron deficieny or irondeficiency<br />
anaemia and weight at birth, length of gestation and perinatal<br />
mortality? J Nutr 2001;131:590S–603S.<br />
www.archdischild.com