Are SUVs Really Safer Than Cars? - Environmental Energy ...
Are SUVs Really Safer Than Cars? - Environmental Energy ...
Are SUVs Really Safer Than Cars? - Environmental Energy ...

You also want an ePaper? Increase the reach of your titles
YUMPU automatically turns print PDFs into web optimized ePapers that Google loves.
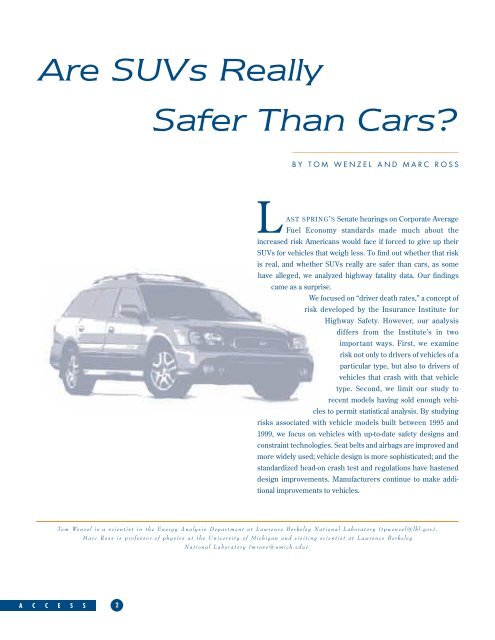
<strong>Are</strong> <strong>SUVs</strong> <strong>Really</strong><br />
A C C E S S<br />
2<br />
<strong>Safer</strong> <strong>Than</strong> <strong>Cars</strong>?<br />
BY TOM WENZEL AND MARC ROSS<br />
LAST SPRING’S Senate hearings on Corporate Average<br />
Fuel Economy standards made much about the<br />
increased risk Americans would face if forced to give up their<br />
<strong>SUVs</strong> for vehicles that weigh less. To find out whether that risk<br />
is real, and whether <strong>SUVs</strong> really are safer than cars, as some<br />
have alleged, we analyzed highway fatality data. Our findings<br />
came as a surprise.<br />
We focused on “driver death rates,” a concept of<br />
risk developed by the Insurance Institute for<br />
Highway Safety. However, our analysis<br />
differs from the Institute’s in two<br />
important ways. First, we examine<br />
risk not only to drivers of vehicles of a<br />
particular type, but also to drivers of<br />
vehicles that crash with that vehicle<br />
type. Second, we limit our study to<br />
recent models having sold enough vehicles<br />
to permit statistical analysis. By studying<br />
risks associated with vehicle models built between 1995 and<br />
1999, we focus on vehicles with up-to-date safety designs and<br />
constraint technologies. Seat belts and airbags are improved and<br />
more widely used; vehicle design is more sophisticated; and the<br />
standardized head-on crash test and regulations have hastened<br />
design improvements. Manufacturers continue to make additional<br />
improvements to vehicles.<br />
Tom Wenzel is a scientist in the <strong>Energy</strong> Analysis Department at Lawrence Berkeley National Laboratory (tpwenzel@lbl.gov).<br />
Marc Ross is professor of physics at the University of Michigan and visiting scientist at Lawrence Berkeley<br />
National Laboratory (mross@umich.edu).
TWO TYPES OF RISK<br />
We consider nine categories of cars and light trucks, classed<br />
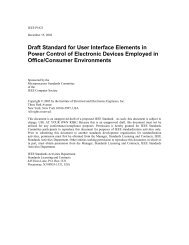
according to size and weight. Figure 1 shows two types of risk.<br />
First is the risk to drivers of each vehicle type, shown on the<br />
horizontal axis (we’re calling these primary drivers); and second<br />
is the risk to drivers of other vehicles that crash with that type<br />
(the vertical axis). We define “risk” as driver deaths per year per<br />
million vehicles sold. Both estimates of risk are calculated for<br />
vehicles from model years 1995 to 1999 and from the number of<br />
deaths in those years. The other vehicle may be of any model<br />
year or type (including motorcycles and heavy-duty trucks and<br />
buses); we have not broken down the other vehicle numbers<br />
according to type or model. The risk to primary drivers includes<br />
driver fatalities from all types of collisions, whether with another<br />
vehicle, a fixed object, a pedestrian, or a cyclist, as well as<br />
noncollisions such as rollovers. To avoid biases associated with<br />
varying numbers of passengers per vehicle, we consider driver<br />
deaths only.<br />
The small circles in Figure 1 show the two weighted average<br />
risks for popular models of each vehicle type. For example, for<br />
the average midsize car, the risk to drivers is 72 deaths per year<br />
per million cars, while the risk to drivers of vehicles they collide<br />
with is 34 deaths per million cars. The shapes around each circle<br />
represent the ranges in each risk for individual models: The<br />
horizontal axis shows that the risk to drivers of, for example,<br />
midsize cars ranges from 47 deaths per year per million cars for<br />
the lowest risk model (Camry) to 97 for the highest risk model<br />
(Lumina). The vertical axis shows that the risk to drivers that<br />
collide with midsize cars ranges from 24 (Camry) to 47 (Lumina)<br />
deaths per million midsize cars.<br />
We define the “combined risk” of each vehicle type and model<br />
as the sum of the “risk to primary drivers” plus the “risk to drivers<br />
of other vehicles.” Diagonal lines in Figure 1 illustrate combined<br />
risks of 100, which roughly corresponds to that of the average<br />
large car, and 130, which roughly corresponds to that of the average<br />
SUV. These lines are diagonal because they combine the risk<br />
to driver (x-axis) and risk to driver of the other vehicle (y-axis).<br />
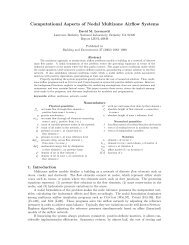
Figure 2 shows the two risks for individual vehicle models<br />
(the most popular ones). The risk to drivers of the most popular<br />
subcompact cars varies by more than a factor of two for individual<br />
models, e.g. from 60 for Jetta to 148 for Escort. Similarly, the<br />
risk to drivers of other vehicles for the most popular pickups<br />
ranges by about two times among individual models, from 65 for<br />
Chevy S-10 to 136 for Ram. ➢<br />
3 A C C E S S<br />
NUMBER 21, FALL 2002
ANNUAL DEATHS OF DRIVERS OF OTHER VEHICLES PER MILLION PRIMARY VEHICLES SOLD<br />
FIGURE 1<br />
150<br />
125<br />
100<br />
75<br />
50<br />
25<br />
Figures 1 and 2 suggest some important relations between<br />
risk and vehicle type. Keep in mind that characteristics of the<br />
drivers of certain vehicle types and models and of the environments<br />
in which the vehicles are driven may strongly affect their<br />
risk. We emphasize that the risks estimated here are not necessarily<br />
inherent in the vehicle designs, but include how and where<br />
the vehicles have been driven.<br />
Midsize and Large <strong>Cars</strong> and <strong>SUVs</strong>. The risk to drivers of<br />
average midsize and large cars is about the same as for the average<br />
SUV. The risks differ in their makeup, with a higher fraction<br />
of fatalities in <strong>SUVs</strong> from rollovers. Similarly, the risk to drivers<br />
of the safest midsize and large car models (Avalon, Camry, and<br />
Accord) is about the same as for the safest <strong>SUVs</strong> (Suburban,<br />
A C C E S S<br />
34<br />
4<br />
Combined<br />
risk = 130<br />
Combined<br />
risk = 100<br />
Minivans<br />
Import luxury cars<br />
<strong>SUVs</strong><br />
Midsize cars<br />
Large cars<br />
Pickup trucks<br />
Compact cars<br />
Subcompact cars<br />
ANNUAL DEATHS OF DRIVERS OF PRIMARY VEHICLES PER MILLION SOLD<br />
Minivans<br />
Pickup trucks<br />
<strong>SUVs</strong><br />
Subcompact cars<br />
Compact cars<br />
Midsize cars<br />
Large cars<br />
Circles indicate weighted average<br />
combined risk for vehicle type<br />
Sports cars<br />
72<br />
0<br />
0 25 50 75 100 125 150 175 200<br />
Differences in the averages by type that are less than ten percent are not statistically significant.<br />
Cherokee, and Tahoe). However, the average SUV poses nearly<br />
twice the risk to drivers of other vehicles as do the average<br />
midsize and large cars. The net result is that the combined risk<br />
of the average SUV (129) is about 25 to 30 percent higher than<br />
that of the average midsize (105) or large car (100).<br />
Subcompact and Compact <strong>Cars</strong> and <strong>SUVs</strong>. The combined<br />
risk of the average subcompact (141) or compact (136) is only<br />
slightly higher than that for the average SUV (129). However, the<br />
combined risk of the safest subcompact and compact models<br />
(VW Jetta and Honda Civic) is less than that of <strong>SUVs</strong>.<br />
The risk to drivers of the safest subcompact and compact<br />
models (Jetta, Civic, Saturn, and Corolla; Mazda 626 and Altima)<br />
is about the same as that of the average SUV (74). A critical
ANNUAL DEATHS OF DRIVERS OF OTHER VEHICLES PER MILLION PRIMARY VEHICLES SOLD<br />
150<br />
125<br />
100<br />
75<br />
50<br />
25<br />
Caravan, Voyager<br />
& Windstar<br />
Minivans<br />
Pickup trucks<br />
<strong>SUVs</strong><br />
Subcompact cars<br />
Compact cars<br />
Midsize cars<br />
Large cars<br />
Chevy Suburban<br />
Chevy Astrovan<br />
Tahoe<br />
Bonneville<br />
Camry<br />
Jetta<br />
0<br />
0 25 50 75 100 125 150 175 200<br />
ANNUAL DEATHS OF DRIVERS OF PRIMARY VEHICLES PER MILLION SOLD FROM 1995 TO 1999 FOR MOST MODELS<br />
aspect of the dispute regarding the relative danger to occupants<br />
of light or small cars is the very wide range in the risk to drivers<br />
of subcompacts. At one end are the low-risk Jetta and Civic models,<br />
but at roughly twice their risk are the Cavalier, Escort, and<br />
Neon models. The latter three inexpensive domestic models are<br />
responsible for greatly raising the average risk to drivers of subcompact<br />
cars. Does the safety record of those three models<br />
prove that light cars in general are unsafe? We have presented<br />
evidence that there is no such simple rule. Might it instead suggest<br />
that relatively inexpensive cars tend to be unsafe? The<br />
recent National Academy majority report on fuel economy<br />
argues that the low weight of cars with high fuel economy has<br />
resulted in many excess deaths. That inference is unfounded.<br />
Dodge Ram<br />
Cherokee<br />
Lumina<br />
Explorer<br />
Altima<br />
Taurus/Sable<br />
Marquis<br />
Corolla<br />
Ford F-Series<br />
GMC C/K<br />
Ranger<br />
Accord<br />
Civic Stratus & Saturn<br />
Maxima<br />
LeSabre<br />
Avalon<br />
Intrepid &<br />
Mazda 626<br />
Blazer<br />
Chevy C/K<br />
4Runner<br />
Grand Am<br />
Contour/<br />
Mystique<br />
Neon<br />
Chevy Prizm<br />
Chevy S-10<br />
Cavalier/Sunfire<br />
Escort/Tracer<br />
FIGURE 2 Differences in the models that are less than twenty percent are not statistically significant.<br />
Sentra<br />
Figure 1 shows that the risk associated with lightweight cars has<br />
a very wide range. In other words, weight does not determine<br />
the risk. New vehicle designs that pay close attention to safety<br />
considerations have helped make many cars in the subcompactto-midsize<br />
range as safe as large cars and <strong>SUVs</strong>.<br />
Minivans. Of all major vehicle types, minivans have the lowest<br />
primary risk and the lowest combined risk (excluding luxury<br />
imports). This happy outcome may reflect their drivers’ special<br />
care, for they are often used to transport children. But it also<br />
reflects minivan design, for most are built on car platforms,<br />
rather than on pickup-truck chassis. That basic design feature<br />
probably reduces the risk to their drivers, and certainly reduces<br />
the risk to other drivers. For example, the car-like body of ➢<br />
5 A C C E S S<br />
NUMBER 21, FALL 2002
the Grand Cherokee, an SUV, presents about twenty percent<br />
lower risk to its drivers than does the truck-based Cherokee (a<br />
suggestive result, although not statistically significant).<br />
Pickup Trucks. Pickup trucks are riskier than any other type<br />
of vehicle, excluding sports cars. Their average combined risk<br />
is more than twice that for large or midsize cars. Light trucks,<br />
especially pickups and to a lesser extent <strong>SUVs</strong>, are responsible<br />
for the deaths of many people in other vehicles, as shown by the<br />
vertical axis in Figure 1. This result mirrors earlier findings by<br />
Hans Joksch, who examined the outcomes of two-vehicle<br />
crashes as reported to the police. He found that there are twice<br />
as many driver deaths in pickup-car crashes as in car-car crashes<br />
and 1.8 as many deaths in SUV-car crashes as in car-car crashes.<br />
To a substantial degree, the risks that light trucks impose on<br />
other drivers are associated with their basic design. The chassis<br />
of pickups and most <strong>SUVs</strong> are more rigid than those of cars, and<br />
the bumpers are higher. Moreover, these deaths to others occur<br />
largely in urban and suburban settings, where pickups are rarely<br />
used to carry cargo.<br />
A C C E S S<br />
6<br />
The risk to drivers of pickups is a distinct issue. That risk is<br />
not significantly different from that of average compact and subcompact<br />
cars. The pickup risk is partly due to trucks driven in<br />
rural areas, where conditions are relatively less safe owing to<br />
high speeds on poorly designed and policed roads, as well as the<br />
tendency of some of these vehicles to roll over.<br />
Import Luxury and Sports <strong>Cars</strong>. Import luxury cars have the<br />
lowest combined risk, while sports cars have the highest combined<br />
risk of all vehicle types we studied. It is likely that much of<br />
the high risk of sports cars is associated with aggressive driving.<br />
EFFECT OF DRIVER AND ENVIRONMENT ON RISK<br />
It is extremely difficult to determine the inherent safety of<br />
a vehicle type or model, because driver characteristics and<br />
behavior (speed, use of seat belts, aggressive lane-changing,<br />
etc.) and environmental factors (such as road conditions) cannot<br />
be adequately accounted for. Some car models, such as most<br />
sports cars, attract relatively aggressive drivers, and their<br />
aggression increases fatalities associated with those models,
independent of their design. The Chevy Corvette illustrates that<br />
both vehicle design and driver variables are important. Like<br />
drivers of other sports cars, Corvette drivers face a higher risk<br />
(275) than drivers of other types of cars (way off scale to the right<br />
of Figure 2). But, although Corvettes are driven dangerously, the<br />
risk to drivers of vehicles that collide with Corvettes (25) is lower<br />
than that of the average midsize car (34, in Figure 1). The lowslung<br />
design and plastic body of the Corvette probably account<br />
for its low risk to other drivers.<br />
To explore some of the effects of driver behavior, we also<br />
looked at driver age and gender in fatal crashes. We found no<br />
evidence that either factor accounts for the differences in risk<br />
discussed here. In the future, we plan to explore the effects of<br />
other driver characteristics and environmental variables in an<br />
attempt to refine our analysis.<br />
CONCLUSIONS<br />
Opponents of strengthened fuel-economy standards claim<br />
higher standards will result in more traffic fatalities. If the new<br />
fleet were to be like the recent average light vehicle, traffic<br />
deaths probably would increase, as shown by the increase in<br />
risks to drivers as one goes from the average midsize and large<br />
cars to the average compact and subcompact cars, as shown in<br />
Figure 1. That simple conclusion mirrors the statistical analyses<br />
emphasized in the National Academy fuel-economy study. But<br />
that simple conclusion is probably wrong.<br />
Many existing small-car models, built primarily by foreign<br />
manufacturers, are as safe as their larger and heavier (and less<br />
efficient) counterparts, as shown in Figure 2. There is reason to<br />
expect that manufacturers can further improve the safety of<br />
vehicles by making them lighter without making them smaller,<br />
given such technological advances as smaller high-tech engines<br />
and transmissions, unibody or space-frame structures replacing<br />
the body-on-frame of most <strong>SUVs</strong> and pickup trucks, and<br />
increased use of lightweight materials. While it is reasonable to<br />
expect that increased fuel economy standards would make for<br />
lighter vehicles, we have shown that reduced vehicle weight<br />
does not imply reduced safety. ◆<br />
Acknowledgment: <strong>Than</strong>ks to John DeCicco, David Greene, and Therese<br />
Langer for valuable comments on the manuscript, and to Kenneth Campbell,<br />
Charlie Compton, Hans Joksch, Carl Nash, and Matt Reed for trying to<br />
educate us about traffic safety analysis. In spite of this help, the responsibility<br />
for all opinions and any errors rests with the authors. We thank The <strong>Energy</strong><br />
Foundation for supporting this work.<br />
F U R T H E R R E A D I N G<br />
H.C. Gabler and William T. Hollowell. The Aggressivity of Light Trucks<br />
and Vans in Traffic Crashes. SAE Technical Paper Series 980908.<br />
Warrendale, Penn.: Society of Automotive Engineers. 1998.<br />
William T. Hollowell and H.C. Gabler. “NHTSA’s Vehicle Aggressivity<br />
and Compatibility Research Program,” in Proceedings of the Fifteenth<br />
International Technical Conference on the Enhanced Safety of<br />
Vehicles, Volume 1, pp. 576–592. Paper No. 96-S4-O-01. Washington,<br />
D.C.: US Department of Transportation, National Highway Traffic<br />
Safety Administration. 1996.<br />
Insurance Institute for Highway Safety. Status Report Special Issue:<br />
Driver Death Rates. Vol. 35, no. 7, August 19, 2000.<br />
Hans Joksch. Vehicle Aggressivity: Fleet Characterization Using<br />
Traffic Collision Data. NHTSA DOT HS 808 679. Washington, D.C.:<br />
US Department of Transportation, National Highway Traffic Safety<br />
Administration. 1998.<br />
Hans Joksch. Vehicle Design versus Aggressivity. NHTSA DOT HS<br />
809 194. www-nrd.nhtsa.dot.gov/pdf/nrd-11/DOT_HC_809194.pdf.<br />
Washington, D.C.: US Department of Transportation, National<br />
Highway Traffic Safety Administration. 2000.<br />
National Academy, Effectiveness and Impact of Corporate Average<br />
Fuel Economy (CAFE) Standards, National Research Council. 2001<br />
Marc Ross and Tom Wenzel. An Analysis of Traffic Deaths by Vehicle<br />
Type and Model. Washington, DC: American Council for an <strong>Energy</strong><br />
Efficient Economy. Report No. T021. 2001. www.aceee.org/pubs/<br />
t021full.pdf<br />
7 A C C E S S<br />
NUMBER 21, FALL 2002