Design Guidelines for Agent Based Model Visualization
Design Guidelines for Agent Based Model Visualization
Design Guidelines for Agent Based Model Visualization

Create successful ePaper yourself
Turn your PDF publications into a flip-book with our unique Google optimized e-Paper software.
<strong>Design</strong> <strong>Guidelines</strong> <strong>for</strong> <strong>Agent</strong> <strong>Based</strong> <strong>Model</strong> <strong>Visualization</strong><br />
©Copyright JASSS<br />
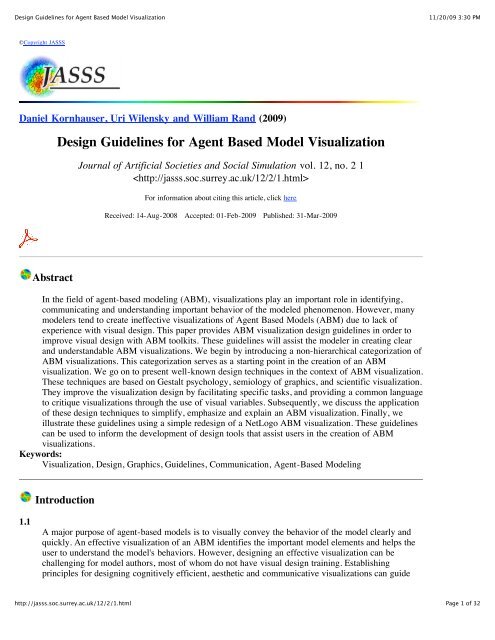
Daniel Kornhauser, Uri Wilensky and William Rand (2009)<br />
Abstract<br />
<strong>Design</strong> <strong>Guidelines</strong> <strong>for</strong> <strong>Agent</strong> <strong>Based</strong> <strong>Model</strong> <strong>Visualization</strong><br />
http://jasss.soc.surrey.ac.uk/12/2/1.html<br />
Journal of Artificial Societies and Social Simulation vol. 12, no. 2 1<br />
<br />
For in<strong>for</strong>mation about citing this article, click here<br />
Received: 14-Aug-2008 Accepted: 01-Feb-2009 Published: 31-Mar-2009<br />
In the field of agent-based modeling (ABM), visualizations play an important role in identifying,<br />
communicating and understanding important behavior of the modeled phenomenon. However, many<br />
modelers tend to create ineffective visualizations of <strong>Agent</strong> <strong>Based</strong> <strong>Model</strong>s (ABM) due to lack of<br />
experience with visual design. This paper provides ABM visualization design guidelines in order to<br />
improve visual design with ABM toolkits. These guidelines will assist the modeler in creating clear<br />
and understandable ABM visualizations. We begin by introducing a non-hierarchical categorization of<br />
ABM visualizations. This categorization serves as a starting point in the creation of an ABM<br />
visualization. We go on to present well-known design techniques in the context of ABM visualization.<br />
These techniques are based on Gestalt psychology, semiology of graphics, and scientific visualization.<br />
They improve the visualization design by facilitating specific tasks, and providing a common language<br />
to critique visualizations through the use of visual variables. Subsequently, we discuss the application<br />
of these design techniques to simplify, emphasize and explain an ABM visualization. Finally, we<br />
illustrate these guidelines using a simple redesign of a NetLogo ABM visualization. These guidelines<br />
can be used to in<strong>for</strong>m the development of design tools that assist users in the creation of ABM<br />
visualizations.<br />
Keywords:<br />
<strong>Visualization</strong>, <strong>Design</strong>, Graphics, <strong>Guidelines</strong>, Communication, <strong>Agent</strong>-<strong>Based</strong> <strong>Model</strong>ing<br />
1.1<br />
Introduction<br />
A major purpose of agent-based models is to visually convey the behavior of the model clearly and<br />
quickly. An effective visualization of an ABM identifies the important model elements and helps the<br />
user to understand the model's behaviors. However, designing an effective visualization can be<br />
challenging <strong>for</strong> model authors, most of whom do not have visual design training. Establishing<br />
principles <strong>for</strong> designing cognitively efficient, aesthetic and communicative visualizations can guide<br />
11/20/09 3:30 PM<br />
Page 1 of 32
<strong>Design</strong> <strong>Guidelines</strong> <strong>for</strong> <strong>Agent</strong> <strong>Based</strong> <strong>Model</strong> <strong>Visualization</strong><br />
1.2<br />
1.3<br />
researchers in their graphic design process of agent-based models. Cognitive efficiency (Cobb 1997)<br />
takes place when swift perceptual inferences replace slow cognitive comparisons (Healey 1995). A<br />
cognitively efficient visualization can facilitate the detection of important features, such as the<br />
discovery of emergent behavior, by providing an optimal representation to facilitate tasks such as<br />
cluster detection. Aesthetics is another key consideration <strong>for</strong> ABM visualization design. An aesthetic<br />
visualization can add visceral appeal (Norman 2004; (Brath 2005), thus improving the visualization<br />
by highlighting its message and increasing its memorability.<br />
Some ABM visualizations are more easily understood than others and some are more aesthetic than<br />
others (see Figure 1). Developing effective guidelines to increase the accuracy and readability of the<br />
ABM visualizations can assist in the comprehension and appeal of the underlying model.<br />
http://jasss.soc.surrey.ac.uk/12/2/1.html<br />
Innate Immune Response (An 2004)<br />
NetLogo User Community <strong>Model</strong><br />
ProbLab Genetics (Abrahamson 2004)<br />
NetLogo Curricular <strong>Model</strong><br />
a) Confusing and Unaesthetic <strong>Visualization</strong>s<br />
Heat Bugs (Wilensky 2004)<br />
NetLogo Library <strong>Model</strong><br />
DLA Alternate Linear (Wilensky 2004)<br />
NetLogo Library <strong>Model</strong><br />
b) Clear and Aesthetic <strong>Visualization</strong>s<br />
Figure 1. Examples of ineffective unaesthetic visualizations versus effective aesthetic visualizations in<br />
NetLogo. Note that in the visualizations on the left a), the authors chose to prioritize other criteria: In<br />
the Innate Immune Response <strong>Model</strong>, the author used a red garish background to represent the color of<br />
blood. In the Prolab Genetics <strong>Model</strong>, the author used neon colors given that they tend to captivate the<br />
interest of children. In this paper we prioritize cognitively efficient representations above accurate<br />
figurative representations or motivational representations.<br />
The difficulty in creating a cognitively efficient and aesthetic ABM visualization resides in the openended<br />
and unconventional representation of agent based models. Other software used <strong>for</strong> modeling,<br />
such as Geographic In<strong>for</strong>mation Systems (GIS) or spreadsheets provide more canonical and<br />
11/20/09 3:30 PM<br />
Page 2 of 32
<strong>Design</strong> <strong>Guidelines</strong> <strong>for</strong> <strong>Agent</strong> <strong>Based</strong> <strong>Model</strong> <strong>Visualization</strong><br />
1.4<br />
2.1<br />
2.2<br />
2.3<br />
2.4<br />
2.5<br />
2.6<br />
2.7<br />
constrained representations such as maps in GIS or plots in spreadsheets. The design of these<br />
constrained representations is possible to automate, <strong>for</strong> example the computer can assist the user in<br />
creating maps and a wide variety of diagrams and plots. However, this is difficult to achieve in ABM<br />
visualization given the diversity of ABM depictions. The nature of agent-based modeling frameworks<br />
demands a wide array of graphic representations (see Figure 2) that are usually custom-made <strong>for</strong> each<br />
model. Thus, well-designed ABM visualizations requires an in-depth knowledge of visualization<br />
guidelines and the skill to use those guidelines to craft clear and aesthetic visualizations.<br />
In this paper, we first describe and categorize ABM visualizations created in NetLogo (Wilensky<br />
1999a). This categorization aims to introduce the reader to the diversity of visualizations in ABM and<br />
some of the better practices in ABM visualization design. Afterwards, we discuss how Gestalt<br />
psychology, semiology of graphics and scientific visualization can in<strong>for</strong>m the design of ABM<br />
visualizations. Through this discussion we hope to introduce ABM developers to techniques <strong>for</strong><br />
improving their visualizations such as, <strong>for</strong>eground/background segregation, in<strong>for</strong>med use of visual<br />
variables, and removal of visual interferences. Then, we present the goals <strong>for</strong> applying these<br />
techniques: to simplify, emphasize and explain the visualization. Finally, we examine a redesign of an<br />
ABM visualization to illustrate these ideas.<br />
Background<br />
<strong>Visualization</strong> guidelines <strong>for</strong> an agent-based model draw from both aesthetic and cognitive design<br />
traditions. Aesthetic design techniques have a long history originating in artistic and graphic design<br />
developed over centuries. However, cognitive design techniques were only studied recently,<br />
originating with Gestalt psychology research in the early twentieth century.<br />
Aesthetic visualization techniques involve color theory, image composition, and other visual<br />
considerations seeking to remove discordant structures and highlight a message. A detailed discussion<br />
of graphic aesthetics is outside the scope of this paper, but the reader can gain some basic knowledge<br />
in this area by consulting introductory references (Pipes 2004; Maeda 1999). However, to effectively<br />
employ aesthetic design, reading art and design theory is insufficient, it is a craft primarily acquired by<br />
actively practicing with an expert. Nevertheless, aesthetic designs do follow certain general rules such<br />
as, balance, unity, harmony, scale and proportion, and contrast and emphasis. By understanding these<br />
design criteria the developer of ABM visualizations should be capable of articulating when, how and<br />
why a visualization is pleasing to the eye.<br />
Cognitive visualization techniques tend to be more explicit than aesthetic techniques and there<strong>for</strong>e can<br />
be more easily conveyed and systematized. Cognitive visualization techniques have been developed in<br />
several fields, starting in Gestalt psychology (Wertheimer 1923).<br />
Gestalt psychology is a theory of mind with the motto 'The whole is greater than the sum of its parts'.<br />
Gestalt psychologists studied with mechanisms of visual recognition of figures and whole <strong>for</strong>ms from<br />
a collection of simple lines and curves.<br />
Jacques Bertin developed another significant visualization framework in his seminal book, The<br />
Semiology of Graphics (Bertin 1967). In his work, Bertin, defines a coherent and comprehensive<br />
symbol scheme where he presents visual variables and studies the type and quantity of in<strong>for</strong>mation<br />
they can convey.<br />
There are many other significant frameworks that have been developed to study visualization,<br />
particularly in the field of statistics. (Tukey 1977; Tufte 1983).<br />
In the 1980s, with the advent of personal computers, scientific visualization became a distinct field,<br />
http://jasss.soc.surrey.ac.uk/12/2/1.html<br />
11/20/09 3:30 PM<br />
Page 3 of 32
<strong>Design</strong> <strong>Guidelines</strong> <strong>for</strong> <strong>Agent</strong> <strong>Based</strong> <strong>Model</strong> <strong>Visualization</strong><br />
2.8<br />
2.9<br />
3.1<br />
3.2<br />
3.3<br />
3.4<br />
4.1<br />
building upon research in fields such as cognitive psychology and psychophysics to improve<br />
visualization techniques. Currently, a wide array of material is available, from comprehensive<br />
visualization textbooks (MacEachren 1995; Ware 2002), to specialized papers that address specific<br />
topics such as real-time multivariate data visualization (Healey, 1996) or color schemes in computer<br />
displays (Harrower & Brewer 2003).<br />
Capturing which of these techniques apply to ABM visualization design is difficult due to the<br />
multidisciplinary nature and breadth of visualizations. Additionally, prioritizing which techniques are<br />
more relevant than others increases the challenge. One way to solve this problem is to approach it in<br />
the same way that other disciplines such as art, design or architecture have done. These disciplines<br />
have advanced by documenting their best practices and by creating guidelines <strong>for</strong> their craft. In a<br />
similar vein, we will begin by studying and classifying visualizations created with NetLogo.<br />
We use models from the NetLogo models library (Wilensky 1999b) as data <strong>for</strong> our classification. We<br />
chose to use the NetLogo modeling environment since it provides a wealth of ABM visualizations in<br />
its extensive models library and has a very large and active user community which also contributes<br />
and publishes models (Wilensky & Reisman, 2006). Our need <strong>for</strong> ABM visualization guidelines<br />
stemmed in part out of the desire to improve NetLogo's visualizations and to provide the NetLogo<br />
user community with visualization guidelines <strong>for</strong> submitting their models. Furthermore, NetLogo<br />
provides several key features that facilitate ABM visualization design. NetLogo is designed to be both<br />
'low threshold' and 'high ceiling' (Wilensky, 2001; Tisue & Wilensky, 2004). Consequently, NetLogo<br />
provides high-level primitives <strong>for</strong> programming and visualizing an ABM model. These high level<br />
ABM primitives liberate the programmer from implementing low level programming of control and<br />
data structures to address agents; giving more time to attend to the visualization design. Additionally,<br />
high-level graphics primitives within NetLogo enable users to rapidly prototype different<br />
visualizations in tight iterative cycles without having to learn the intricacies of low-level graphics<br />
libraries.<br />
<strong>Guidelines</strong><br />
We present three sets of guidelines <strong>for</strong> ABM visualization design.<br />
The first set of guidelines is an ad hoc classification of ABM visualizations currently found in the<br />
NetLogo <strong>Model</strong>s Library. This classification can familiarize the novice with the breadth and bounds<br />
of existing ABM visualizations. This overview of visualizations can assist the modeler in starting to<br />
author his/her own model inspired by visualizations similar to the one she/he wishes to create. Often<br />
one of the easiest ways to design a visualization is to look at other visualizations that have similar<br />
properties and to emulate them in ways that make sense within the context of the new model.<br />
The second set of guidelines presents well-known visualization principles in the context of ABM<br />
visualizations. By learning about these principles, model authors can remove or replace the elements<br />
of the design that cause confusion. These principles provide the authors with a firm grounding in how<br />
they can increase the visualization's comprehension.<br />
The third set of guidelines sets clear objectives <strong>for</strong> applying the visualization principles. The modeler<br />
can improve the visualization by simplifying and emphasizing its message. These goals should always<br />
be kept in mind to ensure that the design principles are applied appropriately.<br />
Non-hierarchical Classification of <strong>Agent</strong> <strong>Based</strong> <strong>Model</strong> <strong>Visualization</strong>s<br />
http://jasss.soc.surrey.ac.uk/12/2/1.html<br />
11/20/09 3:30 PM<br />
Page 4 of 32
<strong>Design</strong> <strong>Guidelines</strong> <strong>for</strong> <strong>Agent</strong> <strong>Based</strong> <strong>Model</strong> <strong>Visualization</strong><br />
4.2<br />
4.3<br />
4.4<br />
4.5<br />
4.6<br />
4.7<br />
There are now several ABM toolkits available. It is impractical to categorize all of the ABM<br />
visualizations of every model in each ABM toolkit, and there<strong>for</strong>e we have chosen to examine the<br />
NetLogo models library. <strong>Based</strong> on this extensive library (over 200 models) the authors have<br />
developed a set of distinct tags (see Figure 2-a 2-b 2-c). Our approach was inspired by (Lohse, 1994)<br />
who classified static visualizations but we did not use external subjects to per<strong>for</strong>m the classification.<br />
We clustered screenshots of similar visualizations displayed in the NetLogo Samples <strong>Model</strong> Library.<br />
However, on some occasions if the screenshot did not clearly demarcate a category, we ran the model<br />
in NetLogo to observe the model's behavior. Due to the open-ended design of ABM visualizations we<br />
find it is impractical to try to classify them using a rigid taxonomy, there<strong>for</strong>e we created an ad-hoc<br />
non-hierarchical classification. The sole purpose of these classification tags is to orient the novice to<br />
the possibilities and limitations of ABM visualizations.<br />
Labeling the NetLogo <strong>Model</strong>s Library has several advantages. First, the visualizations are intrinsically<br />
driven by agents since NetLogo models are constructed with data structures and primitives implicitly<br />
imbued with ABM semantics. Moreover, NetLogo visualizations share the same graphical and<br />
programmatic primitives; thus they can be compared and analyzed using the same criteria. Finally, the<br />
NetLogo <strong>Model</strong>s Library goes through a strict checkout process assuring that the models have<br />
sufficient quality and accuracy to be deployed <strong>for</strong> use in educational institutions.<br />
This classification could be improved substantially, particularly by asking external subjects to tag the<br />
images and by using dynamic NetLogo animations instead of static images from the screenshots.<br />
However, we consider this first classification suitable <strong>for</strong> our purposes, namely, assisting the novice in<br />
locating a visualization category to initially guide his or her model's visualization design.<br />
The classification of models is purely visual. It does not take into account the particular phenomenon<br />
being explored by the model. In other words, we did not consider the subject area or discipline of the<br />
model. Of course, some visualizations in the same category share the same type of phenomenon, but it<br />
is not unusual to find unrelated phenomena appearing in the same category. This classification is not<br />
meant to be a rigid comprehensive classification; on the contrary, it is meant to be an easily<br />
understandable and flexible overview. Thus, the modeler should envision the model that they<br />
eventually want to develop and then examine categories below based on that conception, to find a<br />
starting point <strong>for</strong> the design of their new visualization.<br />
We divide ABM visualizations into three main categories: conventional, unstructured and structured.<br />
Conventional visualizations make use of previously established representations while unstructured<br />
visualizations display abstract or irregular patterns, and structured visualizations convey meaning<br />
through shape or regular patterns. These categories should not be conceived of as mutually exclusive.<br />
Indeed, visualizations can encompass several categories and can even switch categories depending on<br />
the state of the simulation. Many tags can describe one model, and the same tag can be used to<br />
describe many models. We created categories that convey a certain sense of the potential of ABM<br />
graphics to the novice.<br />
Conventional ABM visualizations encompass established representations of mathematical and/or<br />
natural phenomena. The viewer understands these representations since he has seen or studied similar<br />
representations previously. This exposure may have taken place in several contexts such as an<br />
educational institution or popular culture. For instance, in recent years fractals have entered<br />
educational institutions and mainstream culture -- thus an educated audience can now understand the<br />
context and relevance of a fractal in a visualization when previously they would have been unable to<br />
comprehend the representation.<br />
We divided the rest of ABM visualizations into two categories: structured ABM visualizations and<br />
unstructured ABM visualizations. Note that this is not a rigid categorization; an unstructured ABM<br />
visualization can become a structured ABM visualization through emergent behavior. These<br />
http://jasss.soc.surrey.ac.uk/12/2/1.html<br />
11/20/09 3:30 PM<br />
Page 5 of 32
<strong>Design</strong> <strong>Guidelines</strong> <strong>for</strong> <strong>Agent</strong> <strong>Based</strong> <strong>Model</strong> <strong>Visualization</strong><br />
visualizations are not understood due to a predetermined convention; the viewer uses his visual<br />
intuition and the documentation accompanying the visualization to process and give meaning to the<br />
visual features. The aim of our classification is to differentiate the key mechanisms the viewer uses<br />
<strong>for</strong> understanding a visualization. In structured visualizations the shape or clusters <strong>for</strong>med by the<br />
agents plays a primal role, while in an unstructured visualization no contours or areas are markedly<br />
defined, instead the viewer uses the spatial distribution of the agents and their color, shape and<br />
orientation to make sense of the image.<br />
http://jasss.soc.surrey.ac.uk/12/2/1.html<br />
Tag Name <strong>Visualization</strong> Examples Short Description<br />
Cellular Automata<br />
Physics representations<br />
Fractal<br />
Geometrical<br />
Cellular automata consist of regular grids of<br />
agents where a finite number of states are<br />
usually mapped to a color.<br />
Conventional physics representations have<br />
been historically used to illustrate natural<br />
phenomena.<br />
Fractals and L-systems have particular but<br />
well- established visualization techniques.<br />
Geometrical patterns are generated through<br />
spatial interaction of agents.<br />
Figure 2. Conventional ABM visualizations encompass well-established mathematical<br />
representations or natural phenomena. The viewer understands these graphical representations only<br />
because he has seen or studied similar representations previously<br />
Tag Name <strong>Visualization</strong> Examples Short Description<br />
Few interacting mobile<br />
agents (Turtles in<br />
NetLogo)<br />
Many interacting mobile<br />
agents (Turtles in<br />
NetLogo)<br />
Many interacting mobile<br />
and immobile agents<br />
(Patches and Turtles in<br />
NetLogo)<br />
A few mobile agents driven by simple rules<br />
can display complex behavior.<br />
Many mobile agents can display complex<br />
spatial or color patterns.<br />
Many mobile agents in the <strong>for</strong>eground<br />
interacting with many immobile agents in<br />
the background. These visualizations can<br />
become structured visualizations after an<br />
emergent pattern arises.<br />
Figure 3. Unstructured ABM visualizations appear as irregular spatial patterns. They mostly convey<br />
in<strong>for</strong>mation through the perception of the change of color, texture or spatial distribution of the<br />
composition. They are mostly characterized by an irregular spatial distribution of agents.<br />
Tag Name <strong>Visualization</strong> Examples Short Description<br />
Flow simulations<br />
Aggregation<br />
Flow simulations are composed of agents<br />
that are perceived to flow (such as traffic<br />
simulations).<br />
Aggregation is a phenomenon found in<br />
11/20/09 3:30 PM<br />
Page 6 of 32
<strong>Design</strong> <strong>Guidelines</strong> <strong>for</strong> <strong>Agent</strong> <strong>Based</strong> <strong>Model</strong> <strong>Visualization</strong><br />
5.1<br />
5.2<br />
Emergent patterns with<br />
mobile agents<br />
(Turtles in NetLogo)<br />
Emergent patterns with<br />
immovable agents<br />
(Patches in NetLogo)<br />
Emergent Pattern with<br />
Patches and Turtles<br />
Figurative<br />
Particle Systems<br />
Abstract<br />
http://jasss.soc.surrey.ac.uk/12/2/1.html<br />
biology or physics. We classify these<br />
models as regular structures <strong>for</strong>med by<br />
agents.<br />
These systems start with interspersed<br />
random agents that over time create an<br />
emergent pattern. There are many types of<br />
emergent patterns such as clustering or<br />
types of synchronization.<br />
These models are subsets of cellular<br />
automata, but they often model concrete<br />
natural phenomena instead of abstract<br />
mathematic phenomena.<br />
In these models the interaction between<br />
mobile and immobile agents creates<br />
clusters. Note that these can become<br />
unstructured visualizations if the clusters<br />
disperse.<br />
Figurative models represent real world<br />
objects that are not merely clusters of<br />
agents: a cell, a plant, and a dinner.<br />
In particle systems, each agent is driven by<br />
the interaction of its physical properties<br />
such as mass and shape with external <strong>for</strong>ces<br />
such as gravity, wind or viscosity.<br />
These visualizations do not represent any<br />
natural, physical, or mathematical<br />
phenomenon but use a canonical<br />
representation.<br />
Figure 4. Structured ABM visualizations <strong>for</strong>m an abstract or figurative shape or regular pattern.<br />
These visualizations are characterized by a regular spatial positioning of agents creating clusters,<br />
regions, aggregations, or particle trajectories.<br />
<strong>Design</strong> Principles<br />
After completing an initial design, the iterative redesign of an ABM visualization can be divided into<br />
two parts: removing confusion and adding clarity. Removing confusion can be achieved by<br />
eliminating cognitive and aesthetic obstacles. Adding clarity can be accomplished by incorporating or<br />
rein<strong>for</strong>cing visual cues to emphasize the model's key variables and by increasing its aesthetic appeal.<br />
These enhancements should result in an unambiguous, memorable and pleasing visualization, which<br />
allows the viewer to easily focus on the main message of the model.<br />
At a high level, cognitive hurdles can arise from an unintended holistic perception of agents. This<br />
often occurs when the author's visualization fails to take into account Gestalt principles. For example,<br />
the use of figurative icons instead of abstract shapes will impede the viewer's perception of the image<br />
as a whole. You can observe, in Figure 5-a, that circles tend to merge together to produce new shapes,<br />
while the human icons overlap, but do not merge. Gestalt psychologists observed this phenomenon<br />
when they first studied visualizations. They observed that it is easier to perceive a whole given the<br />
11/20/09 3:30 PM<br />
Page 7 of 32
<strong>Design</strong> <strong>Guidelines</strong> <strong>for</strong> <strong>Agent</strong> <strong>Based</strong> <strong>Model</strong> <strong>Visualization</strong><br />
5.3<br />
5.4<br />
merger of abstract shapes rather than it is to perceive a whole from set figurative objects that<br />
perceptually overlap but do not merge.<br />
At a lower level, semiotic hurdles can occur as misrepresentations due to erroneous mappings from<br />
model variables to their visual portrayal. For example, the use of an unintuitive color scheme can<br />
confuse the viewer by mapping a numeric value to an unexpected color (A color scheme maps values<br />
such as: 10, 20, 30, 40, to colors such as: red, yellow, green, blue). This often happens in toolkits that<br />
do not provide pre-constructed color schemes since the modeler is left on its own to assemble color<br />
schemes with color systems such as RGB or HSV. However, building a color scheme requires deep<br />
knowledge about color representations hence is difficult to do without prior experience. For example,<br />
the construction of a divergent spectral or "rainbow" color can be a challenge as seen in Figure 5-b.<br />
Many requirements have to be satisfied such as placing the yellow color in the middle of the scheme,<br />
avoiding the confusion of the outermost purple and red colors, and being careful to map the red color<br />
to the highest numerical value even if it has the lowest numerical hue. This issue is addressed in many<br />
environments such as Geographic In<strong>for</strong>mation Systems (GIS) plat<strong>for</strong>ms (e.g., ArcView), or<br />
<strong>Visualization</strong> Toolkits (e.g., VTK), by providing pre-built color schemes assembled around a<br />
perceptual correspondence. ColorBrewer is an online tool designed to help people select perceptually<br />
tested color schemes (Harrower & Brewer 2003). Seen in Figure 5-c, ColorBrewer is an excellent<br />
starting point <strong>for</strong> color scheme selection. Thus, scientific software such as R, MATLAB or<br />
Mathematica have adopted ColorBrewer schemes. We also created a NetLogo extension to facilitate<br />
the selection and mapping of ColorBrewer schemes in NetLogo<br />
(http://ccl.northwestern.edu/papers/ABM<strong>Visualization</strong><strong>Guidelines</strong>/palette/)<br />
Finally, at the lowest level, perceptual impediments arise when we exceed the limitations of our lowlevel<br />
visual system. Visual features that are difficult to distinguish can disable our pre-attentive<br />
processing capabilities. Pre-attentive processing can be hindered by other cognitive phenomena such<br />
as interference between visual features (Healey 2006), or temporal aliasing (Bach 2006) (see Figure<br />
5-d).<br />
a) The human silhouette icons on the left overlap, while the circle shapes on the right merge to<br />
create new compound shapes. Thus, it seems easier to perceive new compound shapes on the<br />
right than in the left. This Virus model (Wilensky 1998a) is at<br />
http://ccl.northwestern.edu/netlogo/models/Virus.<br />
b) Notice in the model above on the left how the red color stands <strong>for</strong> cold (since it is at the<br />
bottom of the scale) while pink color stands <strong>for</strong> hot (at the top of the scale); this color mapping is<br />
http://jasss.soc.surrey.ac.uk/12/2/1.html<br />
11/20/09 3:30 PM<br />
Page 8 of 32
<strong>Design</strong> <strong>Guidelines</strong> <strong>for</strong> <strong>Agent</strong> <strong>Based</strong> <strong>Model</strong> <strong>Visualization</strong><br />
6.1<br />
6.2<br />
not intuitive. A superior mapping can be perceived on the right created with a color brewer color<br />
scheme (Harrower & Brewer 2003). This Heat Diffusion model (Wilensky 1998b) is at<br />
http://ccl.northwestern.edu/netlogo/models/HeatDiffusion. The original Heat Diffusion model and<br />
a revised version with color schemes can be found at<br />
http://ccl.northwestern.edu/papers/ABM<strong>Visualization</strong><strong>Guidelines</strong>/HeatDiffusionRedesign.<br />
.<br />
c) On the left, the ColorBrewer webpage (http://colorbrewer.org) displaying a divergent spectral<br />
color scheme used in the previous right Figure. On the right, the palette NetLogo extension<br />
(http://ccl.northwestern.edu/papers/ABM<strong>Visualization</strong><strong>Guidelines</strong>/palette/) <strong>for</strong> convenient<br />
selection and mapping of ColorBrewer Schemes in NetLogo.<br />
d) The red versus blue color contrast in the left causes the Bezold spreading optical illusion,<br />
where a color seems to spread past its bounds. (Note that this optical illusion is better perceived<br />
on a CRT or LCD display, which renders white with luminosity, as opposed to print where white<br />
appears as a lack of pigmentation) The smallest effective difference (Tufte 1996) should be used<br />
to avoid the optical illusion, as demonstrated in the example on the right. The example on the<br />
left has red and blue saturated colors causing the optical illusion. The examples on the middle<br />
and right do not cause the illusion. The example in the middle has NetLogo blue and red base<br />
multihued colors based on ColorBrewer colors, and the image on the right has two hues of blue<br />
also based on ColorBrewer color schemes. The Rumor Mill model (Wilensky 1998c) is at<br />
http://ccl.northwestern.edu/netlogo/models/RumorMill.<br />
Gestalt Principles<br />
http://jasss.soc.surrey.ac.uk/12/2/1.html<br />
Figure 5. Examples of different perception phenomena in visualizations<br />
Some Gestalt principles can help explain and predict a viewer's perception of a collection of graphical<br />
elements such as a visual representation of agents. Gestalt laws remain practical today due to their<br />
simplicity and generality, and have been applied to enhance contemporary visualizations (Nesbitt &<br />
Friedrich 2002).<br />
For instance, a model author can improve an ABM visualization by understanding and using the<br />
11/20/09 3:30 PM<br />
Page 9 of 32
<strong>Design</strong> <strong>Guidelines</strong> <strong>for</strong> <strong>Agent</strong> <strong>Based</strong> <strong>Model</strong> <strong>Visualization</strong><br />
6.3<br />
"Figure-ground segregation" mechanisms studied extensively by the Gestaltists. In NetLogo,<br />
immobile agents called 'patches' usually reside in the visualization's background, while mobile agents<br />
called 'turtles' usually reside in the <strong>for</strong>eground. A common problem in ABM visualizations arises<br />
when <strong>for</strong>eground and background are not easily distinguishable as in the model displayed in Figure 1a<br />
at the beginning of the paper. The distinction between these two types of agents needs to be<br />
immediately and ef<strong>for</strong>tlessly perceived in an animation; the separation between background and<br />
<strong>for</strong>eground should be rein<strong>for</strong>ced.<br />
Gestalt principles explain how a viewer will perceive a set of disjointed visual elements by grouping<br />
them into coherent structures. These principles are relevant to ABM visualizations given that single<br />
agents can be considered as disjoint visual elements, and a collection of agents can be viewed as a<br />
coherent structure. As a result, Gestalt principles of organization provide an explanation <strong>for</strong> how the<br />
visual relations among agents can give rise to the perception of an emergent <strong>for</strong>m or behavior. Below<br />
are some Gestalt principles (Goldstein, 1999) relevant to ABM visualizations:<br />
The principle of similarity (Figure 6-a):<br />
"Similar things appear to be grouped together".<br />
The principle of proximity (Figure 6-b):<br />
"Things that are near each other appear to be grouped together".<br />
The principle of common fate (Figure 6-c):<br />
"Things that are moving together appear to be grouped together".<br />
a) Similarity<br />
http://jasss.soc.surrey.ac.uk/12/2/1.html<br />
NetLogo Voting <strong>Model</strong> with Patches<br />
Color Similarity: You can distinctly perceive the<br />
green and blue groups. This Voting <strong>Model</strong><br />
(Wilensky 1998d ) is at<br />
http://ccl.northwestern.edu/netlogo/models/Voting.<br />
c) Common Fate<br />
b) Proximity<br />
Termites <strong>Model</strong> with Turtles<br />
Distance Proximity: You can clearly perceive the<br />
yellow clusters <strong>for</strong>med by the yellow wood chips.<br />
This Termite model (Wilensky 1998e) is at<br />
http://ccl.northwestern.edu/netlogo/models/Termites.<br />
11/20/09 3:30 PM<br />
Page 10 of 32
<strong>Design</strong> <strong>Guidelines</strong> <strong>for</strong> <strong>Agent</strong> <strong>Based</strong> <strong>Model</strong> <strong>Visualization</strong><br />
7.2<br />
7.2<br />
http://jasss.soc.surrey.ac.uk/12/2/1.html<br />
t1 t2 t3<br />
Flocking <strong>Model</strong> with Turtles<br />
Common Fate: These are three frames of an animation. In them you can perceive the groups of Boids<br />
moving together from the top right corner to the bottom left corner. This flocking model (Wilensky<br />
1998f) based on Reynolds classic Boids (Reynolds, 1987) is at<br />
http://ccl.northwestern.edu/netlogo/models/Flocking.<br />
Figure 6. Examples of different perception phenomena in visualizations<br />
Basic Visual Variables: Position, Size, Shape, Color, Orientation & Value<br />
In order to improve a visualization the author needs to critique his or her design. This implies having<br />
a vocabulary to describe his or her visualization and a framework to establish the alternatives <strong>for</strong> a<br />
redesign. This is why visual variables are useful. By providing a common language to deconstruct a<br />
visualization's graphic design, visual variables facilitate communication and the analysis of the<br />
graphical structure of a representation. This analysis can identify problems in a visualization and<br />
reveal plausible design alternatives.<br />
Bertin (1967; 1983) defined the visual variables as position, size, shape, color, orientation, value (i.e.<br />
relative darkness or lightness of a color) and texture. These visual variables can translate directly into<br />
an agent's graphic properties. The table below (see Figure 7) contains an agent-based representation of<br />
Bertin's visual variables. In this table, rows represent the visual variables while columns represent the<br />
agent type: a single turtle, turtles, a single patch, and patches. Note that texture does not have a row as<br />
a separate visual variable, since texture requires multiple agents, it is displayed in the columns labeled<br />
'Turtles' and 'Patches' <strong>for</strong>med by groups of agents.<br />
<strong>Agent</strong> Type<br />
Visual<br />
Variable<br />
Position<br />
Orientation<br />
Value<br />
Turtle Turtles Patch Patches<br />
Does not Apply:<br />
Patches are usually<br />
represented by an<br />
upright square and<br />
polygon<br />
11/20/09 3:30 PM<br />
Page 11 of 32
<strong>Design</strong> <strong>Guidelines</strong> <strong>for</strong> <strong>Agent</strong> <strong>Based</strong> <strong>Model</strong> <strong>Visualization</strong><br />
7.3<br />
Color<br />
Size<br />
Shape<br />
http://jasss.soc.surrey.ac.uk/12/2/1.html<br />
Does not Apply:<br />
The size of the patch<br />
remains constant<br />
throughout the grid.<br />
Does not Apply:<br />
The shape of the<br />
patch remains<br />
constant throughout<br />
the grid.<br />
Does not Apply:<br />
In NetLogo a patch is<br />
represented by a<br />
square. Few ABM<br />
toolkits support other<br />
grid shapes (e.g.<br />
hexagons)<br />
Figure 7. Bertin's Visual Variables illustrated with NetLogo. An interactive applet, which changes<br />
each visual variable individually, can be viewed at<br />
http://ccl.northwestern.edu/papers/ABM<strong>Visualization</strong><strong>Guidelines</strong>/VisualVariables/.<br />
While Bertin's basic ideas provide some understanding of the advantages and disadvantages of a given<br />
representational choice, it is not immediately apparent how to make use of this in<strong>for</strong>mation in<br />
animated computational visualizations. Bertin carefully prefaced his work with the disclaimer that it<br />
was not immediately applicable to "cinematic displays', but conceived 'expressly <strong>for</strong> print' (Bertin,<br />
1967; Bertin, 1983). As a result, the "movement" or "change" visual variable is not included in his<br />
framework. However, recent discussions of Bertin's framework (Carpendale 2003), have considered<br />
including movement as a visual variable. Additionally, in recent years, research on animated<br />
visualization has explicitly been addressed by visualization experts using cognitive science to<br />
understand how visual features should be used in real time multimodal displays (Healey et al, 1996)<br />
Basic Visual Variables Properties: Selective, Associative, Quantitative, Order &<br />
Length<br />
8.1<br />
8.2<br />
In this section we describe another part of Bertin's framework in order to support the selection of<br />
appropriate visual variables <strong>for</strong> an ABM visualization. It is not always straight<strong>for</strong>ward to find the best<br />
way of representing a model's variable when it can be signified by value, color, shape, size, or<br />
orientation. Thus, understanding the characteristics of each visual variable can assist the modeler in<br />
finding the most appropriate visual variable to support a given task.<br />
The characteristics of visual variables can indicate how a variable may aid or hinder the per<strong>for</strong>mance<br />
of a task. Below we present Bertin's visual variable characteristics within the context of agent based<br />
modeling:<br />
Selective: A visual variable is selective when an agent can be immediately distinguished from<br />
its surrounding agents.<br />
Associative: A visual variable is associative when groups of agents can be instantly perceived.<br />
Quantitative: A visual variable is quantitative when it allows a quick estimation of numerical<br />
ratios among agents.<br />
11/20/09 3:30 PM<br />
Page 12 of 32
<strong>Design</strong> <strong>Guidelines</strong> <strong>for</strong> <strong>Agent</strong> <strong>Based</strong> <strong>Model</strong> <strong>Visualization</strong><br />
8.3<br />
8.5<br />
8.6<br />
8.7<br />
8.8<br />
8.9<br />
8.10<br />
Order: A visual variable is ordered when it af<strong>for</strong>ds an unambiguous and swift comparison, or<br />
ordering of the agents. Length: The length of a visual variable describes how many distinct<br />
values it supports, and there<strong>for</strong>e how much in<strong>for</strong>mation the variable can convey.<br />
The first four characteristics (selective, associative, quantitative, order) can help the model author<br />
decide if a visual variable is suitable to accomplish a given task (target detection, cluster detection,<br />
ratio estimation, value distinction). For example, a square can be difficult to locate in a group of<br />
circles as seen in Figure 8-c1. The last characteristic (length) assists the model author in determining<br />
if a visual variable has sufficient resolution to represent a model's variable. If a visual variable does<br />
not have the necessary length to represent the model's variable none of the tasks above can be<br />
accomplished due to a resolution mismatch.<br />
Illustrations, developed in NetLogo, of the visual variables characteristics can be viewed in Figures 8<br />
and 9. They were inspired by Figures in Bertin (1967) and Carpendale's (2003) research. Figure 8<br />
contains turtle agents and Figure 9 contains patch agents. Turtle agents are usually represented by<br />
circles in order to keep the examples devoid of unnecessary interferences, except in the orientation or<br />
shape rows where the heading or shape of the agent is fundamental.<br />
In Figures 8 and 9, the columns hold five different characteristics of visual variables (selectivity,<br />
associativity, quantitative, order, and length), and the rows hold six different visual variables<br />
(position, size, shape, value, color, and orientation). The first two columns contain illustrations<br />
depicting the selectivity and associativity of each visual variable in a 2D space. The agents are<br />
arranged randomly <strong>for</strong> per<strong>for</strong>ming detection tasks such as boundary and target detection. These<br />
illustrations contain 50 agents, which we consider a reasonable amount <strong>for</strong> a detection task. The<br />
reader can change the number of agents and other features in an interactive applet available online<br />
(link in Figure 8). In the following three columns, the agents are arranged linearly <strong>for</strong> ratio estimation<br />
(quantitative), value comparison (order) and the depiction of their length (length).<br />
In Figures 8 and 9, the green checkmark means that the visual variable easily supports the<br />
characteristic. For example, in the first row and column, we can observe that the position visual<br />
variable supports selectivity. The orange tilde means that the visual variable may support the<br />
characteristic but care should be taken to assure it does. Finally, the cross means that the visual<br />
variable does not support the characteristic well and its use should be avoided whenever possible.<br />
Description of a Turtle's Visual Variable Characteristics.<br />
In this section we will discuss the characteristics of each visual variable: position, shape, size, value,<br />
color and orientation. This section should be read while referring to Figure 8 and 9 or the applet at<br />
http://ccl.northwestern.edu/papers/ABM<strong>Visualization</strong><strong>Guidelines</strong>/VisualVariables/.<br />
In the first row, position is selective (Figure 8-a1), thus it allows pinpointing every single agent with a<br />
different location. Additionally, it is associative (Figure 8-a2) since you can perceive immediately<br />
clusters of agent. In agent-based models, the position does not usually represent a value, instead it<br />
represents a geometric location, and thus we decided that it could not be used as either a quantitative<br />
(Figure 8-a3) or ordered (Figure 8-a4) visual variable. The length (Figure 8-a5) of position, or<br />
location, is limited to the resolution and size of the screen.<br />
In the second row, size is selective (Figure 8-b1), a reasonably larger agent can be singled out<br />
immediately, while a smaller agent can be noticed but it takes considerably more time. Two groups<br />
with different sizes can be discerned independent of their position; thus size supports associativity<br />
(Figure 8-b2). Size can be quantitative (Figure 8-b3) but it is easier to estimate the ratio between two<br />
http://jasss.soc.surrey.ac.uk/12/2/1.html<br />
11/20/09 3:30 PM<br />
Page 13 of 32
<strong>Design</strong> <strong>Guidelines</strong> <strong>for</strong> <strong>Agent</strong> <strong>Based</strong> <strong>Model</strong> <strong>Visualization</strong><br />
8.11<br />
8.12<br />
8.13<br />
8.14<br />
different lengths than between two different areas. The size of agents is easily perceived as ordered<br />
(Figure 8-b4) and has a length (Figure 8-b5) restricted to the resolution and size of the screen.<br />
In the third row, shape can be selective (Figure 8-c1) depending on the particular shapes; a circle is<br />
easily distinguished from a line but not from a square. The same concept applies <strong>for</strong> associativity<br />
(Figure 8-c2), a group of circles is easily distinguished from a group of lines but not from a group of<br />
squares. It does not make any sense to compare the value of two different shapes, thus shape is not<br />
quantitative (Figure 8-c3) and also cannot be ordered (Figure 8-c4). However, shape has <strong>for</strong> our<br />
purposes an infinite length (Figure 8-c5) since it can take unlimited <strong>for</strong>ms.<br />
In the fourth row, value is selective (Figure 8-d1), a black agent is quickly found among gray agents.<br />
Darker agents can be easily distinguished from lighter agents thus value is associative (Figure 8-d2).<br />
However, comparing different shades is difficult; it is hard to say that an agent is twice as dark as<br />
another agent thus value is not quantitative (Figure 8-d3). On the other hand, ordering gray levels is<br />
straight<strong>for</strong>ward and can be easily achieved, thus value is ordered (Figure 8-d4). Value appears to have<br />
an unlimited length (Figure 8-d5), even if a normal display has only 256 shades of gray it seems<br />
unlimited to the eye, a viewer can distinguish fewer than 256 shades (Ware 2002).<br />
In the fifth row, color is selective (Figure 8-e1); a red agent can be quickly distinguished among black<br />
agents. In addition, agents sharing a hue can be easily separated from another hue, thus color is<br />
associative (Figure 8-e2). However, it is difficult to compare colors: you cannot quickly quantify how<br />
much orange color an agent has, thus color is not quantitative (Figure 8-e3). Colors can usually not be<br />
ordered (Figure 8-e4) on hue alone. Note that combinations involving three variables: hue, saturation,<br />
and value can be ordered, such as the Color Brewer schemes (Harrower 2003). Hue appears to have<br />
an unlimited length (Figure 8-e5), a contemporary computer display has at least 65k colors which<br />
seems unlimited to the eye.<br />
In the sixth row, orientation is selective (Figure 8-f1); a viewer can detect immediately an agent with<br />
a different heading as long as it is a reasonably elongated shape. Also, groups with two different<br />
orientations can be associated (Figure 8-f2). However, it is best to consider orientation as not a<br />
quantitative (Figure 8-f3) or orderable (Figure 8-f4) visual variable. Even if most ABM toolkits have<br />
clear angle and heading conventions, orientations cannot be easily compared due to many difficulties,<br />
such as angles wrapping around zero. The length of orientation (Figure 8-f5) seems to be infinite and<br />
only limited by the resolution of the screen. For a detailed discussion consult (Ware 2000).<br />
Property<br />
Visual<br />
Variable<br />
Position<br />
Size<br />
http://jasss.soc.surrey.ac.uk/12/2/1.html<br />
Selective Associative Quantitative Order Length<br />
a1 a2 a3<br />
Does not Apply<br />
<strong>Agent</strong>'s position does<br />
not usually represent<br />
comparable lengths.<br />
a4<br />
Does not Apply<br />
<strong>Agent</strong>'s position<br />
usually represents a<br />
location not a value.<br />
b1 b2 b3 b4 b5<br />
a5<br />
11/20/09 3:30 PM<br />
Page 14 of 32
<strong>Design</strong> <strong>Guidelines</strong> <strong>for</strong> <strong>Agent</strong> <strong>Based</strong> <strong>Model</strong> <strong>Visualization</strong><br />
8.15<br />
8.16<br />
Shape<br />
Value<br />
Color<br />
http://jasss.soc.surrey.ac.uk/12/2/1.html<br />
c1 c2 c3<br />
Does not Apply<br />
An agent's shape does<br />
not usually represent a<br />
quantity.<br />
c4 c5<br />
d1 d2 d3 d4 d5<br />
e1 e2 e3 e4 e5<br />
Figure 8. Visual Variables Characteristics of Turtles. An interactive applet can be viewed at<br />
http://ccl.northwestern.edu/papers/ABM<strong>Visualization</strong><strong>Guidelines</strong>/VisualVariablesProperties/ .<br />
Description of Patches' Visual Variable Characteristics<br />
Patches lack many of the turtles' visual variables such as size, shape, and orientation. Indeed, in<br />
NetLogo all patches have the same size, they are all square, and since squares are not thin elongated<br />
shapes they do not have an orientation. Nonetheless, patches share some of the turtle's characteristics<br />
such as position, value and color, but a patch's position is somewhat different than a turtle's location.<br />
For example, a patch's position tends to be more selective and associative than in turtles, since their<br />
discrete positioning <strong>for</strong>bids patches from overlapping and since neighboring patches are located back<br />
to back. The length of patch visual variables is restricted to multiples of the patch size.<br />
For the sake of brevity, we will not describe thoroughly each cell as we did on the previous<br />
subsection, the reader can apply an the same reasoning we used <strong>for</strong> the turtles to the patches.<br />
Property<br />
Visual<br />
Variable<br />
Position<br />
Value<br />
Selective Associative Quantitative Order Length<br />
a1 a2 a3<br />
Does not Apply<br />
<strong>Agent</strong>'s position does<br />
not usually represent<br />
comparable lengths.<br />
a4<br />
Does not Apply<br />
<strong>Agent</strong>'s position<br />
usually represents a<br />
location not a value.<br />
b1 b2 b3 b4 b5<br />
a5<br />
11/20/09 3:30 PM<br />
Page 15 of 32
<strong>Design</strong> <strong>Guidelines</strong> <strong>for</strong> <strong>Agent</strong> <strong>Based</strong> <strong>Model</strong> <strong>Visualization</strong><br />
9.1<br />
9.2<br />
Size<br />
http://jasss.soc.surrey.ac.uk/12/2/1.html<br />
c1 c2 c3 c4 c5<br />
Figure 9. Visual Variable Characteristics of Patches. An interactive applet can be viewed at<br />
http://ccl.northwestern.edu/papers/ABM<strong>Visualization</strong><strong>Guidelines</strong>/VisualVariablesProperties/ .<br />
Other Visual Variables<br />
Transparency, Texture, Crispness & Resolution<br />
We previously discussed some of the basic visual variables mentioned by Jacques Bertin in 'The<br />
Semiology of Graphics' (Bertin 1967). In this section, we will briefly mention other more<br />
sophisticated visual variables such as transparency, texture, crispness and resolution. A thorough<br />
treatment of these visual variables is beyond the scope of this paper. We refer the reader to textbooks<br />
by MacEachren (1995) and Ware (2002) <strong>for</strong> an in depth discussion of these variables, though their<br />
treatment is not specific to ABM visualizations.<br />
Variables such as transparency, texture, crispness and resolution can be valuable in ABM<br />
visualizations. Below we present a few examples using these visual variables in ABM visualization.<br />
Transparency can assist in the perception of agents covering or overlapping other agents as seen in<br />
Figure 10-a. Texture can increase the number of variables that can be simultaneously displayed<br />
(though it considerably decreases the resolution as seen in Figure 10-b (Julesz 1986 ; Ware 2002).<br />
Crispness allows the user to focus on a particular agent while maintaining its context -- a technique<br />
known as semantic depth of field Figure as seen in 10-c (Kosara 2001). Also, resolution can be<br />
decreased by blurring each individual agent to allow the user to easily perceive the macro behavior of<br />
the model as in Figure 10-d.<br />
a) Example of agents with transparency in the middle and right images. (Colby 1991).<br />
a) Example of a vector field generated in NetLogo<br />
b) Example highlighting agent micro behavior.<br />
11/20/09 3:30 PM<br />
Page 16 of 32
<strong>Design</strong> <strong>Guidelines</strong> <strong>for</strong> <strong>Agent</strong> <strong>Based</strong> <strong>Model</strong> <strong>Visualization</strong><br />
9.3<br />
9.4<br />
9.5<br />
9.6<br />
with arrows on the left and with texture on the right<br />
generated by agent with textons (Jules 1986; Ware<br />
1995).<br />
http://jasss.soc.surrey.ac.uk/12/2/1.html<br />
Focus on a single agent with a halo on the left;<br />
while on the right we blurred the individual<br />
agents.<br />
d) Examples of agents with decreased resolution to enable easy observation of emergent macro behavior<br />
Figure 10. Examples of transparency, textures, resolution, and crispness in ABM visualizations.<br />
(We created these images using experimental NetLogo builds, except <strong>for</strong> Figure 10-d on the right where we<br />
blurred a screenshot with a graphics program)<br />
Change<br />
ABM visualizations are intrinsically animated since change over time is the most straight<strong>for</strong>ward way<br />
to represent behavior. In this section, we will discuss issues that frequently arise while updating ABM<br />
visualizations. A thorough treatment of dynamic visual variables is beyond the scope of this paper.<br />
For a detailed definition of these visual variables we refer the readers to (MacEachren , 1995) who<br />
defines six dynamic variables: duration, rate of change, order, display date, frequency and<br />
synchronization. Note that their treatment is not specific to ABM visualizations, but rather targeted to<br />
maps.<br />
Smooth graphical transitions are quite challenging to update <strong>for</strong> ABM toolkits such as NetLogo where<br />
an interactive <strong>Agent</strong> <strong>Based</strong> <strong>Model</strong> is executed in real time. The challenge is to balance the use of CPU<br />
time between displaying graphics and per<strong>for</strong>ming model calculations. If CPU time is devoted<br />
exclusively to graphics updates, the model's calculations grind to a halt. On the other hand, if the<br />
computational ef<strong>for</strong>t is solely dedicated to the model's calculations the graphics slow down to an<br />
unacceptable rate. Note however, that this is not an issue in in<strong>for</strong>mation visualization where the data<br />
is readily available <strong>for</strong> display since it is already stored and does not have to be computed. This is an<br />
important distinction between in<strong>for</strong>mation visualization and interactive ABM visualization. In<br />
in<strong>for</strong>mation visualization most of the CPU cycles can be used to update graphics and interact with the<br />
user.<br />
This results in two main issues that arise in ABM animation:<br />
Temporal aliasing, when the agents become visually hard to track since they abruptly 'jump'<br />
from one location to another instead of smoothly 'sliding' between positions. (Korein 1983)<br />
Irregular frame rate, where the frame rate fluctuates over time depending on the complexity of<br />
the model calculations in such a way that it confuses and frustrates the user.<br />
Spatio-temporal aliasing or non-smooth jerky motion can pose insurmountable perceptual challenges<br />
in ABM visualizations where the user is trying to keep track of the agents in the simulation. The<br />
problem of temporal aliasing has long been recognized and many anti-aliasing techniques have been<br />
developed including supersampling and motion blur. Currently, supersampling is usually the only<br />
option that the model author can implement, where he increases temporal resolution by interpolating<br />
11/20/09 3:30 PM<br />
Page 17 of 32
<strong>Design</strong> <strong>Guidelines</strong> <strong>for</strong> <strong>Agent</strong> <strong>Based</strong> <strong>Model</strong> <strong>Visualization</strong><br />
9.7<br />
9.8<br />
9.9<br />
10.1<br />
10.2<br />
10.3<br />
intermediate agent positions between two locations. A good rule of thumb is to move the object at<br />
most 1/3 of its size between each frame (Ware 2002). This criterion does not apply if the object is<br />
very small (such as 1 pixel wide) or very large. Motion blur probably requires accessing lower level<br />
graphics, which are usually inaccessible in a high level toolkit.<br />
Irregular frame rate is due to the changing computational load at each iteration. This unpredictable<br />
rate can confuse and frustrate the viewer. If the computational load fluctuates due to a changing<br />
number of agents, the model author can try to stabilize updates by intentionally slowing down the<br />
model to the lowest possible frame rate.<br />
Ideally, agents should be bounded with physical restrictions (viscosity, inertia, etc ..) in such a way<br />
that agents change their position or appearance in a smooth predictable manner. In the future, these<br />
physical restrictions and other artifacts such as the previously mentioned (temporal aliasing and<br />
regular frame rate) should be automatically handled by toolkits. New developments in hardware and<br />
software will implement this functionality. For example in hardware, multi processors systems or<br />
GPUs (Graphical Processor Unit) can be solely dedicated to graphics and per<strong>for</strong>m the necessary<br />
computations. Additionally in software, new animation frameworks are managing individual elements<br />
on a frame-by-frame basis. In these new frameworks, a smooth animation can be created by<br />
specifying the start and end position -- the libraries calculate the intermediate locations <strong>for</strong> a smooth<br />
transition.<br />
There are however many visualization aspects that cannot be automated, <strong>for</strong> example facilitating a<br />
particular user such as tracking, estimation or segregation. Additionally, the model author should<br />
prevent visual interferences such as those discussed in the next section.<br />
Cognitive Science <strong>Visualization</strong> Principles<br />
Cognitive Science has elucidated many principles of effective, as well as misleading, visualizations.<br />
Here we focus on two cognitive phenomena the user should be concerned with when creating an<br />
ABM visualization: pre-attentive visual processing and visual interference. Creating visualizations<br />
that can be pre-attentively processed and are free of visual interference enables a viewer to per<strong>for</strong>m<br />
fast, automatic and spatially parallel operations to understand the visualization. Pre-attentive<br />
operations can detect visual features such as intensity, hue, and orientation and assist in tasks such as<br />
boundary detection and high-speed target tracking (Healey 1995; 1996). However, pre-attentive<br />
operations can be impeded by visual interference. For example, visual interference can occur when a<br />
chosen visual variable conflicts with another visual variable. Another example of visual interference<br />
occurs when a selected visual variable is so dominant that it makes the other visual variables<br />
imperceptible.<br />
Pre-attentive Visual Processing<br />
Pre-attentive visual processing enables the fast and scalable perception of the features of a<br />
visualization. It allows the viewer to process animations containing a large number of graphic<br />
elements, as is often the case in ABM animations. Pre-attentive visual tasks can usually be<br />
accomplished in less than a quarter of a second (Ware 2004), independent of the number of graphic<br />
elements involved, which allows the viewer to process high-speed, in<strong>for</strong>mation-rich ABM animations.<br />
In order to construct an ABM visualization that can be processed pre-attentively, the modeler must<br />
pinpoint the visual tasks him requires from the viewers. By doing so, the modeler can select the<br />
optimal visual features to accomplish the task and construct a visualization that allows the viewer to<br />
http://jasss.soc.surrey.ac.uk/12/2/1.html<br />
11/20/09 3:30 PM<br />
Page 18 of 32
<strong>Design</strong> <strong>Guidelines</strong> <strong>for</strong> <strong>Agent</strong> <strong>Based</strong> <strong>Model</strong> <strong>Visualization</strong><br />
10.4<br />
10.5<br />
10.6<br />
10.7<br />
10.8<br />
accomplish the task pre-attentively. For example, the visualization's author can select color or size to<br />
per<strong>for</strong>m pre-attentive visual tasks, shown in Figure 11, such as target detection, boundary detection,<br />
region tracking, counting and estimation (Healey 2006).<br />
Pinpointing the task depends on the phenomena the modeler wishes the viewer to focus on. These<br />
phenomena can be either macro- or micro-behaviors of the model. Perceiving macro-behavior<br />
involves tasks such as boundary detection or region tracking. Both of these tasks assist the viewer in<br />
discerning and tracking clusters of agents. Macro-behavior perception can be supported by other<br />
visual tasks as well, such as estimation, which facilitates the approximation of the quantity of agents<br />
sharing a visual feature (independent of their position and quantity).<br />
Perceiving micro-behavior involves tasks such as target detection, where the user must focus on the<br />
behavior of a single agent amongst all the agents. Tracking a single agent can be quite a challenge in<br />
a flock of agents where the user is distracted by the movement and direction changes of other agents.<br />
Disease Solo <strong>Model</strong><br />
Target detection task<br />
http://jasss.soc.surrey.ac.uk/12/2/1.html<br />
Segregation <strong>Model</strong><br />
Boundary detection task<br />
Radioactive Decay <strong>Model</strong><br />
Estimation and counting<br />
Figure 11. Examples of target detection, boundary detection, and counting & estimation tasks in<br />
NetLogo <strong>Model</strong>s. The Disease Solo <strong>Model</strong> (Wilensky 2005) is at<br />
http://ccl.northwestern.edu/netlogo/models/DiseaseSolo. The Segregation <strong>Model</strong> (Wilensky 1998g) is<br />
at http://ccl.northwestern.edu/netlogo/models/Segregation. The Radioactive Decay <strong>Model</strong> (Wilensky<br />
1998h) is at http://ccl.northwestern.edu/netlogo/models/Decay<br />
Pre-attentive perception demands different design priorities in dynamic animations than in static<br />
images. For example, in static images, feature comparison takes place in space, thus spatial resolution<br />
plays an important role. However in dynamic animations feature comparison takes place in time.<br />
Thus, the temporal resolution is more important than the spatial resolution, since the changes in time<br />
are crucial to studying behavior. So high spatial resolution, which is helpful in static images in order<br />
to provide a large in<strong>for</strong>mation density, should usually be avoided in dynamic visualizations in order to<br />
facilitate a rapid cognition <strong>for</strong> each frame of the animation.<br />
Once the modeler has pinpointed the task necessary to highlight a specific phenomenon, he can begin<br />
by ensuring there is no visual interference confusing the user. If visual interference exists, he should<br />
change or remove the visual variables causing the visual interference. In the next section we will<br />
discuss some examples of visual interference in ABM visualizations.<br />
Visual interference<br />
Visual interference, as described by Callaghan (1989), takes place when a pre-attentive task is<br />
11/20/09 3:30 PM<br />
Page 19 of 32
<strong>Design</strong> <strong>Guidelines</strong> <strong>for</strong> <strong>Agent</strong> <strong>Based</strong> <strong>Model</strong> <strong>Visualization</strong><br />
10.9<br />
hindered by the concurrent use of interfering visual features. For example, estimation is hampered in<br />
hue-luminance interference, since luminosity is prioritized over hue by the low-level visual<br />
processing system (see Figure 12-a and 12b).<br />
This particular interference is caused by a "feature hierarchy that appears to exist in the visual system"<br />
(Healey 2006). Other interferences emanating from the feature hierarchy are: color-over-shape, hueon-<strong>for</strong>m<br />
and hue-on-texture. Examples of each of these types of interference can be observed in<br />
Christopher's Healey's comprehensive review (http://www.csc.ncsu.edu/faculty/healey/PP/index.html).<br />
Additionally, these three interferences can be observed in Figure 12-c and 12-d,<br />
http://jasss.soc.surrey.ac.uk/12/2/1.html<br />
Simple Kinetics <strong>Model</strong><br />
a) Bright white atoms interfering with the hue<br />
estimation<br />
Ethnocentrism <strong>Model</strong><br />
c) In this model it is very hard to group the<br />
agents by shape or color due to color-over-shape<br />
and hue-on-<strong>for</strong>m interference.<br />
Simple Kinetics <strong>Model</strong><br />
b) This is a redesign of Figure 12-a. Darker gray<br />
atoms in order to avoid the luminance-on-hue<br />
interference<br />
Ethnocentrism <strong>Model</strong><br />
d) This is a redesign of Figure 12-c. Very<br />
distinct shapes with the relatively equal “ink<br />
area” were chosen to make it easier to<br />
discriminate by shape or color.<br />
Figure 12. In the ABM visualizations a) and b), the key visual feature to distinguish is hue, which<br />
allows the viewer to estimate the number of red and green molecules. However, on the left, the bright<br />
white atoms interfere with the hue estimation. Changing the bright white atoms to darker gray atoms<br />
11/20/09 3:30 PM<br />
Page 20 of 32
<strong>Design</strong> <strong>Guidelines</strong> <strong>for</strong> <strong>Agent</strong> <strong>Based</strong> <strong>Model</strong> <strong>Visualization</strong><br />
10.10<br />
11.1<br />
11.2<br />
11.3<br />
11.4<br />
remedies the luminance-on-hue interference. Note that this interference is mostly perceived on a<br />
CRT or LCD display, which renders white with luminosity, as opposed to print where white appears<br />
as a lack of pigmentation. The Simple Kinetics 1 (Wilensky 1998i) <strong>Model</strong> is at<br />
http://ccl.northwestern.edu/netlogo/models/SimpleKinetics1. In the Figures 12-c and 12-d there are<br />
several key features to distinguish, mainly shape and color. This model contains four shapes: squares,<br />
hollow squares, circles, and hollow circles. They were replaced by crosses, dots, horizontal lines, and<br />
vertical lines. It was originally unfeasible to group the squares (filled square and hollow squares) due<br />
to the difference of luminosity between the hollow and filled shapes. The creation of textures allows<br />
the viewer to distinguish color and shape independently. However, this redesign still suffers from<br />
other interferences such as hue on texture. This redesign does not solve all the issues of this model,<br />
however it is an improvement. The NetLogo Ethnocentrism model (Wilensky 2006) is at<br />
http://ccl.northwestern.edu/papers/ABM<strong>Visualization</strong><strong>Guidelines</strong>/EthnocentrismUserStudy/.<br />
Visual interference can occur in agent-based models when the agent's variables are mapped to visual<br />
features without considering whether they interfere or not. By being aware of well-known visual<br />
interference patterns, the modeler can determine when interference is occurring and prevent it. The<br />
perception of the main variables in agent-based visualization should not be hampered when displaying<br />
secondary variables. Whenever possible, the modeler should display the model's variables of interest<br />
in accordance with their perceptual salience. The perceptual salience of a visual feature depends on<br />
the task, but <strong>for</strong> many tasks the most salient visual features tend to be luminance and hue, followed by<br />
size, length orientation and shape (Healey 2006).<br />
<strong>Design</strong> Objectives<br />
<strong>Design</strong> principles are not sufficient to improve a visualization, certain objectives need to be<br />
established in order to guide, when and how, design principles enhance the visualization. In this<br />
section we present the intent <strong>for</strong> applying the previously stated principles: to simplify, to emphasize<br />
and to explain.<br />
<strong>Design</strong> criteria have been studied at length by many visualization researchers such as Tufte. However,<br />
the criterion <strong>for</strong> improving a visualization changes depending upon the type of visualization and the<br />
task at hand. Unlike mainstream visualizations, ABM representations display a behavior mostly driven<br />
by rules rather than data. Thus, dynamic ABM visualizations need to fulfill different requirements<br />
than usual static descriptive depictions.<br />
In static visualizations, where the viewer has the option of carefully studying the motionless image,<br />
high data density is recommended to provide as much in<strong>for</strong>mation as possible. However, within an<br />
ABM animation, a low data density is recommended to allow the viewer to follow changes in the<br />
visualization. ABM animations ought to be simple and emphasize their key variables to facilitate preattentive<br />
processing in spite of containing a multitude of changing graphical elements.<br />
Another difference is that ABM visualizations are often unique and there<strong>for</strong>e they cannot be<br />
understood as easily as common, conventional visualizations such as histograms or pie charts. Most<br />
ABM visualizations are custom designed to depict a particular phenomenon, and consequently, they<br />
are not intuitively understood. Many ABM visualizations share common graphical elements, but these<br />
elements can represent different objects or properties. For example, a circular agent may represent a<br />
particle in one visualization or a node in a network in another visualization. These visualizations that<br />
lack convention can only be understood if the author designs visual explanations that make explicit<br />
the point of the model.<br />
<strong>Design</strong> Approach<br />
http://jasss.soc.surrey.ac.uk/12/2/1.html<br />
11/20/09 3:30 PM<br />
Page 21 of 32
<strong>Design</strong> <strong>Guidelines</strong> <strong>for</strong> <strong>Agent</strong> <strong>Based</strong> <strong>Model</strong> <strong>Visualization</strong><br />
11.5<br />
Below, we describe several steps <strong>for</strong> incorporating some of the design principles mentioned<br />
previously: simplify, emphasize and explain. These steps are intrinsically generic due to the openended<br />
nature of ABM visualizations. However, we believe this approach can offer some structure <strong>for</strong><br />
iteratively redesigning an ABM visualization. Note that, depending on the type of visualization the<br />
modeler can find more rigorous frameworks that can also apply to their design. For example, (Jones<br />
1998) provides a detailed map-making approach in his textbook 'Geographical In<strong>for</strong>mation Systems<br />
and Computer Cartography'. In the Figure 13 below we summarize an approach to redesigning an<br />
ABM visualization<br />
Figure 13. Generic design workflow of an ABM visualization. Initial implementation of the model<br />
followed by an iterative redesign composed by 3 steps Simplify, Emphasize, and Explain.<br />
http://jasss.soc.surrey.ac.uk/12/2/1.html<br />
11/20/09 3:30 PM<br />
Page 22 of 32
<strong>Design</strong> <strong>Guidelines</strong> <strong>for</strong> <strong>Agent</strong> <strong>Based</strong> <strong>Model</strong> <strong>Visualization</strong><br />
11.6<br />
11.7<br />
11.8<br />
11.9<br />
Simplify<br />
Simplifying ABM visualization enables the user to concentrate on the model's main behaviors without<br />
unnecessary distractions. One of the first enhancements to an ABM visualization is to remove clutter<br />
or in Tufte's words "Chart Junk" (Tufte, 1983). Clutter in ABM is usually caused by dispensable<br />
graphic elements created <strong>for</strong> testing and debugging purposes during the model's conception. A<br />
visualization displaying many variables needed to debug a model may not be optimal <strong>for</strong> viewing the<br />
model's important behaviors. The viewer can be overwhelmed and confused by the visual variables<br />
useful to the model's author, but devoid of meaning <strong>for</strong> the intended audience.<br />
This tends to happen especially in development environments where graphical elements can be added<br />
easily. Thus, the modeler would benefit by uncluttering his / her visualization be<strong>for</strong>e he presents it to<br />
other users. Removing construction and debugging graphical elements enables the observer to easily<br />
perceive a certain behavior or pattern.<br />
When there are a large number of simultaneous behaviors and graphical elements to observe, the<br />
viewer should have the option to hide graphical elements until they reach a set of cognitively<br />
manageable features. For instance, in GIS environments, this is accomplished through the use of<br />
layers. Users can turn layers off and on in order to allow a GIS user to show and hide in<strong>for</strong>mation in a<br />
map as they examine the data.<br />
Another similar way to simplify a visualization is to divide it into two or more visualizations, where<br />
each one renders different model variables, such as the Rumor Mill model below in Figure 14.<br />
Rumor Mill <strong>Model</strong> “normal<br />
view”<br />
Blue indicates where the rumor<br />
has spread.<br />
http://jasss.soc.surrey.ac.uk/12/2/1.html<br />
Rumor Mill “when heard view”<br />
Yellow indicates when the<br />
rumor was heard. A brighter<br />
value stand <strong>for</strong> where the rumor<br />
was first heard. A darker value<br />
stands <strong>for</strong> where the rumor was<br />
heard recently.<br />
Rumor Mill “times heard view”<br />
Green indicates how many<br />
times it was heard. The more<br />
saturated the green means that<br />
the rumor was heard more<br />
times.<br />
Figure 14. Several views of the Rumor Mill <strong>Model</strong>: This model shows how a rumor spreads. The<br />
rumor spreads when a person (represented by a patch) tells a rumor to a neighbor (represented by an<br />
adjacent patch). At each time step, every person who knows the rumor randomly chooses a neighbor<br />
to tell the rumor to diffuse. You can view the Rumor Mill <strong>Model</strong> (Wilensky 1998c) at<br />
http://ccl.northwestern.edu/netlogo/models/RumorMill.<br />
Emphasize<br />
11/20/09 3:30 PM<br />
Page 23 of 32
<strong>Design</strong> <strong>Guidelines</strong> <strong>for</strong> <strong>Agent</strong> <strong>Based</strong> <strong>Model</strong> <strong>Visualization</strong><br />
11.10<br />
In animations the user must instantly perceive how the system behaves frame by frame. This<br />
perception can only be achieved using pre-attentive processing. For instance, the user does not have<br />
time to think about selecting a target, he ought to be able to select and follow a target using his low<br />
level cognitive abilities. One technique used to support pre-attentive processing is to represent a<br />
model variable using several redundant visual variables.<br />
11.11<br />
For example, as shown in Figure 15, the association of the orientation of agents in the left-hand<br />
image can be enhanced by mapping the orientation of the agent to a hue as shown in the center<br />
image. The perception of orientation can further be emphasized by use of elongated shapes, as<br />
illustrated in the right image.<br />
11.12<br />
11.13<br />
Flocking <strong>Model</strong> “normal view”<br />
No emphasis on alignment. In<br />
this image turtles are randomly<br />
assigned a shade of yellow.<br />
http://jasss.soc.surrey.ac.uk/12/2/1.html<br />
Flocking model with redundant<br />
variable<br />
Added emphasis on alignment<br />
by using hue: Turtles with the<br />
same direction have the same<br />
color. Clusters with the same<br />
heading can be easily<br />
distinguished.<br />
Flocking model with redundant<br />
variable and emphasis.<br />
Most of the emphasis is on<br />
alignment using hue,<br />
orientation and shape. Note<br />
how the heading is more<br />
apparent with elongated shapes.<br />
Observe how the heading of<br />
overlapping agents is more<br />
apparent.<br />
Figure 15. Redundant visual features of the flock alignment. This redesigned flocking model is at<br />
http://ccl.northwestern.edu/papers/ABM<strong>Visualization</strong><strong>Guidelines</strong>/FlockingRedesign/<br />
The use of several visual variables to represent a single model variable is a common technique.<br />
Redundant visual variables can increase the legibility and expressiveness of interactive maps <strong>for</strong><br />
visual data exploration (Andrienko, 1999). Thus, using redundant visual variables in agent based<br />
models, should facilitate the cognition of in<strong>for</strong>mation within ABM animation.<br />
Explain<br />
ABM visualizations usually have only one viewing mode depicting the macro-behavior of the model.<br />
However, the audience should have the option of viewing the agents' micro-behaviors as well.<br />
Observing the micro-behavior can provide a more meaningful visualization by making the rules<br />
driving the model readily available to the audience. Usually, the micro-behavior is clearly understood<br />
by the modeler since he went through the process of developing the model. He observed the rules <strong>for</strong><br />
a single agent when he authored the model. However, this is not the case <strong>for</strong> a viewer who is<br />
observing the model <strong>for</strong> the first time. Without knowledge of the micro-behavior that produces the<br />
11/20/09 3:30 PM<br />
Page 24 of 32
<strong>Design</strong> <strong>Guidelines</strong> <strong>for</strong> <strong>Agent</strong> <strong>Based</strong> <strong>Model</strong> <strong>Visualization</strong><br />
macro-behavior, first time users can be overwhelmed by the movement of many agents.<br />
11.14<br />
Thus, the user should have the option of changing the visualization in order to observe specific<br />
behaviors such as the behavior of a variable at either a system-wide or individual agent level. A<br />
simple way to allow the viewer to observe the agents micro behavior, is to hide all agents except the<br />
ones that will be used to illustrate the micro-behavior. In this manner, we can suppress unnecessary<br />
moving graphical elements in the visualization that distract the viewer. This operation can be easy or<br />
quite difficult to implement depending upon the model's sophistication, the viewer's familiarity with<br />
the model, and the language primitives of the modeling toolkit.<br />
11.15<br />
Furthermore, the visualization of a single agent allows <strong>for</strong> the depiction/representation of patterns that<br />
would be impossible to follow with all the agents on screen. For example in Figure 16 on the right, the<br />
viewer can see the displacement of a single agent in time by asking the agent to leave a visible trail.<br />
However, it would be impossible to use this same technique with multiple agents, since the trails<br />
would merge and become indistinguishable. This is distinct from modeling a single agent, all the<br />
agents are present in the model but only one agent, the spatially proximate agents and their<br />
interactions are visible.<br />
12.1<br />
12.2<br />
http://jasss.soc.surrey.ac.uk/12/2/1.html<br />
Virus <strong>Model</strong> “normal view”<br />
Virus model in a macro behavior view.<br />
Virus <strong>Model</strong> “micro-behavior View”<br />
Virus model in a micro behavior view. You can<br />
observe the green trail of a healthy individual,<br />
which becomes sick when the trail changes to<br />
red. Additionally, you can see the individual<br />
who transmitted the virus in a darker shade of<br />
red linked by a line.<br />
Figure 16. It is difficult to observe the micro-behavior in the left image, while in the right image,<br />
micro-behavior is explicitly shown: an agent is sick, becomes healthy, and has an offspring.<br />
http://ccl.northwestern.edu/papers/ABM<strong>Visualization</strong><strong>Guidelines</strong>/VirusUserStudy .<br />
Redesign Example<br />
The intent of this section is to convey, through a simple example, the thought process behind the<br />
redesign of an ABM visualization. This example will take advantage of the various concepts we have<br />
discussed earlier in this paper and present them in a systematic, applied manner.<br />
The model below is implemented in NetLogo and replicates the conservation of electric current<br />
passing through two different materials. It was created as part of the NetLogo Investigations in<br />
Electromagnetism project (NIELS) (Sengupta 2006). NIELS develops ABM curricular units in<br />
physics (electrostatics, electricity and magnetism) intended <strong>for</strong> high school, middle school and<br />
11/20/09 3:30 PM<br />
Page 25 of 32
<strong>Design</strong> <strong>Guidelines</strong> <strong>for</strong> <strong>Agent</strong> <strong>Based</strong> <strong>Model</strong> <strong>Visualization</strong><br />
12.3<br />
12.4<br />
12.5<br />
12.6<br />
12.7<br />
undergraduate students. We will describe modifications per<strong>for</strong>med during the redesign of this electric<br />
conduction model, which was conceived to provide a conceptual understanding of the resistance<br />
phenomenon.<br />
This redesign was carried out as part of our research <strong>for</strong> this paper. In a five-hour session the authors<br />
of this paper provided feedback and suggestions to the model's first author. The modeler incorporated<br />
some of the proposed improvements and devised new enhancements of his own based on the<br />
feedback. The redesign continued with minor consultations over a few weeks after the initial session.<br />
http://ccl.northwestern.edu/papers/ABM<strong>Visualization</strong><strong>Guidelines</strong>/SeriesCircuitUserStudy<br />
In the initial visualization below, electrons are represented by red rings filled with a black disk as seen<br />
in Figure 17. The electrons move horizontally from the right negative terminal to the left positive<br />
terminal (blue and red backgrounds) over two different conducting materials (yellow and black<br />
backgrounds). Their movement does not perfectly follow a straight line; it incorporates a small<br />
vibration representing a minor random component.<br />
http://jasss.soc.surrey.ac.uk/12/2/1.html<br />
Figure 17. Initial visualization redesign of Series Circuit <strong>Model</strong><br />
An unintended consequence of having electrons as black disks with red rings is that they are<br />
distinguished using two different visual cognitive mechanisms. The first mechanism to identify an<br />
electron is a change in value (intensity) of the dots. In this case electrons are perceived as black dots.<br />
The second mechanism to recognize the electrons is closure (Ware 2004); in this case the closed<br />
shape of the rings allows the model user to discern electrons. The electrons appear as red rings over<br />
the black background. This dual perceptual mechanism <strong>for</strong> the same entity causes an unnecessary<br />
cognitive load <strong>for</strong> the viewer. This can be easily resolved by filling the electrons with a solid color,<br />
hence assigning them a fixed representation regardless of the changing background color. This can be<br />
seen below in Figure 8.<br />
Figure 18. Foreground enhancement of Series Circuit <strong>Model</strong><br />
Another issue is that the conductors represented by the yellow and black backgrounds display an<br />
excessive contrast. Yellow is the hue with the highest intensity while black has the lowest intensity.<br />
However, the background should have a low contrast and low intensity in order to facilitate ef<strong>for</strong>tless<br />
background/<strong>for</strong>eground segregation.<br />
Also, the electrons are too large, causing them to be perceived as regions that intersect rather than<br />
individual points. Representing the electrons as small bright points as seen in Figure 19 can facilitate<br />
the counting and estimation task, since you do not have to process their intersections when they<br />
overlap.<br />
11/20/09 3:30 PM<br />
Page 26 of 32
<strong>Design</strong> <strong>Guidelines</strong> <strong>for</strong> <strong>Agent</strong> <strong>Based</strong> <strong>Model</strong> <strong>Visualization</strong><br />
12.8<br />
12.9<br />
http://jasss.soc.surrey.ac.uk/12/2/1.html<br />
Figure 19. Foreground enhancement of Series Circuit <strong>Model</strong><br />
Changing the background conductor's color to similar shades of brown lowers the background's<br />
contrast and intensity. Additionally, the reduced electron size allows the viewer to perceive them as a<br />
distribution of dots rather than overlapping circles. Independently, notice that electrons are again<br />
perceived as black rings on the far right red background. Thus, the dual representation we wanted to<br />
avoid initially, of the electrons as rings, is still taking place.<br />
Figure 20. Foreground enhancement of Series Circuit <strong>Model</strong><br />
We changed the electron's color to orange to avoid this dual representation in Figure 20. However,<br />
this change did not prove useful; the orange hue is still too close to red. Notice how visible electrons<br />
are over the blue background (blue and orange are complementary) while the single electron at the<br />
bottom of the red background is virtually invisible. Moreover, the wire's brown hue is distracting;<br />
while the brown hue has the necessary contrast and intensity properties, its color does not convey any<br />
meaning and is unnecessary.<br />
Figure 21. Final design of Series Circuit <strong>Model</strong><br />
12.10<br />
In this final visualization we simplified the design in Figure 21 by using two shades of gray <strong>for</strong> the<br />
conductors. The electrons have a dark red to distinguish them from the background. And we placed<br />
labels over the terminals to make their charge explicit.<br />
12.11<br />
Other changes were made to improve movement, however they can only be perceived in an<br />
animation. For example the motion of the electrons was jerky due to temporal aliasing. The<br />
discontinuous motion of electrons through the wire was difficult to track visually since the electrons<br />
moved with relatively large steps. In order to make the electrons easier to follow, the step that<br />
electrons took between frames was decreased to render the movement more smooth and continuous.<br />
(i.e. temporal anti-aliasing).<br />
13.1<br />
Conclusion<br />
11/20/09 3:30 PM<br />
Page 27 of 32
<strong>Design</strong> <strong>Guidelines</strong> <strong>for</strong> <strong>Agent</strong> <strong>Based</strong> <strong>Model</strong> <strong>Visualization</strong><br />
13.2<br />
13.3<br />
13.4<br />
communicative and cognitively efficient ABM visualizations. We began by presenting a brief<br />
classification of ABM visualizations categorizing them into conventional, structured and unstructured<br />
visualizations, which can be used as a basis <strong>for</strong> finding visualizations that are useful as a starting point<br />
<strong>for</strong> a new visualization. We continued by describing how established design frameworks such as<br />
visual variables and Gestalt laws can be contextualized in ABM. Then, we discussed ABM<br />
visualization design goals: to simplify, emphasize and explain. Finally, we presented an example to<br />
illustrate the process driving a redesign.<br />
These guidelines aim to reduce the cognitive load <strong>for</strong> the viewer by facilitating the perception and<br />
cognitive processing of key behaviors in an ABM. Tools and environments that facilitate the use of<br />
color, shape and movement to represent a behavior in computational media have only become<br />
available in the last two decades. Although some of the guidelines presented in this paper are well<br />
known in the scientific visualization literature, they have not been applied to agent-based models or<br />
reached an ABM audience. In fact, design guidelines geared towards displaying in<strong>for</strong>mation in<br />
conventional static representations such as plots, histograms, and other commonplace depictions<br />
appear in a variety of educational contexts, but in general, dynamic visualization design with<br />
animated graphics has not yet found its way into standard educational curricula.<br />
ABM visualizations have different requirements than traditional visualizations. While traditional<br />
visualization can convey data with static graphics ABM visualization needs to convey behavior<br />
instead of data using dynamic graphics. This behavior of an agent-based model must be rendered in a<br />
perceivable and recognizable manner. In the real world, images obey the laws of nature so that<br />
variations are usually discernible to the eye and understood by the mind due to their visually<br />
continuous and predictable behavior. However, an ABM model is a computational abstraction, which<br />
can exhibit abrupt visual changes that can be hard or impossible to track or understand. To effectively<br />
communicate, the author of an ABM model visualization should be capable of identifying inefficient<br />
graphical representations and know how to redesign them. Thus, a model's author should be aware of<br />
the bounds of visual cognition and perception in order to locate these unperceivable or overwhelming<br />
effects. Then, he or she should strive to make these changes perceivable and understandable using<br />
visual design. This paper has laid out some design guidelines in order to equip authors to create better<br />
ABM visualizations.<br />
In future research we will examine more advanced and novel tools <strong>for</strong> ABM visualization. We plan to<br />
expand the expressive range of visual variables, while taking into account the user's perceptual and<br />
cognitive capabilities. This will include features mentioned previously such as luminous transparency,<br />
textons, and spatial temporal anti-aliasing. We have already developed new dialogs and primitives to<br />
aid visual variable selection, such as the NetLogo palette extension enabling users to choose color<br />
schemes that facilitate a meaningful mapping from value to color. We plan to develop shape and<br />
texture selection assistants. We are currently testing these tools to find out if they help users improve<br />
their visualization design.<br />
References<br />
ANDRIENKO, G L (1999) Interactive maps <strong>for</strong> visual dataexploration, International Journal of<br />
Geographical In<strong>for</strong>mation Science,vol. 13, issue 4, p 355.<br />
ALBERS, J (1975) Interaction of Color. Yale University Press,New Haven, CT.<br />
BERTIN, J (1967) Sémiologie graphique, Paris-DenHaag: Mouton.<br />
BERTIN, J (1983) Semiology of Graphics, Translated by W. Berg, Universityof Wisconsin Press.<br />
http://jasss.soc.surrey.ac.uk/12/2/1.html<br />
11/20/09 3:30 PM<br />
Page 28 of 32
<strong>Design</strong> <strong>Guidelines</strong> <strong>for</strong> <strong>Agent</strong> <strong>Based</strong> <strong>Model</strong> <strong>Visualization</strong><br />
BRATH, R (1997) Metrics <strong>for</strong> effective in<strong>for</strong>mation visualization,Proceedings of the 1997 IEEE<br />
Symposium on In<strong>for</strong>mation <strong>Visualization</strong> (InfoVis'97), p.108, October 18-25.<br />
BRATH, R M Peters and R Senior, (2005) <strong>Visualization</strong> <strong>for</strong>Communication: The Importance of<br />
Aesthetic Sizzle, IEEE IV05.<br />
BACH, M, Poloschek CM (2006) Optical Illusions. Adv Clin NeurosciRehab (ACNR) 6:20–21.<br />
BACH, M (1997-2) 67 Optical Illusions & Visual Phenomena. Lastupdated 26-Nov-2006. Retrieved<br />
December 1, 2006, from Bach Micheal's web site: http://www.michaelbach.de/ot/index.html<br />
CALLAGHAN, T. C. (1989) Interference and domination in texture segregation: Hue, geometric<br />
<strong>for</strong>m, and line orientation. Percep. Psychophys. 46, 4, 299-311.<br />
CARPENDALE, M S T (2003) Considering visual variables as a basis<strong>for</strong> in<strong>for</strong>mation visualization.<br />
Technical Report 2001-693-16, Departmentof Computer Science, University of Calgary, Calgary,<br />
Canada.<br />
COBB T, (1997) Cognitive efficiency: Toward a revised theory ofmedia. Educational Technology<br />
Research & Development, 45 (4), 21-35.<br />
COLBY G, Scholl L, (1991) Transparency and blur as selective cues<strong>for</strong> complex visual in<strong>for</strong>mation,<br />
SPIE Vol. 1460, Image Handling andReproduction Systems Integration, pages 114–125.<br />
GOLDSTEIN, E B (1999) Sensation and Perception (5 th Edition). Brooks/Cole Publishing.<br />
HARROWER, M A & Brewer C A, (2003) ColorBrewer.org: An OnlineTool <strong>for</strong> Selecting Color<br />
Schemes <strong>for</strong> Maps, The Cartographic Journal 40(1): 27-37.<br />
HEALEY, C G, Booth K S, & Enns, J T (1995). VisualizingReal-Time Multivariate Data Using<br />
Preattentive Processing ACM Transactionson <strong>Model</strong>ing and Computer Simulation 5, 3, 190-221.<br />
HEALEY, C G, Booth K S, & Enns J T (1996) High-Speed VisualEstimation Using Preattentive<br />
Processing ACM Transactions on Human ComputerInteraction 3, 2, 107-135.<br />
HEALEY, C G, St. Amant R, & Elhaddad M. (1999)"ViA: APerceptual <strong>Visualization</strong> Assistant." In<br />
Proceedings 28th AppliedImagery Pattern Recognition Workshop, (Washington, D.C., pp. 1-11.<br />
HEALEY, C G (2006) Perception in <strong>Visualization</strong>, Last updated17-Jan-2007. Retrieved December 1,<br />
2006, from Christopher Haley's web site: http://www.csc.ncsu.edu/faculty/healey/PP/index.html<br />
(comprehensive review updated regularly).<br />
ITTEN, J (1970) The Elements of Color. Van Nostrand ReinholdCompany, New York, NY.<br />
JONES, C (1998) Geographical In<strong>for</strong>mation Systems and ComputerCartography, Longman, Harlow,<br />
England.<br />
JULESZ, B (1986) Texton gradients: The texton theory revisited, BiologicalCybernetics, vol. 54, pp.<br />
245-251<br />
KLEIN, J (2002) Breve: a 3D simulation environment <strong>for</strong> thesimulation of decentralized systems and<br />
artificial life. Proceedings ofArtificial Life VIII, the 8th International Conference on the Simulation<br />
andSynthesis of Living Systems. The MIT Press.<br />
KOSARA R, Miksch S, Hauser and H, (2001) Semantic Depth of Field, Proc.IEEE Symp. In<strong>for</strong>mation<br />
http://jasss.soc.surrey.ac.uk/12/2/1.html<br />
11/20/09 3:30 PM<br />
Page 29 of 32
<strong>Design</strong> <strong>Guidelines</strong> <strong>for</strong> <strong>Agent</strong> <strong>Based</strong> <strong>Model</strong> <strong>Visualization</strong><br />
<strong>Visualization</strong> (InfoVis2001), IEEE CS Press, LosAlamitos, Calif., pp. 97- 104.<br />
KOREIN J, Badler N, (1983) Temporal anti-aliasing in computergenerated animation, Proceedings of<br />
the 10th annual conference on Computergraphics and interactive techniques, p.377-388, July 25-29,<br />
Detroit, Michigan, United States<br />
LUKE, S, Catalin Balan G, Panait L, Cioffi-Revilla C, and Paus S (2003)MASON: A Java Multi-<br />
<strong>Agent</strong> Simulation Library, Proceedings of the <strong>Agent</strong> 2003Conference.<br />
LOHSE, G L Biolsi, K. Walker, N. Rueter, H. H. (1994) " AClassification of Visual<br />
Representations", VOL 37; NUMBER 12, pages 36,ACM Communications.<br />
MAEDA, J (1999) <strong>Design</strong> by Numbers, The MIT Press.<br />
MINAR N, R Burkhart, C Langton, and M AskenazI (1996) The Swarmsimulation system: a toolkit<br />
<strong>for</strong> building multi-agent simulations. WorkingPaper 96-06-042, Santa Fe Institute, Santa Fe.<br />
NESBITT, K V, Friedrich C. (2002) Applying Gestalt Principles toAnimated <strong>Visualization</strong>s of<br />
Network Data. Proc. IV 2002, IEEE ComputerSociety Press, London, UK, 10-12 July.<br />
NORTH, M J , N T Collier, and J.R. Vos, (January 2006)"Experiences Creating Three<br />
Implementations of the Repast <strong>Agent</strong> <strong>Model</strong>ingToolkit," ACM Transactions on <strong>Model</strong>ing and<br />
Computer Simulation,Vol. 16, Issue 1, pp. 1-25, ACM, New York, New York, USA.<br />
MACEACHREN, A (1995) How Maps Work, The Guil<strong>for</strong>d Press.<br />
NORMAN, D A (2004). Emotional design: why we love (or hate)everyday things. New York: Basic<br />
Books.<br />
PIPES, A (2004) Foundations of Art and <strong>Design</strong>, Laurence KingPublishing.<br />
RESNICK, M (1994) Turtles, Termites, and Traffic Jams, MITPress, Cambridge.<br />
REYNOLDS, W C (July 1987) Flocks, herds and schools: A distributedbehavioral model, Volume<br />
21, Issue 4, Pages: 25–34, Year of Publication:1987.<br />
RUCKERS, R (1993) Artificial Life Lab, Waite Group Press.<br />
SCHELLING, T. (1978). Micromotives and Macrobehavior. New York:Norton.<br />
TISUE, S. & WILENSKY U. (2004). NetLogo: <strong>Design</strong> andimplementation of a multi-agent modeling<br />
environment, Proceedings of <strong>Agent</strong>2004.<br />
TUKEY, J (1977) Exploratory Data Analysis, Addison-Wesley.<br />
TUFTE, E (1983) The Visual Display of Quantitative In<strong>for</strong>mation, GraphicsPress.<br />
TUFTE, E (1996). Visual Explanation, Graphic Press,Cheschire, Conn.<br />
TUFTE, E (2006). Beautiful evidence, Graphic Press,Cheshire, Conn.<br />
WARE, C (2004). In<strong>for</strong>mation <strong>Visualization</strong>, 2nd Ed., MorganKaufmann.<br />
WARE, C, (2002). Purchase H, Colpoys L and McGill M, Cognitivemeasurements of graph<br />
aesthetics, In<strong>for</strong>mation <strong>Visualization</strong>.<br />
http://jasss.soc.surrey.ac.uk/12/2/1.html<br />
11/20/09 3:30 PM<br />
Page 30 of 32
<strong>Design</strong> <strong>Guidelines</strong> <strong>for</strong> <strong>Agent</strong> <strong>Based</strong> <strong>Model</strong> <strong>Visualization</strong><br />
WERTHEIMER, M (1923). Untersuchungen zur Lehre von der Gestalt, II(Laws of organization in<br />
perceptual <strong>for</strong>ms). PsycholocheForschung, 4, 301-350. Excerpts translated and reprinted in W. D.Ellis<br />
(Ed.), A source book of Gestaltpsychology (pp. 71-88). New York: Harcourt, Brace and Co., 1939.<br />
WILENSKY, U (2001) <strong>Model</strong>ing Nature's Emergent Patterns with<strong>Agent</strong>-<strong>Based</strong> Languages,<br />
Proceedings of Eurologo 2001.<br />
WILENSKY, U. and Reisman, K. (2006). Thinking like a wolf, a sheepor a firefly: Learning biology<br />
through constructing and testing computationaltheories. Cognition & Instruction, 24(2), 171-209.<br />
<strong>Model</strong>s and Computer Software<br />
ABRAHAMSON, D andWILENSKY, U (2004).NetLogo ProbLab Genetics model.<br />
http://ccl.northwestern.edu/netlogo/models/ProbLabGenetics. Center <strong>for</strong> Connected Learning and<br />
Computer-<strong>Based</strong> <strong>Model</strong>ing,Northwestern University, Evanston, IL.<br />
AN, G (2004). Innate Immune Response Department of Trauma, CookCounty Hospital.<br />
http://ccl.northwestern.edu/netlogo/models/community/InnateImmune Response<br />
KORNHAUSER, D (2007). NetLogo Palette Extension<br />
http://ccl.northwestern.edu/papers/ABM<strong>Visualization</strong><strong>Guidelines</strong>/palette/.Center <strong>for</strong> Connected<br />
Learning and Computer-<strong>Based</strong><strong>Model</strong>ing, Northwestern University, Evanston, IL.<br />
SENGUPTA, P & Wilensky, U (2007). NetLogo Series Circuitmodel.<br />
http://ccl.northwestern.edu/netlogo/models/SeriesCircuit.Center <strong>for</strong> Connected Learning and<br />
Computer-<strong>Based</strong> <strong>Model</strong>ing, NorthwesternUniversity, Evanston, IL.<br />
WILENSKY, U (1999a). NetLogo.<br />
http://ccl.northwestern.edu/netlogo. Center <strong>for</strong> Connected Learning and Computer-<strong>Based</strong><br />
<strong>Model</strong>ing.Northwestern University, Evanston, IL.<br />
WILENSKY, U (1999b). NetLogo <strong>Model</strong>s Library.<br />
http://ccl.northwestern.edu/netlogo/models/.Northwestern University, Evanston, IL.<br />
WILENSKY, U (2005). NetLogo Disease Solo model.<br />
http://ccl.northwestern.edu/netlogo/models/DiseaseSolo.Center <strong>for</strong> Connected Learning and<br />
Computer-<strong>Based</strong> <strong>Model</strong>ing, NorthwesternUniversity, Evanston, IL.<br />
WILENSKY, U (2004a). NetLogo DLA model.<br />
http://ccl.northwestern.edu/netlogo/models/DLA. Center <strong>for</strong> Connected Learning and Computer-<strong>Based</strong><br />
<strong>Model</strong>ing,Northwestern University, Evanston, IL.<br />
WILENSKY, U (2006). NetLogo Ethnocentrism model.<br />
http://ccl.northwestern.edu/netlogo/models/Ethnocentrism.<br />
Center <strong>for</strong> Connected Learning and Computer-<strong>Based</strong> <strong>Model</strong>ing, NorthwesternUniversity, Evanston,<br />
IL.<br />
WILENSKY, U (2004b). NetLogo Heatbugs model.<br />
http://ccl.northwestern.edu/netlogo/models/Heatbugs.<br />
Center <strong>for</strong> Connected Learning and Computer-<strong>Based</strong> <strong>Model</strong>ing,<br />
Northwestern University, Evanston, IL.<br />
WILENSKY, U (1998a). NetLogo Virus model.<br />
http://ccl.northwestern.edu/netlogo/models/Virus. Center <strong>for</strong> Connected Learning and Computer-<br />
http://jasss.soc.surrey.ac.uk/12/2/1.html<br />
11/20/09 3:30 PM<br />
Page 31 of 32
<strong>Design</strong> <strong>Guidelines</strong> <strong>for</strong> <strong>Agent</strong> <strong>Based</strong> <strong>Model</strong> <strong>Visualization</strong><br />
<strong>Based</strong> <strong>Model</strong>ing,Northwestern University, Evanston, IL.<br />
WILENSKY, U (1998b). NetLogo Heat Diffusion model.<br />
http://ccl.northwestern.edu/netlogo/models/HeatDiffusion.Center <strong>for</strong> Connected Learning and<br />
Computer-<strong>Based</strong> <strong>Model</strong>ing, NorthwesternUniversity, Evanston, IL.<br />
WILENSKY, U (1998c). NetLogo Rumor Mill model.<br />
http://ccl.northwestern.edu/netlogo/models/RumorMill.Center <strong>for</strong> Connected Learning and Computer-<br />
<strong>Based</strong> <strong>Model</strong>ing, NorthwesternUniversity, Evanston, IL.<br />
WILENSKY, U (1998d). NetLogo Voting model.<br />
http://ccl.northwestern.edu/netlogo/models/Voting.Center <strong>for</strong> Connected Learning and Computer-<br />
<strong>Based</strong> <strong>Model</strong>ing, NorthwesternUniversity, Evanston, IL.<br />
WILENSKY, U (1998e). NetLogo Termites model.<br />
http://ccl.northwestern.edu/netlogo/models/Termites.Center <strong>for</strong> Connected Learning and Computer-<br />
<strong>Based</strong> <strong>Model</strong>ing, NorthwesternUniversity, Evanston, IL.<br />
WILENSKY, U (1998f). NetLogo Flocking model.<br />
http://ccl.northwestern.edu/netlogo/models/Flocking.Center <strong>for</strong> Connected Learning and Computer-<br />
<strong>Based</strong> <strong>Model</strong>ing, NorthwesternUniversity, Evanston, IL.<br />
WILENSKY, U (1998g). NetLogo Segregation model.<br />
http://ccl.northwestern.edu/netlogo/models/Segregation.Center <strong>for</strong> Connected Learning and Computer-<br />
<strong>Based</strong> <strong>Model</strong>ing, NorthwesternUniversity, Evanston, IL.<br />
WILENSKY, U (1998h). NetLogo Decay model.<br />
http://ccl.northwestern.edu/netlogo/models/Decay.Center <strong>for</strong> Connected Learning and Computer-<br />
<strong>Based</strong> <strong>Model</strong>ing, NorthwesternUniversity, Evanston, IL.<br />
WILENSKY, U (1998i). NetLogo Simple Kinetics 1 model.<br />
http://ccl.northwestern.edu/netlogo/models/SimpleKinetics1.Center <strong>for</strong> Connected Learning and<br />
Computer-<strong>Based</strong> <strong>Model</strong>ing, NorthwesternUniversity, Evanston, IL.<br />
Return to Contents of this issue<br />
© Copyright Journal of Artificial Societies and Social Simulation, [2009]<br />
http://jasss.soc.surrey.ac.uk/12/2/1.html<br />
11/20/09 3:30 PM<br />
Page 32 of 32