3566_Lechtenboehmer.pdf - Publication Server of the Wuppertal ...
3566_Lechtenboehmer.pdf - Publication Server of the Wuppertal ...
3566_Lechtenboehmer.pdf - Publication Server of the Wuppertal ...

You also want an ePaper? Increase the reach of your titles
YUMPU automatically turns print PDFs into web optimized ePapers that Google loves.
Abstract<br />
Surveys<br />
Redesigning Urban<br />
Infrastructures for<br />
a Low-Emission Future<br />
An Overview <strong>of</strong> Urban<br />
Low-Carbon Technologies<br />
Stefan Lechtenböhmer 1,2 , Claus Bar<strong>the</strong>l 1 , Frank Merten 1 , Clemens Schneider 1 ,<br />
Dietmar Schüwer 1 , Dieter Seifried 3<br />
1. <strong>Wuppertal</strong> Institute for Climate Energy and Environment, <strong>Wuppertal</strong> Germany<br />
2. <strong>Wuppertal</strong> Institut für Klima Umwelt Energie, Döppersberg 19, 42103 <strong>Wuppertal</strong>, Germany<br />
3. Büro Ö-Quadrat, Freiburg, Germany<br />
Correspondence to: stefan.lechtenboehmer@wupperinst.org<br />
Preventing <strong>the</strong> worst consequences <strong>of</strong> climate change would require that GHG emissions be<br />
reduced to levels near zero by <strong>the</strong> middle <strong>of</strong> <strong>the</strong> century. To respond to such a daunting<br />
challenge, we need to rethink and redesign <strong>the</strong> currently highly energy-dependent<br />
infrastructures <strong>of</strong> industrial societies and particularly <strong>the</strong> urban infrastructures to become<br />
low- or even zero-carbon cities. Sustainable urban infrastructures need technology. In this<br />
paper focused on Western European Cities, we discuss a wide set <strong>of</strong> technologies in <strong>the</strong><br />
fields <strong>of</strong> building, energy and transport infrastructures that can significantly contribute to a<br />
reduction <strong>of</strong> energy and/or GHG emissions and are already available or are in <strong>the</strong> pipeline.<br />
Based on <strong>the</strong> review <strong>of</strong> a recent study for <strong>the</strong> city <strong>of</strong> Munich, we <strong>the</strong>n present how a mix<br />
<strong>of</strong> <strong>the</strong>se technologies could reduce CO2-emissions by up to 90% for <strong>the</strong> metropolis <strong>of</strong><br />
1.3 million inhabitants and that this strategy could be economically attractive despite a high<br />
initial investment.<br />
All <strong>of</strong> <strong>the</strong> residential buildings <strong>of</strong> a city like Munich could be entirely redesigned for €200 per<br />
inhabitant annually, which is about one third <strong>of</strong> an average annual natural gas bill.<br />
Keywords: Low carbon infrastructures, low carbon technologies, energy<br />
efficiency, renewable energies, urban infrastructure planning, Munich.<br />
TABLE OF CONTENTS<br />
1. Introduction<br />
2. Methodology <strong>of</strong> technology selection and representation<br />
3. Overview <strong>of</strong> technologies for low-emission urban infrastructures<br />
3.1 Low-carbon building infrastructures<br />
3.2 High efficiency electric equipment and appliances<br />
3.3 Low-carbon transport technologies<br />
3.4 Low carbon energy infrastructure<br />
4. Review: Combining LCTs for a very low CO2 emission scenario<br />
5. Conclusion<br />
Published: 20 October 2010.<br />
Edited by: Gaëll Mainguy – This paper has been reviewed by Chris Kennedy and ano<strong>the</strong>r anonymous referee<br />
© Author(s) 2010. This article is distributed under <strong>the</strong> Creative Commons Attribution 3.0 License.<br />
http://sapiens.revues.org/index1042.html<br />
’<br />
S . A . P . I . EN . S<br />
1<br />
VOLUME 3 ISSUE 2 2010
1. INTRODUCTION<br />
LECHTENBÖHMER REDESIGNING URBAN INFRASTRUCTURES FOR A LOW-EMISSION FUTURE<br />
Our cities are facing a huge transformation challenge. Today<br />
almost all large cities around <strong>the</strong> globe rely heavily on highly<br />
energy-intensive urban infra-structures. According to IEA (2008)<br />
by 2030 cities will consume about 73 per cent <strong>of</strong> <strong>the</strong> world’s energy<br />
and producea comparable share <strong>of</strong> <strong>the</strong> world’s greenhouse gas<br />
emissions. To prevent <strong>the</strong> worst consequences <strong>of</strong> climate change<br />
would require that GHG emissions be reduced to levels near zero<br />
by <strong>the</strong> middle <strong>of</strong> <strong>the</strong> century (Rockström et al. 2009, IPCC 2009,<br />
2007, WBGU 2009). This means that urban infrastructures have to<br />
be converted to systems that consume less energy and produce<br />
almost no emissions by <strong>the</strong> middle <strong>of</strong> <strong>the</strong> century – or, in short,<br />
transformed to low carbon urban infrastructures.<br />
To achieve this transformation, cities need political will and<br />
guidance. Many cities around <strong>the</strong> globe already have set<br />
ambitious GHG mitigation targets (Lechtenböhmer 2009b).<br />
Cities also need broad participation by all stakeholders, as well<br />
as societal and technical innovation (Dröge 2010). Here we focus<br />
on <strong>the</strong> latter. Sustainable urban infrastructures need technology.<br />
In <strong>the</strong> following pages we survey <strong>the</strong> most relevant fields<br />
<strong>of</strong> urban infrastructure <strong>of</strong> Western European cities for currently<br />
available or future low carbon technologies (LCTs) that <strong>of</strong>fer <strong>the</strong><br />
potential for a significant reduction in energy demand and/or<br />
GHG emissions.<br />
Our survey shows <strong>the</strong> availability <strong>of</strong> LCTs, <strong>the</strong>ir economic<br />
prospects and <strong>the</strong>ir infrastructural prerequisites for three main<br />
fields <strong>of</strong> transformation <strong>of</strong> urban infrastructures:<br />
• Technologies for energy efficiency in buildings regarding<br />
a) <strong>the</strong>ir heat demand and supply as well as b) <strong>the</strong> electricity<br />
demand <strong>of</strong> <strong>the</strong> appliances and <strong>the</strong> equipment used in<br />
buildings.<br />
• Technologies for reducing <strong>the</strong> energy demand <strong>of</strong> goods and<br />
passenger transport in <strong>the</strong> city.<br />
• Technologies for <strong>the</strong> adaptation <strong>of</strong> <strong>the</strong> energy supply<br />
infrastructure to low energy demand and to a renewable or<br />
low carbon supply.<br />
Particular technologies, however, that apply to energy intensive<br />
production and industries or such technologies that generally<br />
do not occur on a municipal level, such as central power plants,<br />
have not been considered in this paper or in <strong>the</strong> case study for<br />
Munich. The latter is reviewed here as an example <strong>of</strong> <strong>the</strong> use <strong>of</strong><br />
<strong>the</strong> LCT matrix.<br />
2. METHODOLOGY OF TECHNOLOGY<br />
SELECTION AND REPRESENTATION<br />
To achieve <strong>the</strong> overall goal <strong>of</strong> a GHG emission reduction <strong>of</strong> 80<br />
percent or even more in large cities by 2050, it is necessary to<br />
reduce energy use and emissions in every field to an absolute<br />
minimum. Embracing this principle for each <strong>of</strong> <strong>the</strong> technology<br />
areas that are relevant in cities, we surveyed and selected<br />
technologies that can be regarded as capable <strong>of</strong> significantly<br />
2 LECHTENBÖHMER | P2<br />
reducing energy use and/or GHG emissions to a very low level or<br />
that are necessary as parts <strong>of</strong> a low energy or low emissions<br />
system (e.g. enabling <strong>the</strong> use <strong>of</strong> o<strong>the</strong>r necessary technologies). To<br />
establish <strong>the</strong> list <strong>of</strong> <strong>the</strong> LCTs, we undertook a literature review,<br />
including internet resources, plus a survey <strong>of</strong> experts, primarily<br />
from different business areas <strong>of</strong> Siemens. Technologies such as<br />
those that are related to <strong>the</strong> central electricity generation and<br />
distribution system were not taken into account here as <strong>the</strong>y are<br />
typically located outside <strong>the</strong> urban infrastructures.<br />
After collecting and selecting relevant technologies, we grouped<br />
<strong>the</strong>m by market segment and categorised <strong>the</strong>m according to<br />
<strong>the</strong> potential width and depth <strong>of</strong> <strong>the</strong>ir energy and GHG<br />
mitigation potential, <strong>the</strong>ir availability and costs, etc. as given in<br />
Tables 1 to 4. The categorisations and <strong>the</strong> estimates used to<br />
complete <strong>the</strong> information in Tables 1 to 4, which mainly reflect<br />
<strong>the</strong> current situation in Western European cities, have been<br />
checked fur<strong>the</strong>r during two workshops in <strong>the</strong> spring and<br />
summer 2008 with technology experts from <strong>Wuppertal</strong> Institute<br />
and Siemens.<br />
As a first step, <strong>the</strong> mitigation potential <strong>of</strong> each LCT was<br />
estimated in order to provide a scale <strong>of</strong> <strong>the</strong> potential relevance <strong>of</strong><br />
all LCTs within a low emission strategy. For <strong>the</strong> purpose <strong>of</strong> our<br />
estimate, we defined <strong>the</strong> mitigation potential as <strong>the</strong> product <strong>of</strong><br />
<strong>the</strong> depth and width <strong>of</strong> an LCT. By depth, we characterise <strong>the</strong><br />
relative order <strong>of</strong> magnitude <strong>of</strong> <strong>the</strong> energy or emission reduction<br />
that can be achieved in comparison to a standard or reference<br />
technology. In one particular case, a passive house, <strong>the</strong> energy<br />
saving would be around 80 per cent <strong>of</strong> <strong>the</strong> energy <strong>of</strong> a<br />
conventional, new building.<br />
In order to provide an ordinal ranking <strong>of</strong> <strong>the</strong> technologies, we<br />
define four groups <strong>of</strong> technologies according to <strong>the</strong>ir relative<br />
mitigation potential (depths). The first group delivers net/zero<br />
savings vs. standard technology (–/0). Such technologies are<br />
taken into account only when <strong>the</strong>y are needed as enabling<br />
technologies for o<strong>the</strong>rs with higher potentials. The second group<br />
<strong>of</strong> technologies delivers moderate savings (up to 33% vs.<br />
standard technology) (+). The third group delivers 33 to 66%<br />
savings (++). The fourth group <strong>of</strong>fers high savings <strong>of</strong> between<br />
66 and 100% vs. standard technology (+++).<br />
The second dimension <strong>of</strong> <strong>the</strong> potential is its width. This is <strong>the</strong> size<br />
<strong>of</strong> <strong>the</strong> potential in regard to <strong>the</strong> applicability <strong>of</strong> <strong>the</strong> LCT in <strong>the</strong><br />
respective market or technology segment. We discriminate<br />
between niche & low width technologies that cover less than<br />
33% <strong>of</strong> <strong>the</strong> respective segment (+), medium width technologies<br />
that can be applied to between 33 and 66% <strong>of</strong> <strong>the</strong> segment (++)<br />
and high width technologies that potentially cover more than<br />
66% <strong>of</strong> <strong>the</strong> segment (+++).<br />
As it clearly influences <strong>the</strong> introduction strategy, we<br />
qualitatively describe in a separate column <strong>of</strong> <strong>the</strong> tables<br />
whe<strong>the</strong>r and which system changes need to be introduced to<br />
make use <strong>of</strong> an LCT.
LECHTENBÖHMER REDESIGNING URBAN INFRASTRUCTURES FOR A LOW-EMISSION FUTURE<br />
Finally, <strong>the</strong> product <strong>of</strong> depth and width <strong>of</strong> <strong>the</strong> mitigation<br />
potential <strong>of</strong> a certain LCT, as given in Tables 1 to 4, indicates<br />
its overall reduction potential compared to <strong>the</strong> standard<br />
technologies in that segment. However, <strong>the</strong> share <strong>of</strong> <strong>the</strong> total<br />
potential depends on <strong>the</strong> specific situation in every city and on<br />
more detailed scenario analyses (e.g. Lechtenböhmer et al.<br />
2009a).<br />
Fur<strong>the</strong>r to <strong>the</strong> potential, we characterise <strong>the</strong> LCTs according to<br />
<strong>the</strong>ir life cycle costs. Such a characterisation is, however,<br />
somewhat difficult for a time span <strong>of</strong> 40 to 50 years. Innovation<br />
will lead to significant changes in <strong>the</strong> costs <strong>of</strong> LCTs and <strong>the</strong> costs<br />
<strong>of</strong> fossil fuels and <strong>the</strong> external costs <strong>of</strong> <strong>the</strong> energy system will<br />
greatly change during <strong>the</strong> decades to come. Therefore, <strong>the</strong><br />
economic aspects <strong>of</strong> <strong>the</strong> LCTs should be seen from a dynamic<br />
perspective. We reflect this with two estimates, one for <strong>the</strong><br />
current status and one for <strong>the</strong> future, when <strong>the</strong> respective LCT<br />
is expected to have reached a certain status <strong>of</strong> maturity. We also<br />
provide <strong>the</strong> estimated date when <strong>the</strong> technology will have<br />
reached this mature status.<br />
Given <strong>the</strong> long time frame <strong>of</strong> this overview, we cannot provide<br />
exact costs. Thus, we do not provide hard quantitative<br />
estimates like those given in <strong>the</strong> marginal abatement cost<br />
curves (MACs) that were developed by McKinsey 1 , E.ON (2006)<br />
or o<strong>the</strong>rs. These MACs are typically calculated for timeframes<br />
that end in 2020 or 2030 (by McKinsey) at <strong>the</strong> latest. For a<br />
timeframe that ends in 2050, <strong>the</strong> uncertainties regarding<br />
future costs <strong>of</strong> LCTs, as well as <strong>the</strong> costs <strong>of</strong> fossil energy<br />
supply, are too great to permit such quantifications (Fleiter<br />
et al. 2009).<br />
Instead, we group technologies into three main categories for<br />
<strong>the</strong>ir comparative life cycle costs vs. standard technologies.<br />
Technologies in <strong>the</strong> first category lead to increased life cycle<br />
costs vs. a standard technology. We regard this as significant<br />
if <strong>the</strong> estimated increase is at least one third (and up to two<br />
thirds). The second category <strong>of</strong> technologies has or promises<br />
life cycle costs that are approximately (+-33%) equivalent to<br />
standard technologies. Finally, <strong>the</strong> third category consists <strong>of</strong><br />
technologies that provide life cycle costs that are significantly<br />
(more than a third) lower than those <strong>of</strong> standard technologies.<br />
For <strong>the</strong> total life cycle costs, <strong>the</strong> investment typically is a very<br />
important factor, however as many technologies discussed here<br />
substitute energy for capital, <strong>the</strong> expected development <strong>of</strong> future<br />
energy prices is even more decisive. With potentially high future<br />
fossil energy prices, <strong>the</strong> life cycle costs <strong>of</strong> <strong>the</strong> LCTs are <strong>of</strong>ten lower<br />
than those <strong>of</strong> standard technologies. For our survey, we assumed<br />
an annual real increase in <strong>the</strong> price <strong>of</strong> electricity <strong>of</strong> 1% per year<br />
from a current level <strong>of</strong> 20 ct/kWh to 32 ct/kWh in 2050, and for<br />
fuels in a range from 1.5 to 2.5% (i.e., from 8 ct/kWh to a level <strong>of</strong><br />
16 to 26 ct/kWh 2 ). We do not explicitly take external costs, as well<br />
as CO2-prices, into account. However, it can be assumed that<br />
LCTs by definition have lower external costs and particularly<br />
lower CO2 costs.<br />
Finally we provide examples <strong>of</strong> pilot projects where <strong>the</strong><br />
LCTs mentioned already have been realised and provide<br />
a rough sketch <strong>of</strong> <strong>the</strong> status <strong>of</strong> each LCT, whe<strong>the</strong>r it is<br />
already in <strong>the</strong> market, available in <strong>the</strong> form <strong>of</strong> first pilot<br />
applications or in <strong>the</strong> research pipeline with fur<strong>the</strong>r<br />
R&D necessary.<br />
When combining <strong>the</strong> LCTs into concepts and scenarios for<br />
actual cities or regions, fur<strong>the</strong>r systemic aspects, such as<br />
overlaps, potential rebound effects and synergies, must be<br />
taken into account. These considerations are not subjects <strong>of</strong><br />
this paper. Instead, we review <strong>the</strong> results <strong>of</strong> ano<strong>the</strong>r study in<br />
which <strong>the</strong> LCTs discussed here have been used to formulate a<br />
low-carbon scenario for <strong>the</strong> city <strong>of</strong> Munich (Lechtenböhmer<br />
2009 a,b; see Figure 1).<br />
3. OVERVIEW OF TECHNOLOGIES FOR<br />
LOW-EMISSION URBAN INFRASTRUCTURES<br />
The following paragraphs give an overview <strong>of</strong> <strong>the</strong> LCT<br />
survey that was conducted and provide a first interpretation<br />
<strong>of</strong> <strong>the</strong> results.<br />
3.1 LOW-CARBON BUILDING INFRASTRUCTURES<br />
In <strong>the</strong> field <strong>of</strong> heat demand and supply for buildings, a number<br />
<strong>of</strong> LCTs are available with very high depth. These are LCTs<br />
that have <strong>the</strong> potential to reduce energy demand and<br />
emissions to a very low level. On <strong>the</strong> heat demand side, <strong>the</strong>se<br />
are new construction concepts for new buildings, as well as<br />
for <strong>the</strong> refurbishment <strong>of</strong> existing ones. They constitute <strong>the</strong><br />
backbone <strong>of</strong> a low energy and low emission strategy in this<br />
field, but are flanked by a number <strong>of</strong> o<strong>the</strong>r LCTs, some <strong>of</strong><br />
which are single technologies that might be capable <strong>of</strong> fur<strong>the</strong>r<br />
improving <strong>the</strong> technical properties <strong>of</strong> insulation, for example.<br />
Depending on <strong>the</strong>ir development status, <strong>the</strong>se technologies<br />
will still need higher investment than standard building<br />
concepts. However, all solutions in this field promise to<br />
achieve equal or even lower life cycle costs in <strong>the</strong> future than<br />
<strong>the</strong> standard.<br />
The heat supply technology must be adapted to <strong>the</strong> low<br />
remaining demand. Here technologies range from adapted<br />
heat grids, new micro-CHP and heating and cooling<br />
technologies over solar systems to new developments <strong>of</strong> heat<br />
storage technologies, which could be used to balance <strong>the</strong><br />
seasonal divergence <strong>of</strong> heat supply and demand. A larger<br />
bundle <strong>of</strong> partly alternative solutions is presently available or<br />
in advanced levels <strong>of</strong> R&D. These vary in depth <strong>of</strong> impact and<br />
most are limited to parts <strong>of</strong> <strong>the</strong> heating market. Their<br />
technologies must be adapted to <strong>the</strong> respective situation on a<br />
very local scale. Almost all supply side options have higher<br />
investment needs than standard technology. However, for<br />
most options, this will be balanced by later energy cost<br />
savings. The overall picture, however, is less positive than<br />
for <strong>the</strong> heat demand side technologies.<br />
1 McKinsey (2009). Climate Change Special Initiative, http://www.mckinsey.com/clientservice/ccsi/Costcurves.asp (lists several McKinsey MAC studies)<br />
2 These numbers are without inflation (real values in Euro 2008) and have been derived by Lechtenböhmer et al. (2009b) from recent long-term scenario studies for Germany (BMU 2008).<br />
LECHTENBÖHMER | P3<br />
S . A . P . I . EN . S<br />
3
Table 1: Low carbon heat demand and supply technologies<br />
Technology/ System solution/<br />
supply <strong>of</strong> services<br />
1. Heat/ building<br />
1.1 Building concepts<br />
a) New buildings<br />
Passive house design for residential and<br />
commercial buildings<br />
Plus energy house renewable heat<br />
and power self supply + net power/<br />
heat surplus<br />
b) building stock<br />
Innovative concepts <strong>of</strong> rehabilitation<br />
(passive house standard for rehabilitation<br />
in renovation activities)<br />
1.2 Individual techniques for innovative buildings<br />
New materials and technologies for<br />
<strong>the</strong>rmal insulation / new technology for<br />
improving <strong>the</strong> outer surface <strong>of</strong> a building<br />
(e.g. vacuum insulation and windows)<br />
Phase change materials (PCM) in<br />
insulation materials / passive cooling<br />
LECHTENBÖHMER REDESIGNING URBAN INFRASTRUCTURES FOR A LOW-EMISSION FUTURE<br />
Necessary system<br />
transformation<br />
Dimensioning <strong>of</strong> energy supply<br />
infrastructures<br />
Change from 100% demand to<br />
a mix <strong>of</strong> supply and demand<br />
Quality assurance and<br />
increased investment in<br />
refurbishment <strong>of</strong> buildings<br />
No system change, but a<br />
significantly higher level <strong>of</strong><br />
quality and quality assurance<br />
is necessary<br />
New concept, easy integration<br />
in conventional renovation or<br />
new buildings<br />
Utilisation <strong>of</strong> daylight Change in planning principles<br />
(new buildings)<br />
1.3/4.2 Heating and cooling supply network<br />
Small district heating grids<br />
a) Conventional<br />
b) “cold systems” (with decentralised heat<br />
pump) particularly relevant for very low<br />
energy building developments; <strong>of</strong>fers <strong>the</strong><br />
option to better introduce renewable<br />
energies, can be fed by low temperature<br />
waste heat sources<br />
Micro combined heat and power (CHP)<br />
(o<strong>the</strong>r CHP see “4. energy infrastructure)<br />
Solar collectors for producing heat<br />
(heating installation/ hot water<br />
supply /process heat)<br />
Heat pumps<br />
a) Electrical<br />
b) Gas-heat pumps (mainly for small<br />
applications)<br />
Alternative to single heating<br />
systems, can be taken into<br />
account with new development<br />
plans; existing structures:<br />
introduction <strong>of</strong> a new heat<br />
supply grid can be difficult<br />
depending on local situation.<br />
No system change, but<br />
decentralised grid connection<br />
and central control (smart grid)<br />
necessary<br />
(Building) central heating<br />
system needed, new<br />
developments: orientation &<br />
ro<strong>of</strong> shape can be optimised<br />
Space for / availability<br />
<strong>of</strong> heat sources<br />
4 LECHTENBÖHMER | P4<br />
Potential relevance Economic aspects c) Example<br />
Depth<br />
a)<br />
Width<br />
b)<br />
Life cycle<br />
costs<br />
today d)<br />
Life cycle<br />
costs<br />
maturity e)<br />
+++ ++ g m<br />
2020<br />
+++ (++) g m<br />
2025<br />
+++ +++ g m<br />
2025<br />
++ +++ k g<br />
2020<br />
++ ++ k g<br />
2020<br />
++ + g m<br />
2020<br />
++ to +++ ++ g g<br />
g2015<br />
g2025<br />
++ ++ k g<br />
2020<br />
++ ++ g g<br />
2015<br />
+ +++ g<br />
g<br />
g<br />
2010<br />
g<br />
2020<br />
Available 1<br />
Pilot projects 2<br />
Pilot projects 3<br />
pilot projects 4<br />
First applications<br />
available 5<br />
Pilot projects:<br />
new building for <strong>the</strong><br />
German Federal<br />
Environment Agency<br />
in Dessau 6<br />
a) Available<br />
b) Pilot projects:<br />
heat supply concepts<br />
Simmern 7<br />
Nordkirchen 8<br />
Market introduction 9<br />
Available<br />
a) Available<br />
b) Market<br />
introduction 10 )
Geo<strong>the</strong>rmal heat supply (e.g.,<br />
in combination with on-site heating /<br />
heat pumps/ CHP ect.)<br />
Innovative cooling (building, plants, data<br />
processing center) (tall > 12 kW / small<br />
< 12 kW)<br />
a) Free cooling by overnight ventilation,<br />
ground water etc.<br />
b) Trigeneration (district heating/ CHP<br />
waste heat) use <strong>of</strong> waste heat for industry<br />
via absorption/adsorption<br />
LECHTENBÖHMER REDESIGNING URBAN INFRASTRUCTURES FOR A LOW-EMISSION FUTURE<br />
No (if heat grid available) +++ + to ++ g g<br />
2025<br />
Higher space needs for<br />
machines and for heat source<br />
Legend:<br />
a) Order <strong>of</strong> magnitude <strong>of</strong> energy/emission reduction vs. standard (business as usual) technology; b) Market size, saving potential with regards to <strong>the</strong> respective segment; c) Investment /<br />
costs relative to standard technology; d) life cycle costs <strong>of</strong> current technology vs. standard technology at moderate real energy price increase; e) life cycle costs at status <strong>of</strong> maturity <strong>of</strong><br />
<strong>the</strong> technology vs. standard and expected date <strong>of</strong> maturity<br />
Potential relevance (savings <strong>of</strong> CO2 or energy by technology):<br />
Depth: – / 0 = net/zero savings vs. standard technology; + = small (up to 33% savings vs. standard technology); ++ = medium (33 to 66% savings); +++ = high (66 up to 100% savings)<br />
Width: + low (niche & low width technology, covers less than 33% <strong>of</strong> <strong>the</strong> segment); ++ medium (covers 33 to 66% <strong>of</strong> <strong>the</strong> segment); +++ high (covers 66 to 100% <strong>of</strong> <strong>the</strong> segment)<br />
Economic aspects<br />
k / h = life cycle costs higher than standard technology by more than 33% / 66% (macroeconomic perspective, no external costs <strong>of</strong> costs <strong>of</strong> climate change taken into account);<br />
g = life cycle costs equivalent standard (+- 33%); m / i = life cycle costs lower than standard technology by more than 33% / 66%<br />
Sources:<br />
1) http://www.passivehouse.com/, Archived at http://www.webcitation.org/5rqrtc5G8 on August 9 th , 2010; 2) www.plusenergiehaus.de, Archived at http://www.webcitation.<br />
org/5rquSUPpw on August 9 th , 2010; 3) www.passivhausprojekte.de, Archived at http://www.webcitation.org/5rquNFZMs on August 9 th , 2010; 4) www.vip-bau.de, Archived at<br />
http://www.webcitation.org/5rqubYnpt on August 9 th , 2010; 5) www.glassx.ch, Archived at http://www.webcitation.org/5rquhdMjj on August 9 th , 2010 / www.micronal.de, Archived at<br />
http://www.webcitation.org/5rqunzHjG on August 9 th , 2010; 6) www.enob.info/en/research-areas/enbau, Archived at http://www.webcitation.org/5rqu4vHxv on August 9 th , 2010;<br />
7) www.siekmann-ingenieure.de/www/<strong>pdf</strong>/referenzen/energie/01_KalteNahwaerme-Rinderberg.<strong>pdf</strong>, Archived at http://www.webcitation.org/5rquvuT8J on August 9 th , 2010; 8) ifeu /<br />
WI 2008 ; 9) www.stromerzeugende-heizung.de/download/geraeteuebersicht.<strong>pdf</strong>, Archived at http://www.webcitation.org/5rqvEAo8t on August 9 th , 2010; 10) www.transferstelle.info,<br />
Archived at http://www.webcitation.org/5rqvgvads on August 9 th , 2010 / www.igwp.de, Archived at http://www.webcitation.org/5rqwONi1C on August 9 th , 2010; 11) « München :<br />
Pilotprojekt « Fernkälte » in Betrieb », Strom Magazin, May 19 th , 2004, URL : http://www.strom-magazin.de/strommarkt/muenchen-pilotprojekt-fernkaelte-in-betrieb_11549.html,<br />
Archived at http://www.webcitation.org/5rr0Ugthw on August 9 th , 2010; 12) www.robur.com, Archived at http://www.webcitation.org/5rqwku59w on August 9 th , 2010; 13) http://hybridstorage.de,<br />
Archived at http://www.webcitation.org/5rqwu3qCn on August 9 th , 2010 / www.alfredschneider.de/prod06.htm / www.powertank.de, Archived at http://www.webcitation.<br />
org/5rqxF4QD0 on August 9 th , 2010; 14) www.muenchen.de/Rathaus/rgu/wohnen_bauen/energie/best_practice/209577/index.html, Archived at http://www.webcitation.org/5rr0ac5oF<br />
on August 9 th , 2010; 15) BINE (2007); 16) BINE (2003); 17) Snijders, A. (2008)<br />
LECHTENBÖHMER | P5<br />
Available (fur<strong>the</strong>r R&D<br />
necessary)<br />
+++ ++ see below see below Available (fur<strong>the</strong>r<br />
cost degression<br />
necessary)<br />
See above +++ ++ m m<br />
2015<br />
See above +++ ++ g g<br />
2020<br />
c) Solar cooling via absorption/adsorption See above +++ ++ k g<br />
2025<br />
Coupling <strong>of</strong> heating and cooling demand<br />
(commercial/ industrial): simultaneous<br />
supply <strong>of</strong> cooling (e.g., cooling room) and<br />
heating (e.g., hot water, swimming complex)<br />
Big capacity, low cost heat storages<br />
Integrated planning<br />
necessary<br />
a) Decentralised (latent heat storage) Coupling with decentral<br />
heat grids<br />
b) Central for seasonal storage <strong>of</strong> CHP<br />
heat or solar heat (e.g., aquifer)<br />
Coupling with decentral<br />
heat grids<br />
++ to +++ + m m<br />
2020<br />
++ ++ k g<br />
2025<br />
++ ++ to +++ k g<br />
2025<br />
Available 11<br />
Available (fur<strong>the</strong>r<br />
cost degression<br />
necessary)<br />
Available (fur<strong>the</strong>r R&D<br />
necessary)<br />
Available 12<br />
Pilot projects (fur<strong>the</strong>r<br />
R&D and cost<br />
degression<br />
necessary) 13<br />
Pilot projects (fur<strong>the</strong>r<br />
R&D and cost<br />
degression<br />
necessary):<br />
Solar colony<br />
Ackermannbogen/<br />
Munich 14 )<br />
Aquifer storage<br />
Chemnitz 15 )<br />
and Berlin 16 )<br />
Especially Aquifer<br />
Thermal Energy<br />
Storage (ATES) yet<br />
available in some<br />
countries (e.g.<br />
Ne<strong>the</strong>rlands) 17 )<br />
S . A . P . I . EN . S<br />
5
Table 2: High efficiency electric equipment and appliances<br />
Technology/ System solution/<br />
supply <strong>of</strong> services<br />
2.1 power, equipment and appliances<br />
Cooling and freezing devices for households<br />
(improved insulation, efficient compressors) 1<br />
Cooling and freezing devices for commerce<br />
(improved insulation, efficient compressors,<br />
CO2 as cooling medium) 2<br />
LECHTENBÖHMER REDESIGNING URBAN INFRASTRUCTURES FOR A LOW-EMISSION FUTURE<br />
Necessary system<br />
transformation<br />
Dishwasher (warm water connection) 3 Connection to warm water<br />
hot water produced nearby<br />
Washing machine 3 Connection to warm water<br />
hot water produced nearby<br />
Cooking (substitution <strong>of</strong> electricity<br />
through gas)<br />
Laundry dryer (heat pump dryer<br />
and gas laundry dryer) 1<br />
Lighting (LED, sensors for daylight,<br />
presence annunciator) 4<br />
6 LECHTENBÖHMER | P6<br />
–<br />
–<br />
Potential relevance Economic aspects c) Example<br />
Depth<br />
a)<br />
Width<br />
b)<br />
Life cycle<br />
costs<br />
today d)<br />
Life cycle<br />
costs<br />
maturity e)<br />
++ ++ m m<br />
2009<br />
++ ++ m i<br />
2015<br />
+ + m m<br />
2009<br />
++ + m m<br />
2009<br />
Gas connection f ++ ++ m m<br />
2009<br />
Possibly gas connection f ++ +++ g m<br />
2010<br />
– +++ +++ m i<br />
2009 (sensors)<br />
– 2015 (LED)<br />
Reduction <strong>of</strong> stand-by losses 5 – +++ +++ i i<br />
2009<br />
Pumps in heating systems and in industry<br />
(EC technologies) 6<br />
Hot water boiler (substitution <strong>of</strong> electricity<br />
through gas via heating <strong>of</strong> water in a central<br />
heating system 4<br />
Ventilators, air conditioning, climate<br />
(EC technologies) 7<br />
Compressed air (efficient compressors,<br />
reduction <strong>of</strong> leakages) 8<br />
– +++ +++ m i<br />
2015<br />
Gas connection, domestic<br />
hot water storage tank and<br />
hot water pipe necessary<br />
2.2 Strategies for <strong>the</strong> future concerning power, equipment and constructions<br />
++ ++ g g<br />
2009<br />
– ++ +++ m m<br />
2009<br />
– ++ +++ i i<br />
2009<br />
Lighting: organic light emitting diode 9 – +++ ++ m i<br />
2020<br />
Cooling/freezing: solar cooling<br />
(see under 1. heating/ building)<br />
Washing: washing with ultrasound<br />
or cold water 10<br />
–<br />
Available on <strong>the</strong><br />
market<br />
Some first appliances<br />
available on <strong>the</strong><br />
market<br />
Available on <strong>the</strong><br />
market<br />
Available on <strong>the</strong><br />
market<br />
Available on <strong>the</strong><br />
market<br />
Available on <strong>the</strong><br />
market<br />
Sensors are available<br />
on <strong>the</strong> market, first<br />
LED – lights are on <strong>the</strong><br />
market but will be<br />
improved in <strong>the</strong> future<br />
Available on <strong>the</strong><br />
market<br />
Available on <strong>the</strong><br />
market<br />
Available on <strong>the</strong><br />
market<br />
Available on <strong>the</strong><br />
market<br />
Available on <strong>the</strong><br />
market<br />
First applications on<br />
<strong>the</strong> market (mobile<br />
phone displays),<br />
but still under<br />
development<br />
– ++ +++ m m Ultrasound washing<br />
machine is on <strong>the</strong><br />
market in Japan, but<br />
unclear if suitable for<br />
<strong>the</strong> European market,<br />
washing agents for<br />
cold washing are on<br />
<strong>the</strong> European market,<br />
but <strong>the</strong>ir future market<br />
success is still unclear<br />
IT infrastructure: data processing centres 5 ) + +++ m m Already on <strong>the</strong> market,<br />
unclear, if data<br />
processing centres will<br />
become standard for<br />
everybody<br />
2.3 street lighting (q.v. “4. Energy infrastructure
LECHTENBÖHMER REDESIGNING URBAN INFRASTRUCTURES FOR A LOW-EMISSION FUTURE<br />
Explanations:<br />
a) Order <strong>of</strong> magnitude <strong>of</strong> energy/emission reduction vs. standard (business as usual) technology; b) Market size, saving potential with regards to <strong>the</strong> respective segment; c) Investment /<br />
costs relative to standard technology; d) life cycle costs <strong>of</strong> current technology vs. standard technology at moderate real energy price increase; e) life cycle costs at status <strong>of</strong> maturity <strong>of</strong><br />
<strong>the</strong> technology vs. standard and expected date <strong>of</strong> maturity f) substitution <strong>of</strong> electricity by natural gas results in GHG emission reductions only when and until fossil generated electricity<br />
is substituted. This may not be <strong>the</strong> case in cities with almost non-fossil electritiy supply. However, it is important to note that such discussions should not be based on average carbon<br />
contents <strong>of</strong> electricity but ra<strong>the</strong>r reflect <strong>the</strong> marginal production that would be substituted.<br />
Potential relevance (savings <strong>of</strong> CO2 or energy by technology):<br />
Depth: – / 0 = net/zero savings vs. standard technology; + = small (up to 33% savings vs. standard technology); ++ = medium (33 to 66% savings); +++ = high (66 up to 100% savings)<br />
Width: + low (niche & low width technology, covers less than 33% <strong>of</strong> <strong>the</strong> segment); ++ medium (covers 33 to 66% <strong>of</strong> <strong>the</strong> segment); +++ high (covers 66 to 100% <strong>of</strong> <strong>the</strong> segment)<br />
Economic aspects<br />
k / h = life cycle costs higher than standard technology by more than 33% / 66% (macroeconomic perspective, no external costs <strong>of</strong> climate change taken into account); g = life cycle<br />
costs equivalent standard (+- 33%); m / i = life cycle costs lower than standard technology by more than 33% / 66%<br />
Sources:<br />
1) Euro-Topten. 2009; www.topten.info, Archived at http://www.webcitation.org/5rr2Aqcin on August 9 th , 2010; 2) ProCool 2007; 3) Bätig 2005; 4) E.ON 2006; 5) Centre for Energy Policy<br />
2003; 6) Energy+ Pumps 2008, www.energypluspumps.eu, Archived at http://www.webcitation.org/5rr2cCjqG on August 9 th , 2010; 7) Radgen 2002; 8) Radgen 2000; 9) Lichtnews 2009.<br />
www.lichtnews.de/wp/index.php/2009/05/durchbruch-rekord-oleds-stechen-leuchtst<strong>of</strong>frohren-aus, Archived at http://www.webcitation.org/5rr35DfMG on August 9 th , 2010; 10) Sanyo<br />
2001 and Ariel 2009: www.rolf-keppler.de/ultraschall.htm, Archived at http://www.webcitation.org/5rr3ErDti on August 9 th , 2010, and www.ariel.de/kalt-ist-heiss/index.html, Archived<br />
at http://www.webcitation.org/5rr3LSsNV on August 9 th , 2010<br />
3.2 HIGH EFFICIENCY ELECTRIC EQUIPMENT AND APPLIANCES<br />
Electricity use in equipment, appliances and machines is a major<br />
use <strong>of</strong> energy and a key source <strong>of</strong> GHG emissions. As <strong>the</strong> GHGs<br />
are not emitted at <strong>the</strong> point <strong>of</strong> use, but at <strong>the</strong> point <strong>of</strong> electricity<br />
generation, this field is directly linked to <strong>the</strong> topic <strong>of</strong> electricity<br />
supply (see table 2).<br />
There are two groups <strong>of</strong> LCTs among electric appliances. The first<br />
group consists <strong>of</strong> improved appliances, almost all <strong>of</strong> which are<br />
already available on <strong>the</strong> market. Their savings depth ranges from<br />
small to large and, as most are available at competitive prices,<br />
<strong>the</strong>y lead to reduced life cycle costs for <strong>the</strong> respective energy<br />
service. For o<strong>the</strong>r LCTs, like LED-lighting and advanced cooling<br />
technologies, <strong>the</strong>re is still some R&D or market transformation<br />
necessary. However, it is to be expected that <strong>the</strong>se efficient<br />
appliances will soon become more mainstream and that <strong>the</strong>ir<br />
costs will also equal <strong>the</strong> market average.<br />
The second group <strong>of</strong> LCTs comprises appliances that are still<br />
mainly in <strong>the</strong> research pipeline, but promise an even higher depth<br />
<strong>of</strong> efficiency gain for several applications <strong>of</strong> electric energy. They<br />
range from new lighting technologies that use organic LEDs to<br />
completely different technologies for washing and for greening IT.<br />
All <strong>of</strong> <strong>the</strong>se <strong>of</strong>fer very high electricity savings, but are still under<br />
development or have just entered <strong>the</strong> market. This leads to a still<br />
unclear picture <strong>of</strong> <strong>the</strong>ir cost, although it can be assumed that<br />
<strong>the</strong>se LCTs will be introduced at competitive investment costs in<br />
<strong>the</strong> future and will enable significant life cycle cost savings for <strong>the</strong><br />
energy services <strong>the</strong>y provide.<br />
The changes in appliances assumed here for both groups do not<br />
need significant systems transformations, except for <strong>the</strong> substitution<br />
<strong>of</strong> electricity by centrally-heated hot water or natural gas heating<br />
for washing, dish washing, cooking and drying appliances. For<br />
<strong>the</strong>se, minor adaptations <strong>of</strong> in-house installation are needed (e.g.<br />
connection to <strong>the</strong> sanitary hot water supply or to <strong>the</strong> gas grid).<br />
However, <strong>the</strong>re will be major system changes anyway (e.g. with<br />
<strong>of</strong>fice, IT and home entertainment systems) and possibly with a<br />
number <strong>of</strong> o<strong>the</strong>r appliances as well. These are taken into account<br />
here, but are simplified to <strong>the</strong> parts <strong>of</strong> those systems that will<br />
consume <strong>the</strong> bulk <strong>of</strong> energy – which will be, like today, mainly <strong>the</strong><br />
central server and user interfaces, such as monitors, printers etc.<br />
LECHTENBÖHMER | P7<br />
3.3 LOW-CARBON TRANSPORT TECHNOLOGIES<br />
In <strong>the</strong> transport sector two main LCT fields—low emission vehicle<br />
technology and transport infrastructure technology—can be seen<br />
as relevant for a low emission development.<br />
Vehicle technologies that are <strong>of</strong>ten in <strong>the</strong> focus <strong>of</strong> <strong>the</strong> debate can<br />
be grouped in:<br />
• LCTs optimising current vehicles (e.g. by weight<br />
reduction, improvements <strong>of</strong> conventional engines and<br />
energy recovery). All <strong>of</strong> <strong>the</strong>se <strong>of</strong>fer a low to medium<br />
emission reduction depth, but wide coverage. They can<br />
be complemented by increasing shares <strong>of</strong> bio fuels,<br />
which add to <strong>the</strong> depth <strong>of</strong> available GHG emission<br />
reductions. These LCTs are available or will come onto<br />
<strong>the</strong> markets over <strong>the</strong> next couple <strong>of</strong> years. They add<br />
somewhat to vehicle costs, but should be repaid by fuel<br />
savings.<br />
• The o<strong>the</strong>r group <strong>of</strong> LCTs. This implies new drive trains that<br />
are fuelled by natural gas, electricity or hydrogen. Here,<br />
deeper emission cuts seem to be possible. They, however,<br />
depend also on <strong>the</strong> level <strong>of</strong> indirect emissions <strong>of</strong> <strong>the</strong><br />
electricity or hydrogen (i.e. on <strong>the</strong> way <strong>the</strong>se secondary<br />
energy carriers are produced).<br />
While <strong>the</strong> first group <strong>of</strong> LCTs does not need significant system<br />
transformations, <strong>the</strong> switch to alternative energy carriers for<br />
transport does and significant differences remain between<br />
natural gas, electricity and hydrogen: infrastructures for<br />
natural gas already exist, those for electricity seem to be<br />
available at reasonably low efforts while <strong>the</strong> ones for<br />
hydrogen are still missing, are probably expensive and could<br />
suffer from a chicken and egg problem. From <strong>the</strong> cost side,<br />
new drive trains will probably come with higher investment—<br />
at least for <strong>the</strong> next decade. Also, <strong>the</strong>ir overall life cycle costs<br />
tend to be higher than those <strong>of</strong> standard vehicles, depending<br />
on <strong>the</strong> respective energy price development. In <strong>the</strong> long run,<br />
we estimate that alternative drive trains with natural gas or<br />
electricity will be available at costs that are comparable to<br />
those <strong>of</strong> standard cars. Hydrogen cars, on <strong>the</strong> o<strong>the</strong>r hand,<br />
might remain more expensive overall. However, highly<br />
efficient conventional drives <strong>of</strong>fer <strong>the</strong> potential <strong>of</strong> delivering<br />
even lower costs than <strong>the</strong> standard vehicle.<br />
S . A . P . I . EN . S<br />
7
Table 3: Low carbon transport technologies<br />
Technology/ System solution/<br />
supply <strong>of</strong> services<br />
3. Transportation<br />
3.1 Vehicle technology<br />
LECHTENBÖHMER REDESIGNING URBAN INFRASTRUCTURES FOR A LOW-EMISSION FUTURE<br />
Necessary system<br />
transformation<br />
Natural gas 1 Filling infrastructure<br />
necessary<br />
Improvement <strong>of</strong> efficiency<br />
combustion engine 2<br />
8 LECHTENBÖHMER | P8<br />
Potential relevance Economic aspects c) Example<br />
Depth:<br />
a)<br />
Width:<br />
b)<br />
Life cycle<br />
costs<br />
today d)<br />
Life cycle<br />
costs<br />
maturity e)<br />
+ to ++ +++ k g Several bus and<br />
car models<br />
– + to ++ ++ k m Available<br />
Biogenic fuel (biogas, bio methane) – +++ ++ k g Available<br />
Renewable hydrogen and fuel cell 3 Hydrogen grid and filling<br />
infrastructure necessary<br />
+++ +++ h k Concept cars<br />
(e.g., Daimler)<br />
Mild hybrid 4 ) – +++ +++ g g Toyota Prius<br />
Plug-in technology (complete hybrid) 4 Plug in stations necessary, with<br />
high shares: load management,<br />
possibly grid streng<strong>the</strong>ning<br />
Battery operated electric vehicles<br />
(REG power) 4<br />
Weight reduction through lightweight<br />
construction 2<br />
Plug in stations necessary, with<br />
high shares: load management,<br />
possibly grid streng<strong>the</strong>ning<br />
Adaptation <strong>of</strong> automobile<br />
production to new concepts<br />
++ to +++ ++ k g Concept cars (e.g.<br />
Chevrolet Volt)<br />
+++ ++ to +++ k g Small batch model<br />
(Tesla Roaster)<br />
++ ++ g g Available on <strong>the</strong><br />
market<br />
Downsizing <strong>of</strong> drive trains 2 – ++ ++ g g Available on <strong>the</strong><br />
market<br />
Busses with energy recovery 5 – ++ + to ++ g g Solaris Urbino 18,<br />
Hybrid busses in<br />
London<br />
Regenerative breaking <strong>of</strong> trains 6 ++ +++ g g Budapest tramway,<br />
several subway<br />
models<br />
3.2 Transportation infrastructure<br />
3.2.1 Communication, information<br />
Integration <strong>of</strong> sub-systems (intermodal) for<br />
a recording <strong>of</strong> <strong>the</strong> present traffic situation<br />
Smarter choices - (personalised<br />
travelling plans, information according<br />
to a user pr<strong>of</strong>ile) 7<br />
Forecast <strong>of</strong> “total trip costs” including travel<br />
time, level <strong>of</strong> service, user fee etc. 8<br />
Travelling time prediction<br />
(unimodal, multi-modal)<br />
3.2.2 Optimising <strong>of</strong> inter modality (see also 3.2.1)<br />
– + + g g R&D<br />
– + + g g Perth (Australia)<br />
– 0 to ++ ++ g g Mobil Check <strong>of</strong><br />
Deutsche Bahn<br />
– 0 to + 0 to + g g Pilot tests<br />
Improvement <strong>of</strong> City logistics – + ++ g g<br />
Physical intermodal interface<br />
(e.g. Parking/ Bike and Ride)<br />
Integrated (micro)payment solution<br />
for public transport, parking etc. 9<br />
– ++ + g g Available<br />
– ++ + g g Octopus smart card<br />
in Hong Kong
3.2.3 Control system<br />
Traffic management “on trip”: floating car/<br />
people/mobile data; vehicle infrastructure<br />
Interchange (bidirectional) 10 )<br />
Forecast <strong>of</strong> traffic situation and transportation<br />
demand and traffic light control according to<br />
demand 11 )<br />
3.2.4 Improved service quality <strong>of</strong> non-motorized transport<br />
Improvement <strong>of</strong> individual comfort <strong>of</strong> public<br />
transport system: assurance <strong>of</strong> connection,<br />
quality management, e-payment, e-booking,<br />
trip booking change management<br />
Optimisation <strong>of</strong> traffic flow in <strong>the</strong> public<br />
transport system: prioritisation, adaptive<br />
control 11 )<br />
Improvement <strong>of</strong> physical infrastructure <strong>of</strong> <strong>the</strong><br />
public transport system and non-motorised<br />
individual transport 12 )<br />
3.2.5 Demand side management<br />
Financial incentives for recruitment <strong>of</strong> new<br />
customers in <strong>the</strong> public transport system 13 )<br />
Fiscal instruments in <strong>the</strong> motorised individual<br />
transport system: city road charge/<br />
congestion pricing, restricted access, demand<br />
driven parking charge 14 )<br />
Avoidance <strong>of</strong> traffic through organisational<br />
measurements (e.g., e-work)<br />
LECHTENBÖHMER REDESIGNING URBAN INFRASTRUCTURES FOR A LOW-EMISSION FUTURE<br />
New communication<br />
infrastructures necessary<br />
LECHTENBÖHMER | P9<br />
+ 0 to + k g Pilot tests<br />
– 0 to + + g g Available, Munster,<br />
Germany<br />
– ++ ++ g g Available (e.g.,<br />
VerkehrsverbundRhein<br />
-Ruhr, Germany)<br />
– + + to ++ g g Prioritisation <strong>of</strong> buses<br />
in Valby (Copenhagen,<br />
Denmark)<br />
– +++ ++ gm gm Copenhagen,<br />
Groningen<br />
– + + k k Seattle: bus trips<br />
within <strong>the</strong> city centre<br />
free <strong>of</strong> charge<br />
– ++ to ++ + to ++ g g City road charging<br />
schemes in, London<br />
– + + m m Available<br />
Explanations:<br />
a) Order <strong>of</strong> magnitude <strong>of</strong> energy/emission reduction vs. standard (business as usual) technology; b) Market size, saving potential with regards to <strong>the</strong> respective segment; c) Investment /<br />
costs relative to standard technology; d) life cycle costs <strong>of</strong> current technology vs. standard technology at moderate real energy price increase; e) life cycle costs at status <strong>of</strong> maturity <strong>of</strong><br />
<strong>the</strong> technology vs. standard and expected date <strong>of</strong> maturity<br />
Potential relevance (savings <strong>of</strong> CO2 or energy by technology):<br />
Depth: – / 0 = net/zero savings vs. standard technology; + = small (up to 33% savings vs. standard technology); ++ = medium (33 to 66% savings); +++ = high (66 up to 100% savings)<br />
Width: + low (niche & low width technology, covers less than 33% <strong>of</strong> <strong>the</strong> segment); ++ medium (covers 33 to 66% <strong>of</strong> <strong>the</strong> segment); +++ high (covers 66 to 100% <strong>of</strong> <strong>the</strong> segment)<br />
Economic aspects<br />
k / h = life cycle costs higher than standard technology by more than 33% / 66% (macroeconomic perspective, no external costs <strong>of</strong> costs <strong>of</strong> climate change taken into account); g = life<br />
cycle costs equivalent standard (+- 33%); m / i = life cycle costs lower than standard technology by more than 33% / 66%<br />
Sources:<br />
1) concawe/EUCAR/JRC (2007); 2) Schallaböck et al. (2006); 3) Joest et al. (2009); 4) Wietschel/Dallinger (2008); 5) VDV (2009); 6) Siemens (n.d.). Metro-Systeme und Straßenbahnen:<br />
http://w1.siemens.com/responsibility/de/umwelt/portfolio/mobilitaet.htm, Archived at http://www.webcitation.org/5rr3x6XYK on August 9 th , 2010 ;7) Department for Transport (2004);<br />
8) ifeu (2008); 9) www.octopus.com.hk, Archived at http://www.webcitation.org/5rr4Cld2F on August 9 th , 2010; 10) Aktiv (2008); 11) Siemens (2008); 12) Fietsberaad (2006);<br />
13) http://transit.metrokc.gov/tops/bus/ridefree.html; 14) Transport for London (2008)<br />
Transport infrastructure LCTs can improve transport by<br />
avoiding congestion, by optimising <strong>the</strong> flexible use <strong>of</strong> different<br />
transport modes and by improving <strong>the</strong> service quality <strong>of</strong> public<br />
transport. All <strong>of</strong> <strong>the</strong>se technologies can be seen as important<br />
enabling technologies that can be grouped toge<strong>the</strong>r to create<br />
more sustainable low emission urban transport systems. They<br />
individually have a ra<strong>the</strong>r small or medium depth and width <strong>of</strong><br />
impact. However, apart from e-work, all <strong>of</strong> <strong>the</strong>m have positive<br />
life cycle costs that, in general, add little to <strong>the</strong> overall costs <strong>of</strong><br />
transport, but from an overall point <strong>of</strong> view can well be capable<br />
<strong>of</strong> reducing <strong>the</strong> total costs <strong>of</strong> transport systems.<br />
3.4 LOW CARBON ENERGY INFRASTRUCTURE<br />
Energy infrastructure obtains a multiple function in <strong>the</strong><br />
context <strong>of</strong> low emission, urban infrastructures. First, it<br />
must be adapted to <strong>the</strong> minimised energy flows <strong>of</strong> <strong>the</strong><br />
demand systems, such as buildings and transport. Second,<br />
it must be adapted to new, partly decentralised, renewable<br />
and low emission energy sources. Third, new energy<br />
carriers might be introduced for example in <strong>the</strong> transport<br />
sector that will need <strong>the</strong> introduction <strong>of</strong> <strong>the</strong> respective<br />
infrastructures.<br />
S . A . P . I . EN . S<br />
9
Table 4: Energy infrastructure technologies<br />
Technology/ System solution/<br />
supply <strong>of</strong> services<br />
4. Energy infrastructure<br />
4.1 Power<br />
4.1.1 Generation<br />
Combined heat and power cycle (q.v. local<br />
heat) with gas and steam plant/ steam<br />
turbine, gas turbine/ CHP unit/ stirling/<br />
steam motor/ fuel cell/ ORC<br />
a) Large/ central CHP systems (district<br />
heating and CHP unit > 2 MW)<br />
b) Small/ decentralised CHP systems<br />
(local heat and entity supply < 2 MW)<br />
c) micro CHP systems (entity supply<br />
f 10 kW)<br />
d) Industrial CHP systems (usually<br />
> 100 kW)<br />
Photovoltaics<br />
a) Grid connected PV ro<strong>of</strong> top construction<br />
Necessary system<br />
transformation<br />
Potential relevance Economic aspects c) Example<br />
Depth<br />
a)<br />
Width<br />
b)<br />
Life cycle<br />
costs<br />
today d)<br />
Life cycle<br />
costs<br />
maturity e)<br />
Expansion <strong>of</strong> heat supply grids + to +++ + to +++ k g Available<br />
Expansion <strong>of</strong> heat supply grids +++ ++ k k<br />
2010<br />
k<br />
2025<br />
Micro heat grids (can be<br />
integrated with new dev.)<br />
Integration into <strong>the</strong> grid,<br />
decentralised controls and/or<br />
virtual power plant needed<br />
++ ++ k g<br />
2020<br />
++ +++ k g<br />
2020<br />
– +++ +++ g g<br />
2010<br />
+ to ++ + to ++<br />
k g<br />
2020<br />
k g<br />
2030<br />
b) Grid connected building and entity<br />
integrated PV<br />
With high market shares:<br />
adaptation <strong>of</strong> local grids<br />
necessary, potentially<br />
decentralised storage<br />
+ to ++ + to ++<br />
c) Grid connected PV free space construction<br />
(smart grid)<br />
++ to ++ + to ++ k g<br />
4.1.2 Grids and regulations<br />
Virtual power or hybrid power<br />
plant (renewables)<br />
LECHTENBÖHMER REDESIGNING URBAN INFRASTRUCTURES FOR A LOW-EMISSION FUTURE<br />
Smart grid as enabler;<br />
introduction <strong>of</strong> ITC-Technology<br />
LECHTENBÖHMER | P11<br />
+ to ++ ++ to +++ k g<br />
2030<br />
Electronic “smart” meters Introduction <strong>of</strong> ITC-Technology 0 to + + k g<br />
2020<br />
Smart grids Smart meter; introduction <strong>of</strong> ITC-<br />
Technology; load management;<br />
energy storage<br />
+ to ++ + to ++ k g<br />
2030<br />
More efficient distribution transformers – ++ to +++ + to ++ m m<br />
2020<br />
Gas insulated lines (GIL): – ++ 0 to + h h –<br />
Supra conductive cables (HTSC) Cooling necessary;<br />
grid adaptation<br />
Vehicle to <strong>the</strong> grid (V2G) utilisation <strong>of</strong><br />
vehicle batteries for balancing power &<br />
RE-integration<br />
Power storage technologies for balancing<br />
power & RE-integration<br />
Loading stations<br />
and smart grid<br />
4.2 O<strong>the</strong>r energy infrastructure (Heat see table 1)<br />
Natural gas fuel filling infrastructure Filling stations<br />
(biogas feed-in)<br />
Natural gas decompression turbine<br />
(for <strong>the</strong> transition <strong>of</strong> natural gas high<br />
pressure grids to low pressure grids)<br />
Biogas feed-in/ import from<br />
surrounding areas<br />
++ to +++ + k k –<br />
0 to ++ + to ++ k k<br />
2050<br />
(Smart grid) + + to ++ k k<br />
2040<br />
0 to + + k g<br />
2020<br />
– ++ + m m<br />
2015<br />
Biogas conditioning, adaptation<br />
<strong>of</strong> gas network operation (rules)<br />
Hydrogen supply infrastructure Development <strong>of</strong> hydrogen<br />
consumers (to be synchronised<br />
with supply infrastructure)<br />
HVDC transmission line for RES imports Adaptation <strong>of</strong> supranational<br />
and national electricity grids<br />
+ to +++ + k k<br />
2020<br />
0 to ++ + to ++ k k<br />
2040<br />
0 to + + g g<br />
2030<br />
Pilot projects; see 7<br />
Market Introduction;<br />
see 8/9<br />
Pilot projects; see 10<br />
Available; see 11<br />
Available; e.g.<br />
PALEXPO Genf 12<br />
Pilot projects<br />
Concepts available;<br />
R&D needed; see 13<br />
Available; R&D needed<br />
Available; >800<br />
stations in Germany; 14<br />
Available 15<br />
Available / pilot<br />
projects<br />
Available / pilot<br />
projects<br />
HVDC lines available<br />
(RE import conceptual)<br />
Explanations:<br />
a) Order <strong>of</strong> magnitude <strong>of</strong> energy/emission reduction vs. standard (business as usual) technology; b) Market size, saving potential with regards to <strong>the</strong> respective segment; c) Investment /<br />
costs relative to standard technology; d) life cycle costs <strong>of</strong> current technology vs. standard technology at moderate real energy price increase; e) life cycle costs at status <strong>of</strong> maturity <strong>of</strong><br />
<strong>the</strong> technology vs. standard and expected date <strong>of</strong> maturity<br />
Potential relevance (savings <strong>of</strong> CO2 or energy by technology):<br />
Depth: – / 0 = net/zero savings vs. standard technology; + = small (up to 33% savings vs. standard technology); ++ = medium (33 to 66% savings); +++ = high (66 up to 100% savings)<br />
Width: + low (niche & low width technology, covers less than 33% <strong>of</strong> <strong>the</strong> segment); ++ medium (covers 33 to 66% <strong>of</strong> <strong>the</strong> segment); +++ high (covers 66 to 100% <strong>of</strong> <strong>the</strong> segment)<br />
Economic aspects<br />
k / h = life cycle costs higher than standard technology by more than 33% / 66% (macroeconomic perspective, no external costs <strong>of</strong> costs <strong>of</strong> climate change taken into account); g = life<br />
cycle costs equivalent standard (+- 33%); m / i = life cycle costs lower than standard technology by more than 33% / 66%<br />
Abbreviations: ITC= Information- & Telecommunication;<br />
Sources:<br />
Source for determining date <strong>of</strong> economic maturity for renewable energy technologies (PV, biogas, geo<strong>the</strong>rmal, wind): BMU 2008 / own estimates.<br />
1) www.stromerzeugende-heizung.de/download/geraeteuebersicht.<strong>pdf</strong>, Archived at http://www.webcitation.org/5rr4mDyPK on August 9 th , 2010 2) BSW (2009). Daten und Infos zur<br />
deutschen Solarbranche, www.solarwirtschaft.de, Archived at http://www.webcitation.org/5rr4uZdOa on August 9 th , 2010; 3) Solarserver (2007). Building integrated Photovoltaics (BIPV):<br />
Solar electric power systems conquer large ro<strong>of</strong>s and façades; www.solarserver.de/solarmagazin/solar-report_0607_e.html, Archived at http://www.webcitation.org/5rr5VBIMb on<br />
August 9 th , 2010 4) Solarserver (2008). Solarstrom: Juwi baut weltgrößtes PV-Kraftwerk mit 40 Megawatt Leistung, http://www.solarserver.de/news/news-6485.html, Archived at<br />
http://www.webcitation.org/5rr5et4SA on August 9 th , 2010 5a) BINE 2009 5b) BINE 2009 6) www.wind-energie.de/de/<strong>the</strong>men/kleinwindanlagen, Archived at http://www.webcitation.<br />
org/5rr5jQxLe on August 9 th , 2010 7) BMWI 2009, E-Energy Modellregionen; http://www.e-energie.info/, Archived at http://www.webcitation.org/5rr5pu63B on August 9 th , 2010; 8) RWE;<br />
9): EnBW (n.d) EnBW starts mass production <strong>of</strong> intelligent electricity meters; http://www.metering.com/node/13704, Archived at http://www.webcitation.org/5rr5uixuk on August 9 th ,<br />
2010; 10) BMWI 2009, E-Energy: “Smart Grids - Made in Germany”; http://www.e-energie.info/, Archived at http://www.webcitation.org/5rr673PhL on August 9 th , 2010; 11) SEEDT (n.d.):<br />
Project Summary ; http://seedt.ntua.gr, Archived at http://www.webcitation.org/5rr6BZwtF on August 9 th , 2010; 12) Siemens/Poehler (2002). Gasisolierte Übertragungsleitungen (GIL)<br />
für unterirdischen Energietransport; www.life-needs-power.de/2002/, Archived at http://www.webcitation.org/5rr6GWJro on August 9 th , 2010; 13) UDEL (2009). Vehicle to Grid<br />
Technology - University <strong>of</strong> Delaware http://www.udel.edu/V2G/, Archived at http://www.webcitation.org/5rr6M0Vu8 on August 9 th , 2010; 14) www.erdgasfahrzeuge.de, Archived at<br />
http://www.webcitation.org/5rr6PP6ks on August 9 th , 2010 15) www.rmg.com/produkte/turboexpander.html, Archived at http://www.webcitation.org/5rr6ntMV5 on 9 th , 2010<br />
S . A . P . I . EN . S<br />
11
Thousand<br />
tons<br />
<strong>of</strong> CO2<br />
8,000<br />
7,000<br />
6,000<br />
5,000<br />
4,000<br />
3,000<br />
2,000<br />
1,000<br />
3,719<br />
1,005<br />
229<br />
3,220<br />
0<br />
Reference<br />
(2008)<br />
A<br />
+279<br />
B C D E F G H I J K L<br />
-3,248<br />
LECHTENBÖHMER REDESIGNING URBAN INFRASTRUCTURES FOR A LOW-EMISSION FUTURE<br />
This is most pronounced for <strong>the</strong> power infrastructure. Here <strong>the</strong>re<br />
are a number <strong>of</strong> new urban power sources, which range from<br />
diverse CHP technologies to several renewable electricity<br />
generation options. Toge<strong>the</strong>r with <strong>the</strong> changes on <strong>the</strong> demand<br />
side, <strong>the</strong> grid must be adapted to become “smart” to be able to<br />
much better balance diverse, and possibly bidirectional, flows <strong>of</strong><br />
electric energy in <strong>the</strong> grid.<br />
Central public and industrial CHP systems still <strong>of</strong>fer large<br />
opportunities for GHG emission mitigation in urban areas. This is<br />
amended by decentralised small and micro CHP systems. Apart<br />
from <strong>the</strong> efficiency gains that <strong>the</strong> combined electricity and heat<br />
generation <strong>of</strong>fers, <strong>the</strong>se systems provide <strong>the</strong> option to ease a<br />
conversion to a renewable energy supply at a later point in time<br />
as <strong>the</strong>y can be converted to biomass firing much more easily than<br />
to single heating systems. However, this strategy may be limited<br />
by <strong>the</strong> availability <strong>of</strong> sustainable biomasses for energetic use.<br />
Detrimental to most CHP solutions is <strong>the</strong>ir necessity to develop or<br />
expand heat grids, which are <strong>of</strong>ten quite investment-intensive.<br />
Overall, this leads to a tendency to increase costs when CHP<br />
technologies are used. However, this depends heavily on future<br />
price developments and local situations.<br />
Several technologies for renewable electricity generation add<br />
to <strong>the</strong> LCT options for energy infrastructures. In urban<br />
contexts, <strong>the</strong>se are mainly photovoltaic systems plus —<br />
depending on local potential— small hydro and wind power, as<br />
well as <strong>the</strong> use <strong>of</strong> biomass (in CHP plants) and geo<strong>the</strong>rmal<br />
energy, if available. In industrialised metropolises that have<br />
existing supply structures, <strong>the</strong>se renewable generation<br />
technologies are typically characterised by higher investments<br />
than standard technologies. These greater investments will not<br />
always be fully recovered by fur<strong>the</strong>r, significant cost reductions<br />
for <strong>the</strong>se technologies. Again, this can lead to increasing life<br />
cycle costs for electricity generation, depending on future fossil<br />
energy prices.<br />
CO 2 emissions reduction - “Target” scenario<br />
-300<br />
Heating<br />
Fuel (passenger traffic)<br />
Fuel (commercial traffic)<br />
Power generation<br />
Heating<br />
-45 +67 -458<br />
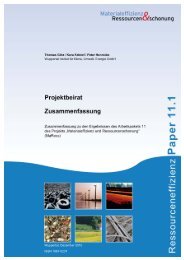
Figure 1: Key strategies for carbon emission reduction in Munich, 2058, Target Scenario<br />
Source: Lechtenböhmer et al. (2009a)<br />
-397<br />
-4<br />
+165 -524<br />
-1,556<br />
-1,145<br />
- 88%<br />
406<br />
330<br />
111<br />
160<br />
Transport fuels Electricity Target<br />
(2058)<br />
12 LECHTENBÖHMER | P12<br />
LCT solutions to modify <strong>the</strong> electricity grid, like a “smart grid” and<br />
decentralised electricity storage technologies, are important here<br />
again as enabling technologies for changes in supply and<br />
demand, but with limited reduction potential in <strong>the</strong>mselves. O<strong>the</strong>r<br />
technologies, like superconductive grids and gas insulated lines<br />
or improved transformers, reduce losses in <strong>the</strong> system, but will<br />
pay <strong>of</strong>f only if energy costs increase substantially.<br />
O<strong>the</strong>r potential energy infrastructures will be needed to convert<br />
urban infrastructures, such as expanding <strong>the</strong> already available<br />
natural gas filling stations and/or developing a hydrogen supply<br />
and filling infrastructure, which is still in <strong>the</strong> R&D phase. At a<br />
more supra-urban level, <strong>the</strong> development <strong>of</strong> biomethane feed-in<br />
structures to introduce biogenic gases into <strong>the</strong> natural gas grids<br />
and <strong>the</strong> development <strong>of</strong> HVDC electricity transport grids will<br />
enable <strong>the</strong> long distance transport <strong>of</strong> energy from distant<br />
renewable sources. These technologies are available and have<br />
been realised in pilot projects.<br />
4. REVIEW: COMBINING LCTS FOR A VERY<br />
LOW CO2 EMISSION SCENARIO<br />
The LCTs presented above sketch <strong>the</strong> range <strong>of</strong> technical options<br />
to restructure urban infrastructures for very low-carbon<br />
futures. However, <strong>the</strong>y must be combined into a complete<br />
picture in order to deliver a sort <strong>of</strong> blueprint for low-carbon<br />
cities <strong>of</strong> <strong>the</strong> future.<br />
In <strong>the</strong> following, we review <strong>the</strong> scenario analysis “Munich<br />
2058 paths toward a carbon-free future” that has been<br />
provided by Lechtenböhmer et al. (2009a,b). In our study we<br />
used results <strong>of</strong> <strong>the</strong> technology survey described above to<br />
conduct a scenario analysis for <strong>the</strong> city <strong>of</strong> Munich. The case<br />
study for Munich covers <strong>the</strong> 50-year period from 2008 to<br />
2058 and combines <strong>the</strong> technologies by accounting for <strong>the</strong>ir<br />
systemic interactions. 3<br />
3 In <strong>the</strong> example for Munich only CO2 emissions have been taken into account. They are estimated to stand for more than 95% <strong>of</strong> Munich’s GHG emissions.<br />
A<br />
B<br />
C<br />
D<br />
E<br />
F<br />
G<br />
H<br />
I<br />
J<br />
K<br />
L<br />
Additional heating demands<br />
due to population growth<br />
Thermal insulation and heating<br />
efficiency<br />
Renewable energies for heating<br />
Efficiency in heating through<br />
use <strong>of</strong> CHP<br />
Increased traffic due to population<br />
growth<br />
Traffic reduction & shifting to mor<br />
environm. friendly traffic patterns<br />
Increased efficiency and<br />
electrification <strong>of</strong> vehicles<br />
Bi<strong>of</strong>uels<br />
Additional electricity consumption<br />
as a result <strong>of</strong> population growth<br />
Power generation from CHP<br />
(including renewable CHP)<br />
Additional renewable electricity<br />
generation<br />
Electricity savings through<br />
efficiency measures
LECHTENBÖHMER REDESIGNING URBAN INFRASTRUCTURES FOR A LOW-EMISSION FUTURE<br />
Basically, Lechtenböhmer et al. applied a detailed bottom-up<br />
simulation approach. This approach first describes <strong>the</strong> current<br />
energy service demand for <strong>the</strong> main groups <strong>of</strong> appliances and<br />
sectors such as: heating <strong>of</strong> flats (by age); warm water generation;<br />
use <strong>of</strong> electricity in households, <strong>of</strong>fices, or industry; transport by<br />
mode; and <strong>the</strong> supply side, mainly by power plant type; and <strong>the</strong><br />
resulting total energy use and CO2 emissions. Based on <strong>the</strong> status<br />
quo potential, savings over time in every field <strong>of</strong> energy use have<br />
been estimated. For this calculation, we used <strong>the</strong> technologies<br />
and <strong>the</strong>ir characteristics as given in Tables 1 to 4 and developed a<br />
new consistent energy system description for 2058.<br />
Figure 1 provides an analysis <strong>of</strong> <strong>the</strong> scenario results and<br />
aggregates <strong>the</strong> CO2 reductions to <strong>the</strong> core sectors and to seven<br />
core strategies. In total, <strong>the</strong> combination <strong>of</strong> <strong>the</strong>se strategies that<br />
comprise <strong>the</strong> LCTs discussed above could reduce CO2 emissions<br />
by about 7.5 million tons according to <strong>the</strong> analysis by<br />
Lechtenböhmer et al. (2009a). They would reduce current CO2<br />
emissions by <strong>the</strong> City <strong>of</strong> Munich from <strong>the</strong> current level <strong>of</strong> 8 million<br />
tons (plus 0.5 million added for population growth) to about<br />
1 million in 2058.<br />
The most promising strategies for reducing emissions have been<br />
combined by Lechtenböhmer et al. (2009a) into <strong>the</strong> Target<br />
Scenario. These consist <strong>of</strong> better insulation in buildings, more<br />
efficient heating and power cogeneration systems, energyefficient<br />
appliances and lighting systems, and power generation<br />
from renewable resources and low-carbon power plants. In <strong>the</strong><br />
following, we discuss <strong>the</strong> main strategic elements highlighted by<br />
Lechtenböhmer et al. (2009a) and assign <strong>the</strong> different groups <strong>of</strong><br />
LCTs discussed above to <strong>the</strong> respective strategic elements.<br />
Certain parts <strong>of</strong> a city’s infrastructure can be clearly identified<br />
as major producers <strong>of</strong> GHG emissions. Applying efficiency<br />
measures and LCTs to those areas is particularly effective. In<br />
Munich, as <strong>the</strong> analysis by Lechtenböhmer et al. (2009a) given<br />
in Figure 1 shows, <strong>the</strong>re is particularly high potential for CO2<br />
emission savings in heating and electricity.<br />
• The main lever for a fossil carbon-free heat demand and<br />
supply, and also <strong>the</strong> largest lever in general, is <strong>the</strong><br />
<strong>the</strong>rmal improvement <strong>of</strong> residential and o<strong>the</strong>r buildings.<br />
By a rapid introduction <strong>of</strong> <strong>the</strong> currently most ambitious<br />
passive house standard for all new buildings and also for<br />
every renovation <strong>of</strong> existing buildings (see <strong>the</strong> LCTs given<br />
in Table 1.1, which are supported by <strong>the</strong> LCTs in Table 1.2),<br />
energy use for this segment can be reduced by 80% by<br />
2058. To achieve this, virtually all buildings should be<br />
renovated over <strong>the</strong> 50 years to come. This target is<br />
technically feasible 4 , but a major economic and social<br />
challenge. Implementing less ambitious standards would<br />
mean that buildings with <strong>the</strong>se standards would not<br />
become fossil carbon-free by 2058 and, thus, delay<br />
attainment <strong>of</strong> <strong>the</strong> targets to a point in time when <strong>the</strong>y will<br />
LECHTENBÖHMER | P13<br />
be refurbished again. The strategy, however, imposes an<br />
economic threat to <strong>the</strong> district heating (DH) system by<br />
massively reducing <strong>the</strong> amount <strong>of</strong> heat demand per<br />
building. The technologies given in Table 1.3 for future<br />
central and decentralised DH systems must be fur<strong>the</strong>r<br />
developed before <strong>the</strong>y will be economically feasible.<br />
However, <strong>the</strong> study assumes that this will be solved<br />
successfully and that CHP technologies will be able to<br />
supply 60% <strong>of</strong> <strong>the</strong> heat requirement and a third <strong>of</strong> <strong>the</strong><br />
electricity demand in <strong>the</strong> Target Scenario.<br />
• Additionally, renewable heat supply will be introduced by<br />
geo<strong>the</strong>rmal district heating, biomass-based decentralized<br />
CHP plants and solar <strong>the</strong>rmal appliances (see Tables 4.1.1<br />
and 4.2).<br />
Fossil carbon-free electricity can be achieved by two strategies:<br />
• The first strategy involves <strong>the</strong> highly efficient use <strong>of</strong><br />
electricity by using already existing high-efficiency<br />
appliances, as given in Table 3.1 and, in <strong>the</strong> long run,<br />
applying also those LCTs given in Table 3.2. This would<br />
reduce per capita residential and <strong>of</strong>fice electricity<br />
consumption by almost 40%.<br />
• The second strategy consists <strong>of</strong> producing additional<br />
renewable electricity that will be produced locally in <strong>the</strong><br />
CHP plants, as well as from water power, and by<br />
photovoltaic systems. The latter could reach a power output<br />
<strong>of</strong> 400 MW peak by 2058 by using about 40% <strong>of</strong> <strong>the</strong> existing<br />
potential space for <strong>the</strong> installation <strong>of</strong> modules (see LCTs<br />
under 4.1.1). About 40% <strong>of</strong> <strong>the</strong> electricity in <strong>the</strong> Target<br />
Scenario will, however, be imported from <strong>of</strong>f-shore wind<br />
and solar <strong>the</strong>rmal power plants 5 .<br />
The core strategies <strong>of</strong> <strong>the</strong> Scenario towards a fossil carbon-free<br />
transport are:<br />
• First, to gradually change mobility patterns. Here <strong>the</strong><br />
enabling LCTs given in Table 3.2 are applied to modify<br />
spatial structures, to increase <strong>the</strong> service quality <strong>of</strong> public<br />
transport, to enable a better combination <strong>of</strong> transport<br />
modes and to improve <strong>the</strong> regulation <strong>of</strong> individual transport<br />
vehicles. In addition, <strong>the</strong> average transport distances could<br />
be slightly reduced and <strong>the</strong> share <strong>of</strong> public transport,<br />
walking and biking could be increased.<br />
• Second, to adopt <strong>the</strong> use <strong>of</strong> more efficient vehicles and<br />
effect a shift in urban transport towards electric vehicles<br />
that contribute to significant energy savings and,<br />
indirectly, to an increased share <strong>of</strong> bi<strong>of</strong>uels and renewable<br />
electricity in <strong>the</strong> transport fuel mix. These changes can be<br />
achieved by using <strong>the</strong> LCTs given in Table 3.1. As <strong>the</strong><br />
lifetime <strong>of</strong> vehicles is limited, several generations will be<br />
seen on <strong>the</strong> roads until 2058. Thus, Table 3.1 contains also<br />
“bridge technologies” for intermediate timeframes. For<br />
2058, <strong>the</strong> Target Scenario assumes that about 80% <strong>of</strong><br />
motorized inner city individual mobility will be covered by<br />
4 As given in table 1.1 <strong>the</strong>re are sufficient examples <strong>of</strong> building renovations which achieved almost Passive House standards – which would mean savings <strong>of</strong> typically around 90% vs.<br />
current energy consumption. As <strong>the</strong>se standards cannot achieved with every single building because <strong>of</strong> e.g. historical facades or partly insufficient solar access in <strong>the</strong> older, denser<br />
parts <strong>of</strong> <strong>the</strong> city an average <strong>of</strong> 80% savings has been used here.<br />
5 These have not been described in detail here as <strong>the</strong>y are not specifically “urban” technologies. However, this strategy has already been introduced by <strong>the</strong> municipal utility. About 40%<br />
<strong>of</strong> <strong>the</strong> wind capacity envisaged for 2058 will be on <strong>the</strong> grid in <strong>the</strong> German North Sea as early 2013 and a board decision has been made to buy a share <strong>of</strong> a projected solar <strong>the</strong>rmal power<br />
plant in sou<strong>the</strong>rn Spain. Electricity generated abroad will <strong>of</strong> course not physically be consumed in <strong>the</strong> city <strong>of</strong> Munich. Therefore it is necessary not only to invest into renewable generation<br />
facilities but also to purchase <strong>the</strong> respective electricity e.g. by green certificates (as introduced by <strong>the</strong> European Renewable Energy Directive) or comparable instruments. Fur<strong>the</strong>r, also<br />
for <strong>the</strong> electricity generated within <strong>the</strong> city and <strong>the</strong> region, double counting has to be avoided by appropriate mechanisms.<br />
S . A . P . I . EN . S<br />
13
LECHTENBÖHMER REDESIGNING URBAN INFRASTRUCTURES FOR A LOW-EMISSION FUTURE<br />
electric vehicles. These will be ei<strong>the</strong>r specific, small<br />
vehicles used for short distances or plug-in hybrids. The<br />
hybrids will operate for <strong>the</strong> shorter distances on electricity<br />
and outside <strong>the</strong> city on fuels. The remaining vehicles will<br />
be particularly light in weight and driven by highly efficient<br />
combustion engines.<br />
Tables 1 to 4 give a qualitative impression that energy-saving<br />
measures can largely be economically viable. On <strong>the</strong> demand<br />
side (Tables 1.1, 1.2 and 2), all LCTs that are quoted are<br />
expected to deliver comparable or lower life cycle costs than<br />
standard technologies. Most <strong>of</strong> <strong>the</strong>m are already mature or<br />
will become so during <strong>the</strong> next five to ten years. However, <strong>the</strong><br />
picture is less clear for <strong>the</strong> supply infrastructures. Here,<br />
renewable technologies and CHP-district heating systems<br />
will lead to increased investments versus current fossil<br />
systems. The increased investments may not fully be<br />
recovered by savings in fuel costs. However, <strong>the</strong>se<br />
technologies are needed to achieve overall CO2-savings <strong>of</strong><br />
80% and more. In combi-nation with <strong>the</strong> savings achieved by<br />
<strong>the</strong> demand side efficiency, <strong>the</strong> overall economic balance may<br />
still remain positive – regardless fur<strong>the</strong>r savings <strong>of</strong> external<br />
and CO2-costs.<br />
This can be shown in our case study <strong>of</strong> Munich. A new quarter<br />
will be developed from an existing quarter with ten thousand<br />
inhabitants and new developments for almost ano<strong>the</strong>r twenty<br />
thousand. The whole quarter should be developed or renovated<br />
according to <strong>the</strong> passive house standard 6 . More than 75% <strong>of</strong> its<br />
heat will be supplied by a geo<strong>the</strong>rmal plant and a local district<br />
heating grid. Overall, without even taking carbon or o<strong>the</strong>r<br />
external costs into account, this system has been estimated to<br />
have lower life cycle costs compared to a conventional quarter<br />
with less ambitious energy standards and much cheaper<br />
conventional heating systems (Lechtenböhmer et al. 2009a).<br />
The total additional investment needed to redesign all<br />
residential buildings <strong>of</strong> a city like Munich was estimated at<br />
€13 billion (Lechtenböhmer et al. 2009 a,b). This estimate<br />
includes refurbishing virtually all older buildings (about<br />
34 million square metres) by 2058. The average additional<br />
refurbishment costs are estimated to be 310 euros per square<br />
metre, based on <strong>the</strong> results <strong>of</strong> a number <strong>of</strong> case studies<br />
documented by IWU (2007). New homes (about 14 million<br />
square metres) will be constructed according to <strong>the</strong> efficient<br />
passive house standard. The estimated additional costs at <strong>the</strong><br />
current state <strong>of</strong> <strong>the</strong> art are about 140 euros per square metre<br />
(Lechtenböhmer et al. 2009 a,b). That comes out to roughly<br />
200 euros annually per Munich resident—about one third <strong>of</strong><br />
an annual natural gas bill. However, <strong>the</strong>se additional<br />
investments will be <strong>of</strong>fset over <strong>the</strong>ir lifetimes by rising annual<br />
energy savings, which, it is estimated, will reach between<br />
€1.6 billion and €2.6 billion in <strong>the</strong> year 2058. That would<br />
equal annual savings <strong>of</strong> between €1,200 and €2,000 per<br />
capita, meaning energy savings <strong>of</strong> more than €30 billion over<br />
<strong>the</strong> course <strong>of</strong> 50 years (Lechtenböhmer et al. 2009 a,b).<br />
14 LECHTENBÖHMER | P14<br />
5. CONCLUSION<br />
To achieve <strong>the</strong> ambitious GHG emission reduction goals globally<br />
needed to contain global warming below 2°C, a transition <strong>of</strong> our<br />
cities’ infrastructures towards sustainable low-carbon<br />
infrastructures is clearly needed.<br />
This survey presents an overview <strong>of</strong> a significant number <strong>of</strong> lowcarbon<br />
technologies (LCTs) in <strong>the</strong> relevant urban infrastructure<br />
fields <strong>of</strong> buildings, electricity use, transport and energy supply.<br />
What can be seen from this collection is that numerous<br />
technologies to achieve low emission infrastructures are<br />
already available on <strong>the</strong> market or are pilot applications. The<br />
remaining are technologies that are well advanced in R&D and<br />
may be available soon. Many <strong>of</strong> <strong>the</strong>se technologies are linked to<br />
higher up-front investments than required for standard<br />
solutions. However, increasing market shares and fur<strong>the</strong>r R&D<br />
will reduce substantially <strong>the</strong> investments for many<br />
technologies. Depending on future energy prices, most <strong>of</strong> <strong>the</strong>m<br />
will become cost-efficient in <strong>the</strong> long run or even help to<br />
mitigate fur<strong>the</strong>r cost increases <strong>of</strong> <strong>the</strong> energy system due to<br />
price increases <strong>of</strong> fossil fuels.<br />
Fur<strong>the</strong>r, we reviewed <strong>the</strong> results <strong>of</strong> a scenario analysis that<br />
combined <strong>the</strong> surveyed technologies in an integrated scenario<br />
for <strong>the</strong> very-low-carbon city <strong>of</strong> Munich in 2058. The results <strong>of</strong> that<br />
study demonstrate that large-scale climate protection for a large<br />
city with a service-oriented economy would be feasible by using<br />
technologies that are already available or are in advanced R&D,<br />
and that it could even be economical as fundamental<br />
improvements to buildings and energy systems can save energy<br />
costs. Additionally, <strong>the</strong> investment in LCT strategies may also<br />
provide strong economic stimuli to <strong>the</strong> local economies.<br />
Based on our survey and <strong>the</strong> results from <strong>the</strong> scenario analysis,<br />
we can identify three key strategies for <strong>the</strong> redesign <strong>of</strong> existing<br />
urban infrastructures:<br />
• The first is to become highly efficient in all sectors <strong>of</strong><br />
demand (households, service sector, industry, if relevant,<br />
and transport); i.e. to achieve <strong>the</strong> same level <strong>of</strong><br />
convenience and utility through significantly less energy<br />
consumption. The most effective measures to achieve<br />
high efficiency are:<br />
– The renovation <strong>of</strong> almost all buildings to <strong>the</strong> passive<br />
house standard. This can be done by using already<br />
available technologies plus innovative technologies.<br />
– A rapid increase in <strong>the</strong> market share <strong>of</strong> electric<br />
appliances with <strong>the</strong> best available standards to 100%.<br />
– In <strong>the</strong> transport sector, public and non-motorised<br />
transport should be improved to achieve higher<br />
shares <strong>of</strong> environmentally friendly modes and—on a<br />
longer time scale—conventional cars should be<br />
replaced by fully electric and plug-in hybrid cars.<br />
• The second is to adapt <strong>the</strong>ir heating, electrical, and<br />
transport infrastructures to accommodate a demand that<br />
has been substantially reduced through greater efficiency<br />
6 As proposed in <strong>the</strong> study reported here. However, in spite <strong>of</strong> high environmental standards planned, it is not yet clear whe<strong>the</strong>r <strong>the</strong> realisation will fully meet <strong>the</strong> proposals <strong>of</strong> <strong>the</strong> study.
LECHTENBÖHMER REDESIGNING URBAN INFRASTRUCTURES FOR A LOW-EMISSION FUTURE<br />
and to support this demand reduction by appropriate<br />
infrastructure solutions. The most important strategies to<br />
adapt <strong>the</strong> energy and transport infrastructures are:<br />
– A significant expansion <strong>of</strong> <strong>the</strong> existing district heat<br />
grid with CHP technologies and <strong>the</strong> development <strong>of</strong><br />
small local heat grids fed by renewable energies<br />
supported by innovative heat storage. New technical<br />
solutions for <strong>the</strong> central system, in particular, must<br />
still be developed in order to cope economically with<br />
<strong>the</strong> significantly reduced heat demand.<br />
– A “smart” electricity grid that is capable <strong>of</strong> integrating<br />
multiple decentralised generation and is linked to a<br />
supranational high voltage DC grid.<br />
– An improved public transport grid, combined with<br />
modified street infrastructures that support more<br />
cycling and walking plus settlement structures that<br />
promote short distances.<br />
• The third is to convert <strong>the</strong> cities’ energy bases to renewable<br />
and low-carbon energy sources by:<br />
– A strong exploitation <strong>of</strong> local renewable heat and<br />
electricity sources from biomass CHP, geo<strong>the</strong>rmal<br />
and photovoltaic electricity generation.<br />
– The replacement <strong>of</strong> conventional electricity supply by<br />
renewable electricity from local sources and<br />
particularly from remote on- and <strong>of</strong>f-shore wind<br />
power plants and concentrated solar power plants.<br />
Overall, we can conclude that rigorously concentrating on <strong>the</strong><br />
goal <strong>of</strong> a carbon-free environment can completely alter a<br />
large city’s buildings and infrastructure, <strong>the</strong>reby <strong>of</strong>fering <strong>the</strong><br />
metropolis, its businesses, citizens, and research institutes a<br />
valuable head start on <strong>the</strong> future. After all, <strong>the</strong> entire world<br />
will soon have to become a low-carbon society. In addition,<br />
such advances will help ensure that cities remain liveable in<br />
<strong>the</strong> future.<br />
ACKNOWLEDGEMENTS<br />
The authors would like to thank Siemens AG and particularly<br />
Stefan Denig and Daniel Müller for commissioning <strong>the</strong> underlying<br />
study and for contributing valuable input to <strong>the</strong> technology matrix<br />
discussed here. We also thank our colleagues Susane Böhler,<br />
Rüdiger H<strong>of</strong>mann, Kora Krist<strong>of</strong> and Frederik Rudolph who are coauthors<br />
<strong>of</strong> <strong>the</strong> underlying study. We are grateful to George<br />
Robinson for his assistance in editing <strong>the</strong> English as well as to<br />
Gaell Mainguy for his great editorial support.<br />
REFERENCES<br />
Aktiv (2008). Activating high-performance networks.<br />
http://www.aktiv-online.org/deutsch/Downloads/Broschueren/<br />
Aktiv%20VM-e.<strong>pdf</strong><br />
Bätig, I (2005). Die Warmwascher: Waschmaschinen und<br />
Geschirrspüler mit Warmwasseranschluss sparen Energie und<br />
Kosten, Artikel in faktor, 2/05<br />
LECHTENBÖHMER | P15<br />
BINE (2003). Aquiferspeicher für das Reichstagsgebäude. BINE<br />
Informationsdienst FIZ Karlsruhe - Büro Bonn. BINE-Projekt-<br />
Info 13/03,<br />
www.bine.info/hauptnavigation/publikationen/projektinfos/publi<br />
kation/aquiferspeicher-fuer-das-reichstagsgebaeude<br />
BINE (2007). Aquifer speichert Überschusswärme aus<br />
Heizkraftwerk. BINE Informationsdienst FIZ Karlsruhe - Büro<br />
Bonn. BINE-Projekt-Info 04/07,<br />
www.bine.info/hauptnavigation/publikationen/projektinfos/publika<br />
tion/aquifer-speichert-ueberschusswaerme-aus-heiz-kraftwerk<br />
BINE (2009a). Geo<strong>the</strong>rmal electricity generation in Soultz-sous-<br />
Forêts. BINE Informationsdienst FIZ Karlsruhe - Büro Bonn.<br />
BINE-Projekt-Info 04/09<br />
www.bine.info/en/hauptnavigation/publications/projektinfos/pub<br />
likation/geo<strong>the</strong>rmische-stromerzeugung-in-soultz-sous-forets/<br />
?artikel=1314<br />
BINE (2009b). Geo<strong>the</strong>rmal electricity generation combined with a<br />
heating network. BINE Informationsdienst FIZ Karlsruhe - Büro<br />
Bonn. BINE-Projekt-Info 10/09.<br />
www.bine.info/en/hauptnavigation/publications/publikation/geot<br />
hermische-stromerzeugung-im-verbund-mit-waermenetz/<br />
?artikel=1419<br />
BMU (2008). Lead study 2008 - Fur<strong>the</strong>r development <strong>of</strong> <strong>the</strong><br />
‘Strategy to increase <strong>the</strong> use <strong>of</strong> renewable energies within <strong>the</strong><br />
context <strong>of</strong> <strong>the</strong> current climate protection goals <strong>of</strong> Germany and<br />
Europe. Study commissioned by <strong>the</strong> German Federal Ministry for<br />
<strong>the</strong> Environment, Nature Conservation and Nuclear Safety (BMU),<br />
www.bmu.de/english/renewable_energy/downloads/doc/427<br />
26.php<br />
Centre for Energy Policy (2003). Centre for Energy Policy and<br />
Economics, Swiss Federal Institutes <strong>of</strong> Technology (Cepe),<br />
Fraunh<strong>of</strong>er Institut für Systemtechnik und Innovationsforschung<br />
(FhG-ISI) (2003, Der Einfluss moderner Gerätegenerationen der<br />
Informations- und Kommunikationstechnik auf den Energieverbrauch<br />
in Deutschland bis zum Jahr 2010 - Möglichkeiten zur<br />
Erhöhung der Energieeffizienz und zur Energieeinsparung in<br />
diesen Bereichen, Abschlussbereicht an das BMWA<br />
Concawe/EUCAR/JRC (2007). WTT-Report, Appendix 2: Description<br />
and Detailed Energy and GHG Balance <strong>of</strong> Individual<br />
Pathways. http://ies.jrc.cec.eu.int/wtw.html<br />
Department for Transport (2004). Smarter Choices – Changing<br />
<strong>the</strong> Way We Travel. Final report <strong>of</strong> <strong>the</strong> research project: ‘The<br />
influence <strong>of</strong> s<strong>of</strong>t factor interventions on travel demand’,<br />
http://www.dft.gov.uk/pgr/sustainable/smarterchoices/ctwwt/<br />
ter5personalisedtravelpl5767.<strong>pdf</strong><br />
Dröge, P. (2010). 100% Renewable Energy – and Beyond – for<br />
Cities. Written for <strong>the</strong> World Future Council and HafenCity<br />
University, Hamburg Commission on Cities and Climate Change<br />
S . A . P . I . EN . S<br />
15
LECHTENBÖHMER REDESIGNING URBAN INFRASTRUCTURES FOR A LOW-EMISSION FUTURE<br />
E.ON, <strong>Wuppertal</strong> Institut (2006). Optionen und Potenziale für<br />
Endenergieeffizienz und Energiedienstleistungen, Endbericht im<br />
Auftrag der E.ON AG<br />
Fietsberaad (2006) Continuous and integral: The cycling policies<br />
<strong>of</strong> Groningen and o<strong>the</strong>r European cycling cities,<br />
http://www.fietsberaad.nl/library/repository/bestanden/Publica<br />
tion%207%20Continuous%20and%20integral.<strong>pdf</strong><br />
Fleiter, T., et al. (2009) Costs and potentials <strong>of</strong> energy savings in<br />
European industry – a critical assessment <strong>of</strong> <strong>the</strong> concept <strong>of</strong><br />
conservation supply curves. In: Broussous, Christel (Hrsg.): Act!<br />
Innovate! Deliver! Reducing energy demand sustainability:<br />
ECEEE 2009 Summer Study ; conference proceedings ; 1-6 June<br />
2009, La Colle sur Loup, France; Europ. Council for an Energy<br />
Efficient Economy, 2009, Stockholm<br />
ifeu (2008). UmweltMobilCheck. Wissenschaftlicher Grundlagenbericht.<br />
Stand: Mai 2008. Heidelberg.<br />
http://www.bahn.de/p/view/mdb/bahnintern/services/umwelt/M<br />
DB58033-umc_grundlagen_ifeu_080531.<strong>pdf</strong><br />
ifeu / WI (2008). Gut verzahnt geplant! Wettbewerb Energiebalance<br />
- Preisgekrönte Arbeiten. Broschüre zum Wettbewerb im<br />
Rahmen des Projektes Energiebalance. ifeu – Institut für Energieund<br />
Umweltforschung Heidelberg GmbH und <strong>Wuppertal</strong> Institut<br />
für Klima, Umwelt, Energie GmbH, August 2008,<br />
www.ifeu.de/energie/<strong>pdf</strong>/Energiebalance_Wettbewerb_Broschu<br />
ere_Final.<strong>pdf</strong><br />
IWU [Institut für Wohnen und Umwelt GmbH] (2007).<br />
Querschnittsbericht Energieeffizienz im Wohngebäudebestand<br />
- Techniken, Potenziale, Kosten und Wirtschaftlichkeit.<br />
Studie im Auftrag des Verbandes der Südwestdeutschen<br />
Wohnungswirt-schaft e.V. (VdW südwest). Darmstadt. Online<br />
verfügbar unter:<br />
http://www.iwu.de/fileadmin/user_upload/dateien/energie/klima<br />
_altbau/IWU_QBer_EnEff_Wohngeb_Nov2007.<strong>pdf</strong><br />
Joest, Steffen et al. (2009). „Woher kommt der Wasserst<strong>of</strong>f in<br />
Deutschland bis 2050?“. Im Auftrag des Bundesministeriums<br />
für Verkehr, Bau und Stadtentwicklung (BMVBS) und in<br />
Abstimmung mit der Nationalen Organisation Wasserst<strong>of</strong>f- und<br />
Brennst<strong>of</strong>f-zellentechnologie (NOW).<br />
http://www.germanhy.de/page/fileadmin/germanhy/media/0908<br />
26_germanHy_Abschlussbericht.<strong>pdf</strong><br />
Lechtenböhmer, S. et al. (2009a). Sustainable Urban<br />
Infrastructure: Munich Edition – paths toward a carbon-free<br />
future - Munich: Siemens AG, 2009.<br />
http://www.wupperinst.org/en/projects/proj/index.html?beitrag<br />
_id=1028&projekt_id=229&bid=42&searchart=<br />
Lechtenböhmer, S. et al. (2009b). München 2058 – Wege in eine<br />
CO 2 -freie Zukunft. Hintergrundbericht. <strong>Wuppertal</strong> (internal<br />
project report)<br />
16 LECHTENBÖHMER | P16<br />
ProCool (2007). Ergebnisse des europaweiten Projekts ProCool,<br />
Österreichische Energieagentur, Verein für Konsumenteninformation<br />
(VKI), <strong>Wuppertal</strong> Institut, Deutsche Energieagentur:Effiuziente<br />
Kühlgeräte für Handel und Gewerbe,<br />
Ergebnisse des europaweiten Projekts ProCool<br />
Radgen (2000). Effiziente Druckluftversorgung, vom Frosch zum<br />
König, BWK, Bd. 57 Nr 6<br />
Radgen (2002). Market Study for Improving Energy Efficiency for<br />
Fans. EU SAVE Studie des Fraunh<strong>of</strong>er-Instituts für Systemtechnik<br />
und Innovationsforschung (ISI) Karlsruhe, Stuttgart 2002<br />
Rockström, J. et al. (2009). Planetary Boundaries: Exploring <strong>the</strong><br />
safe operating space for humanity. Ecology and Society, In Press<br />
14th September 2009<br />
RWE (n.d.). Smart Metering - Stromzähler der Zukunft;<br />
http://www.rwe.com/web/cms/de/46308/rwe-magazin/pilot<br />
projektstromzaehler-der-zukunft/;<br />
Schallaböck, K. O. et al. (2006). Klimawirksame Emissionen des<br />
PKW-Verkehrs und Bewertung von Minderungsstrategien.<br />
<strong>Wuppertal</strong> Spezial Nr. 34. <strong>Wuppertal</strong>.<br />
http://www.wupperinst.org/uploads/tx_wibeitrag/ws34.<strong>pdf</strong><br />
Siemens (2008). SITRAFFIC MOTION MX. Und der Verkehr kann<br />
wieder richtig fließen.<br />
http://www.industry.siemens.de/broschueren/<strong>pdf</strong>/traffic/de/SIT<br />
RAFFIC_MOTION_MX-Der_Verkehr_flie%DFt.<strong>pdf</strong><br />
Snijders, A. (2008). Aquifer Thermal Energy Storage (ATES) -<br />
Technology Development and Major Applications in Europe.<br />
Presentation Toronto, 30 July 2008<br />
www.trca.on.ca/dotAsset/16551.<strong>pdf</strong><br />
Transport for London (2008). Central London. Congestion<br />
Charging. Impacts monitoring. Sixth Annual Report, July 2008.<br />
http://www.tfl.gov.uk/assets/downloads/sixth-annual-impactsmonitoring-report-2008-07.<strong>pdf</strong><br />
VDV (2009). Umfassend nachhaltige Kraftst<strong>of</strong>f- und Antriebskonzepte<br />
für den Linienbusverkehr. Darstellung und Bewertung der<br />
Resultate einer vom VDV durchgeführten wissenschaftlichen<br />
Untersuchung.<br />
http://www.pe-international.com/uploads/media/vdv_positions<br />
papier_linienbusantriebe.<strong>pdf</strong><br />
WBGU (2009). Kassensturz für den Weltklimavertrag – Der<br />
Budgetansatz. Sondergutachten, Berlin 2009<br />
Wietschel, M./Dallinger, D. (2008). Quo Vadis Elektromobilität?<br />
In: Energiewirtschaftliche Tagesfragen 12/2008.