

Proposal - Research Services - University of Lethbridge
Proposal - Research Services - University of Lethbridge
Proposal - Research Services - University of Lethbridge

You also want an ePaper? Increase the reach of your titles
YUMPU automatically turns print PDFs into web optimized ePapers that Google loves.
T (K)<br />
6 8 10<br />
*<br />
A<br />
4<br />
2<br />
0<br />
330<br />
34<br />
SO 88-77 4,14 3,15<br />
SO2 18 -18<br />
U<strong>of</strong>L FTS<br />
(Continuum Preserved)<br />
CSO FTS<br />
(Continuum Removed)<br />
1,19 2,18<br />
CH3OH J=7-6<br />
SO2 20 -19<br />
SO 78-67 CS 7-6<br />
4,12 3,13<br />
1,19 0,18<br />
SO 88-77 13<br />
H CN 4-3<br />
CO 3-2<br />
SO2 16 -16<br />
SO 98-87 SO2 19 -18<br />
SiO 8-7<br />
CH3CN 19-18<br />
SO2 53,3-42,2 HCO5 2 1,5-41,4 HCN 4-3<br />
SO 12 -12<br />
340 350 360<br />
Frequency (GHz)<br />
2 4,8 3,9<br />
2 4,6 3,7<br />
+<br />
HCO 4-3<br />
SO 10 -10<br />
SO2 K -1=<br />
4-3<br />
0 1 2 3<br />
Intensity (Arbitrary Units)<br />
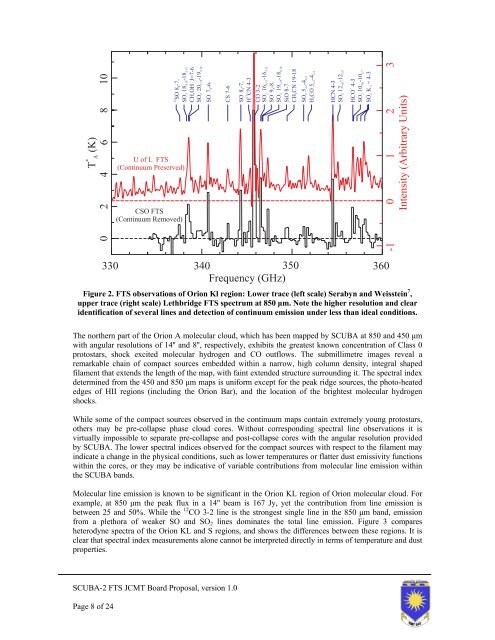
Figure 2. FTS observations <strong>of</strong> Orion Kl region: Lower trace (left scale) Serabyn and Weisstein 7 ,<br />
upper trace (right scale) <strong>Lethbridge</strong> FTS spectrum at 850 µm. Note the higher resolution and clear<br />
identification <strong>of</strong> several lines and detection <strong>of</strong> continuum emission under less than ideal conditions.<br />
The northern part <strong>of</strong> the Orion A molecular cloud, which has been mapped by SCUBA at 850 and 450 µm<br />
with angular resolutions <strong>of</strong> 14'' and 8'', respectively, exhibits the greatest known concentration <strong>of</strong> Class 0<br />
protostars, shock excited molecular hydrogen and CO outflows. The submillimetre images reveal a<br />
remarkable chain <strong>of</strong> compact sources embedded within a narrow, high column density, integral shaped<br />
filament that extends the length <strong>of</strong> the map, with faint extended structure surrounding it. The spectral index<br />
determined from the 450 and 850 µm maps is uniform except for the peak ridge sources, the photo-heated<br />
edges <strong>of</strong> HII regions (including the Orion Bar), and the location <strong>of</strong> the brightest molecular hydrogen<br />
shocks.<br />
While some <strong>of</strong> the compact sources observed in the continuum maps contain extremely young protostars,<br />
others may be pre-collapse phase cloud cores. Without corresponding spectral line observations it is<br />
virtually impossible to separate pre-collapse and post-collapse cores with the angular resolution provided<br />
by SCUBA. The lower spectral indices observed for the compact sources with respect to the filament may<br />
indicate a change in the physical conditions, such as lower temperatures or flatter dust emissivity functions<br />
within the cores, or they may be indicative <strong>of</strong> variable contributions from molecular line emission within<br />
the SCUBA bands.<br />
Molecular line emission is known to be significant in the Orion KL region <strong>of</strong> Orion molecular cloud. For<br />
example, at 850 µm the peak flux in a 14'' beam is 167 Jy, yet the contribution from line emission is<br />
between 25 and 50%. While the 12 CO 3-2 line is the strongest single line in the 850 µm band, emission<br />
from a plethora <strong>of</strong> weaker SO and SO2 lines dominates the total line emission. Figure 3 compares<br />
heterodyne spectra <strong>of</strong> the Orion KL and S regions, and shows the differences between these regions. It is<br />
clear that spectral index measurements alone cannot be interpreted directly in terms <strong>of</strong> temperature and dust<br />
properties.<br />
SCUBA-2 FTS JCMT Board <strong>Proposal</strong>, version 1.0<br />
Page 8 <strong>of</strong> 24<br />
-1


