- Page 1 and 2: The Effects of Land Use and Managem
- Page 3 and 4: i ABSTRACT The environmental impact
- Page 5 and 6: iii communities from those under th
- Page 7 and 8: v DECLARATION I hereby certify that
- Page 9 and 10: vii TABLE OF CONTENTS PAGE Abstract
- Page 11 and 12: ix TABLE OF CONTENTS PAGE 3.2.1 Sit
- Page 13 and 14: xi TABLE OF CONTENTS 5.4.2 Effects
- Page 15 and 16: xiii LIST OF TABLES PAGE TABLE 3.1
- Page 17 and 18: xv LIST OF TABLES PAGE under differ
- Page 19 and 20: xvii LIST OF TABLES PAGE evenness u
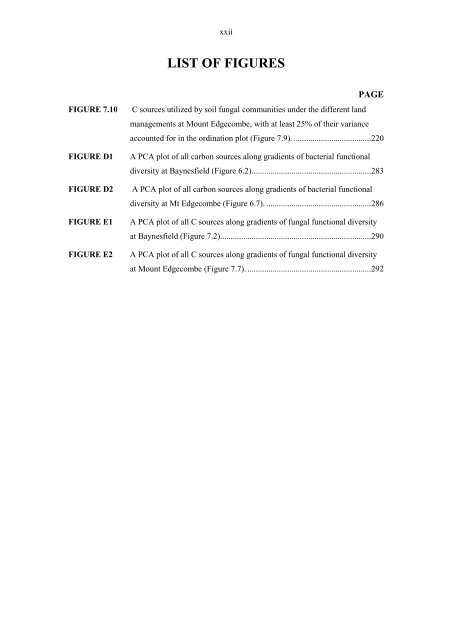
- Page 21 and 22: xix LIST OF FIGURES PAGE in the pho
- Page 23: xxi LIST OF FIGURES PAGE the differ
- Page 27 and 28: LSU Large subunit xxv mcrA Methyl-c
- Page 29 and 30: Chapter 1 GENERAL INTRODUCTION Biod
- Page 31 and 32: within ecosystem boundaries, to sus
- Page 33 and 34: 2.1 INTRODUCTION Chapter 2 LITERATU
- Page 35 and 36: Species interactions at the communi
- Page 37 and 38: conditions in relatively few microh
- Page 39 and 40: patches into a relatively homogeneo
- Page 41 and 42: processes in soil because other mic
- Page 43 and 44: communities can have the same index
- Page 45 and 46: the Shannon index described below t
- Page 47 and 48: of the plant community critically d
- Page 49 and 50: such as season, year and field site
- Page 51 and 52: Research evidence suggests that the
- Page 53 and 54: mulch applications might result in
- Page 55 and 56: Galdos et al. (2009), also working
- Page 57 and 58: Levels of actinobacteria increased
- Page 59 and 60: 2002b). In terrestrial ecosystems,
- Page 61 and 62: Avrahami et al. (2002) studied the
- Page 63 and 64: using both a macroscale and a micro
- Page 65 and 66: 2.3.3.3 Pesticides The influence of
- Page 67 and 68: microbial storage products, they ca
- Page 69 and 70: Prokaryote community analysis and e
- Page 71 and 72: 2.4.2 Molecular techniques Molecula
- Page 73 and 74: assessed the efficiency of isolatio
- Page 75 and 76:
FIGURE 2.1 Schematic diagram of the
- Page 77 and 78:
within the V9 region could be used
- Page 79 and 80:
environmental samples containing hi
- Page 81 and 82:
2.4.2.2.3 Reverse transcription (RT
- Page 83 and 84:
that contain a linearly increasing
- Page 85 and 86:
methanotrophic communities in an ag
- Page 87 and 88:
2.4.2.2.7 Single strand conformatio
- Page 89 and 90:
level of resolution. It is a quanti
- Page 91 and 92:
these concepts has largely been mad
- Page 93 and 94:
Soil organic matter status and micr
- Page 95 and 96:
(Farmingham series) (Soil Classific
- Page 97 and 98:
3.2.5 PCR amplification of 16S rDNA
- Page 99 and 100:
(Bio-Rad Quantity One Instruction M
- Page 101 and 102:
evenness (J') (a measure of the equ
- Page 103 and 104:
Overall dissimilarities among the s
- Page 105 and 106:
CCA was used to show the effects of
- Page 107 and 108:
concur with those of other workers
- Page 109 and 110:
Axis 2 1.5 1.0 0.5 0.0 -0.5 -1.0 SA
- Page 111 and 112:
Analysis of evenness (J) at this si
- Page 113 and 114:
MRPP of Mount Edgecombe soils, whic
- Page 115 and 116:
CCA analysis showed the effects of
- Page 117 and 118:
treatments across the gels were mor
- Page 119 and 120:
TABLE 3.12 Two-way ANOVA of the mai
- Page 121 and 122:
They suggested that the bright band
- Page 123 and 124:
eduction in genetic diversity, whic
- Page 125 and 126:
the land use types at this site. Re
- Page 127 and 128:
assessment of the DGGE gels indicat
- Page 129 and 130:
organic matter under long-term suga
- Page 131 and 132:
Chapter 4 EFFECTS OF LAND USE AND M
- Page 133 and 134:
4.2 MATERIALS AND METHODS Methods w
- Page 135 and 136:
everse primer and 0.5 µM of NS1 fo
- Page 137 and 138:
4.3.2 PCR-DGGE analysis of fungal c
- Page 139 and 140:
FIGURE 4.2 Quantity One diagram of
- Page 141 and 142:
FIGURE 4.3 Quantity One diagram of
- Page 143 and 144:
TABLE 4.3 ANOVA of species richness
- Page 145 and 146:
TABLE 4.4 ANOVA of soil fungal spec
- Page 147 and 148:
Hantula, 2000). The approach used i
- Page 149 and 150:
18-43% suggested by Vainio and Hant
- Page 151 and 152:
decomposers of dead organic matter
- Page 153 and 154:
and of the whole community. Diversi
- Page 155 and 156:
Chapter 5 DNA-DERIVED ASSESSMENTS O
- Page 157 and 158:
Subsamples for DNA extraction and C
- Page 159 and 160:
cycles comprising a denaturing (95
- Page 161 and 162:
The eluted DNA was used for PCR amp
- Page 163 and 164:
TABLE 5.1 Means (± sd) for selecte
- Page 165 and 166:
5.3.2 PCR-DGGE analysis of fungal c
- Page 167 and 168:
PLATE 5.3 DGGE gel (denaturing grad
- Page 169 and 170:
FIGURE 5.3 Quantity One diagram of
- Page 171 and 172:
Soil fungal community composition u
- Page 173 and 174:
TABLE 5.4 ANOVA and land use means
- Page 175 and 176:
CCA 2 (30.4%) 3.0 2.0 1.0 0.0 -1.0
- Page 177 and 178:
TABLE 5.6 Means (± sd) for selecte
- Page 179 and 180:
PC2 (16.0%) 0.6 0.4 0.2 0.0 -0.2 -0
- Page 181 and 182:
A DGGE gel (denaturing gradient 35-
- Page 183 and 184:
closely clustered of all the treatm
- Page 185 and 186:
effects and 11.2% of total variance
- Page 187 and 188:
a resurgence in interest, particula
- Page 189 and 190:
sequencing studies. This was regard
- Page 191 and 192:
soils (see below). This was possibl
- Page 193 and 194:
plant species, which may affect mic
- Page 195 and 196:
little is known of the effects of a
- Page 197 and 198:
significantly affected soil fungal
- Page 199 and 200:
and mixed DNA templates among the s
- Page 201 and 202:
Graham (2003) used BIOLOG GN microp
- Page 203 and 204:
A method adapted from Govaerts et a
- Page 205 and 206:
6.2.6 Statistical analysis BIOLOG s
- Page 207 and 208:
6.3.2 Bacterial catabolic (function
- Page 209 and 210:
Testing by MRPP of the PCA data of
- Page 211 and 212:
RDA 2 (27.5%) 1.0 0.8 0.6 0.4 0.2 0
- Page 213 and 214:
TABLE 6.2 Mean soil moisture conten
- Page 215 and 216:
PC2 (17.3%) 1.0 0.8 0.6 0.4 0.2 0.0
- Page 217 and 218:
TABLE 6.3 A non-parametric one-way
- Page 219 and 220:
0.8 0.6 0.4 0.2 0.0 -0.2 -0.4 -0.6
- Page 221 and 222:
populations. This was confirmed by
- Page 223 and 224:
observed in pine soil. Less litter
- Page 225 and 226:
and evenness. In this study, the re
- Page 227 and 228:
more closely clustered together tha
- Page 229 and 230:
soil organic C content. In the pres
- Page 231 and 232:
Chapter 7 EFFECTS OF LAND USE AND M
- Page 233 and 234:
7.2.2 Chemical analysis Chemical an
- Page 235 and 236:
obtained from the substrate-contain
- Page 237 and 238:
AWCD at OD650 0.40 0.35 0.30 0.25 0
- Page 239 and 240:
1.0 0.5 0.0 -0.5 -1.0 10A 6G 8F 12G
- Page 241 and 242:
RDA results, showing the relationsh
- Page 243 and 244:
7.3.3 Analyses of soils at the Moun
- Page 245 and 246:
Log [X+1]-transformed PCA data (Fig
- Page 247 and 248:
RDA2 (35.8%) FIGURE 7.9 RDA ordinat
- Page 249 and 250:
7.4 DISCUSSION It is important to t
- Page 251 and 252:
nutrients, which could account for
- Page 253 and 254:
sugarcane soils were more acidic (p
- Page 255 and 256:
7.4.2 Fungal catabolic (functional)
- Page 257 and 258:
the conditions prevailing under a s
- Page 259 and 260:
(which affected the pH and the leve
- Page 261 and 262:
Notwithstanding the generally accep
- Page 263 and 264:
ECEC and P, with exchange acidity a
- Page 265 and 266:
8.3 CRITICAL EVALUATION OF THE RESE
- Page 267 and 268:
8.3.2 Evaluation of the PCR-DGGE pr
- Page 269 and 270:
8.4.1 Baynesfield Estate The benefi
- Page 271 and 272:
This would help reduce the soil deg
- Page 273 and 274:
REFERENCES Aboim, M.C.R., Coutinho,
- Page 275 and 276:
Benckiser, G., Schnell, S., 2007. B
- Page 277 and 278:
Carrera, L.M., Buyer, J.S., Vinyard
- Page 279 and 280:
Dilly, O., Bloem, J., Vos, A., Munc
- Page 281 and 282:
Garbeva, P., van Veen, J.A., van El
- Page 283 and 284:
Graham, M.H., Haynes, R.J., Meyer,
- Page 285 and 286:
Heuer, H., Kroppenstedt, R.M., Lott
- Page 287 and 288:
and diversity of microorganisms in
- Page 289 and 290:
sequencing, in silico- and microarr
- Page 291 and 292:
Maharning, A.R., Mills, A.A.S., Adl
- Page 293 and 294:
Mitchell, J.I., Zuccaro, A., 2006.
- Page 295 and 296:
for phosphorus efficiency in the ac
- Page 297 and 298:
Poll, C., Thiede, A., Wermbter, N.,
- Page 299 and 300:
Ros, G.H., Hanegraaf, M.C., Hofflan
- Page 301 and 302:
Smalla, K., Wachtendorf, U., Heuer,
- Page 303 and 304:
Torsvik, V., Salte, K., Sørheim, R
- Page 305 and 306:
Wang, G., Liu, J., Qi, X., Jin, J.,
- Page 307 and 308:
BAYNESFIELD ESTATE APPENDIX A TABLE
- Page 309 and 310:
BAYNESFIELD ESTATE APPENDIX C TABLE
- Page 311 and 312:
BAYNESFIELD ESTATE 1.5 1.0 0.5 0.0
- Page 313 and 314:
TABLE D5 Non-parametric one-way ana
- Page 315 and 316:
TABLE D8 Non-parametric one-way ana
- Page 317 and 318:
APPENDIX E TABLE E1 The substrates
- Page 319 and 320:
TABLE E3 Non-parametric one-way ana
- Page 321 and 322:
TABLE E6 Non-parametric one-way ana


