26.2 Stars
26.2 Stars
26.2 Stars

You also want an ePaper? Increase the reach of your titles
YUMPU automatically turns print PDFs into web optimized ePapers that Google loves.
Section <strong>26.2</strong><br />
1<br />
FOCUS<br />
Objectives<br />
<strong>26.2</strong>.1 Demonstrate how distance<br />
to a star is measured.<br />
<strong>26.2</strong>.2 Classify stars according to<br />
chemical and physical<br />
properties.<br />
<strong>26.2</strong>.3 Interpret the H-R diagram.<br />
Build Vocabulary<br />
Compare/Contrast Tables Have<br />
students make tables comparing and<br />
contrasting groups of vocabulary terms<br />
for this section. Students should look for<br />
relationships among the words before<br />
they develop their tables. For example,<br />
main sequence, supergiants, giants, and<br />
white dwarfs are all types of stars.<br />
Reading Strategy<br />
a. and b. Various properties may be<br />
listed, such as color or temperature,<br />
absolute brightness, and size.<br />
2<br />
Reading Focus<br />
INSTRUCT<br />
Distances to<br />
the <strong>Stars</strong><br />
Build Science Skills<br />
834 Chapter 26<br />
L2<br />
L2<br />
L2<br />
Inferring Tell students that a light-year<br />
is more than a unit of distance. It is also<br />
a glimpse into the past. For example, it<br />
takes light 4.3 years to travel the 4.3 lightyears<br />
from Proxima Centauri to Earth.<br />
When you look at Proxima Centauri in the<br />
night sky, you are seeing the star as it was<br />
4.3 years ago. Ask, If Proxima Centauri<br />
no longer generated light, how long<br />
would it take before we knew the star<br />
had died? (4.3 years) Verbal, Logical<br />
L2<br />
Given its name, students often think of<br />
a light-year as a unit of time, rather than<br />
a unit of measure. To help overcome<br />
this misconception, have them read the<br />
text on p. 834 under the heading The<br />
Light-Year. Then, have them confirm<br />
that the distance to Proxima Centauri<br />
(4.3 light-years) equals 41 trillion km.<br />
([41 trillion km]/[9.5 trillion km/light-year]<br />
4.3 light-years) Logical<br />
<strong>26.2</strong> <strong>Stars</strong><br />
Key Concepts<br />
How can the distance to a<br />
star be measured?<br />
How do astronomers<br />
categorize stars?<br />
What elements are found<br />
in stars?<br />
How do astronomers use<br />
H-R diagrams?<br />
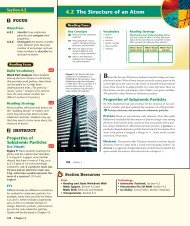
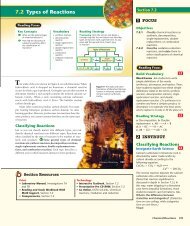
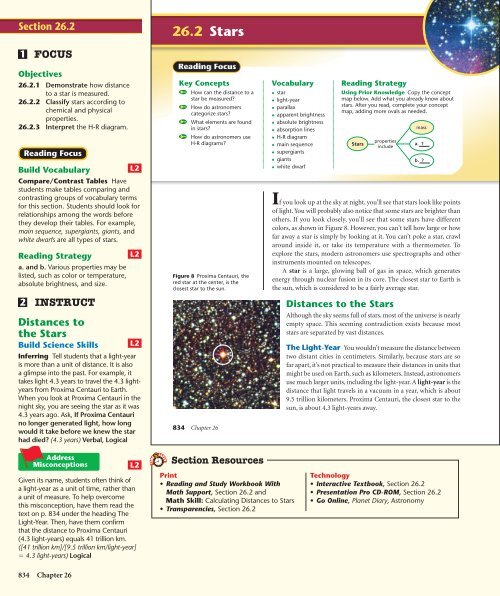
Figure 8 Proxima Centauri, the<br />
red star at the center, is the<br />
closest star to the sun.<br />
834 Chapter 26<br />
Section Resources<br />
Vocabulary<br />
◆ star<br />
◆ light-year<br />
◆ parallax<br />
Print<br />
• Reading and Study Workbook With<br />
Math Support, Section <strong>26.2</strong> and<br />
Math Skill: Calculating Distances to <strong>Stars</strong><br />
• Transparencies, Section <strong>26.2</strong><br />
◆ apparent brightness<br />
◆ absolute brightness<br />
◆ absorption lines<br />
◆ H-R diagram<br />
◆ main sequence<br />
◆ supergiants<br />
◆ giants<br />
◆ white dwarf<br />
Reading Strategy<br />
Using Prior Knowledge Copy the concept<br />
map below. Add what you already know about<br />
stars. After you read, complete your concept<br />
map, adding more ovals as needed.<br />
<strong>Stars</strong><br />
properties<br />
include<br />
mass<br />
If you look up at the sky at night, you’ll see that stars look like points<br />
of light. You will probably also notice that some stars are brighter than<br />
others. If you look closely, you’ll see that some stars have different<br />
colors, as shown in Figure 8. However, you can’t tell how large or how<br />
far away a star is simply by looking at it. You can’t poke a star, crawl<br />
around inside it, or take its temperature with a thermometer. To<br />
explore the stars, modern astronomers use spectrographs and other<br />
instruments mounted on telescopes.<br />
A star is a large, glowing ball of gas in space, which generates<br />
energy through nuclear fusion in its core. The closest star to Earth is<br />
the sun, which is considered to be a fairly average star.<br />
b. ?<br />
Distances to the <strong>Stars</strong><br />
Although the sky seems full of stars, most of the universe is nearly<br />
empty space. This seeming contradiction exists because most<br />
stars are separated by vast distances.<br />
The Light-Year You wouldn’t measure the distance between<br />
two distant cities in centimeters. Similarly, because stars are so<br />
far apart, it’s not practical to measure their distances in units that<br />
might be used on Earth, such as kilometers. Instead, astronomers<br />
use much larger units, including the light-year. A light-year is the<br />
distance that light travels in a vacuum in a year, which is about<br />
9.5 trillion kilometers. Proxima Centauri, the closest star to the<br />
sun, is about 4.3 light-years away.<br />
a. ?<br />
Technology<br />
• Interactive Textbook, Section <strong>26.2</strong><br />
• Presentation Pro CD-ROM, Section <strong>26.2</strong><br />
• Go Online, Planet Diary, Astronomy
Earth in<br />
January<br />
Parallax <strong>Stars</strong> are so far away that astronomers cannot measure<br />
their distances directly. Astronomers have developed various methods<br />
of determining the distances to stars. Different methods are used for<br />
stars at different distances.<br />
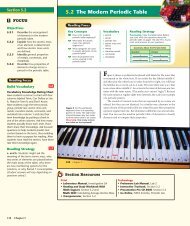
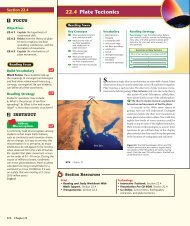
To understand how astronomers can measure distances to nearby<br />
stars, hold your thumb up at arm’s length in front of you, as the student<br />
is doing in Figure 9. Close your left eye and look at your thumb<br />
with just your right eye open. Then cover your right eye and look with<br />
just your left eye open. Even though you didn’t move your thumb, it<br />
appeared to move relative to the background because you looked at it<br />
from slightly different angles. The apparent change in position of an<br />
object with respect to a distant background is called parallax.<br />
As Earth moves in its orbit, astronomers are able to observe stars from<br />
two different positions. Imagine looking at the stars in winter and then<br />
six months later in summer. During this time, Earth has moved from one<br />
side of its orbit to the other—a distance of about 300 million kilometers.<br />
Because people on Earth are looking from a different angle, the nearby<br />
star appears to move against the more-distant background stars.<br />
Before the invention of the telescope, astronomers couldn’t measure<br />
a star’s position very accurately. They couldn’t detect the apparent<br />
movement of even a single nearby star as Earth moved around the sun.<br />
With the invention of the telescope, astronomers could measure<br />
the positions of stars with much greater accuracy. Astronomers<br />
measure the parallax of nearby stars to determine their distance<br />
from Earth. The closer a star is to Earth, the greater is its parallax.<br />
Customize for Inclusion Students<br />
Learning Disabled<br />
Inspire confidence in learning-disabled students<br />
by beginning each new topic with a question<br />
or activity that they can successfully master. For<br />
example, you could start this section by asking<br />
Nearby star<br />
Sun<br />
Earth’s orbit<br />
Distant stars<br />
Earth in<br />
July<br />
Figure 9 You can observe<br />
parallax by holding your thumb in<br />
front of you. Compare its<br />
positions when you look at it first<br />
with one eye and then with the<br />
other. Astronomers can measure<br />
the parallax of nearby stars by<br />
measuring their position relative<br />
to distant stars as the Earth<br />
revolves around the sun.<br />
Observing Is the parallax of your<br />
thumb greater when it is closer to<br />
your eyes or when it is farther<br />
from your eyes?<br />
Exploring the Universe 835<br />
students to describe the night sky. Or, you<br />
could ask them to calculate their age when<br />
light from Proxima Centauri left the star. Simply<br />
say, Light left the star more than four years<br />
ago. How old were you then?<br />
Build Math Skills<br />
Exponents: Multiplication and<br />
Division Have students practice working<br />
with exponents by comparing the<br />
light-year to the AU. Ask them to write<br />
9.46 trillion km (one light-year) in<br />
exponential form. (9.46 1012 km)<br />
Remind students that the average<br />
distance from Earth to the sun is<br />
149,598,000 km (one AU). Have them<br />
write this number in exponential form.<br />
(1.496 108 km) Then, have students<br />
divide the numbers to determine<br />
how many AU equal one light-year.<br />
([9.46 1012 km/light-year]/[1.496 <br />
108 km/AU] 63,200 AU/light-year)<br />
Logical<br />
Direct students to the Math Skills in<br />
the Skills and Reference Handbook<br />
at the end of the student text for<br />
additional help.<br />
Use Visuals<br />
Figure 9 Tell students that even the<br />
largest measured parallax of a star is less<br />
than the apparent width of a dime at a<br />
distance of a mile. It is much too small to<br />
be seen with the unaided eye. Ask, Why<br />
does the star appear to move? (Earth<br />
has moved from one side of its orbit to the<br />
other. An observer on Earth is viewing the<br />
star from a different angle.) What do the<br />
arrows show? (The angle of sight of an<br />
observer on Earth)<br />
Visual<br />
Build Science Skills<br />
L1<br />
L1<br />
L2<br />
Calculating Explain that parallax is<br />
typically measured in arc-seconds, a unit<br />
equal to 1/3600 of a degree. A star could<br />
have a parallax, for example, of 1 arc-sec,<br />
abbreviated as 1". A parsec is a unit of<br />
measure equal to the distance at which<br />
a star’s parallax is 1 arc-second. One<br />
parsec is equal to 3.26 light-years. The<br />
following formula is used to calculate<br />
the distance of a star in parsecs: d 1/p<br />
where d represents distance in parsecs<br />
and p represents parallax in arc-seconds.<br />
Write the formula on the board and have<br />
students calculate the distance to a star<br />
that has a parallax of 0.20". (1/0.20" <br />
5.0 parsecs) Then, ask students to convert<br />
this distance to light-years. (5.0 parsecs <br />
3.26 light-years/parsec 16 light-years)<br />
Logical<br />
Answer to . . .<br />
Figure 9 When it is closer to your eyes<br />
Exploring the Universe 835
Section <strong>26.2</strong> (continued)<br />
Properties of <strong>Stars</strong><br />
Build Reading Literacy<br />
Predict Refer to page 66D in<br />
Chapter 3, which provides the<br />
guidelines for predicting.<br />
Before students read about the properties<br />
of stars, tell them that stars range<br />
in color from blue to white to yellow to<br />
red, similar to flames from a fire. Have<br />
them picture a flame—different parts are<br />
hotter than others. Based on what they<br />
know about these temperature differences,<br />
ask them to predict which color<br />
indicates the hottest star. (Blue) Have<br />
students read the text to see if their<br />
predictions were correct.<br />
Logical<br />
Build Math Skills<br />
836 Chapter 26<br />
L1<br />
L1<br />
Conversion Factors Remind students<br />
that temperatures are measured from<br />
absolute zero on the Kelvin scale. On the<br />
Celsius scale, absolute zero is 273°. The<br />
formula for converting kelvins to degrees<br />
Celsius is C K 273. Point out that<br />
at the high surface temperatures of stars,<br />
there is not much difference between<br />
the Kelvin and Celsius scale temperatures.<br />
Have students convert the surface<br />
temperatures of the following stars<br />
from kelvins to degrees Celsius: Spica,<br />
22,973 K; the sun, 5773 K; Castor C,<br />
3573 K. (Spica: 22,973 K 273 K <br />
22,700°C; the sun: 5773 K 273 K <br />
5500°C; Castor C: 3573 K 273 K <br />
3300°C)<br />
Logical<br />
Direct students to the Math Skills in<br />
the Skills and Reference Handbook<br />
at the end of the student text for<br />
additional help.<br />
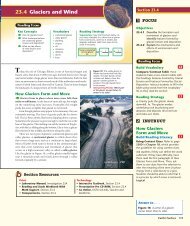
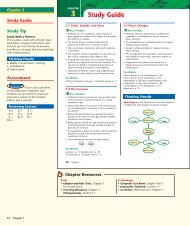
Figure 10 The “Winter Triangle”<br />
can be seen in the late fall and<br />
winter in the eastern sky. It is<br />
made up of three of the brightest<br />
stars in the sky: Betelgeuse,<br />
Procyon, and Sirius A. Betelgeuse<br />
and the star Rigel belong to the<br />
constellation Orion.<br />
Applying Concepts Which star<br />
has a higher surface temperature,<br />
Betelgeuse or Sirius A?<br />
Sirius A<br />
Procyon<br />
836 Chapter 26<br />
Astronomers have measured the parallax of many nearby stars and<br />
determined their distances from Earth. However, if a star is too far<br />
away, its parallax is too small to be measured. With present technology,<br />
the parallax method gives reasonably accurate distance measurements<br />
for stars within a few hundred light-years. Astronomers have developed<br />
other ways to estimate distances to more-distant stars.<br />
Properties of <strong>Stars</strong><br />
There are many different types of stars. Astronomers classify stars<br />
by their color, size, and brightness. Other important properties of<br />
stars include their chemical composition and mass.<br />
Color and Temperature Have you ever looked closely at a<br />
candle flame? The hottest part of the flame near the wick is blue or<br />
white, while the cooler flame tip is orange. A propane torch flame is<br />
blue. Dying campfire embers are red. You can estimate the temperature<br />
of a flame from its color. In the same way, a star’s color indicates the temperature<br />
of its surface. The hottest stars, with surface temperatures above<br />
30,000 K, appear blue. The surfaces (photospheres) of relatively cool<br />
red stars are still a toasty 3000 K or so. <strong>Stars</strong> with surface temperatures<br />
between 5000 and 6000 K appear yellow, like the sun. As shown in<br />
Figure 10, the color differences between hot blue stars and cool red<br />
stars can be seen with the unaided eye. More precise measurements of<br />
stars’ temperatures can be made by studying stars’ spectra.<br />
Brightness When you walk along a street at night, such as the one<br />
shown in Figure 11, look up at a row of street lights. The closer lights<br />
look bright and the more distant lights look dim. However, the more<br />
distant lights are not really dimmer. They appear dim to you because,<br />
at a greater distance, their light is spread out over a<br />
greater area, so a smaller portion enters your eyes.<br />
The same is true for the light emitted by stars.<br />
You might think that closer stars will always<br />
Betelgeuse appear brighter than more-distant stars. Astronomers<br />
have discovered, however, that the brightness of<br />
stars can vary by a factor of more than a billion. So,<br />
stars that look bright may actually be farther away<br />
than stars that appear dim.<br />
ORION<br />
Although the sun appears to be the brightest<br />
star in our sky, it is really a star of only average<br />
brightness. The sun appears very bright to us<br />
because it is much closer than other stars. The<br />
Rigel<br />
brightness of a star as it appears from Earth is called<br />
its apparent brightness. The apparent brightness<br />
of a star decreases as its distance from you increases.
If you move away from a street light or a star, it<br />
shines just as brightly as before—but to you it<br />
appears fainter. Absolute brightness is how bright a<br />
star really is. A star’s absolute brightness is a characteristic<br />
of the star and does not depend on how far it<br />
is from Earth. You can calculate a star’s absolute<br />
brightness if you know its distance from Earth and<br />
its apparent brightness.<br />
Size and Mass Once astronomers know a star’s<br />
temperature and absolute brightness, they can estimate<br />
its diameter and then calculate its volume.<br />
However, there is no direct way of finding the mass of<br />
an isolated star. Instead, astronomers are able to calculate<br />
the masses of many stars by observing the<br />
gravitational interaction of stars that occur in pairs.<br />
From such observations, astronomers have determined<br />
that, for most stars, there is a relationship<br />
between mass and absolute brightness. Astronomers<br />
have found that many stars are similar to the sun in<br />
size and mass.<br />
How can astronomers determine a star’s mass?<br />
Composition A spectrograph is an instrument that spreads light<br />
from a hot glowing object, such as a light bulb or a star, into a spectrum.<br />
Astronomers can use spectrographs to identify the various<br />
elements in a star’s atmosphere.<br />
Each star has its own spectrum. The elements within a star’s atmosphere<br />
absorb light from the star’s photosphere. Each element absorbs<br />
light of different wavelengths, removing these wavelengths from the<br />
star’s continuous spectrum. The result is a bright spectrum, such as<br />
the one shown in Figure 12. It contains a set of dark lines called<br />
absorption lines that show where light has been absorbed. Just as fingerprints<br />
can be used to identify a person, a star’s absorption lines can<br />
be used to identify different elements in the star.<br />
Absorption lines of most elements have been identified in<br />
the spectra of stars. Observations of such lines in many stars<br />
have shown that the composition of most stars is fairly similar.<br />
Most stars have a chemical makeup that is similar to the sun,<br />
with hydrogen and helium together making up 96 to 99.9 percent<br />
of the star’s mass.<br />
Facts and Figures<br />
Discovery of Helium In 1868, a spectrometer<br />
was used for the first time to study the sun<br />
during a solar eclipse. The French astronomer<br />
Pierre Janssen analyzed the resulting spectrum<br />
and noticed that a bright yellow spectral line did<br />
not match any known elements. He proposed<br />
that the line was associated with a new element.<br />
Figure 11 These streetlights all<br />
have about the same absolute<br />
brightness. Inferring Why do<br />
the nearby streetlights appear<br />
brighter than the distant ones?<br />
Figure 12 This is the spectrum of<br />
a star. The dark absorption lines<br />
indicate the presence of various<br />
elements in the star.<br />
Exploring the Universe 837<br />
It was named helium, which stems from the<br />
Greek word helios, meaning “sun.” Helium, a<br />
light noble gas, is extremely difficult to detect<br />
on Earth. In 1895, Sir William Ramsay was finally<br />
able to demonstrate the presence of helium in<br />
ores by treating them with acids.<br />
Build Science Skills<br />
Communicating Results The Stefan-<br />
Boltzmann Law relates a star’s absolute<br />
brightness to its size and temperature.<br />
Written in equation form, the law states<br />
that L 4πR 2 sT 4 where L is luminosity<br />
(or absolute brightness), R is the radius<br />
of a star, s is a constant, and T is temperature.<br />
The equation can be used to<br />
determine a star’s size if its temperature<br />
and absolute brightness are known.<br />
Have students research and write brief<br />
reports about how scientists use the<br />
Stefan-Boltzmann Law.<br />
Verbal<br />
Integrate Chemistry<br />
L2<br />
L2<br />
Tell students that at the surface of stars<br />
with relatively low temperatures, atoms<br />
retain all of their electrons and radiate<br />
neutral, or normal, spectra. At very high<br />
temperatures, atoms collide and lose<br />
electrons and become thermally ionized.<br />
Ions have different spectra than atoms.<br />
Ask, How is it possible that two stars<br />
can have a similar composition, but<br />
radiate different spectra? (One of the<br />
stars is much hotter than the other.)<br />
Logical<br />
Answer to . . .<br />
Figure 10 Sirius A because it is blue<br />
Figure 11 The nearby streetlights<br />
have a greater apparent brightness.<br />
By observing the gravitational<br />
interaction of<br />
stars that appear in pairs, which led<br />
to the determination that mass and<br />
absolute brightness are related<br />
Exploring the Universe 837
Section <strong>26.2</strong> (continued)<br />
The Hertzsprung-<br />
Russell Diagram<br />
Use Visuals<br />
838 Chapter 26<br />
L1<br />
Figure 13 Tell students that absolute<br />
brightness is often called luminosity by<br />
astronomers. Then say, Describe the<br />
properties of the sun shown on the<br />
H-R diagram. (Color: yellow; surface<br />
temperature: about 5700 K; type: main<br />
sequence; absolute brightness: average)<br />
What is the hottest supergiant shown<br />
on the diagram? (Rigel) What is the<br />
coolest main-sequence star labeled on<br />
the diagram? (Alpha Centauri B) Which<br />
supergiant has a temperature and<br />
color similar to the sun’s? (Polaris)<br />
What color, temperature, and star<br />
type is Sirius B? (Color: blue-white;<br />
temperature: about 30,000 K; type: white<br />
dwarf) Which labeled star on the<br />
diagram has the greatest absolute<br />
brightness? The least? (Greatest: Deneb;<br />
least: Sirius B)<br />
Visual<br />
L2<br />
Often students think that all of the stars<br />
in an H-R diagram are located close to<br />
one another in space. This is not the<br />
case. Emphasize that an H-R diagram<br />
is a graph, not a star chart. An H-R<br />
diagram can be used to plot any sample<br />
of stars. You may find later in this<br />
chapter that students have a similar<br />
misconception about constellations—<br />
that is, all the stars in a constellation are<br />
close to one another. Again, explain that<br />
the stars in a constellation are separated<br />
by vast distances. Ask, Can the distance<br />
to a star be determined simply by<br />
gazing at it? (No)<br />
Verbal<br />
Absolute Brightness<br />
Increasing<br />
50,000<br />
838 Chapter 26<br />
Main sequence<br />
Sirius B<br />
Hertzsprung-Russell Diagram<br />
Rigel<br />
Sirius A<br />
Algol<br />
Deneb<br />
White dwarfs<br />
Polaris<br />
Supergiants<br />
Alpha<br />
Centauri A<br />
Giants<br />
Betelgeuse<br />
Blue Blue-white White Yellow Orange-red Red<br />
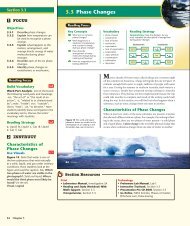
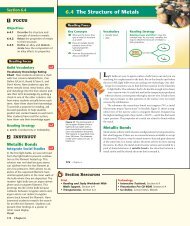
Figure 13 A star’s placement on<br />
an H-R diagram indicates its<br />
absolute brightness and surface<br />
temperature (or color).<br />
Interpreting Diagrams<br />
Compare the sun and Aldebaran.<br />
Which is hotter and which has a<br />
greater absolute brightness?<br />
Sun<br />
Antares<br />
Aldebaran<br />
Pollux<br />
Alpha<br />
Centauri B<br />
20,000 10,000 6000 5000 3000<br />
Surface Temperature (kelvins)<br />
The Hertzsprung-Russell Diagram<br />
In the early 1900s, two astronomers working independently, Ejnar<br />
Hertzsprung and Henry Norris Russell, made a similar observation.<br />
Both discovered that stars can be classified by locating them on a graph<br />
showing two easily determined characteristics. Such a graph is called<br />
a Hertzsprung-Russell diagram, or H-R diagram. An H-R diagram is<br />
a graph of the surface temperature, or color, and absolute brightness<br />
of a sample of stars. These diagrams are one of modern astronomy’s<br />
most important tools. H-R diagrams are used to estimate the<br />
sizes of stars and their distances, and to infer how stars change over<br />
time.<br />
Look closely at the H-R diagram in Figure 13. The horizontal axis<br />
shows the surface temperatures of stars. Recall that a star’s color is<br />
directly related to its surface temperature. The hottest blue stars are<br />
on the left and the coolest red stars are on the right. Surface temperatures<br />
of stars range from less than 3000 K to more than 30,000 K.
The vertical axis of the H-R diagram shows absolute brightness,<br />
with the brightest stars at the top and the faintest at the bottom. The<br />
absolute brightnesses of stars vary even more than temperature, ranging<br />
from about one ten-thousandth to a million times that of the sun!<br />
Main-Sequence <strong>Stars</strong> Notice that stars occur only in certain<br />
places on the H-R diagram. Most stars are found along a diagonal band<br />
running from the bright hot stars on the upper left to the dim cool<br />
stars on the lower right. Astronomers call this diagonal band on the<br />
H-R diagram the main sequence. About 90% of all stars are found on<br />
the main sequence. The sun lies near the middle of this band.<br />
Giants and Dwarfs In general, two factors determine a star’s<br />
absolute brightness: its size and its surface temperature. Since an H-R<br />
diagram shows a star’s absolute brightness and surface temperature,<br />
you can use the diagram to estimate the star’s size. If you compare two<br />
stars at the same temperature, the brighter one must be larger. Similarly,<br />
hotter stars are brighter than cooler stars of the same size.<br />
The very bright stars at the upper right of the H-R diagram are<br />
called supergiants. Supergiants are much brighter than main-sequence<br />
stars of the same temperature. To be so bright, these supergiants must<br />
be very large compared with main-sequence stars. In fact, supergiants<br />
range in size from 100 to 1000 times the diameter of the sun. Just below<br />
the supergiants on the H-R diagram are the giants—large, bright stars<br />
that are smaller and fainter than supergiants.<br />
Below the main sequence in the lower part of the H-R diagram are<br />
white dwarfs. A white dwarf is the small, dense remains of a low- or<br />
medium-mass star. You can see from the diagram that white dwarfs are<br />
hot but dimmer than main-sequence stars of the same temperature.<br />
Section <strong>26.2</strong> Assessment<br />
Reviewing Concepts<br />
1. What method do astronomers use to<br />
measure the distances of nearby stars?<br />
2. What are some common properties used<br />
to classify stars?<br />
3. Describe the chemical composition of a<br />
star like the sun.<br />
4. What is an H-R diagram? How is one<br />
useful to an astronomer?<br />
Critical Thinking<br />
5. Applying Concepts What causes the dark<br />
lines in a star’s spectrum?<br />
Section <strong>26.2</strong> Assessment<br />
1. The parallax method<br />
2. Color or surface temperature, absolute<br />
brightness, size, mass, chemical composition<br />
3. <strong>Stars</strong> like the sun are composed mainly of<br />
hydrogen and helium.<br />
4. An H-R diagram is a graph of surface<br />
temperature versus absolute brightness for a<br />
sample of stars. It can be used to estimate the<br />
sizes and distances of stars and to understand<br />
how stars evolve.<br />
Figure 14 The diameter of a<br />
red giant is typically 10–100<br />
times that of the sun and<br />
more than 1000 times that of<br />
a white dwarf.<br />
Sun<br />
Red giant<br />
White<br />
dwarf<br />
6. Comparing and Contrasting Describe the<br />
locations of giants, supergiants, and white<br />
dwarfs on an H-R diagram.<br />
7. The bright star Spica is located about<br />
2.49 1015 kilometers from Earth.<br />
How many light-years is this?<br />
8. Betelgeuse is about 427 light-years<br />
from Earth. How many kilometers<br />
is this?<br />
Exploring the Universe 839<br />
5. Dark absorption lines show where light<br />
has been absorbed by elements in a star’s<br />
atmosphere.<br />
6. Giants can be found above the main<br />
sequence and below the supergiants in the<br />
upper-right portion of an H-R diagram. The<br />
region where supergiants are found extends<br />
from the upper right to the upper central<br />
portion of the diagram. White dwarfs are<br />
generally found in the lower central portion<br />
of the diagram, below the main sequence.<br />
Use Community<br />
Resources<br />
Invite a local astronomer to discuss<br />
spectral types with the class. Ask him or<br />
her to bring along charts and stellar<br />
images, if possible. Before the visit,<br />
describe spectral classes (O, B, A, F, G, K,<br />
and M) and explain that they are based<br />
largely on temperature differences<br />
among stars, with O being the hottest<br />
and M being the coolest. Have students<br />
conduct some preliminary research on<br />
spectral types and develop questions to<br />
ask the astronomer.<br />
Verbal, Visual<br />
3<br />
ASSESS<br />
Evaluate<br />
Understanding<br />
Provide students with the temperature,<br />
color, absolute brightness, and star<br />
type (white dwarf, main sequence, and<br />
so on) for a set of stars. Have them<br />
construct their own H-R diagrams.<br />
Reteach<br />
Use graphics to emphasize how the<br />
absolute brightness of a star depends on<br />
its surface temperature and its size. Draw<br />
a small circle to represent a small star.<br />
Draw a large circle to represent a large<br />
star. Pointing to the circles, explain that if<br />
two stars have equal temperatures, then<br />
they emit the same amount of light from<br />
each square kilometer of their surfaces.<br />
The star that is larger therefore has a<br />
greater absolute brightness.<br />
Solutions<br />
7. (2.49 10 15 km)/(9.5 10 12 km/<br />
light-year) 260 light-years<br />
8. (427 light-years) (9.5 10 12 km/<br />
light-year) 4.1 10 15 km<br />
If your class subscribes<br />
to the Interactive Textbook, use it to<br />
review key concepts in Section <strong>26.2</strong>.<br />
Answer to . . .<br />
Figure 13 The sun has a higher<br />
surface temperature. Aldebaran has a<br />
greater absolute brightness.<br />
L2<br />
L2<br />
L1<br />
Exploring the Universe 839