CS 341: Halloween Costume Predictions using Twitter - SNAP
CS 341: Halloween Costume Predictions using Twitter - SNAP
CS 341: Halloween Costume Predictions using Twitter - SNAP

Create successful ePaper yourself
Turn your PDF publications into a flip-book with our unique Google optimized e-Paper software.
<strong>CS</strong> <strong>341</strong>: <strong>Halloween</strong> <strong>Costume</strong> <strong>Predictions</strong> <strong>using</strong> <strong>Twitter</strong><br />
Anirudh Venkatesh, Onkar Dalal, Praveen Bommannavar<br />
Introduction<br />
For this project we had access to Walmart's sales data from the Northern Illinois region for<br />
October 7, 2011 - November 7, 2011 as well as 3 billion tweets from a similar time frame. We<br />
began this project with an aim to predict the sales of <strong>Halloween</strong> costumes for Walmart <strong>using</strong><br />
<strong>Twitter</strong> as a signal. The analysis we conducted showed that one could indeed correlate the<br />
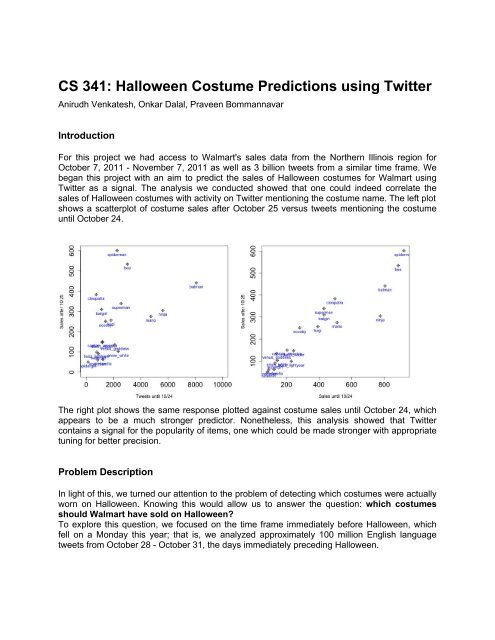
sales of <strong>Halloween</strong> costumes with activity on <strong>Twitter</strong> mentioning the costume name. The left plot<br />
shows a scatterplot of costume sales after October 25 versus tweets mentioning the costume<br />
until October 24.<br />
The right plot shows the same response plotted against costume sales until October 24, which<br />
appears to be a much stronger predictor. Nonetheless, this analysis showed that <strong>Twitter</strong><br />
contains a signal for the popularity of items, one which could be made stronger with appropriate<br />
tuning for better precision.<br />
Problem Description<br />
In light of this, we turned our attention to the problem of detecting which costumes were actually<br />
worn on <strong>Halloween</strong>. Knowing this would allow us to answer the question: which costumes<br />
should Walmart have sold on <strong>Halloween</strong>?<br />
To explore this question, we focused on the time frame immediately before <strong>Halloween</strong>, which<br />
fell on a Monday this year; that is, we analyzed approximately 100 million English language<br />
tweets from October 28 - October 31, the days immediately preceding <strong>Halloween</strong>.
Related Work<br />
Many recent attempts have been made to form predictions based on activity on <strong>Twitter</strong>. Asur<br />
and Huberman show that the success of newly released movies can be forecasted <strong>using</strong><br />
sentiment analysis on tweets relevant to movie titles [1], while Bollen and Mao use moods<br />
contained in tweets to predict the stock market [2]. More recently, Globalpoint Research did a<br />
sentiment analysis of tweets related to the New Hampshire primary to accurately predict the<br />
outcome [4].<br />
The methods which we shall employ in this work are closely related to those presented in [3],<br />
where Agichtein and Gravano describe a method which they term ‘Snowball,’ for generating a<br />
table of relations between keywords and attributes of interest. This method begins with seed<br />
keywords and attributes, and finds relevant contexts around which these appear. Using these<br />
contexts, additional items are added to the table.<br />
Methodology:<br />
Our methodology for mining the <strong>Twitter</strong> data for costumes which were worn on <strong>Halloween</strong><br />
follows the approach taken in [3], with modifications to account for the fact that we are simply<br />
searching for relevant costumes rather than any attribute in particular. That is, while the<br />
Snowball method looks for structured relations of the form<br />
Organization => Location<br />
Microsoft => Redmond<br />
Exxon => Irving<br />
IBM => Armonk<br />
we are simply interested in popular costumes. This introduces additional challenges, which we<br />
shall describe in detail. Also, we incorporated helper keywords to guide our search, an element<br />
not present in [3]. Specifically, whereas the Organization=> Location example looked through all<br />
documents mentioning some seed organizations with the mention of a seed location, we guided<br />
the search for halloween costume by first filtering tweets on reliable keyword surrogates.<br />
The procedure we used is outlined below:<br />
Step 1: Generate keywords that are relevant to our task<br />
Although a number of alternatives exist for this step, we looked for words co-occurring with the<br />
terms {halloween, costume, dress up} by looking for large values of<br />
P[word | {halloween} or {costume} or {dress up}] - P[word].<br />
Large values correspond to a word being strongly associated with the<br />
terms “halloween”, “costume” or “dress up”. Other alternatives are dividing by P[word] rather<br />
than subtracting, or multiplying by inverse document frequency (IDF).<br />
Step 2: Context generation<br />
Part a)<br />
In this part, tweets are inspected for the presence of costume seeds (such as batman or<br />
zombie) and surrounding so-called contexts are given points for each particular costume<br />
depending on the number of keywords (from Step 1) that appear in the tweet.
Here, a context is defined as a tuple (l_context, r_context)where l_context<br />
corresponds to a sequence of words appearing before a costume name, and r_context<br />
corresponds to a sequence of words appearing after a costume name.<br />
When this part is complete, we can organize the point totals into a matrix where rows<br />
correspond to different contexts and columns correspond to different costumes. The point total<br />
for context i and costume j is denoted by value_ij in the table below.<br />
costume_1 costume_2 costume_3 …<br />
(l_context, r_context)_1 value_11 values_12 value_13 …<br />
(l_context, r_context)_2 value_21 values_22 value_23 …<br />
(l_context, r_context)_3 value_31 values_32 value_33 …<br />
Part b)<br />
Using this matrix, we score each of these rows, making sure to account for diversity, that is, we<br />
give a context greater credibility if many costumes are expressed <strong>using</strong> that context. The score<br />
is also increased if the values are high.<br />
The specific mechanism by which scores are computed is as follows:<br />
● Each costume j can give a context i at most two points.<br />
○ One point is given for the presence of context i (indicator variable) in any tweet<br />
about costume j.<br />
○ The fraction log(1 + value_ij)/log(1 + max_i(costume_j)) points<br />
are given to emphasize the value. The quantity max_i(costume_j) is the<br />
maximum point total of costume j over all contexts.<br />
From the computed scores for each context, we produce a short-list of costumes that have at<br />
least a threshold score. This is to ensure that all contexts we choose have enough frequency<br />
with any given costume, but also have a large enough diversity (in other words, the context is<br />
expressed along with a sufficient number of different seed costumes). After accounting for the<br />
score threshold, we have a shortlist of roughly 150 contexts.<br />
Step 3: <strong>Costume</strong> prediction<br />
The final phase of our procedure involves <strong>using</strong> the generated keywords from Step 1 and the<br />
generated contexts from Step 2, along with their associated scores, to output a more extensive<br />
set of valid <strong>Halloween</strong> costumes than is given by the seed set of costumes. To do this, we<br />
examine tweets in the time period from October 28 - October 31 and generate candidate<br />
costume names based on proximity to all input contexts. For example, for the context (“dress<br />
up as” , “for <strong>Halloween</strong>”), the candidate costumes produced would be the sequence of words<br />
that occurs between “dress up as” and “for <strong>Halloween</strong>” over all the input tweets. In the case<br />
that a context is completely on the right side or left side (e.g. (“want to dress up as”, “”) ), we<br />
generate candidate costumes of up to 3 words in length preceding or following the context,<br />
respectively.
For each generated costume j, we compute and output an aggregate score total as follows:<br />
total = 0<br />
● For every tweet in which costume j is flanked by any of the input contexts:<br />
○ For every occurrence of an input keyword, add the associated score of that<br />
keyword (as computed in Step 1) to total<br />
○ For every occurrence of an input context, add the associated score of that<br />
context (as computed in Step 2) to total<br />
To prevent skewing of computed total score by retweeted tweets, we omit tweets that have “RT<br />
@” in them from consideration. While this reduces the error caused by the retweets, we were<br />
unable to eliminate the retweets where the tweet text was copied with an additional remarks.<br />
Using the computed aggregate score total for each costume as a measure of its relevance<br />
as a <strong>Halloween</strong> costume, we can then rank the generated costumes by aggregate score to<br />
produce a list of the costumes most likely worn during <strong>Halloween</strong> in 2011.<br />
Results:<br />
We now give the inputs and outputs associated with each step of the procedure outlined above.<br />
In our analysis, we began with the seed costume set<br />
C = {banana, batman, catwoman, devil, lady gaga, nicki minaj, nurse, pirate,<br />
spiderman, superman,vampire, zombie}<br />
Keywords:<br />
We obtained the following list of keywords occurring with {halloween, costume, dress up}.<br />
The bold words have been manually selected as relevant keywords for which we shall give extra<br />
points for tweets containing them.<br />
['halloween', 'costume', 'a', 'for', 'as', 'happy', 'costumes', 'up', 'my', '<br />
party', 'dressed', 'dress', 'tonight', 'be', 'to', 'this', 'dressing', 'and',<br />
'going', 'the', 'in', 'wear', 'or', 'year', 'on', 'happyhalloween', 'is', 'ca<br />
ndy', 'have', 'slut', 'what', 'trick', 'everyone', 'wearing', 'kids', 'weeken<br />
d', 'gonna', 'of', 'out', 'your', 'girls', "it's", 'tomorrow', 'best', 'night<br />
', 'scary', 'ur', 'today', 'its', 'all', 'are', 'i', 'slutty', 'was', 'just'<br />
, 'last', 'at', 'some', 'think', 'school', 'cute', "i'm", 'little', 'fun', 's<br />
ee', 'go', 'their', 'not', 'treating', 'so', 'should', 'treat', 'wait', 'sexy<br />
', 'ready', 'look', 'macmiller', 'dont', "don't", 'monday', 'contest', 'pumpk<br />
in', 'our', 'excited', 'seen', 'lord_voldemort7', 'being', 'parties', 'need',<br />
'idea', 'if', 'dear', 'these', 'people', 'pics', 'work', 'ideas', 'celebrate'<br />
, 'any', 'cat', 'day', 'ever', 'mycostume', 'kid', 'snow', 'lil', 'got', 'saw<br />
', 'zombie', 'minute', 'sluts', 'old', 'awesome', 'an', 'girl', 'face', 'get'<br />
, 'christmas', 'with', 'outfit', 'pic', 'part', 'house', 'most', 'put', 'enou<br />
gh', 'mask', 'years', 'witch', 'door', 'even', 'lady', 'yet']<br />
Contexts:<br />
A sample of the highest-scoring contexts with associated scores are given:<br />
to dress up as| 14.559763 be a|for halloween 12.851941<br />
a|costume for halloween 11.541077 dress up as a| 10.941845<br />
to be|for halloween 10.555063 to be a|for 10.192246
going to be a| 10.137222 wanna be|for halloween 10.133323<br />
gonna be|for halloween 10.026384 to be a|for halloween 9.980893<br />
dress up as|for 9.882041 being a|for halloween 9.650323<br />
i wanna be a| 9.621495 up as a|for 9.527579<br />
as a|for halloween 9.451828 should be|for halloween 9.416168<br />
gonna be a|for 9.408806 gonna be a|for halloween 9.301002<br />
going to be a|for 9.271627 i'm gonna be a| 9.239245<br />
dress up as a|for 9.227627 i'm going to be a| 9.107306<br />
going to be a|for halloween 9.10595<br />
<strong>Costume</strong>s:<br />
In the next step, we use these contexts to generate a list of costumes which occur in the specific<br />
context order from the tweets belonging the four days prior to <strong>Halloween</strong>. The results generated<br />
produced costume names with precision 78.3% and the same process on tweets from fourteen<br />
days before <strong>Halloween</strong> generated costumes with precision 75.7%. These precision values are<br />
the percentages of actual costumes among the candidate costumes generated, values were<br />
evaluated by manual inspection of results. The numbers can be explained by the adjectives<br />
picked and the longer phrases picked from the contexts which have only left or right phrase.<br />
Also, the difference between the precisions can be explained by the increasing relevance of the<br />
tweets (with the seed costumes and the contexts) to <strong>Halloween</strong> as the day approaches.<br />
The following is the list of 50 highest-scoring costumes generated from <strong>using</strong> all tweets from the<br />
four day window preceding <strong>Halloween</strong> (October 28 - October 31) as input. The found costumes<br />
are displayed along with associated score:<br />
cat 3255.7 zombie 1333.5 nerd 1273.65<br />
witch 1065.75 vampire 946.4 pirate 821.45<br />
pumpkin 789.6 ghost 698.95 hipster 676.55<br />
clown 579.95 bunny 578.9 devil 561.05<br />
princess 557.2 stripper 493.15 cop 488.95<br />
carrot 460.25 spoon 445.2 banana 437.5<br />
iphone 5 426.65 hippie 424.55 nurse 414.75<br />
kitty 407.4 nun 405.6 ninja 401.8<br />
angel 376.6 fairy 370.65 eskimo 362.95<br />
sexy pan am stewardess 323.4 cowgirl 315.35 indian 305.9<br />
playboy bunny 303.8 cow 302.4<br />
football player 288.75 normal person 284.9 mexican 281.4<br />
smurf 269.5 nicki minaj 267.05 hobo 254.45<br />
prostitute 253.4 cowboy 234.85 cheerleader 233.8<br />
leprechaun 225.75 angry bird 208.25 bumble bee 206.15<br />
tiger 204.75 lion 203.0 muggle 200.9<br />
school girl 199.15 sailor 198.1 penguin 193.2<br />
To examine whether we can predict consumption of the popular (high-scoring) costumes that<br />
we display in the previous table from tweets earlier in the month, we run Step 3 of our algorithm<br />
over all texts in the period of 14 days before <strong>Halloween</strong>, to produce the following results for top<br />
50 high-scoring costumes:<br />
cat 1467.55 zombie 930.3 pirate 805.7<br />
vampire 787.15 cop 684.2 princess 540.75<br />
pumpkin 502.25 nerd 493.5 bunny 485.45<br />
witch 471.45 playboy bunny 427.7 nun 425.95<br />
banana 424.2 angry bird 419.65 clown 415.1<br />
ghost 402.85 ninja 388.15 stripper 380.1
indian 370.3 nurse 368.2 slutty xbox 325.5<br />
ups delivery man 324.1 smurf 322.3 fairy 311.85<br />
sailor 307.3 kitty 287.35 angel 284.2<br />
ninja turtle 267.4 hipster 266.3 devil 263.2<br />
unicorn 261.8 hooters girl 255.5 power ranger 252.7<br />
nicki minaj 251.3 hippie 241.85 lion 241.15<br />
crayon 232.4 cowgirl 229.95 cow 209.65<br />
chocolate m&m 209.3 brick 200.55 carrot 198.8<br />
cheerleader 198.45 snooki 197.05 amy winehouse 194.95<br />
patriot 194.6 lady gaga 190.05 mermaid 187.95<br />
cowboy 181.65 football player 173.95<br />
Comparing the two sets, 35 out of 50 costumes (Jaccard similarity of 0.54) predicted from the<br />
fourteen-days tweet data were also obtained in the four-days tweet data. This large overlap<br />
gives validity to the predictions obtained over the fourteen-day time period. It shows that<br />
contexts generated in Step 2 are clearly linked with <strong>Halloween</strong> costumes since potential noise<br />
from the entire 14-day period does not skew the costume generation results too far from those<br />
of the 4 day window immediately prior to <strong>Halloween</strong>. Thus, we can see that the procedure we<br />
use allows for utilizing tweet data from an earlier time period (in this case fourteen days) to<br />
actually predict which <strong>Halloween</strong> costumes will be popular to a reasonable degree.<br />
Validation:<br />
We compare the costume predictions with the results of the survey conducted by the National<br />
Retail Federation http://www.nrf.com/modules.php?name=News&op=viewlive&sp_id=1200<br />
about popular <strong>Halloween</strong> costumes across the United States in 2011 (see Appendix for details).<br />
For the purposes of validation, we believe this source is a valid “ground truth” as to which<br />
costumes people actually wore for <strong>Halloween</strong> 2011.<br />
By comparing the top costume results that our algorithm predicted with the top 20 most popular<br />
<strong>Halloween</strong> costumes among adults from this survey, we see that 15 out of the top 20 costumes<br />
were produced by our algorithm as one of the top 50 costumes worn during <strong>Halloween</strong> in 2011.<br />
Thus, we can see that not only did our algorithm produce mostly feasible costume results (as<br />
evidenced by 78% precision), but the costumes it generated as being popularly worn in the 4day<br />
time window before <strong>Halloween</strong> were correct to a reasonable degree, based on the results of<br />
this survey.<br />
Conclusions:<br />
In this project, we ran one iteration of the 3 Step method outlined above in order to generate a<br />
larger set of <strong>Halloween</strong> costumes. By running more iterations, <strong>using</strong> the output set of costumes<br />
from the previous iteration as the seed set of the next iteration, we can in-turn generate more<br />
contexts, and thus, more candidate <strong>Halloween</strong> costumes. However, with the precision values<br />
that we received above after one iteration (roughly 78%) , running further iterations of this<br />
procedure would require a quality scoring function else we run into the risk of introducing a large<br />
number false positives into the costume predictions. Since we prune the contexts generated<br />
to account for diversity, the set of ‘all contexts’ is not well-defined and hence, there is no<br />
easy way to compute the recall. However, a possible proxy for the set of ‘all contexts’ would<br />
be to generate an extended list of contexts based on the newly generated costumes (again<br />
accounting for the diversity).
The results of this project could have great utility for Walmart. From our analysis, and by looking<br />
at the set of costumes sold by Wamart (from the Walmart data set), we find that several of the<br />
highest-scoring costumes that we observe to be the most likely to be worn during <strong>Halloween</strong><br />
2011 were not carried in Walmart stores at that time. The following are examples of such<br />
costumes:<br />
nerd 1273.65 hipster 676.55 carrot 460.25<br />
spoon 445.2 iphone 5 426.65 nun 405.6<br />
eskimo 362.95 nicki minaj 267.05 angry bird 208.25<br />
These costumes can be used to answer the question raised in the problem statement about<br />
which costumes Walmart should have sold. As these costumes are observed in our analysis<br />
to be likely candidates for popular <strong>Halloween</strong> costumes in 2011, it probably would have been<br />
profitable for Walmart to include several of these in its 2011 <strong>Halloween</strong> costume offerings.<br />
In addition, the implication we notice that tweets from an earlier time window can be used to<br />
predict costumes that will be worn during the <strong>Halloween</strong> time window to a reasonable degree<br />
could be extended and applied to a variety of other similar problems. Such applications of <strong>using</strong><br />
social data for prediction could potentially give Walmart valuable information about the types of<br />
products that are currently trending that their stores currently do not carry.<br />
References:<br />
[1] Predicting the Future with Social Media, Sitaram Asur and Bernardo Huberman, in<br />
Proceedings of the 2010 IEEE/WIC/ACM International Conference on Web Intelligence and<br />
Intelligent Agent Technology<br />
[2] <strong>Twitter</strong> mood predicts the stock market, Journal of Computational Science, 2(1), March 2011,<br />
Pages 1-8<br />
[3] Snowball: Extracting Relations from Large Plain-Text Collections, Eugene Agichtein and<br />
Luis Gravano, in Proceedings of the 5th ACM International Conference on Digital Libraries (DL),<br />
2000<br />
[4] http://mashable.com/2012/01/10/twitter-primary/<br />
Acknowledgement:<br />
We are extremely grateful to our mentor, Prof. Anand Rajaraman, for his constant guidance in<br />
this project and for taking the time out of his busy schedule to meet with us each week. We also<br />
would like to thank Prof. Jeff Ullman, Prof. Andreas Weigend, and Prof. Jure Leskovec for their<br />
support.<br />
Appendix:<br />
http://www.nrf.com/modules.php?name=News&op=viewlive&sp_id=1200<br />
Ranks for Adults:<br />
1 Witch 13.4% 7,305,503<br />
2 Pirate 3.9% 2,107,817<br />
3 Vampire 3.7% 2,012,007
4 Zombie 3.0% 1,628,768<br />
5 Batman Character 2.2% 1,221,576<br />
6 Cat 2.2% 1,197,623<br />
7 Wench/Tart/Vixen 2.1% 1,125,766<br />
8 Ghost 1.5% 838,336<br />
9 Nurse 1.4% 766,479<br />
10 Scary <strong>Costume</strong> 1.2% 670,669<br />
Ranks for Kids:<br />
1 Princess 11.0% 5,134,868<br />
2 Witch 4.4% 2,058,908<br />
3 Spider-Man 3.1% 1,438,755<br />
4 Pirate 2.8% 1,314,725<br />
5 Pumpkin 2.8% 1,289,918<br />
6 Fairy 2.6% 1,215,500<br />
7 Action/Super Hero 2.5% 1,190,694<br />
T8 Batman 2.4% 1,141,082<br />
T8 Vampire 2.4% 1,141,082<br />
T9 Disney Princess 2.2% 1,041,857