
Create successful ePaper yourself
Turn your PDF publications into a flip-book with our unique Google optimized e-Paper software.
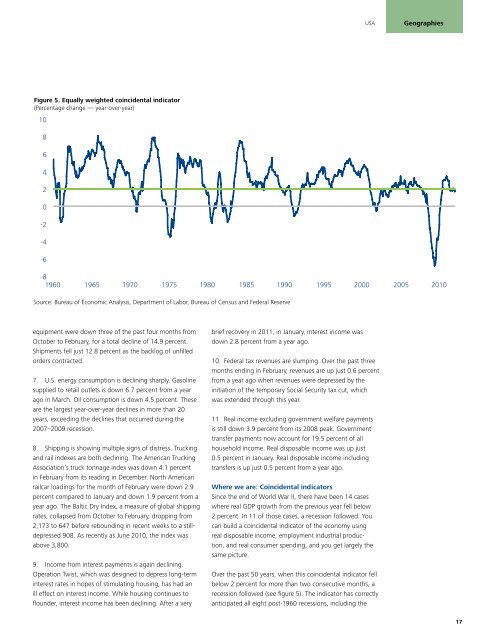
Figure 5. Equally weighted coincidental indicator<br />
(Percentage change — year-over-year)<br />
10<br />
8<br />
6<br />
4<br />
2<br />
0<br />
-2<br />
-4<br />
-6<br />
USA<br />
Geographies<br />
-8<br />
1960 1965 1970 1975 1980 1985 1990 1995 2000 2005 2010<br />
Source: Bureau <strong>of</strong> Economic Analysis, Department <strong>of</strong> Labor, Bureau <strong>of</strong> Census and Federal Reserve<br />
equipment were down three <strong>of</strong> the past four months from<br />
October to February, for a total decline <strong>of</strong> 14.9 percent.<br />
Shipments fell just 12.8 percent as the backlog <strong>of</strong> unfilled<br />
orders contracted.<br />
7. U.S. energy consumption is declining sharply. Gasoline<br />
supplied to retail outlets is down 6.7 percent from a year<br />
ago in March. Oil consumption is down 4.5 percent. These<br />
are the largest year-over-year declines in more than 20<br />
years, exceeding the declines that occurred during the<br />
2007–2009 recession.<br />
8. Shipping is showing multiple signs <strong>of</strong> distress. Trucking<br />
and rail indexes are both declining. The American Trucking<br />
Association’s truck tonnage index was down 4.1 percent<br />
in February from its reading in December. North American<br />
railcar loadings for the month <strong>of</strong> February were down 2.9<br />
percent compared to January and down 1.9 percent from a<br />
year ago. The Baltic Dry Index, a measure <strong>of</strong> global shipping<br />
rates, collapsed from October to February, dropping from<br />
2,173 to 647 before rebounding in recent weeks to a stilldepressed<br />
908. As recently as June 2010, the index was<br />
above 3,800.<br />
9. Income from interest payments is again declining.<br />
Operation Twist, which was designed to depress long-term<br />
interest rates in hopes <strong>of</strong> stimulating housing, has had an<br />
ill effect on interest income. While housing continues to<br />
flounder, interest income has been declining. After a very<br />
brief recovery in 2011, in January, interest income was<br />
down 2.8 percent from a year ago.<br />
10. Federal tax revenues are slumping. Over the past three<br />
months ending in February, revenues are up just 0.6 percent<br />
from a year ago when revenues were depressed by the<br />
initiation <strong>of</strong> the temporary Social Security tax cut, which<br />
was extended through this year.<br />
11. Real income excluding government welfare payments<br />
is still down 3.9 percent from its 2008 peak. Government<br />
transfer payments now account for 19.5 percent <strong>of</strong> all<br />
household income. Real disposable income was up just<br />
0.5 percent in January. Real disposable income including<br />
transfers is up just 0.5 percent from a year ago.<br />
Where we are: Coincidental indicators<br />
Since the end <strong>of</strong> World War II, there have been 14 cases<br />
where real GDP growth from the previous year fell below<br />
2 percent. In 11 <strong>of</strong> those cases, a recession followed. You<br />
can build a coincidental indicator <strong>of</strong> the economy using<br />
real disposable income, employment industrial production,<br />
and real consumer spending, and you get largely the<br />
same picture.<br />
Over the past 50 years, when this coincidental indicator fell<br />
below 2 percent for more than two consecutive months, a<br />
recession followed (see figure 5). The indicator has correctly<br />
anticipated all eight post-1960 recessions, including the<br />
17