Step Frequency Radar Using Compressed Sensing - wiki
Step Frequency Radar Using Compressed Sensing - wiki
Step Frequency Radar Using Compressed Sensing - wiki

You also want an ePaper? Increase the reach of your titles
YUMPU automatically turns print PDFs into web optimized ePapers that Google loves.
<strong>Step</strong> <strong>Frequency</strong> <strong>Radar</strong> <strong>Using</strong> <strong>Compressed</strong><br />
<strong>Sensing</strong><br />
Ioannis Sarkas<br />
996023841<br />
I. INTRODUCTION<br />
The current and advent progress in semiconductor technologies will allow the development<br />
of integrated circuits operating in frequency ranges well above 100 GHz. This development will<br />
the utilization of the unallocated bandwidth available in this frequency range for a multitude of<br />
applications including high data rate wireless communications as well as radars for civilian applications.<br />
For example, even today, the 77 GHz automotive collision avoidance radar represents<br />
a landmark progress due to each potential to save thousands of lives every year, by providing to<br />
the driver of a vehicle early warning of a possible collision with another vehicle or a pedestrian.<br />
Following the collision avoidance example, radars for other commercial applications can be<br />
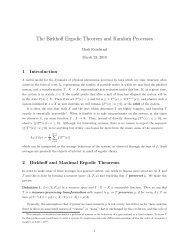
developed. In this report, the possibility of a radar for non-contact respiration rate monitoring<br />
as graphically illustrated in figure 1 is investigated. As shown in the figure, a radar transceiver<br />
is placed in a position that has Line-of-Sight contact with the thorax of a sleeping patient. By<br />
accurately measuring the distance to the patient’s thorax, several times a second, the minute<br />
displacements caused due to respiration are recorded. These data are used in a later stage for<br />
calculation and evaluation of the patient’s respiration pattern. By knowing this pattern for a<br />
period of several days, a medical doctor can evaluate whether the patient suffers from a sleep<br />
disorder such as sleep apnea.<br />
The range accuracy (resolution) requirement for this application, as well as many other similar<br />
applications, is of the order of 1 mm. As will be shown in the following sections, this accuracy<br />
requirement is particularly challenging to meet using standard radar processing. Therefore, an<br />
alternative technique using basis pursuit reconstruction is explored. Various target separation and<br />
noise scenarios are explored and different reconstruction methods are evaluated.<br />
II. STEP FREQUENCY RADAR<br />
There are different types of radar that can be utilized for accurate distance measurement [1].<br />
In this work, we selected the <strong>Step</strong> <strong>Frequency</strong> <strong>Radar</strong> (SFR), which was originally introduced<br />
in [2], as a non-real-time Time-Domain-Reflectometer, and was later further analyzed in [3], [4].<br />
This type of radar was selected due to its relatively waveform, i.e the signal waveform that the<br />
radar transmits and processes in order to calculate the distance. The step frequency radar utilizes<br />
continuous wave sinusoids of different frequencies i.e., during each measurement, a sinusoid of<br />
only one frequency is transmitted, received and processed thus greatly simplifying the signal<br />
generation, reception and digitization.<br />
This operation is illustrated in figure 2. A wireless transmitter transmits a continuous wave<br />
of constant frequency. The wave is reflected back by the N targets located inside the radar field<br />
of view. The reflected signal is collected by the receiver which in turn, it frequency shifts the<br />
signal and moves it into lower frequency where it can be digitized and processed by a digital<br />
processor.<br />
1
<strong>Radar</strong><br />
Transmitter<br />
&<br />
Receiver<br />
Fig. 1: Non contact respiration rate monitoring.<br />
<strong>Radar</strong><br />
Transmitter<br />
&<br />
Receiver<br />
Fig. 2: Monostatic radar<br />
Reflecting<br />
Target<br />
In order to analyze the radar operation, it is useful to assume first that there is only one target,<br />
which is denoted as target n in figure 2. The transmitted signal by the radar is a essentially<br />
electromagnetic plane wave of frequency f :<br />
TX(t)=e 2πift<br />
In the above equation, as well as in the remainder of this work, we will express sinusoidal<br />
signals in the analytical representation, i.e. as complex exponentials. Furthermore, the transmit<br />
signal amplitude is normalized to 1.<br />
The signal is reflected back from the target before is collected by the receiver antenna. During<br />
this process, it is subjected to attenuation, due to the free space loss, as well as time delay,<br />
since it travels a total distance of 2Rn. Accounting for these effects, the signal at the input of<br />
the receiver will be:<br />
RX(t)= σn<br />
A(Rn) e2πif(t−τn)<br />
2<br />
(1)<br />
(2)
where σn is the target reflectivity1 , which assumes values in the range (0,1). τn is the total time<br />
the signals needs to reach the target, be reflected, and travel back to the receiver. Since the EM<br />
wave travels with the speed of light c, the propagation delay is τn = 2Rn<br />
c . A(Rn) is the free-space<br />
propagation loss, which is a function of the distance Rn. In the case of direct Line-of-Sight<br />
propagation with no additional parasitic reflectors (such as the ground), A(Rn) can be expressed<br />
as:<br />
<br />
4π(2Rn) f<br />
2 <br />
8πRn f<br />
2 A(Rn)=<br />
=<br />
(3)<br />
c<br />
c<br />
The receiver collects the signal of equation (2), amplifies it and multiplies by the complex<br />
conjugate replica of the transmitted signal, yielding the output for the nth target:<br />
rn = G · RX(t) · TX(t)= Gσn<br />
A(Rn) e2πif(t−τn) −2πift Gσn<br />
· e =<br />
A(Rn) e−2πifτn (4)<br />
Where G is the total system gain. It can be seen that the output of the receiver is a complex<br />
number, representing the amplitude reduction and phase shift of the signal due to the target n.<br />
In the case of N total targets, the output is the sum of all amplitude and phase shift terms:<br />
y( f )=<br />
N<br />
∑ rn =<br />
n=1<br />
N<br />
∑<br />
n=1<br />
Gσn<br />
A(Rn) e−2πiftn =<br />
N<br />
2Rn −2πif<br />
∑ ane c (5)<br />
n=1<br />
where an = Gσn<br />
A(Rn) .<br />
For now, let us assume that we have perfect knowledge of y( f ), which will be referred to as<br />
channel transfer function, a term used extensively in mobile communications. As an example,<br />
the magnitude of y( f ) over frequency is illustrated in figure 3 when 3 targets are present and<br />
at distances of R1 = 1m, R2 = 1m + 5mm and R3 = 1.5m. As expected, since y( f ) is a sum of<br />
sinusoids, it is a periodic function of frequency. The largest bandwidth block in the waveform<br />
is known as the coherence bandwidth (a term also used extensively in mobile communications)<br />
and depends upon the smallest target separation, i.e. R2 − R1 = 5mm in our case. Inside each<br />
coherence bandwidth ”lobe”, as depicted in figure 3, the channel transfer function is also periodic,<br />
this period now depends upon the larger separation of R3 − R1 = 0.5m.<br />
The locations of the targets can be easily calculated, assuming knowledge of y( f ), by calcu-<br />
lating the inverse Fourier transform:<br />
F −1 {y( f )} =<br />
=<br />
=<br />
∞<br />
−∞<br />
N<br />
∑<br />
n=1<br />
<br />
N<br />
∑<br />
n=1<br />
∞<br />
an<br />
−∞<br />
N<br />
∑ anδ(t − τn)=<br />
n=1<br />
ane −2πifτn<br />
<br />
e 2πift df (6)<br />
e 2πif(t−τn) df =<br />
N <br />
∑ anδ<br />
n=1<br />
t − 2Rn<br />
c<br />
Consequently, the inverse Fourier transform of the channel transfer function is a series of N<br />
delta functions that ”sit” at the target locations. The amplitude of the delta function located at<br />
target n is equal to the coefficient an defined above.<br />
1For perfect conductors, σn = e−iπ , however, we will ignore the 180◦ phase shift, since it will be introduced in all frequencies<br />
and will not affect the detection.<br />
<br />
3
1<br />
0.8<br />
0.6<br />
0.4<br />
0.2<br />
1<br />
0.8<br />
0.6<br />
0.4<br />
Coherence<br />
Bandwidth<br />
120 125<br />
0 20 40 60 80 100 120 140 160 180 200<br />
Fig. 3: Example channel transfer function<br />
Sampling<br />
Bandwidth<br />
Sampling<br />
Point<br />
0.2<br />
112 114 116 118 120 122 124 126 128<br />
Fig. 4: <strong>Step</strong> frequency radar sampling procedure<br />
The above analysis reveals that by conducting sinusoidal measurements in the free space,<br />
in presence of reflective targets, we can determine the target distances by calculating a simple<br />
inverse Fourier transform. Nevertheless, in practice the full channel transfer function y( f ) cannot<br />
be exactly known. In the case of step frequency radar, we can only measure discrete samples<br />
of y( f ) at a set of frequencies f1, f2,..., fK. Furthermore, these frequencies can only be located<br />
inside a predetermined frequency block. This stems from the fact that at high frequencies, most<br />
electronic systems exhibit narrowband characteristics and can typically operate inside a frequency<br />
range that is typically 5 − 10% of their center frequency. For example, a system designed for<br />
operation at 120 GHz can typically operate in the 114 GHz - 126 GHz frequency range. This<br />
sampling procedure is illustrated in figure 4.<br />
In order to calculate the distance to the targets based on the discrete samples of the channel,<br />
we need to utilize the Inverse Discrete Fourier Transform (IDFT). First, it is assumed that the<br />
4
frequencies of the sampling points f1, f2,..., fK are uniformly distributed and the frequency<br />
spacing among two consecutive samples is Δ f = fl − fl−1:<br />
{ f1, f2, f3,..., fK} = { f1, f1 + Δ f , f1 + 2Δ f ,..., f1 + KΔ f } (7)<br />
As a result, we can calculate the IDFT of the sampled data:<br />
⎡ ⎤ ⎡ ⎤<br />
t1 y( f1)<br />
⎢t2<br />
⎥ ⎢y(<br />
f2) ⎥<br />
⎢ ⎥<br />
⎣<br />
.<br />
⎦ = F−1 ⎢ ⎥<br />
K ⎣<br />
.<br />
⎦<br />
y( fK)<br />
tK<br />
As expected from equation (6), the l th entry of the vector on the left hand side of (8)<br />
corresponds to a particular distance from the radar (l · ΔR), l = 0,1,...,K. If a target is not<br />
present at distance (l · ΔR), then the l th entry of the vector will be zero. If a target is present,<br />
the corresponding l th entry will be equal to the target an (defined in equation (5).<br />
In order to calculate the resolution ΔR, we need to employ the Shannon-Nyquist sampling<br />
theorem. The total sampled frequency bandwidth by the step frequency radar is BW = K Δ f .As<br />
a result, the sampling period in time domain is:<br />
Δt = 1<br />
2KΔ f<br />
= 1<br />
2 BW<br />
However, this period corresponds to a distance based on the formula:<br />
Δt = ΔR<br />
(10)<br />
c<br />
Therefore, the distance resolution is:<br />
ΔR = c c<br />
= (11)<br />
2KΔ f 2 BW<br />
Furthermore, since we have K samples of distance ΔR, the maximum range of unambiguous<br />
detection is:<br />
Ru = K ΔR = c<br />
(12)<br />
2Δ f<br />
Equations (11) and (12) represent the two most fundamental limits of the step frequency radar,<br />
namely, the resolution is proportional to the bandwidth while the range is proportional to the<br />
frequency step. Moreover, equation (11), which was derived from the fundamental properties of<br />
the Fourier transform, can be extended to every continuous wave radar [5].<br />
For respiration rate monitoring, as well as other applications such as texture evaluation, the<br />
required resolution is at least 1mm. Equation (11) for this case predicts the necessary bandwidth<br />
of BW = c<br />
2 ΔR = 150GHz. This bandwidth requirement will be impossible to be met using stateof-the<br />
art electronics.<br />
Driven by this limitation, an alternative method to IDFT for calculating the target distances<br />
from the available channels transfer function samples needs to be explored. In this work, we<br />
will evaluate the performance of reconstruction using compressed sensing. The accuracy of the<br />
method will be evaluated based on different target placement scenarios, as well as different kinds<br />
and variances of noise.<br />
5<br />
(8)<br />
(9)
III. STEP FREQUENCY RADAR USING COMPRESSED SENSING<br />
The author’s interest for using compressed sensing was driven by a well known, but confusing<br />
result that contradicts equation (11). If we assume that only one target is present, then equation<br />
(5) reduces to:<br />
y( f )=ae −2πifτ<br />
(13)<br />
i.e. there is only a single complex exponential. Furthermore, the amplitude in now constant<br />
over frequency and there is only a linear phase change with frequency. Assuming that only two<br />
frequency measurements are conducted:<br />
y( f1) = ae −2πif1τ<br />
(14)<br />
y( f2) = ae −2πif2τ<br />
the phase of<br />
y( f1)<br />
y( f2)<br />
can be easily found to be:<br />
y( f1)<br />
∠<br />
y( f2) = ∠e−2πi( f1− f2)τ<br />
= 2πΔ f τ (15)<br />
by simply dividing by 2πΔ f , τ and therefore R are calculated:<br />
R =<br />
τ c<br />
2<br />
= c<br />
4πΔ f<br />
· ∠y( f1)<br />
y( f2)<br />
Therefore, in the single target case, using equation (16) 2 , we can measure the distance with<br />
infinite resolution by conducting only two measurements, even though the range constraint of<br />
equation (12) still holds.<br />
The above result looks surprising similar to L0 reconstruction: Two measurements are conducted<br />
and the sparsest solution (i.e. one target) that satisfies the measured data is evaluated.<br />
Since there is actually only one target, perfect reconstruction is achieved. Driven by this result,<br />
we will further investigate the reconstruction from step-frequency data using compressed sensing.<br />
By examining equation (8), we observe that the SFR reconstruction problem is a good<br />
candidate to apply compressed sensing. First, the measurements are collected in an orthogonal<br />
basis (i.e. Fourier basis) and second, the vector on the left hand side of (8) is N-sparse, N being<br />
the the number of targets. <strong>Compressed</strong> sensing has been applied before for reconstruction in SFR<br />
in [6], [7]. However, although both of these papers show that this reconstruction is better than<br />
the IDFT approach, they don’t discuss the resolution limits of the compressed sensing approach.<br />
In order to formulate the reconstruction problem for compressed sensing reconstruction, we<br />
first multiply both sides of equation (8) with FK:<br />
⎡ ⎤<br />
y( f1)<br />
⎢y(<br />
f2) ⎥<br />
⎢ ⎥<br />
⎣<br />
.<br />
⎦<br />
y( fK)<br />
= FK<br />
⎡<br />
t0<br />
⎢t1<br />
⎥<br />
⎢ ⎥<br />
⎣<br />
.<br />
⎦<br />
In a second step, an arbitrary resolution ΔRa < ΔR is selected. The number of elements of the<br />
vector [t0,t1,...,tK] T is increased from K to Ka where<br />
Ka = Ru<br />
=<br />
ΔRa<br />
c<br />
tK<br />
⎤<br />
2Δ f ΔRa<br />
2 It is interesting to note that the US Patent No. 6,856,281B2 deals with this simple formula.<br />
6<br />
(16)<br />
(17)<br />
(18)
1<br />
0.8<br />
0.6<br />
0.4<br />
0.2<br />
0<br />
0 5 10 15 20 25 30<br />
Fig. 5: Matrix R operation<br />
Under these modifications, the linear system (17) assumes the well known overdetermined<br />
system form:<br />
⎡ ⎤ ⎡ ⎤ ⎡ ⎤<br />
y( f1)<br />
t0 t0<br />
⎢y(<br />
f2) ⎥ ⎢ t1 ⎥ ⎢ t1 ⎥<br />
⎢ ⎥<br />
⎣<br />
.<br />
⎦ = RFKa<br />
⎢ ⎥<br />
⎣<br />
.<br />
⎦ = Φ⎢<br />
⎥<br />
⎣<br />
.<br />
⎦<br />
y( fK)<br />
(19)<br />
where the matrix R has dimensions of K × Ka and selects the first Ka rows of FKa :<br />
⎡<br />
⎤<br />
1 0 ··· 0 0 ··· 0<br />
⎢ 0<br />
R = ⎢<br />
⎣<br />
.<br />
0<br />
1<br />
0<br />
···<br />
...<br />
···<br />
0<br />
.<br />
1<br />
0<br />
.<br />
0<br />
···<br />
···<br />
···<br />
0 ⎥<br />
.<br />
⎦ =[ I | 0 ]<br />
K×K (Ka−K)×(Ka−K)<br />
0<br />
(20)<br />
The operation of matrix R is graphically illustrated in figure 5. Based on the required resolution<br />
ΔRa, a bandwidth block of size c would ideally need to be sampled. Nevertheless, measure-<br />
2Ra<br />
ments were conducted only inside a smaller block of size KΔ f . This block is expressed by the<br />
unity submatrix I of size K ×K. There is no available information from the remaining c −KΔ f<br />
2Ra<br />
bandwidth, a fact which is expressed by the zero submatrix 0 of size (Ka − K) × (Ka − K).<br />
The overdetermined system (19) can now be solved by utilizing a basis pursuit (BP) minimization:<br />
min tL1 s.t. y − RFKa tL2 < ε (21)<br />
It is interesting to note that neither matrix R nor Φ satisfy the Restricted Isometry Property<br />
(RIP). For example, if we form a test matrix T that contains the first column of the I submatrix<br />
tKa<br />
tKa<br />
7
and the first column of the 0 submatrix and calculate the singular values of TT ⋆ , there will always<br />
be one singular value that is equal to zero. However, the RIP is a sufficient, but not necessary<br />
condition for reconstruction. Since there is no rigorous result to guarantee reconstruction or<br />
give the conditions for perfect reconstruction, the reconstruction performance attained solving<br />
problem (21) will be evaluated numerically.<br />
IV. SIMULATION RESULTS<br />
The basis pursuit problem (21) was solved numerically using NESTA [8], which was preferred<br />
over its widely used alternative, L1-Magic, due to its speed. The main advantage of NESTA is that<br />
the solution to problem (21) can be significantly speeded up by observing that FKa t = FFT{t}.<br />
Furthermore the fact that FKa F⋆ Ka = F⋆ Ka<br />
FKa = I allows NESTA to solve the problem by calculating<br />
only two FFTs per iteration.<br />
The parameter ε in (21) is usually set based on the noise variance σ. However, in this work, we<br />
assume no prior knowledge of σ, which is the case in most practical measurement systems. An<br />
interesting method for selecting ε using cross-validation was developed in [9]. In this approach,<br />
a set of measurements is used for reconstruction while another set is used for cross-validation:<br />
Initially, the basis pursuit problem is solved with the reconstruction set and an arbitrary value<br />
for ε. Then, the result is validated with the cross-validation set and ε is updated accordingly<br />
for the new iteration. The drawback of this approach is the fact that precious measurements are<br />
sacrificed for validation, as well as the time consuming iteration that is required.<br />
In our case, ε is permanently set to 0.01. This value was found to work well in practice in<br />
all scenarios and noise conditions. Moreover, the sampling bandwidth was set to 117 GHz -<br />
123 GHz, in 50 MHz steps, i.e. K = 121 sampling points. Under these conditions, the maximum<br />
range is Ru = 3m and resolution ΔR = 25mm.<br />
In the scenarios presented below, targets at various positions are assumed; then, the ideal<br />
values of the samples [y( f1),y( f2),...,y( fK)] T are calculated and noise is added if required.<br />
These samples are then fed to NESTA for reconstruction and the reconstructed positions are<br />
compared with the original.<br />
A. Two targets, Noiseless data<br />
In the first scenario, we assume that two targets exist in locations R1 = 1.233m and R2 =<br />
1.658m. The reconstruction approach using IDFT and basis pursuit are compared on noiseless<br />
data and their accuracy is evaluated. The required resolution Ra for the BP reconstruction was<br />
set to 0.5mm. Figure 6 illustrates the entries of vector t =[t0,t1,...] T , for the two reconstructions<br />
methods, versus the distance the entries correspond to. The BP approach achieves perfect reconstruction<br />
exhibiting, as expected, two sharp peaks at the target locations. On the contrary, the<br />
IDFT data are more spread, showing a maximum reconstruction error of 7mm. Consequently,<br />
IDFT reconstruction would fail to meet our specs, even without measurement error, due to finite<br />
resolution.<br />
This example alone shows the potential of compressed sensing as a powerful reconstruction<br />
method, achieving resolutions much higher than the theoretically predicted from IDFT. Nevertheless,<br />
it should be noted that the computational cost of solving the BP problem was significantly<br />
higher than the IDFT case; namely, NESTA calculated 460 FFTs of vectors consisting 6000<br />
elements. Compared with the one FFT of 121 elements, used by the IDFT reconstruction, the<br />
computational cost for solving the BP problem was approximately 20,000 times higher!.<br />
8
1<br />
0.8<br />
0.6<br />
0.4<br />
0.2<br />
CS Error = 0<br />
IDFT Error = 7mm<br />
CS<br />
IDFT<br />
CS Error = 0<br />
IDFT Error = 3mm<br />
0<br />
1 1.1 1.2 1.3 1.4 1.5 1.6 1.7 1.8<br />
Distance (m)<br />
Accuracy (mm)<br />
0.9<br />
0.8<br />
0.7<br />
0.6<br />
0.5<br />
0.4<br />
0.3<br />
0.2<br />
0.1<br />
Fig. 6: Comparison of BP and IDFT.<br />
1 2 3 4 5 6 7 8 9 10 11 12 13 14 15<br />
Phase Noise σ (Degrees)<br />
Fig. 7: Single target reconstruction accuracy for different values of phase noise variance.<br />
B. One target, Noisy data<br />
In the second scenario, we assume the existence of a single target at a random location.<br />
Furthermore, the measurement data vector is corrupted with phase noise i.e., the data provided<br />
to NESTA are: ˆy( fk)=y( fk)ei φk,<br />
¯<br />
where φk ¯ is a random variable, assuming values from a gaussian<br />
distribution of zero mean and variance σφ . This form of cyclo-stationary noise typically occurs<br />
in electronic systems due to instability of the frequency fk over time.<br />
In this experiment, for different values of the noise variance σφ , 200 basis pursuit reconstruction<br />
runs are conducted with random target location and noise samples φk ¯ for each run.<br />
The reconstruction accuracy for each value of σφ is assumed equal to the worst case accuracy<br />
among the 200 runs.<br />
The results of this experiment are depicted in figure 7. The accuracy of BP reconstruction is<br />
surprisingly accurate even under extreme phase noise conditions. For example when σ = 10◦ ,<br />
the accuracy remains below 1mm proving the fact the BP reconstruction handles phase noise<br />
very graciously.<br />
9
1<br />
0.8<br />
0.6<br />
0.4<br />
0.2<br />
C. Three targets, Two closely spaced<br />
Error=0<br />
Error=2mm<br />
Error=1.5mm<br />
0<br />
0.4 0.5 0.6 0.7<br />
Distance (m)<br />
0.8 0.9 1<br />
Fig. 8: Reconstruction in the presence of three targets<br />
The last scenario under investigation is when three targets are present at locations R1 = 0.5m<br />
and R2 = 0.774m, R3 = 0.774m. ThetargetsatR2 and R3 are deliberately closely spaced in order<br />
to evaluate the target separation performance of the BP reconstruction approach. Separation of<br />
closely spaced targets (especially from noisy data) is an important criterion for radar perforce [1].<br />
In our case, phase noise of σφ = 10 ◦ and regular amplitude noise of σA = 0.1 was added to the<br />
data.<br />
Figure 8 shows the reconstructed data for the above scenario. The two closely spaced targets<br />
were separated, even in the presence of large phase noise, albeit with relatively low accuracy<br />
(the error is 2mm). Furthermore, in the area between the two closely spaced targets, the vector<br />
t attains high values, risking the detection of a spurious target (i.e. a non-existent target).<br />
Trying to improve on the above results, basis pursuit reconstruction with reweighting [10] is<br />
attempted. In this approach, each iteration solves the following problem:<br />
<br />
where Wi = diag<br />
1<br />
t (i)<br />
1 +εr<br />
min Wi t (i+1) L1 s.t. y − RFKa t(i+1) L2 < ε (22)<br />
<br />
. Consequently, the values of vector t of the ith , 1<br />
t (i)<br />
2 +εr<br />
,..., 1<br />
t (i)<br />
Ka +εr<br />
iteration are used to normalize the entries calculated by the next iteration to 1. The factor<br />
εr is added for numerical stability, especially under noise.<br />
Figure 9 illustrates the reconstructed data for the two closely spaced targets when reweighting<br />
is utilized with two different values of εr. In both cases the target separation is more clear<br />
compared with the case without reweighting. Nevertheless, in the case of εr = 0.01, the noise in<br />
the data is magnified since the algorithm tries to normalize the small spurs due to noise (seen<br />
in both figures 8 and 9) to 1. In this case, the value of εr acts as a threshold which in case it is<br />
tootight,asintheεr = 0.01 case, the reconstructed signal starts getting corrupted.<br />
In the last experiment, the distance between R2 and R3 is reduced to 20 mm. The results<br />
of the reconstruction are shown in figure 10. It can observed that in the case when the target<br />
separation is less then 25 mm, which is the maximum resolution predicted by equation (11), the<br />
two targets appear merged in the reconstruction in both cases (with and without reweighting).<br />
10
0.3<br />
0.2<br />
0.1<br />
ε r=1 ε r=0.01<br />
0<br />
0.65 0.7 0.8 0.9<br />
Reweighting<br />
No Reweighting<br />
0.65 0.7 0.8 0.9<br />
Fig. 9: Separation of closely spaced with and without reweighting.<br />
1<br />
0.8<br />
0.6<br />
0.4<br />
0.2<br />
0<br />
0.35<br />
0<br />
0.7 0.8 0.9<br />
0 0.5 1 1.5 2 2.5 3<br />
Fig. 10: Reconstruction when the target separation is 20 mm.<br />
As a result, the limit of equation (11) still holds for the SFR with compressed sensing with<br />
respect to maximum possible target separation.<br />
V. CONCLUSIONS<br />
<strong>Compressed</strong> sensing through basis pursuit was utilized as a reconstruction method for step<br />
frequency radar data, achieving very good performance. Numerical experiments revealed that<br />
for a given sampling bandwidth, as long as the target spacing remains larger than the limit<br />
predicted by equation (11), perfect reconstruction can be achieved. Apart from this fundamental<br />
limitation, basis pursuit reconstruction exhibits excellent accuracy, much higher than IDFT, even<br />
under conditions of extreme noise levels.<br />
REFERENCES<br />
[1] M. Skolnik, Introduction to <strong>Radar</strong> Systems. McGraw-Hill, 2002.<br />
[2] L. Robinson, W. Weir, and L. Young, “An RF Time-Domain Reflectometer Not in Real Time,” Microwave Theory and<br />
Techniques, IEEE Transactions on, vol. 20, no. 12, pp. 855 – 857, dec 1972.<br />
[3] K. Iizuka and A. Freundorfer, “Detection of nonmetallic buried objects by a step frequency radar,” Proceedings of the<br />
IEEE, vol. 71, no. 2, pp. 276 – 279, feb. 1983.<br />
[4] K. Iizuka, A. P. Freundorfer, K. H. Wu, H. Mori, H. Ogura, and V.-K. Nguyen, “<strong>Step</strong>-frequency radar,” Journal of Applied<br />
Physics, vol. 56, no. 9, pp. 2572–2583, 1984.<br />
[5] J. A. Scheer, Coherent <strong>Radar</strong> Performance Estimation. Artech House, 1993.<br />
11
[6] A. Gurbuz, J. McClellan, and W. Scott, “A Compressive <strong>Sensing</strong> Data Acquisition and Imaging Method for <strong>Step</strong>ped<br />
<strong>Frequency</strong> GPRs,” Signal Processing, IEEE Transactions on, vol. 57, no. 7, pp. 2640 –2650, july 2009.<br />
[7] S. Shah, Y. Yu, and A. Petropulu, “<strong>Step</strong>-<strong>Frequency</strong> <strong>Radar</strong> with Compressive Sampling (SFR-CS),” in Proc. ICASSP 2010,<br />
March 2010.<br />
[8] S. B. Jerome Bobin and E. Candes, “NESTA: A Fast and Accurate First-order Method for Sparse Recovery,” California<br />
Institute of Technology, Tech. Rep., 2009.<br />
[9] P. Boufounos, M. F. Duarte, and R. G. Baraniuk, “Sparse Signal Reconstruction from Noisy Compressive Measurements<br />
using Cross Validation,” in Statistical Signal Processing, 2007. SSP ’07. IEEE/SP 14th Workshop on, aug. 2007, pp. 299<br />
–303.<br />
[10] E. Candes, M. Wakin, and S. Boyd, “Enhancing sparsity by reweighted l1 minimization,” J. Fourier Anal. Appl., vol. 14,<br />
pp. 877–905, 2007.<br />
12