From Greenhouse to Icehouse – The Eocene/Oligocene - UMass ...
From Greenhouse to Icehouse – The Eocene/Oligocene - UMass ...
From Greenhouse to Icehouse – The Eocene/Oligocene - UMass ...

Create successful ePaper yourself
Turn your PDF publications into a flip-book with our unique Google optimized e-Paper software.
Δ δ 18 Ο<br />
0.0 0.2 0.4 0.6<br />
348 J. E. Francis et al.<br />
Δ sea level<br />
0 10 20 30 40 50 60<br />
meters<br />
2.0<br />
10<br />
2.2<br />
Author's personal copy<br />
4000<br />
3500<br />
3000<br />
2500<br />
2000<br />
1500<br />
1000<br />
500<br />
0<br />
2.4<br />
8<br />
2.6<br />
CO 2 (PAL)<br />
2.8<br />
6<br />
meters<br />
3.0<br />
Time (10 6 model years)<br />
4000<br />
3500<br />
3000<br />
2500<br />
2000<br />
1500<br />
1000<br />
500<br />
0<br />
3.2<br />
4<br />
3.4<br />
3.6<br />
2<br />
Ice volume (10 6 km 3 )<br />
0 5 10 15 20 25<br />
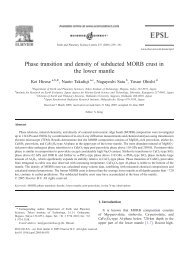
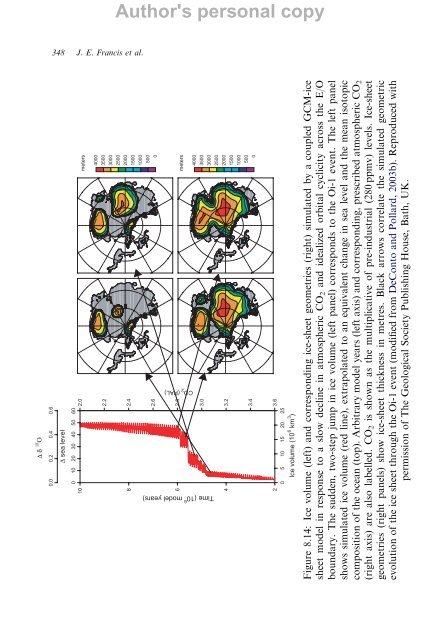
Figure 8.14: Ice volume (left) and corresponding ice-sheet geometries (right) simulated by a coupled GCM-ice<br />
sheet model in response <strong>to</strong> a slow decline in atmospheric CO2 and idealized orbital cyclicity across the E/O<br />
boundary. <strong>The</strong> sudden, two-step jump in ice volume (left panel) corresponds <strong>to</strong> the Oi-1 event. <strong>The</strong> left panel<br />
shows simulated ice volume (red line), extrapolated <strong>to</strong> an equivalent change in sea level and the mean iso<strong>to</strong>pic<br />
composition of the ocean (<strong>to</strong>p). Arbitrary model years (left axis) and corresponding, prescribed atmospheric CO2 (right axis) are also labelled. CO2 is shown as the multiplicative of pre-industrial (280 ppmv) levels. Ice-sheet<br />
geometries (right panels) show ice-sheet thickness in metres. Black arrows correlate the simulated geometric<br />
evolution of the ice sheet through the Oi-1 event (modified from DeCon<strong>to</strong> and Pollard, 2003b). Reproduced with<br />
permission of <strong>The</strong> Geological Society Publishing House, Bath, UK.