Micro- & nano- fluidic research for chemistry, physics - Engineering ...
Micro- & nano- fluidic research for chemistry, physics - Engineering ...
Micro- & nano- fluidic research for chemistry, physics - Engineering ...

Create successful ePaper yourself
Turn your PDF publications into a flip-book with our unique Google optimized e-Paper software.
Downloaded by Pennsylvania State University on 14 March 2011<br />
Published on 10 August 2010 on http://pubs.rsc.org | doi:10.1039/C005071G<br />
glass substrate and converges within the dye chamber at the focal<br />
point. Changing the fluid injection ratios results in a change in<br />
refractive index gradient (Fig. 3(a–c)), causing the light to<br />
converge differently and resulting in a shift of the focal point<br />
inside the dye chamber along the z-direction (Fig. 3(d–f)). These<br />
simulated results suggest that the focal length increases when the<br />
flow rate of DI water decreases. The simulations also predict the<br />
tuning range of the focal point along the z-axis to be 130 mm.<br />
In order to characterize the per<strong>for</strong>mance of the L-GRIN lens,<br />
a series of experiments were conducted with the experimental<br />
setup <strong>for</strong> side-view ray-tracing illustrated in Fig. 4(a). The device<br />
used <strong>for</strong> experimental characterization, as previously described,<br />
consists of three components: the L-GRIN lens, the glass<br />
substrate, and the dye chamber. The collimated light beam from<br />
a semiconductor laser diode (532 nm) was shined on the X–Y<br />
plane of the L-GRIN lens chamber along the z-direction. After<br />
exiting the L-GRIN lens chamber, the light enters the dye<br />
chamber through the glass layer, where its trajectory can be<br />
visualized by the fluorescent emission of Rhodamine dyes (excitation<br />
wavelength of 532 nm and emission wavelength of 560<br />
nm). It should be noted that the per<strong>for</strong>mance of the L-GRIN lens<br />
can be affected by temperature. Temperature has an influence on<br />
the refractive index gradient profile of the L-GRIN lens because<br />
both the diffusion coefficient of the solute (CaCl 2) and the<br />
refractive index of the liquid medium vary with temperature. 38,39<br />
There<strong>for</strong>e, changes in temperature can result in a variation of the<br />
lens per<strong>for</strong>mance, such as a variation in the lens’ focal length.<br />
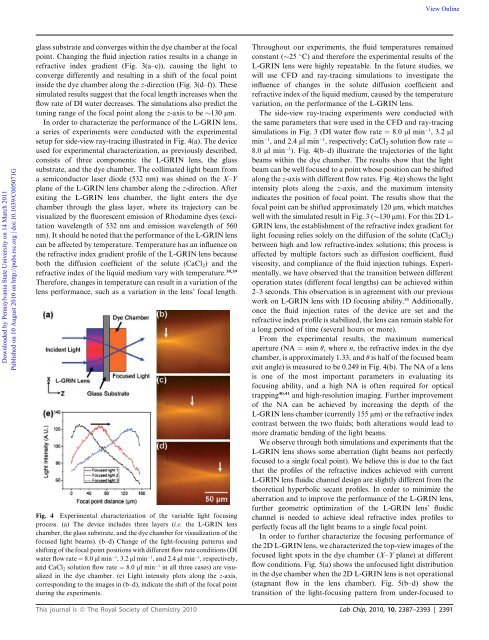
Fig. 4 Experimental characterization of the variable light focusing<br />
process. (a) The device includes three layers (i.e. the L-GRIN lens<br />
chamber, the glass substrate, and the dye chamber <strong>for</strong> visualization of the<br />
focused light beams). (b–d) Change of the light-focusing patterns and<br />
shifting of the focal point positions with different flow rate conditions (DI<br />
water flow rate ¼ 8.0 ml min 1 , 3.2 ml min 1 , and 2.4 ml min 1 , respectively,<br />
and CaCl2 solution flow rate ¼ 8.0 ml min 1 in all three cases) are visualized<br />
in the dye chamber. (e) Light intensity plots along the z-axis,<br />
corresponding to the images in (b–d), indicate the shift of the focal point<br />
during the experiments.<br />
View Online<br />
Throughout our experiments, the fluid temperatures remained<br />
constant ( 25 C) and there<strong>for</strong>e the experimental results of the<br />
L-GRIN lens were highly repeatable. In the future studies, we<br />
will use CFD and ray-tracing simulations to investigate the<br />
influence of changes in the solute diffusion coefficient and<br />
refractive index of the liquid medium, caused by the temperature<br />
variation, on the per<strong>for</strong>mance of the L-GRIN lens.<br />
The side-view ray-tracing experiments were conducted with<br />
the same parameters that were used in the CFD and ray-tracing<br />
simulations in Fig. 3 (DI water flow rate ¼ 8.0 ml min 1 , 3.2 ml<br />
min 1 , and 2.4 ml min 1 , respectively; CaCl 2 solution flow rate ¼<br />
8.0 ml min 1 ). Fig. 4(b–d) illustrate the trajectories of the light<br />
beams within the dye chamber. The results show that the light<br />
beam can be well focused to a point whose position can be shifted<br />
along the z-axis with different flow rates. Fig. 4(e) shows the light<br />
intensity plots along the z-axis, and the maximum intensity<br />
indicates the position of focal point. The results show that the<br />
focal point can be shifted approximately 120 mm, which matches<br />
well with the simulated result in Fig. 3 ( 130 mm). For this 2D L-<br />
GRIN lens, the establishment of the refractive index gradient <strong>for</strong><br />
light focusing relies solely on the diffusion of the solute (CaCl2)<br />
between high and low refractive-index solutions; this process is<br />
affected by multiple factors such as diffusion coefficient, fluid<br />
viscosity, and compliance of the fluid injection tubings. Experimentally,<br />
we have observed that the transition between different<br />
operation states (different focal lengths) can be achieved within<br />
2–3 seconds. This observation is in agreement with our previous<br />
work on L-GRIN lens with 1D focusing ability. 31 Additionally,<br />
once the fluid injection rates of the device are set and the<br />
refractive index profile is stabilized, the lens can remain stable <strong>for</strong><br />
a long period of time (several hours or more).<br />
From the experimental results, the maximum numerical<br />
aperture (NA ¼ nsin q, where n, the refractive index in the dye<br />
chamber, is approximately 1.33, and q is half of the focused beam<br />
exit angle) is measured to be 0.249 in Fig. 4(b). The NA of a lens<br />
is one of the most important parameters in evaluating its<br />
focusing ability, and a high NA is often required <strong>for</strong> optical<br />
trapping 40,41 and high-resolution imaging. Further improvement<br />
of the NA can be achieved by increasing the depth of the<br />
L-GRIN lens chamber (currently 155 mm) or the refractive index<br />
contrast between the two fluids; both alterations would lead to<br />
more dramatic bending of the light beams.<br />
We observe through both simulations and experiments that the<br />
L-GRIN lens shows some aberration (light beams not perfectly<br />
focused to a single focal point). We believe this is due to the fact<br />
that the profiles of the refractive indices achieved with current<br />
L-GRIN lens <strong>fluidic</strong> channel design are slightly different from the<br />
theoretical hyperbolic secant profiles. In order to minimize the<br />
aberration and to improve the per<strong>for</strong>mance of the L-GRIN lens,<br />
further geometric optimization of the L-GRIN lens’ <strong>fluidic</strong><br />
channel is needed to achieve ideal refractive index profiles to<br />
perfectly focus all the light beams to a single focal point.<br />
In order to further characterize the focusing per<strong>for</strong>mance of<br />
the 2D L-GRIN lens, we characterized the top-view images of the<br />
focused light spots in the dye chamber (X–Y plane) at different<br />
flow conditions. Fig. 5(a) shows the unfocused light distribution<br />
in the dye chamber when the 2D L-GRIN lens is not operational<br />
(stagnant flow in the lens chamber). Fig. 5(b–d) show the<br />
transition of the light-focusing pattern from under-focused to<br />
This journal is ª The Royal Society of Chemistry 2010 Lab Chip, 2010, 10, 2387–2393 | 2391