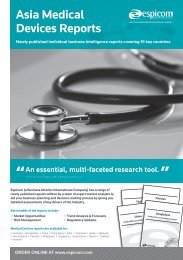
Medistat - Espicom
Medistat - Espicom
Medistat - Espicom

Create successful ePaper yourself
Turn your PDF publications into a flip-book with our unique Google optimized e-Paper software.
<strong>Medistat</strong><br />
Worldwide Medical Market Forecasts to 2016<br />
World Leaders in Health Industry Analysis
<strong>Medistat</strong> Worldwide Medical Market Forecasts To 2016<br />
Chart: Global Medical Equipment Market By Category, 2011 (%)<br />
Chart: Global Medical Equipment Market By Region, 2011 (%)<br />
Central & Eastern Europe<br />
4.8%<br />
Middle East/Africa<br />
2.8%<br />
Others<br />
30.4%<br />
Patient Aids<br />
10.0%<br />
Western Europe<br />
25.4%<br />
Orthopaedic & Prosthetic<br />
13.1%<br />
Asia/Pacific<br />
22.2%<br />
Woundcare<br />
3.9%<br />
Dental Instruments &<br />
Supplies<br />
4.7%<br />
Syringes, Needles &<br />
Catheters<br />
8.9%<br />
Other Consumables<br />
1.8%<br />
Electrodiagnostic<br />
15.2%<br />
X-Ray Apparatus<br />
5.0%<br />
Imaging Accessories<br />
5.5%<br />
Dental Capital Products<br />
1.4%<br />
Americas<br />
44.8%<br />
10 © <strong>Espicom</strong> Business Intelligence, June 2011
GDP By Country, 2007-16 (US$ billions)<br />
<strong>Medistat</strong> Worldwide Medical Market Forecasts To 2016<br />
2007 2008 2009 2010 2011 2012 2013 2014 2015 2016<br />
1 USA 14,061.8 14,369.1 14,119.1 14,723.0 15,423.0 16,196.0 17,025.0 17,928.0 18,870.0 20,013.0<br />
2 China 3,494.3 4,531.7 5,050.5 5,878.4 6,834.0 8,099.0 9,584.0 11,200.0 12,963.0 14,751.0<br />
3 Japan 4,377.6 4,880.1 5,032.4 5,461.6 6,029.0 6,247.0 6,277.0 6,314.0 6,262.0 6,342.0<br />
4 Germany 3,334.6 3,648.5 3,339.8 3,317.0 3,318.0 3,314.0 3,399.0 3,515.0 3,734.0 3,924.0<br />
5 India 1,187.3 1,260.0 1,298.1 1,645.0 1,869.0 2,169.0 2,549.0 2,958.0 3,413.0 3,814.0<br />
6 Brazil 1,366.3 1,652.6 1,594.5 2,029.0 2,354.0 2,422.0 2,501.0 2,626.0 2,772.0 3,014.0<br />
7 UK 2,811.8 2,682.4 2,179.8 2,251.4 2,449.0 2,510.0 2,668.0 2,681.0 2,825.0 2,975.0<br />
8 France 2,598.8 2,863.0 2,657.3 2,581.7 2,556.0 2,504.0 2,561.0 2,618.0 2,748.0 2,881.0<br />
9 Russia 1,299.7 1,660.4 1,222.3 1,464.7 1,675.0 1,849.0 2,047.0 2,268.0 2,544.0 2,709.0<br />
10 Italy 2,116.0 2,304.4 2,117.8 2,052.0 2,006.0 1,960.0 1,969.0 2,026.0 2,107.0 2,189.0<br />
11 Canada 1,424.1 1,499.1 1,336.1 1,560.0 1,692.0 1,734.0 1,853.0 1,984.0 2,100.0 2,177.0<br />
12 South Korea 1,049.2 931.4 832.5 995.6 1,098.0 1,209.0 1,299.0 1,418.0 1,514.0 1,618.0<br />
13 Australia 951.7 1,040.7 973.7 1,243.0 1,411.0 1,417.0 1,412.0 1,467.0 1,526.0 1,589.0<br />
14 Spain 1,444.0 1,600.2 1,468.4 1,409.9 1,356.0 1,327.0 1,341.0 1,361.0 1,422.0 1,495.0<br />
15 Indonesia 432.2 510.2 539.4 706.7 818.5 919.5 1,026.0 1,148.0 1,287.0 1,402.0<br />
16 Mexico 1,035.9 1,096.2 882.8 1,005.0 1,142.0 1,199.0 1,226.0 1,221.0 1,199.0 1,233.0<br />
17 Turkey 647.1 730.3 614.6 724.3 763.6 844.9 922.0 1,021.6 1,119.8 1,190.6<br />
18 Netherlands 782.6 876.5 796.8 781.7 770.2 746.5 754.9 763.6 797.5 839.4<br />
19 Iran 286.1 344.8 367.2 411.4 465.4 530.8 604.3 675.6 767.2 802.3<br />
20 Argentina 262.5 328.5 308.7 372.6 445.9 518.2 589.3 660.6 738.2 779.6<br />
21 Poland 425.1 529.4 430.5 468.9 501.6 514.2 554.3 600.5 644.7 678.5<br />
22 Taiwan 393.1 400.2 377.4 430.2 485.3 517.6 551.9 588.4 627.1 677.0<br />
23 Saudi Arabia 384.9 476.3 372.7 434.7 514.5 523.5 549.2 579.8 631.2 676.5<br />
24 Sweden 462.4 485.8 403.5 461.3 468.3 482.2 503.9 524.9 557.8 581.6<br />
25 Switzerland 434.1 502.5 491.9 527.5 532.1 516.6 507.0 507.2 507.0 516.3<br />
26 Thailand 247.0 272.6 263.7 318.9 353.6 384.0 413.8 444.6 477.7 510.5<br />
27 Belgium 458.6 506.1 472.2 466.4 477.4 463.8 463.8 469.1 483.4 509.9<br />
28 Norway 387.5 446.2 378.6 420.0 431.6 433.0 448.6 463.2 490.6 506.7<br />
29 Venezuela 226.5 311.1 326.1 233.1 280.0 327.3 360.5 415.1 489.5 472.6<br />
30 Malaysia 186.8 222.3 192.8 237.8 277.0 303.4 334.7 372.0 415.5 466.9<br />
31 Colombia 207.5 243.6 233.3 285.1 313.8 338.6 363.0 390.5 421.7 446.6<br />
32 Egypt 132.2 164.8 187.3 217.2 220.9 262.8 309.8 355.8 405.3 436.6<br />
33 UAE 206.4 254.4 248.9 269.0 304.2 330.0 360.0 396.4 410.9 432.0<br />
34 Austria 371.6 414.1 381.0 375.8 365.9 359.3 363.2 369.6 384.9 406.6<br />
35 South Africa 286.1 275.4 284.4 355.8 369.9 362.3 360.4 370.9 387.5 404.9<br />
36 Philippines 144.1 167.2 161.1 188.7 226.8 253.8 283.1 315.5 351.7 389.5<br />
37 Singapore 176.8 193.3 182.2 227.2 256.6 276.3 294.1 316.2 338.1 352.8<br />
38 Denmark 311.4 341.5 308.9 310.8 312.0 304.5 311.0 317.2 333.1 352.0<br />
39 Israel 168.0 202.3 195.4 217.1 237.4 246.9 264.3 290.0 317.4 333.6<br />
40 Chile 164.3 170.9 163.3 195.8 229.8 248.6 265.2 282.2 299.8 321.1<br />
41 Greece 311.2 348.4 327.4 304.4 282.9 274.8 277.0 282.7 294.9 306.4<br />
42 Finland 245.9 271.5 238.7 238.9 240.4 236.5 242.2 250.0 263.8 279.6<br />
43 Ukraine 142.7 180.0 117.4 126.8 151.6 168.4 195.5 228.5 261.9 278.3<br />
44 Pakistan 143.0 164.5 162.0 174.8 190.1 208.4 225.4 243.1 260.9 271.0<br />
45 Romania 170.6 204.3 161.1 154.8 160.3 174.1 191.4 213.1 239.1 255.8<br />
46 Czech Republic 174.2 216.1 190.2 192.8 197.2 201.4 211.5 222.9 236.4 253.8<br />
47 Peru 107.2 127.4 126.7 156.6 173.2 188.6 197.0 207.0 214.1 230.3<br />
48 Portugal 230.9 252.9 234.1 229.2 220.3 210.0 210.4 211.6 218.9 228.8<br />
49 Ireland 259.1 264.6 222.4 205.4 193.2 182.4 183.9 187.9 196.3 206.3<br />
50 Vietnam 71.1 90.3 93.2 103.7 116.5 128.0 141.7 160.4 180.1 196.6<br />
51 Bangladesh 68.5 79.6 89.4 99.8 109.9 120.9 134.5 148.3 165.5 180.7<br />
52 New Zealand 131.4 129.4 116.2 140.5 152.2 152.1 157.6 164.2 170.5 177.8<br />
53 Hungary 137.9 155.4 128.8 130.4 128.5 132.5 139.3 144.9 153.5 160.6<br />
54 Morocco 75.2 88.9 91.4 91.7 96.9 103.4 110.5 119.2 129.7 137.4<br />
55 Slovakia 84.2 98.5 87.8 88.3 87.2 88.5 92.7 96.8 104.0 111.1<br />
56 Cuba 51.4 54.6 55.9 57.4 60.4 64.4 68.9 73.6 78.7 110.6<br />
57 Belarus 44.8 60.3 49.0 55.3 62.8 70.6 77.3 84.7 92.7 101.5<br />
58 Oman 41.9 60.6 46.9 53.5 59.3 63.7 66.7 69.8 73.1 76.5<br />
59 Croatia 58.6 69.6 63.2 60.4 59.3 60.0 62.6 65.5 70.1 73.7<br />
60 Serbia 41.6 50.7 44.7 42.3 43.9 47.8 51.8 56.0 62.2 67.3<br />
61 Bulgaria 42.1 52.1 48.8 51.5 51.8 52.1 54.5 57.5 61.6 64.7<br />
62 Slovenia 47.3 54.8 49.3 48.1 48.0 47.9 49.2 50.9 54.4 58.1<br />
63 Lithuania 39.1 47.3 36.9 36.1 36.7 36.7 38.4 40.3 43.6 45.7<br />
64 Jordan 17.0 20.7 21.0 22.8 25.2 27.8 30.0 32.9 36.5 40.5<br />
65 Latvia 28.8 33.9 25.9 23.9 23.9 24.4 25.5 26.8 28.9 29.8<br />
66 Estonia 21.7 23.7 19.3 19.2 19.4 19.7 20.6 21.7 23.5 25.1<br />
© <strong>Espicom</strong> Business Intelligence, June 2011 15
Americas Electrodiagnostic Equipment Market Per Capita (US$)<br />
<strong>Medistat</strong> Worldwide Medical Market Forecasts To 2016<br />
2007 2008 2009 2010 2011 2012 2013 2014 2015 2016 CAGR<br />
Argentina 1.3 1.7 1.5 1.6 1.7 1.9 2.1 2.4 2.8 3.0 11.8<br />
Brazil 1.4 1.7 1.6 2.0 2.2 2.2 2.2 2.3 2.4 2.5 2.7<br />
Canada 16.9 18.4 16.8 18.2 19.3 19.6 20.7 21.8 22.8 23.1 3.7<br />
Chile 2.3 2.0 1.5 1.7 1.8 1.8 1.8 1.7 1.7 1.7 -1.3<br />
Colombia 0.9 1.0 1.2 1.4 1.5 1.6 1.7 1.8 1.9 1.9 5.2<br />
Cuba 4.2 1.1 0.7 0.7 0.8 0.8 0.9 0.9 1.0 1.0 5.3<br />
Mexico 1.7 1.4 1.2 1.3 1.4 1.4 1.3 1.3 1.2 1.1 -3.4<br />
Peru 1.3 1.1 1.0 1.1 1.2 1.4 1.5 1.5 1.6 1.8 7.4<br />
USA 64.6 65.5 58.6 68.2 70.5 72.7 75.0 77.4 79.9 82.5 3.2<br />
Venezuela 2.1 5.4 4.6 2.6 2.7 3.1 3.6 4.2 4.9 5.8 16.5<br />
Americas 26.0 26.4 23.7 27.4 28.3 29.2 30.1 31.1 32.1 33.2 3.2<br />
Chart: Americas Electrodiagnostic Equipment Market Per Capita, 2011 (US$)<br />
80<br />
70<br />
60<br />
50<br />
40<br />
30<br />
20<br />
10<br />
0<br />
70.5<br />
19.3<br />
2.7<br />
2.2<br />
1.8<br />
USA Canada Venezuela Brazil Chile Argentina Colombia Mexico Peru Cuba<br />
© <strong>Espicom</strong> Business Intelligence, June 2011 67<br />
1.7<br />
1.5<br />
1.4<br />
1.2<br />
0.8
<strong>Medistat</strong> Worldwide Medical Market Forecasts To 2016<br />
BANGLADESH Bangladesh remains one of the poorest countries in the world. Poverty is widespread throughout the<br />
country and GDP is extremely low, despite it being the eighth most populous on earth. Frequent<br />
large scale flooding also remains a constant threat. Government funding is low and the country<br />
continues to rely on international aid. An unstable political environment tarnished by corruption has<br />
made healthcare reform somewhat of an afterthought. Bangladesh has virtually no domestic<br />
manufacturing industry and only produces a negligible number of low-tech medical items. Almost all<br />
medical goods have to be imported.<br />
Global Market<br />
Value Rank<br />
Per Capita<br />
Value Rank<br />
64<br />
66<br />
National CAGR 5.5<br />
Regional CAGR 5.6<br />
% of Market<br />
Imported<br />
Bangladesh: Basic data<br />
88.4<br />
Patient aids<br />
12.9%<br />
Others<br />
23.3%<br />
Orthopaedic &<br />
prosthetic<br />
17.4%<br />
2007 2008 2009 2010 2011 2012 2013 2014 2015 2016<br />
© <strong>Espicom</strong> Business Intelligence, June 2011 143<br />
CAGR<br />
2011-16<br />
Population (millions) 157.8 160.0 162.2 164.5 166.8 169.1 171.5 173.9 176.3 179.3 1.5<br />
% Aged 65+ 4.5 4.6 4.6 4.6 4.7 4.7 4.7 4.8 4.5 4.6 0.7<br />
GDP (US$ billions) 68.5 79.6 89.4 99.8 109.9 120.9 134.5 148.3 165.5 180.7 10.5<br />
GDP Per Capita (US$) 434.3 497.2 550.9 606.4 658.8 715.0 784.3 853.0 938.9 1,007.6 8.9<br />
Bangladesh: Medical Device Market By Category, 2007-16 (US$ millions)<br />
Consumables<br />
19.2%<br />
Dental products<br />
8.4%<br />
Diagnostic imaging<br />
18.9%<br />
Market Breakdown<br />
2011<br />
2007 2008 2009 2010 2011 2012 2013 2014 2015 2016<br />
CAGR<br />
2011-16<br />
Consumables 21.2 22.5 28.5 30.4 31.9 33.7 35.5 37.9 40.3 42.1 5.7<br />
Woundcare 5.2 5.9 4.4 4.8 5.1 5.5 5.8 6.3 6.8 7.2 7.2<br />
Syringes, needles & catheters 14.5 15.0 21.7 23.0 23.9 25.0 26.1 27.6 29.1 30.0 4.7<br />
Others 1.4 1.6 2.4 2.7 2.9 3.2 3.6 4.0 4.4 4.9 10.7<br />
Diagnostic imaging 19.0 38.8 33.5 34.6 35.0 35.8 36.4 37.5 38.4 38.7 2.0<br />
Electrodiagnostic apparatus 7.8 15.7 16.4 16.9 17.2 17.6 17.9 18.5 19.0 19.2 2.2<br />
X-ray apparatus 5.7 14.2 10.7 11.0 11.0 11.2 11.3 11.6 11.8 11.8 1.3<br />
Imaging parts & accessories 5.5 8.9 6.4 6.7 6.8 7.0 7.2 7.4 7.7 7.8 2.7<br />
Dental products 1.0 1.4 1.2 1.4 1.6 1.8 2.0 2.4 2.7 3.1 14.4<br />
Drills, chairs and X-ray 0.1 0.2 0.2 0.2 0.3 0.3 0.4 0.5 0.6 0.7 18.9<br />
Instruments & supplies 1.0 1.1 1.0 1.1 1.3 1.5 1.6 1.9 2.1 2.4 13.3<br />
Orthopaedic & prosthetic 3.2 5.5 6.4 7.5 8.6 9.9 11.5 13.6 15.9 18.5 16.7<br />
Splints & other fracture appliances 1.0 2.1 1.2 1.3 1.4 1.5 1.6 1.7 1.8 1.8 5.9<br />
Artificial joints 0.5 1.4 1.7 1.8 2.0 2.1 2.3 2.5 2.7 2.8 7.6<br />
Other artificial body parts 1.7 2.1 3.5 4.3 5.2 6.3 7.7 9.4 11.5 13.8 21.6<br />
Patient Aids 4.5 8.2 8.2 9.2 10.1 11.2 12.4 14.0 15.6 17.1 11.0<br />
Portable aids 1.3 4.6 2.9 3.3 3.6 4.1 4.5 5.1 5.7 6.3 11.9<br />
Therapeutic appliances 3.2 3.7 5.3 5.9 6.5 7.2 7.9 8.8 9.8 10.7 10.5<br />
Others 28.7 37.3 26.8 27.6 28.0 28.6 29.1 30.0 30.7 31.0 2.0<br />
Total 77.6 113.6 104.6 110.7 115.2 121.1 127.0 135.3 143.7 150.4 5.5