What does the science say? - Brigham Young University
What does the science say? - Brigham Young University
What does the science say? - Brigham Young University

Create successful ePaper yourself
Turn your PDF publications into a flip-book with our unique Google optimized e-Paper software.
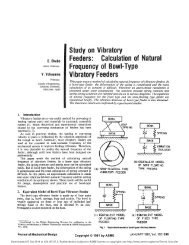
Notes on Right-‐Hand Figure<br />
Antenna sky temperature. Noise temperature of an idealized<br />
antenna (lossless, no Earth-‐directed sidelobes) located at <strong>the</strong><br />
Earth’s surface, as a func0on of frequency, for a number of beam<br />
eleva0on angles. Solid curves are for geometric-‐mean galac0c<br />
temperature, sun noise 10 0mes quiet level, sun in unity-‐gain<br />
sidelobe, cool temperate-‐zone troposphere, 2.7K cosmic blackbody<br />
radia0on, zero ground noise. The upper dashed curve is for<br />
maximum galac0c noise (center of galaxy, narrow-‐beam antenna).<br />
Sun noise 100 0mes quiet level, zero eleva0on, o<strong>the</strong>r factors <strong>the</strong><br />
same as solid curves. The lower dashed curve is for minimum<br />
galac0c noise, zero sun noise, 90â—¦ eleva0on angle. (The bump in<br />
<strong>the</strong> curves at about 500MHz is due to <strong>the</strong> sun-‐noise characteris0c.<br />
The curves for low eleva0on angles lie below those for high angles<br />
at frequencies below 400MHz because of reduc0on of galac0c<br />
noise by atmospheric absorp0on. The maxima at 22.2 and 60 GHz<br />
are due to <strong>the</strong> water-‐vapor and oxygen absorp0on resonance.)<br />
11