Regional integration and the other determinants of North-South ...
Regional integration and the other determinants of North-South ...
Regional integration and the other determinants of North-South ...
Create successful ePaper yourself
Turn your PDF publications into a flip-book with our unique Google optimized e-Paper software.
Mediterranean area. We pay particular attention to <strong>the</strong> impact <strong>of</strong> both regional <strong>and</strong><br />
international <strong>integration</strong> on <strong>the</strong> geographical distribution <strong>of</strong> industries.<br />
Model specification<br />
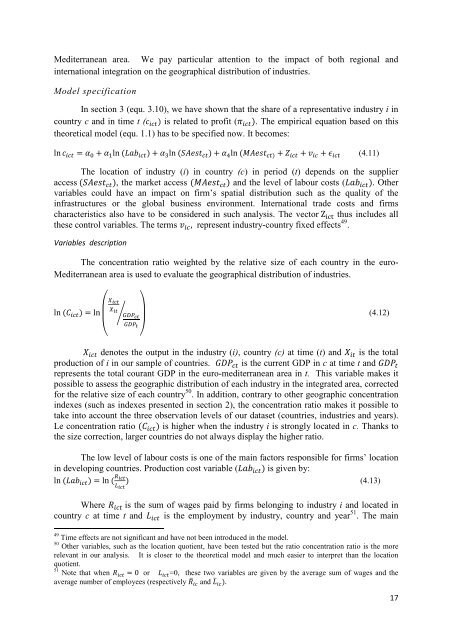
In section 3 (equ. 3.10), we have shown that <strong>the</strong> share <strong>of</strong> a representative industry i in<br />
country c <strong>and</strong> in time t ( is related to pr<strong>of</strong>it ( . The empirical equation based on this<br />
<strong>the</strong>oretical model (equ. 1.1) has to be specified now. It becomes:<br />
ln ln ln ln (4.11)<br />
The location <strong>of</strong> industry (i) in country (c) in period (t) depends on <strong>the</strong> supplier<br />
access , <strong>the</strong> market access <strong>and</strong> <strong>the</strong> level <strong>of</strong> labour costs ( . O<strong>the</strong>r<br />
variables could have an impact on firm’s spatial distribution such as <strong>the</strong> quality <strong>of</strong> <strong>the</strong><br />
infrastructures or <strong>the</strong> global business environment. International trade costs <strong>and</strong> firms<br />
characteristics also have to be considered in such analysis. The vector Z thus includes all<br />
<strong>the</strong>se control variables. The terms , represent industry-country fixed effects 49 .<br />
Variables description<br />
The concentration ratio weighted by <strong>the</strong> relative size <strong>of</strong> each country in <strong>the</strong> euro-<br />
Mediterranean area is used to evaluate <strong>the</strong> geographical distribution <strong>of</strong> industries.<br />
ln ln <br />
<br />
<br />
<br />
<br />
(4.12)<br />
<br />
denotes <strong>the</strong> output in <strong>the</strong> industry (i), country (c) at time (t) <strong>and</strong> is <strong>the</strong> total<br />
production <strong>of</strong> i in our sample <strong>of</strong> countries. is <strong>the</strong> current GDP in c at time t <strong>and</strong> <br />
represents <strong>the</strong> total courant GDP in <strong>the</strong> euro-mediterranean area in t. This variable makes it<br />
possible to assess <strong>the</strong> geographic distribution <strong>of</strong> each industry in <strong>the</strong> integrated area, corrected<br />
for <strong>the</strong> relative size <strong>of</strong> each country 50 . In addition, contrary to o<strong>the</strong>r geographic concentration<br />
indexes (such as indexes presented in section 2), <strong>the</strong> concentration ratio makes it possible to<br />
take into account <strong>the</strong> three observation levels <strong>of</strong> our dataset (countries, industries <strong>and</strong> years).<br />
Le concentration ratio is higher when <strong>the</strong> industry i is strongly located in c. Thanks to<br />
<strong>the</strong> size correction, larger countries do not always display <strong>the</strong> higher ratio.<br />
The low level <strong>of</strong> labour costs is one <strong>of</strong> <strong>the</strong> main factors responsible for firms’ location<br />
in developing countries. Production cost variable ( is given by:<br />
ln ln (4.13)<br />
Where is <strong>the</strong> sum <strong>of</strong> wages paid by firms belonging to industry i <strong>and</strong> located in<br />
country c at time t <strong>and</strong> is <strong>the</strong> employment by industry, country <strong>and</strong> year 51 . The main<br />
49 Time effects are not significant <strong>and</strong> have not been introduced in <strong>the</strong> model.<br />
50 O<strong>the</strong>r variables, such as <strong>the</strong> location quotient, have been tested but <strong>the</strong> ratio concentration ratio is <strong>the</strong> more<br />
relevant in our analysis. It is closer to <strong>the</strong> <strong>the</strong>oretical model <strong>and</strong> much easier to interpret than <strong>the</strong> location<br />
quotient.<br />
51 Note that when 0 or =0, <strong>the</strong>se two variables are given by <strong>the</strong> average sum <strong>of</strong> wages <strong>and</strong> <strong>the</strong><br />
average number <strong>of</strong> employees (respectively <strong>and</strong> .<br />
17


