Regional integration and the other determinants of North-South ...
Regional integration and the other determinants of North-South ...
Regional integration and the other determinants of North-South ...

Create successful ePaper yourself
Turn your PDF publications into a flip-book with our unique Google optimized e-Paper software.
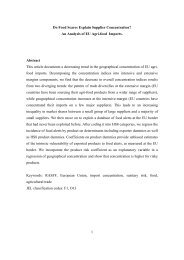
Table 2.3: Concentration indexes by period <strong>and</strong> technological levels.<br />
Theil index Dissimilarity index<br />
Isic code Sector 90-94 95-99 00-03 Rank* 90-94 95-99 00-03 Rank* %(90<br />
03)**<br />
Low-technology industries<br />
311 Food products 0,043 0,047 0,048 22 0,232 0,259 0,249 19 8%<br />
313 Beverages 0,053 0,068 0,074 17 0,248 0,292 0,302 15 44%<br />
314 Tobacco 0,161 0,199 0,210 6 0,461 0,474 0,483 6 -7%<br />
321 Textiles 0,154 0,243 0,276 5 0,428 0,554 0,601 5 91%<br />
322 Wearing apparel,<br />
except footwear 0,183 0,251 0,343 4 0,455 0,556 0,664 4 144%<br />
323 Lea<strong>the</strong>r products 0,355 0,539 0,601 3 0,711 0,895 0,926 2 133%<br />
324 Footwear,<br />
except rubber or<br />
plastic 0,393 0,528 0,627 2 0,731 0,909 0,996 1 92%<br />
331 Wood products,<br />
except furniture 0,138 0,125 0,151 8 0,347 0,352 0,404 9 -5%<br />
332 Furniture,<br />
except metal 0,054 0,065 0,082 15 0,216 0,268 0,342 16 89%<br />
341 Paper <strong>and</strong> products 0,133 0,153 0,150 7 0,280 0,309 0,313 14 18%<br />
342 Printing<br />
<strong>and</strong> publishing 0,106 0,053 0,081 13 0,417 0,243 0,294 12 13%<br />
361 Pottery, china,<br />
ear<strong>the</strong>nware 0,545 0,687 0,695 1 0,824 0,806 0,808 3 45%<br />
Medium-technology industries<br />
355 Rubber products 0,045 0,049 0,056 21 0,185 0,205 0,233 21 32%<br />
356 Plastic products 0,026 0,020 0,021 26 0,157 0,145 0,134 26 -22%<br />
362 Glass <strong>and</strong> products 0,037 0,049 0,039 24 0,161 0,207 0,199 25 52%<br />
369 O<strong>the</strong>r non-metallic<br />
mineral products 0,064 0,064 0,108 14 0,266 0,289 0,414 11 102%<br />
371 Iron <strong>and</strong> steel 0,054 0,062 0,084 16 0,226 0,231 0,303 18 45%<br />
372 Non-ferrous metals 0,042 0,053 0,067 19 0,168 0,190 0,223 23 66%<br />
381 Fabricated metal<br />
products 0,089 0,024 0,037 20 0,245 0,138 0,188 24 -55%<br />
390 O<strong>the</strong>r manufactured<br />
products 0,148 0,099 0,100 10 0,441 0,359 0,380 7 -45%<br />
High-technology industries<br />
351 Industrial chemicals 0,039 0,106 0,210 9 0,207 0,353 0,612 8 415%<br />
352 O<strong>the</strong>r chemicals 0,030 0,037 0,055 25 0,160 0,184 0,250 22 23%<br />
382 Machinery,<br />
except electrical 0,052 0,054 0,060 18 0,251 0,272 0,279 17 33%<br />
383 Machinery, electric 0,045 0,039 0,052 23 0,244 0,198 0,204 20 24%<br />
384 Transport equipment 0,053 0,082 0,110 12 0,249 0,314 0,369 13 144%<br />
385 Pr<strong>of</strong>essional &<br />
scientific equipment 0,096 0,121 0,129 11 0,311 0,373 0,347 10 17%<br />
Note: Authors’ calculation based on UNIDO (2004) database.<br />
31