Samu F, Szinetár C, Szita E, Fetykó K & Neidert D - European ...
Samu F, Szinetár C, Szita E, Fetykó K & Neidert D - European ...
Samu F, Szinetár C, Szita E, Fetykó K & Neidert D - European ...

Create successful ePaper yourself
Turn your PDF publications into a flip-book with our unique Google optimized e-Paper software.
Variations in agrobiont spiders in Hungary 107<br />
N = 48 fields), while the remaining 25 % of the spiders<br />
belonged to 246 non-agrobiont species. The rare<br />
end of any community is always the most difficult<br />
to sample, and most vulnerable to undersampling<br />
bias. Therefore, when statistically considering the<br />
non-agrobiont species of spider assemblages (= nonagrobiont<br />
sub-assemblage), we only included those<br />
species into these analyses for which the whole data<br />
set had a cumulated individual count ≥ 50. Applying<br />
the inclusion rule, for the possible crop/method<br />
combinations we achieved the following number of<br />
non-agrobiont species: 29 spp. in alfalfa/pitfall; 28<br />
spp. in alfalfa/D-vac; 32 spp. in cereal/pitfall and 25<br />
spp. in cereal/D-vac.<br />
We tested whether spider assemblages changed<br />
with geographical location by performing Mantel<br />
tests, with Monte Carlo simulation to derive significance<br />
(MCCUNE & MEFFORD 2010). This tested<br />
for congruence between the geographical distance<br />
(Eucledian distance) of the study plots and the distance<br />
structure of the spider assemblages (Sørensen<br />
distance measure). Agrobionts and non-agrobionts<br />
were tested separately in the study plots.<br />
We analysed data sets gained by the two sampling<br />
methods and in the two crops separately, and also<br />
treated the agrobiont and the non-agrobiont subassemblages<br />
separately.<br />
Regional differences in Pardosa agrestis life history<br />
We studied the generation numbers and the occurrence<br />
of first adult individuals in the common agrobiont<br />
wolf spider Pardosa agrestis. This comparison<br />
involved comparing fields along a NW – SE gradient<br />
during 6 sampling years (in the period 1993-2003) in<br />
pairwise comparisons, where in each year one northern<br />
and one southern population was compared, with<br />
a minimum distance of 126 km in between (see Tab. 1<br />
for the sampling locations). Population samples were<br />
collected by pitfalls, emptied at weekly intervals.<br />
Results<br />
a) Regional differences in agrobiont sub-assemblages<br />
The similarity structure of the analysed spider sub-assemblages<br />
was congruent with the geographic distance<br />
matrices, except for the alfalfa agrobiont sub-assemblage<br />
sampled by pitfalls. Relative to each other, the<br />
similarity between geographically close non-agrobiont<br />
sub-assemblages was always higher than it was between<br />
agrobiont sub-assemblages (Fig. 1).<br />
Although average agrobiont similarity among<br />
fields was a moderate 37 % (Sørensen similarity,<br />
abundance data) it was nearly twice as high as the<br />
20 % similarity among fields if non-agrobiont species<br />
were considered (a significant difference: paired t-test<br />
comparing average similarity – based on all possible<br />
field pairings − of the agrobiont and non-agrobiont<br />
sub-assemblages for each crop and sample method<br />
combination: t = 7.37, d.f. = 3, P = 0.005).<br />
<br />
<br />
<br />
<br />
<br />
<br />
<br />
<br />
<br />
<br />
<br />
<br />
<br />
<br />
<br />
<br />
<br />
<br />
<br />
<br />
<br />
<br />
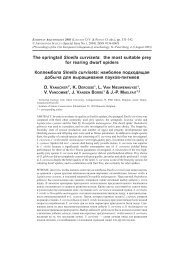
Figure 1: Standardised Mantel statistics of relationships<br />
between distances in the physical and in the community<br />
space separately analysed by (i) sub-assemblage type<br />
(agrobionts or non-agrobionts), (ii) crop type and (iii) collecting<br />
method. Asterisks denote the significance of the<br />
Mantel statistics at the P=0.05 level, obtained by Monte<br />
Carlo simulation.<br />
<br />
<br />
<br />
<br />
<br />
<br />
<br />
<br />
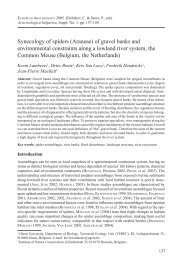
Figure 2: First occurrence of adult P. agrestis individuals in days<br />
counted from 1 st January. Each year a new pair of northern<br />
and a southern populations (N = 6 pairs) were compared<br />
with a minimum distance of 126 km in between.