OIL PRICES AND REFINERY ACTIVITY - Oil Market Report - IEA
OIL PRICES AND REFINERY ACTIVITY - Oil Market Report - IEA
OIL PRICES AND REFINERY ACTIVITY - Oil Market Report - IEA

You also want an ePaper? Increase the reach of your titles
YUMPU automatically turns print PDFs into web optimized ePapers that Google loves.
<strong>OIL</strong> <strong>PRICES</strong> <strong>AND</strong> <strong>REFINERY</strong> <strong>ACTIVITY</strong> INTERNATIONAL ENERGY AGENCY - MONTHLY <strong>OIL</strong> MARKET REPORT<br />
<strong>OIL</strong> <strong>PRICES</strong> <strong>AND</strong> <strong>REFINERY</strong> <strong>ACTIVITY</strong><br />
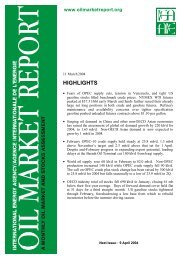
Summary<br />
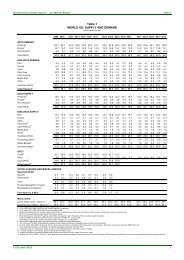
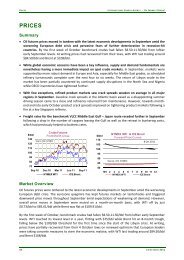
• Crude oil prices strengthened in the first part of November, leaving October’s correction far behind.<br />
Crude markets tightened due to continued OPEC adherence to production reductions, and so did<br />
product markets due to declining crude runs associated with poor margins. Iraq further fuelled the<br />
market rally with its decision to reject an interim two-week continuation of the sixth phase of the UN<br />
“oil-for-food” programme, leading to the suspension of loadings by 24 November. Key producers’<br />
pronouncements about supporting “stable markets”, speculation about possible sales by consumer<br />
countries from their strategic reserves and Iraq’s announcement that it might be prepared to accept a<br />
simple six month roll-over of the “oil-for-food” programme calmed the market at month end.<br />
However, demand continues to outstrip supply and stocks are rapidly approaching recent lows of 1996.<br />
• Futures markets activity was surprisingly subdued. The market was driven by fundamentals,<br />
especially inventory levels and the high rate of crude and product stock draws. The futures curves<br />
remain in steepening backwardation (downward sloping forward price curves), as prices in January<br />
increased more than prices in succeeding months. Backwardation reduces the incentive to hold<br />
inventory.<br />
• Spot product prices rose on average in October, but lagged behind comparable crude oil price<br />
increases. Middle distillates fared best, followed by lighter products, with the heavier products losing<br />
ground. North American product prices showed the largest increase, followed by those in Europe and<br />
then Asia. Reduced refinery throughputs and increased seasonal demand are drawing down inventory,<br />
leaving markets somewhat exposed with respect to possible Y2K disruptions.<br />
• Refinery margins collapsed in November, as refiners got caught in a squeeze between rapidly rising<br />
crude oil prices and lagging product prices. Margins fell despite voluntary throughput reductions,<br />
scheduled and unscheduled maintenance and weather-related disruptions. At current levels, margins<br />
are too low to provide incentives for refiners to increase runs. Consequently, crude runs are likely to<br />
continue falling and product inventory declines may accelerate.<br />
• Refinery throughputs of OECD countries fell by 200 kb/d in October from September levels. Crude<br />
throughputs in OECD North America accounted for the bulk of the reduction, only partly offset by<br />
increases in OECD Asia. Preliminary data show October refinery utilisation rates in OECD countries<br />
averaging 88%. The decrease in aggregate OECD throughputs followed seasonal patterns, but is<br />
tracking well below comparable levels established last year.<br />
29<br />
28<br />
27<br />
26<br />
25<br />
24<br />
23<br />
22<br />
21<br />
20<br />
19<br />
18<br />
17<br />
16<br />
15<br />
14<br />
13<br />
12<br />
11<br />
10<br />
9<br />
12 Mth WTI Ave<br />
Spot Crude Prices<br />
November 1998 - November 1999<br />
Nov Dec Jan Feb Mar Apr May Jun Jul Aug Sep Oct Nov<br />
Brent WTI Dubai<br />
26 8 DECEMBER 1999
INTERNATIONAL ENERGY AGENCY - MONTHLY <strong>OIL</strong> MARKET REPORT <strong>OIL</strong> <strong>PRICES</strong> <strong>AND</strong> <strong>REFINERY</strong> <strong>ACTIVITY</strong><br />
Crude <strong>Oil</strong> Prices and CIF Import Costs<br />
The top stories of November crude oil markets are price volatility and Iraq. But the story behind the story<br />
has nothing to do with Iraq. It is about tightening markets, stock draws, Asian recovery, refinery margins,<br />
Y2K uncertainties, political wrangling and OPEC paralysis - a fear of destabilising a hard-won and<br />
perhaps unique consensus. Iraqi posturing is made possible by, and simply adds one more dimension to,<br />
this mix.<br />
Crude oil prices experienced significant gains in the first part of the month. They resumed their upward<br />
path, putting behind them October’s correction. These gains were supported by stories emanating from<br />
OPEC about maintaining production ceilings, weather-related disruptions in the Black Sea and the US<br />
Gulf Coast (USGC), increased Asian purchases and global inventory reductions. Iraq further fuelled the<br />
market with its decision to reject an interim two week continuation of the sixth phase for the UN “oil-forfood”<br />
programme and to suspend loadings on 24 November. This trend was broken at the end of the<br />
month by a sharp drop in prices associated with OPEC pronouncements about supporting “stable markets”.<br />
Also contributing to this correction were statements about possible sales from the US Strategic Petroleum<br />
Reserve (SPR), mild weather and Iraqi’s announcement that it was prepared to accept a simple six month<br />
roll-over of the “oil-for-food” programme.<br />
Spot Crude <strong>Oil</strong> Prices and Differentials<br />
(monthly and weekly averages, $/bbl)<br />
Sept Oct Nov Change<br />
Week Ending:<br />
22 Oct 29 Oct 05 Nov 12 Nov 19 Nov 26 Nov<br />
WTI 23.85 22.69 24.96 2.26 22.55 22.60 22.70 24.49 26.01 27.36<br />
Brent Dated 22.49 22.01 24.58 2.57 21.54 21.65 22.32 25.35 25.30 25.79<br />
Urals (delivered Mediterranean) 21.79 21.29 24.10 2.81 20.90 20.96 21.66 24.73 24.81 25.49<br />
Dubai 21.95 21.47 23.03 1.57 21.33 21.24 21.49 23.45 23.56 24.25<br />
Tapis 23.80 23.60 24.78 1.18 23.48 23.60 23.23 24.21 25.54 26.48<br />
Brent over Dubai 0.54 0.54 1.55 0.21 0.41 0.83 1.90 1.74 1.54<br />
WTI over Brent 1.36 0.69 0.37 1.01 0.95 0.38 -0.86 0.72 1.57<br />
Tapis over Brent 1.31 1.59 0.19 1.94 1.95 0.91 -1.14 0.24 0.69<br />
Brent 1st month minus 2nd month 0.43 -0.06 0.56 -0.18 -0.16 0.13 0.54 0.57 0.82<br />
WTI 1st month minus 2nd month 0.26 -0.01 0.34 -0.23 -0.05 0.05 0.18 0.45 0.55<br />
After another wild roller-coaster ride, the speculative element in the market has been displaced by<br />
fundamentals. Although rumours abound, it is inventory data that are ultimately driving markets.<br />
Increased Asian demand, aggravated by the region’s commercial storage limitations, is “pulling” Atlantic<br />
Basin crudes east, strengthening them at the expense of their Pacific counterparts. This shift in trade<br />
patterns is rapidly drawing down Atlantic Basin stocks. Weather-related disruptions in Urals loading at<br />
the Black Sea port of Novorossiisk and ongoing force majeures due to political unrest in Nigeria,<br />
combined with Iraqi suspension of Kirkuk loadings have strengthened European crude oil prices and<br />
accelerated inventory draws. Similarly, scheduled refinery maintenance, low refining margins, weather<br />
related disruptions in the USGC and year-end US tax-induced selling all contribute to increased product<br />
stock draws.<br />
The market anticipates that OPEC will maintain its resolve into the new year. Compliance rates are close<br />
to 90%. The possibility that some consumer countries might release part of their strategic reserves has had<br />
a calming influence on the market as have key producers’ announcements that they will work with<br />
consuming nations to ensure adequate supply in the face of possible Y2K problems and potential<br />
continuation of Iraqi disruptions. The two events effectively cap the range of escalating prices.<br />
Consequently, fundamentals - as reflected in stock draws - have become the focus of attention. Confusion<br />
remains. Declining stock levels contribute to heightened volatility. Yet, for the time being, the<br />
speculative dimension has been constrained, with the paper market now responding to physical events.<br />
November saw significant price increases in all major crudes, led by Atlantic Basin and, in particular,<br />
Mediterranean crudes. On a month-on-month basis, Iranian Light and Heavy and Russian Urals prices<br />
increased 14%. North West European and West African crudes rose by 12%, followed by US crudes in<br />
the 10% range. Mid-East prices gained 7%, while Far-East prices lagged, at 5%. Paper markets generally<br />
underperformed their physical counterparts.<br />
8 DECEMBER 1999 27
<strong>OIL</strong> <strong>PRICES</strong> <strong>AND</strong> <strong>REFINERY</strong> <strong>ACTIVITY</strong> INTERNATIONAL ENERGY AGENCY - MONTHLY <strong>OIL</strong> MARKET REPORT<br />
Louisiana Light Sweet (LLS) gained $2.70 per barrel over the month, followed by West Texas<br />
Intermediate (WTI) and West Texas Sour (WTS). Among the major internationally-traded crudes, Dated<br />
Brent kept pace with LLS, while Dubai lost ground. The regional winners were Urals and Iranian Light<br />
and Heavy in the Mediterranean. Minas and Tapis lost ground in Asia. Year-to-date, both North Sea and<br />
Mediterranean crudes are up by over 130%, while WTI has doubled in price. The WTI 12-month average<br />
price is $18.17 compared to $16.69 for Brent and $16.22 for Dubai, still well below OPEC’s stated target<br />
ranges.<br />
A<br />
T<br />
A<br />
L<br />
A<br />
N<br />
T<br />
I<br />
C<br />
B<br />
A<br />
S<br />
I<br />
N<br />
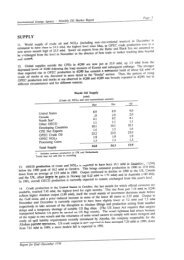
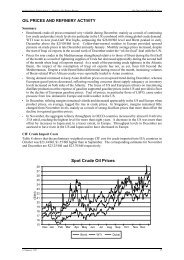
Average Spot, Paper Crude <strong>Oil</strong> Prices and Differentials - November 1999<br />
WTI-NYMEX Brent IPE Brent Forward<br />
$24.85 $24.13 $24.67 Tapis<br />
-0.72 $0.55 $24.78<br />
-$0.20 -$1.12<br />
$0.45 -0.09<br />
-$0.11 Minas<br />
$0.92 $23.66<br />
WTI-Spot Dated Brent -$0.63<br />
$24.96 -$0.38 $24.58 $1.55<br />
$1.37<br />
Dubai<br />
$23.03<br />
$0.18<br />
-$0.81<br />
-$0.43<br />
Oman<br />
-$0.15 $23.21<br />
$0.12<br />
$1.06 $1.51<br />
$0.48<br />
$0.66 $0.94 $0.45<br />
-$1.03<br />
LLS Forcados Es Sider Iran Light Iran Heavy Urals<br />
$25.39 $24.73 $24.46 $23.52 $23.07 $24.10<br />
This graph depicts regional crude oil prices and differentials. Dated Brent is a widely traded spot crude and a benchmark of global sweet crude oil prices. It<br />
is referenced in approximately 80% of all international term and contract sales. Average monthly closing prices are arranged around the outside of the graphic,<br />
with differentials between crudes on the inside and differentials to Dated Brent along the axis. Reflecting geography, Atlantic Basin crudes are connected on<br />
the left, while Mediterranean crudes are located along the bottom with Middle and Far East crudes along the right.<br />
The US Midcontinent market, home of WTI Cushing (the NYMEX futures market delivery location),<br />
continued to experience contradictory signals. For the early part of the month, both LLS and Brent traded<br />
at a contra-seasonal premium to WTI despite large inland stock draws. These premia were associated with<br />
strength in the Brent markets due to high Asian demand which pulled Atlantic Basin crudes east.<br />
Consequently, WTI prices weakened relative to their Gulf Coast counterparts. This relationship reversed<br />
towards the end of the month as news of “Iraq” spooked the paper market, but re-established itself at the<br />
end of the month. LLS, the regional sweet marker crude for the US Gulf Coast, traded at an average<br />
discount of 67 cents to WTI earlier in the year. Strength in LLS relative to WTI is a reflection of limited<br />
arbitrage opportunities. With Brent-based crudes pulled east, there is less competition for LLS on the Gulf<br />
Coast.<br />
The strength of Dated-Brent versus WTI is a reflection of four factors. First, economy-driven and<br />
seasonal Asian demand is pulling Brent-based North Sea and African crudes east. This tightens the overall<br />
Atlantic Basin market and increases Brent prices. This market is already tight due to OPEC production<br />
ceilings and the growing impact of stock draws. The second factor is reported “squeezes” on physical oil.<br />
As liquidity decreases, the Brent spot and forward markets have limited volumes concentrated in the hands<br />
of a few traders, allowing prices to rise in conjunction with the relative unavailability of crude. Third, there<br />
were ongoing supply disruptions in Nigeria due to civil unrest. The Nigerian problem shut in significant<br />
volumes of crude at a time of increased demand. Forcados prices benefited from these developments<br />
28 8 DECEMBER 1999<br />
P<br />
A<br />
C<br />
I<br />
F<br />
I<br />
C<br />
B<br />
A<br />
S<br />
I<br />
N
INTERNATIONAL ENERGY AGENCY - MONTHLY <strong>OIL</strong> MARKET REPORT <strong>OIL</strong> <strong>PRICES</strong> <strong>AND</strong> <strong>REFINERY</strong> <strong>ACTIVITY</strong><br />
strengthening relative to Brent. Fourth, weather-related delays in Urals loadings, Russian product<br />
restrictions and the halt of Iraqi exports further limited supply and resulted in upward pressure on price.<br />
Being more exposed, Mediterranean prices increased more than their North West European counterparts.<br />
($bbl)<br />
3.00<br />
2.50<br />
2.00<br />
1.50<br />
1.00<br />
0.50<br />
0.00<br />
-0.50<br />
-1.00<br />
-1.50<br />
Nov Dec Jan Feb Mar Apr May<br />
($/bbl)<br />
25<br />
24<br />
23<br />
22<br />
21<br />
20<br />
19<br />
18<br />
17<br />
16<br />
15<br />
14<br />
13<br />
US Gulf Coast Differentials<br />
12 Mth Ave<br />
Jun Jul<br />
LLS-WTI WTI-Brent<br />
Aug Sep Oct<br />
NYMEX WTI Forward Price Curve<br />
30-Nov<br />
29-Oct<br />
30-Jul<br />
12<br />
Year ago<br />
11<br />
1 2 3 4 5 6 7 8 9 10 11 12<br />
Month Forward<br />
Nov<br />
($/bbl)<br />
3.00<br />
2.50<br />
2.00<br />
1.50<br />
1.00<br />
0.50<br />
0.00<br />
-0.50<br />
WTI/Brent/Dubai Differentials<br />
-1.00<br />
12 Mth Ave<br />
-1.50<br />
Nov Dec Jan Feb Mar Apr May Jun Jul Aug Sep Oct Nov<br />
($/bbl)<br />
26<br />
25<br />
24<br />
23<br />
22<br />
21<br />
20<br />
19<br />
18<br />
17<br />
16<br />
15<br />
14<br />
13<br />
12<br />
11<br />
10<br />
9<br />
30-Nov<br />
29-Oct<br />
30-Jul<br />
Year ago<br />
WTI-Brent Dubai-Brent<br />
East-of-Suez markets were negatively affected by the strength in Atlantic Basin crude prices. The Brent-<br />
Dubai differential widened significantly as Asian refiners bid up the price of Brent by pulling West<br />
African crudes east. A surge in seasonal demand, combined with increased economic activity, possible<br />
Y2K related stockpiling, minimal commercial storage and low regional stocks caused Asia-Pacific buyers<br />
to bid for available Atlantic Basin crudes. Prices reacted accordingly. For most of the month, European<br />
and US buyers were priced out of the West African market. US refiners had little choice other than to<br />
draw down stocks. This trend dovetails rather nicely with the US refineries’ tax-induced strategy of<br />
holding minimal stocks at the end of the year.<br />
Dubai prices rose in conjunction with Oman and both outperformed their far east counterparts. These<br />
crudes are generally more sour and heavier than their West African and North Sea counterparts, and were<br />
discounted accordingly. At the same time, Malaysian Tapis and Minas were exposed to increased<br />
competition from Atlantic Basin crudes. However, Minas, a heavy sweet crude, benefited from OPEC and<br />
Indonesian supply disruptions, growing distillate demand and reduced exports of Chinese Daqing crude.<br />
Concerns about possible Y2K problems appear to have rekindled the appetite of Asian utilities for straightrun<br />
fuels. Straight-run fuels, crudes with low sulphur and impurities but high in caloric value, provide<br />
utilities with enhanced storage options and flexibility over competing fuel sources such as natural gas,<br />
LPG, nuclear.<br />
IPE Brent Forward Price Curve<br />
Dated 1 2 3 4 5 6 7 8 9 10 11 12<br />
Month Forward<br />
8 DECEMBER 1999 29
<strong>OIL</strong> <strong>PRICES</strong> <strong>AND</strong> <strong>REFINERY</strong> <strong>ACTIVITY</strong> INTERNATIONAL ENERGY AGENCY - MONTHLY <strong>OIL</strong> MARKET REPORT<br />
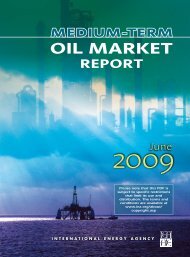
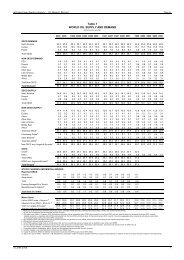
The forward price curves for WTI and Brent, shown in the two graphs above, pivoted upwards into<br />
steeper backwardation over the month, primarily as a result of the increase in front-month prices associated<br />
with the Iraqi supply disruptions. Prices have shifted into steeper backwardation (prices for the current<br />
month higher than prices for succeeding months). In general, front-month prices have gained at the<br />
expense of prices further out along the curve, increasing the degree of backwardation. The 30 November<br />
WTI and Brent curves stand in stark contrast to the mild upward slope of the forward price curves of a<br />
year ago.<br />
The current differential between WTI and Brent futures averaged 72 cents per barrel in favour of WTI.<br />
The differential stood at $1.90 in May and was down to 89 cents as recently as September. The collapse<br />
of this paper-on-paper differential reflects the underlying weakness of WTI and the strengthening of Brent<br />
caused by increasing Asian demand. The WTI spot-versus-futures differential favoured “wet” barrels by<br />
11 cents per barrel whereas the IPE Brent spot-versus-futures differential favoured “paper” by 45 cents.<br />
Backwardation undermines the incentive to build or hold inventory, because prices are expected to be<br />
lower tomorrow than they are today. Consequently, speculative commercial stocks would be expected<br />
to flood the market. But, despite all the talk of rising prices associated with a tightening market, the<br />
current slope of the futures curves suggests that the market expects prices to move down. The slope of<br />
the curves also suggests that the market is not overly concerned about possible Y2K supply disruptions.<br />
As the accompanying chart shows, November witnessed a slight decrease in the number of net<br />
open-interest positions, from 53,000 to 43,000. This decrease in paper demand follows on the heels of<br />
October’s massive sell-off of long speculative positions. It further undermines physical demand and<br />
prices. By collectively selling off their massively-long speculative positions in October, paper traders<br />
inadvertently drove down crude oil prices with no change in fundamentals. By reducing their positions<br />
at Cushing, the NYMEX delivery point, speculators have unwittingly increased the importance of<br />
fundamentals in the market.<br />
125000<br />
75000<br />
25000<br />
-25000<br />
-75000<br />
-125000<br />
Volume and Distribution of WTI<br />
Contracts on the NYMEX<br />
3/97 6/97 9/97 12/97 3/98 6/98 9/98 12/98 3/99 6/99 9/99<br />
Non-Commercial Commercial Non-<strong>Report</strong>ing<br />
Given the uncertainties surrounding Y2K, Iraq and the risk of market imbalances associated with<br />
continuing OPEC production restraints, one is left to ponder whether the current financial markets are<br />
efficient in managing risk. Commodity speculators are not overly interested in underlying commodities<br />
or market fundamentals. They make money on the margin and flourish in times of volatility. Risk and<br />
uncertainty are their feeding grounds. The greater the volatility, the greater the potential for reward. It<br />
is hard to imagine any market more stressed and uncertain than that of crude oil right now. And yet, the<br />
speculators have exited and are staying away in droves.<br />
The preliminary weighted average CIF crude import costs to <strong>IEA</strong> Member countries in September<br />
averaged $21.34 per barrel, up $1.82, or 9%, over August. This was the seventh consecutive month in<br />
which prices increased. CIF prices increased across all major <strong>IEA</strong> regions with prices in <strong>IEA</strong> North<br />
30 8 DECEMBER 1999
INTERNATIONAL ENERGY AGENCY - MONTHLY <strong>OIL</strong> MARKET REPORT <strong>OIL</strong> <strong>PRICES</strong> <strong>AND</strong> <strong>REFINERY</strong> <strong>ACTIVITY</strong><br />
America leading the way at 11%, followed by <strong>IEA</strong><br />
Europe and <strong>IEA</strong> Pacific with 9% price increases.<br />
Average CIF price increases generally correspond<br />
to underlying crude-oil price increases in the same<br />
period. On a year-to-date basis, <strong>IEA</strong> North<br />
America experienced the largest CIF price increase<br />
at 110%. <strong>IEA</strong> Europe followed at 100% and <strong>IEA</strong><br />
Pacific was up 90%. As such, average CIF prices<br />
lagged slightly behind the underlying feedstock<br />
price increases (Dated-Brent, 130% on a year-todate<br />
basis; spot WTI, 100%; and Dubai, 115%),<br />
partly reflecting lower shipping costs due to weak<br />
tanker markets.<br />
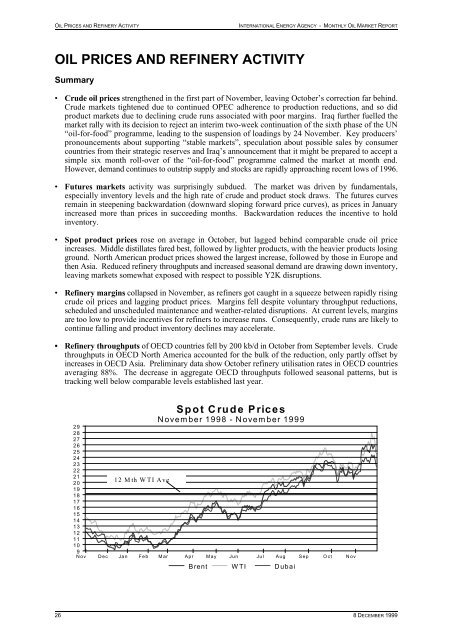
Monthly Average Spot Product Prices and Differentials - November 1999<br />
Rotterdam<br />
New York Harbour Singapore<br />
Gasoline: $30.04<br />
Naphtha $28.87<br />
Jet/Kero $28.98<br />
Gasoil: $26.98<br />
HSFO: $18.44<br />
Gasoline: $1.10<br />
Naphtha $3.67<br />
Jet/Kero $-0.31<br />
Gasoil: $-0.08<br />
HSFO: $-1.63<br />
Gasoline: $0.01<br />
Naphtha $4.52<br />
Jet/Kero $1.33<br />
Gasoil: $0.45<br />
HSFO: $0.06<br />
Gasoline: $28.95<br />
Naphtha $25.21<br />
Jet/Kero $29.29<br />
Gasoil: $27.07<br />
HSFO: $20.07<br />
Gasoline: $4.23<br />
Naphtha $3.09<br />
Jet/Kero $1.61<br />
Gasoil: $2.43<br />
HSFO: $-3.25<br />
Mediterranean<br />
Gasoline: $29.16<br />
Naphtha $24.35<br />
Jet/Kero $27.65<br />
Gasoil: $26.53<br />
HSFO: $18.38<br />
1<br />
Weighted-Average CIF Crude Import Cost by Area<br />
$/bbl<br />
Total <strong>IEA</strong><br />
<strong>IEA</strong><br />
Europe<br />
<strong>IEA</strong> North<br />
America<br />
Gasoline: $3.36<br />
Naphtha $3.09<br />
Jet/Kero $1.61<br />
Gasoil: $2.43<br />
HSFO: $-3.25<br />
Gasoline: $25.81<br />
Naphtha $25.79<br />
Jet/Kero $27.38<br />
Gasoil: $24.55<br />
HSFO: $21.69<br />
Gasoline: $3.35<br />
Naphtha $-1.43<br />
Jet/Kero $0.27<br />
Gasoil: $1.98<br />
HSFO: $-3.31<br />
<strong>IEA</strong><br />
Pacific<br />
Apr 99 14.42 14.55 14.48 14.04<br />
May 99 15.34 14.87 15.57 16.02<br />
June 99 15.58 15.18 15.53 16.65<br />
Jul 99 17.71 18.12 17.43 17.36<br />
Aug 99* 19.52 19.91 19.18 19.30<br />
Sept 99* 21.34 21.70 21.31 20.95<br />
* estimated<br />
** CIF = cost, insurance and freight<br />
Spot Product Prices in November<br />
Much to the detriment of refining margins, product prices lagged behind advances in crude oil prices over<br />
the month. Middle distillates outperformed lighter ends, which outperformed the heavy ends of the product<br />
barrel. Jet/kero posted the largest gains across all markets, followed by gasoil. On average, these products<br />
kept pace with price changes in their underlying crude feedstocks. North American product prices showed<br />
the largest increase, followed by Europe and then Asia. Monthly product price changes ranged from an<br />
increase of $3.12 per barrel for jet/kero in New York Harbour (NYH) to minus 68 cents per barrel for low<br />
sulphur fuel oil (LSFO) in the Mediterranean.<br />
Gasoline prices increased across all markets. North American prices experienced the largest gains<br />
primarily in response to falling inventory levels. Prices were strongest in New York Harbour and the<br />
Mediterranean followed by Rotterdam and Singapore. Based on $4 per barrel differentials, product that<br />
can meet US specifications is expected to flow from Asia to meet North America demand. Naphtha<br />
prices showed considerable strength in Europe and Asia as a result of strong petrochemical feedstock<br />
demand. Falling natural gas and gas liquids prices in response to milder than anticipated weather, should<br />
weaken naphtha demand and prices. Jet/kero prices had the largest increase across all markets. These<br />
gains reflect the onset of increased travel and perhaps some potential stockpiling in advance of Y2K.<br />
8 DECEMBER 1999 31
<strong>OIL</strong> <strong>PRICES</strong> <strong>AND</strong> <strong>REFINERY</strong> <strong>ACTIVITY</strong> INTERNATIONAL ENERGY AGENCY - MONTHLY <strong>OIL</strong> MARKET REPORT<br />
Spot Product Prices<br />
(monthly and weekly averages, $/bbl)<br />
Week Ending<br />
Sept Oct Nov Nov-Oct % Chg Sept Oct Nov<br />
29 Oct 05 Nov 12 Nov 19 Nov 26 Nov<br />
Rotterdam, Barges FOB Differential to Brent<br />
Premium 0.15 g/l 28.11 27.93 28.95 1.01 3.6% 27.50 26.52 28.29 29.89 31.18 5.63 5.92 4.37<br />
Regular Unleaded 26.00 26.01 27.22 1.21 4.7% 25.60 24.84 26.62 28.15 29.35 3.51 4.00 2.64<br />
Naphtha 23.05 24.55 25.21 0.65 2.7% 24.32 24.22 24.25 25.42 27.08 0.57 2.55 0.63<br />
Jet/Kerosene 26.58 26.19 29.29 3.10 11.9% 26.50 26.44 28.43 30.31 32.11 4.10 4.18 4.71<br />
Gasoil 24.71 24.59 27.07 2.48 10.1% 24.77 24.71 26.21 28.18 29.50 2.22 2.58 2.49<br />
Fuel <strong>Oil</strong> 1.0%S 18.15 19.55 19.78 0.23 1.2% 19.88 19.31 19.61 19.95 20.26 -4.33 -2.46 -4.80<br />
Fuel <strong>Oil</strong> 3.5%S 18.43 19.70 20.07 0.37 1.9% 19.84 19.17 19.79 20.46 20.88 -4.05 -2.31 -4.51<br />
Mediterranean - Basis Italy, Cargoes FOB Differential to Brent<br />
Premium 0.15 g/l 28.39 27.90 29.16 1.26 4.5% 27.80 27.15 28.74 29.89 30.94 6.60 6.61 5.06<br />
Naphtha 22.21 23.66 24.35 0.69 2.9% 23.53 23.42 23.34 24.54 26.25 0.41 2.37 0.25<br />
Jet/Kerosene 25.34 24.64 27.62 2.98 12.1% 25.24 25.13 26.67 28.31 30.08 3.55 3.35 3.52<br />
Gasoil 23.75 23.93 26.53 2.60 10.9% 24.30 24.18 25.82 27.55 28.91 1.96 2.64 2.43<br />
Fuel <strong>Oil</strong> 1.0%S 17.72 18.79 18.11 -0.68 -3.6% 19.01 18.37 17.82 17.96 18.26 -4.07 -2.50 -5.99<br />
Fuel <strong>Oil</strong> 3.5%S 17.39 18.52 18.38 -0.14 -0.7% 18.86 18.59 18.15 18.16 18.56 -4.40 -2.78 -5.72<br />
NY Harbour, Barges Differential to Brent<br />
Premium Unleaded 93 30.92 28.09 30.04 1.95 6.9% 27.17 27.68 29.82 30.68 32.55 7.07 5.40 5.09<br />
Regular Unleaded 87 28.88 26.34 29.17 2.83 10.8% 26.00 26.68 29.20 29.88 31.55 5.03 3.64 4.22<br />
Jet/Kerosene 26.82 25.87 28.98 3.12 12.1% 26.26 26.51 28.61 30.04 31.13 2.98 3.17 4.03<br />
No.2 (Heating <strong>Oil</strong>) 25.27 24.48 27.19 2.71 11.1% 24.78 25.19 26.93 28.23 28.96 1.42 1.79 2.24<br />
Fuel <strong>Oil</strong> 1.0%S (Cargo) 19.52 19.45 19.56 0.11 0.6% 20.20 19.19 19.48 19.89 19.89 -4.33 -3.24 -5.39<br />
Fuel <strong>Oil</strong> 3.0%S (Cargo) 18.74 18.46 18.44 -0.02 -0.1% 18.70 18.08 18.08 18.66 19.06 -5.11 -4.23 -6.52<br />
Singapore, Cargoes Differential to Brent<br />
Gasoline Unleaded 95 26.83 24.78 25.81 1.04 4.2% 25.54 25.18 25.37 26.19 26.88 4.87 3.31 2.78<br />
Naphtha 24.55 24.69 25.79 1.09 4.4% 25.60 24.72 25.21 26.48 27.18 2.59 3.23 2.75<br />
Jet/Kerosene 26.40 25.90 27.38 1.48 5.7% 26.27 25.45 26.86 28.33 29.13 4.45 4.43 4.35<br />
Gasoil 23.10 23.60 24.55 0.95 4.0% 23.77 23.04 23.78 25.19 26.52 1.15 2.14 1.52<br />
LSWR (0.3%S) 18.95 20.46 21.22 0.75 3.7% 21.00 20.81 21.00 21.53 21.85 -3.00 -1.00 -1.82<br />
HSFO (3.5%S 180cst) 19.77 21.37 22.10 0.73 3.4% 22.15 21.46 21.96 22.53 22.87 -2.18 -0.10 -0.93<br />
HSFO (3.5%S 380cst) 19.36 20.97 21.69 0.72 3.5% 21.86 21.06 21.57 22.07 22.48 -2.59 -0.50 -1.34<br />
Gasoil prices experienced significant gains in North America and Europe in response to falling inventory<br />
levels and reduced Russian exports. Asian gasoil prices rose less, in response to milder weather, notably<br />
in Japan, and increased throughputs in China and India. The conclusion of Middle East term-price<br />
negotiations once again pave the way for product to flow east. The biggest losers from a pricing<br />
perspective were LSFO and high sulphur fuel oil (HSFO). Unseasonally mild weather has played havoc<br />
with these two products. Utilities that can switch between fuels have substituted away from fuel oil in<br />
favour of cheaper natural gas. Heavy fuel oil has simply been priced out of fuel-substitutable markets.<br />
In light of possible Y2K disruptions, some Asian utilities might be induced to pay a premium for straightrun<br />
products given the increased flexibility and security of oil and product storage and distribution systems<br />
as compared to natural gas, LPG and nuclear generation.<br />
Americas<br />
Spot product prices in the US gained across the board with middle distillates increasing more than light<br />
and heavier products. On average, however, November product prices lost ground against crude oil. Poor<br />
refining margins have led US refiners to reduce runs. Reduced runs have depleted product stocks. This<br />
complements rather nicely with the tax-motivated year-end destocking program of the US refining<br />
complex, but provides little cushion for possible weather disruptions or Y2K-related problems.<br />
Gasoline product prices in North America are rising in response to falling inventories. Stock are falling<br />
due to the impact of poor refining margins on throughputs and unscheduled maintenance, weather-related<br />
disruptions and refinery re-tooling to maximise winter heating fuel production. In addition, destocking<br />
is exacerbated by limited arbitrage opportunities and tax-induced year-end selling. Prices on the US West<br />
Coast have been under increased pressure due to the combined impact of tighter product specifications<br />
limiting competition and ongoing regional infrastructure problems. At current differentials, one would<br />
expect gasoline to begin to flow from Asia to North America to help build stocks.<br />
32 8 DECEMBER 1999
INTERNATIONAL ENERGY AGENCY - MONTHLY <strong>OIL</strong> MARKET REPORT <strong>OIL</strong> <strong>PRICES</strong> <strong>AND</strong> <strong>REFINERY</strong> <strong>ACTIVITY</strong><br />
$/bbl<br />
34<br />
32<br />
30<br />
28<br />
26<br />
24<br />
22<br />
20<br />
18<br />
16<br />
14<br />
12<br />
10<br />
New York Harbour Product Spot Prices<br />
8<br />
6<br />
Nov Dec Jan Feb Mar Apr May Jun Jul Aug Sep Oct Nov<br />
($/bbl)<br />
Gasoline Jet/Kero Gasoil LSFO HSFO<br />
Rotterdam Product Prices<br />
33<br />
31<br />
29<br />
27<br />
25<br />
23<br />
21<br />
19<br />
17<br />
15<br />
13<br />
11<br />
9<br />
7<br />
Nov Dec Jan Feb Mar Apr May Jun Jul Aug Sep Oct Nov<br />
Gasoline Naphtha Gasoil LSFO HSFO<br />
($/bbl)<br />
8<br />
6<br />
4<br />
2<br />
0<br />
-2<br />
-4<br />
-6<br />
-8<br />
New York Harbour Product Spread to WTI<br />
-10<br />
Nov Dec Jan Feb Mar Apr May Jun Jul Aug Sep Oct Nov<br />
($/bbl)<br />
8<br />
6<br />
4<br />
2<br />
0<br />
-2<br />
-4<br />
-6<br />
Gasoline Gasoil LSFO HSFO<br />
Distillate stocks also continued to fall, putting upward pressure on price. Despite mild weather, limited<br />
arbitrage opportunities combined with Russian export restrictions and reduced refinery throughputs are<br />
reducing North American distillate inventories in advance of possible Y2K disruptions and the peak winter<br />
heating season. The declines have been particularly severe in the US Northeast, the single largest heating<br />
oil consuming region in the world. An unexpected cold snap, or unanticipated refinery outages, could<br />
draw down middle distillate stocks sharply, contributing to spot outages and significant price gyrations.<br />
Fuel <strong>Oil</strong> prices, on the other hand, have weakened due to weather related factors. Milder temperatures<br />
have cratered natural gas prices, and any utility that can, but had not already substituted away from fuel<br />
oil, will. The dramatic run-up in crude oil prices has simply priced residual fuel out of the utilities market.<br />
The return of refineries from scheduled maintenance, and an increase in hydroelectric output, has reduced<br />
Mexican demand for residual fuel oil, undermining prices in the Gulf Coast region.<br />
Rotterdam Product Spreads to Brent<br />
-8<br />
Nov Dec Jan Feb Mar Apr May Jun Jul Aug Sep Oct Nov<br />
Gasoline Gasoil LSFO HSFO<br />
Europe<br />
As elsewhere, middle distillates led all other product price increases in Europe. German consumers<br />
rushed back into the market replenishing their depleted home heating oil inventories. The typical German<br />
fuel tank holds anywhere from 6 to 12 months worth of fuel supply. This comes at a time of reduced<br />
Russian exports and lower crude runs due to marginal refinery economics. Rising diesel prices have<br />
pulled European jet fuel in its wake. The switch in diesel specifications on 15 January 2000 has reduced<br />
overall kerosene production. Naphtha lost ground to crude oil due to the impact of reduced natural gas<br />
and gas liquids prices on petrochemical demand. At the margin, reduced crude runs impact naphtha more<br />
than other products, as it represents a smaller proportions of the “product barrel”.<br />
8 DECEMBER 1999 33
<strong>OIL</strong> <strong>PRICES</strong> <strong>AND</strong> <strong>REFINERY</strong> <strong>ACTIVITY</strong> INTERNATIONAL ENERGY AGENCY - MONTHLY <strong>OIL</strong> MARKET REPORT<br />
Gasoline prices, while increasing, lost ground to those in the US and Asia. Gasoil prices gained some<br />
strength from the Russian export ban on fuel oil products. But the ban is temporary and the end of the<br />
harvest season, coupled with increased Russian crude runs, could lead to increased exports. Displaced<br />
Asian product may also find its way into the European market, further depressing prices. In the end,<br />
middle distillate prices remained flat last month. LSFO and HSFO prices experienced the biggest<br />
declines in November. Milder than expected temperatures combined with reduced natural gas prices and<br />
increased hydroelectric generation undermined utility demand and fuel oil prices. Italian fuel oil sales,<br />
Europe’s largest market, have declined by 17% over the past three months. A harsher than expected<br />
winter and possible Y2K supply disruptions, could stress low product stocks and contribute to significant<br />
price fluctuations. November spot product prices were higher in Rotterdam than the Mediterranean for all<br />
commodities other than gasoline.<br />
Asia-Pacific<br />
Singapore product price increases trailed the other markets. Product prices rose on average by 4%, much<br />
less than the cost of imported crude. Asian gasoline continues to labour, in search of a home, as demand<br />
on the US West Coast levelled off with the restart of regional refining capacity. On average, prices are<br />
over $3 per barrel lower in Singapore than the other major refining centres. At these differentials, and<br />
given gasoline destocking in North America, arbitrage should soon begin to clear the market. Naphtha<br />
prices received support from increased petrochemical demand. A milder than anticipated winter,<br />
especially in Japan, has reduced gasoil demand and restrained prices.<br />
($/bbl)<br />
31<br />
29<br />
27<br />
25<br />
23<br />
21<br />
19<br />
17<br />
15<br />
13<br />
11<br />
9<br />
Singapore Product Prices<br />
7<br />
Nov Dec Jan Feb Mar Apr May Jun Jul Aug Sep Oct Nov<br />
Gasoline Jet/Kero Gasoil LSWR HSFO Naphtha<br />
($/bbl)<br />
8<br />
6<br />
4<br />
2<br />
0<br />
-2<br />
Singapore Product Spreads to Dubai<br />
-4<br />
Nov Dec Jan Feb Mar Apr May Jun Jul Aug Sep Oct Nov<br />
Gasoline Gasoil LSWR HSFO<br />
LSFO and HSFO prices fared better in Asia than in other refining centres. Asian fuel oil demand was<br />
supported by a number of factors including low crude runs, depleting stocks, increasing economic activity,<br />
Y2K stock building and increasing Chinese demand. China announced renewed import quotas to stem<br />
the tide of rising domestic prices. This should<br />
continue to strengthen heavier product prices into the<br />
future, although Chinese fuel switching away from<br />
crude into less expensive coal in the utility sector<br />
could dampen demand. Fuel oil stocks in Singapore<br />
are at their lowest level of the past seven years, not a<br />
very comfortable situation to be in on the eve of Y2K.<br />
End-User Product Prices<br />
End-user product prices in November followed a<br />
random pattern, as shown in Table 9 at the end of the<br />
<strong>Report</strong>. France and Spain experienced increases while<br />
prices in Germany, Italy and the UK generally<br />
declined. German diesel and domestic heating oil<br />
prices declined while those in the US increased.<br />
Similarly, Spanish heating fuel oil prices increased<br />
while German prices declined. Japan experienced<br />
relatively stable mid-month end-user product prices.<br />
Mid-Month End-User Product Price Changes<br />
November 1999 versus October 1999<br />
Local Currency Including Taxes<br />
1<br />
Gasoline<br />
Automotive<br />
Diesel 3<br />
Domestic<br />
Heating <strong>Oil</strong>•<br />
HFO for<br />
Industry 5<br />
US 0.0 2.8 3.9 na<br />
Canada 1.4 -0.5 na na<br />
France 0.2 2.0 3.1 1.5<br />
Germany -0.3 -5.7 -1.5 -1.8<br />
Italy -1.5 -1.3 0.1 0.5<br />
Spain 0.2 2.8 4.1 4.4<br />
UK -0.8 -0.9 0.8 2.0<br />
Japan 1.0 1.3 1.7 0.0<br />
1<br />
2<br />
3<br />
4<br />
5<br />
premium leaded gasoline for France, Italy, Spain, the UK; regular<br />
unleaded gasoline for Canada, Germany, Japan and the US<br />
estimated<br />
VAT excluded where it is refundable: Heavy Fuel <strong>Oil</strong> for Industry,<br />
Automotive Diesel for Industry<br />
kerosene<br />
high sulphur fuel oil price for France, Spain, the UK and Japan; low<br />
sulphur fuel oil price for Germany and Italy - details are shown in<br />
Table 9 at the back of the <strong>Report</strong><br />
34 8 DECEMBER 1999
INTERNATIONAL ENERGY AGENCY - MONTHLY <strong>OIL</strong> MARKET REPORT <strong>OIL</strong> <strong>PRICES</strong> <strong>AND</strong> <strong>REFINERY</strong> <strong>ACTIVITY</strong><br />
On a year-on-year basis, heating fuel oil showed the largest percentage increase, about 50%, followed by<br />
domestic fuel oil, automotive diesel and gasoline. Japan had the lowest overall year-on-year percent<br />
increases, less than 10%, and Spain, the highest, in the 30% range. In this respect, average end-user price<br />
increases have lagged behind both spot product and crude-oil price increases. This runs counter to the<br />
broader public perception.<br />
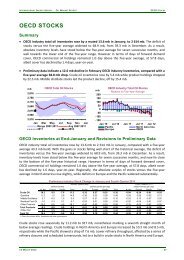
Refining Margins in November<br />
Refining margins collapsed in November. Refiners got caught in a squeeze between rapidly rising crude<br />
oil prices and lagging product prices. Margins collapsed despite voluntary throughput reductions and<br />
scheduled and unscheduled maintenance. At current levels, margins are too low to provide significant<br />
incentives to increase runs. Consequently, crude runs are falling and product inventories are on the<br />
decline, exacerbating the overall tightness in the global market. This destocking of the crude and product<br />
markets increases overall exposure to possible Y2K disruptions.<br />
Hydroskimming margins experienced the steepest declines and are mired in red ink. Cracking margins<br />
fared somewhat better, declining in all regions from October levels. Cracking, however, remained<br />
marginally positive in Singapore and the Mediterranean.<br />
Europe bore the brunt of the margin declines. Spiralling physical Brent prices undermined Rotterdam<br />
margins in the beginning of the month, while weather-related loading problems in the Black Sea caused<br />
a spike in Urals prices for the Mediterranean. The month closed with the suspension of Iraqi exports,<br />
which forced European refiners to scramble for higher-cost, lighter and more distant substitutes. Europe<br />
was forced to bid crude away from an ever tightening Atlantic Basin. To compound matters, Russia<br />
announced additional export restrictions to year’s end and Shell shut-in some of its Nigerian production.<br />
Rotterdam margins were supported by reduced crude runs in Northwest Europe, while the unscheduled<br />
closure of the Izmit and Aspropyrgos refineries in Turkey and Greece due to earlier earthquakes continued<br />
to strengthen prices in the Mediterranean.<br />
Refining Margins in Major Refining Centres<br />
(monthly and weekly averages, $/bbl)<br />
Sept Oct Nov<br />
Change 22 Oct<br />
Week Ending:<br />
29 Oct 05 Nov 12 Nov 19 Nov 26 Nov<br />
NW Europe<br />
Brent (Hydroskimming) -0.84 -0.22 -1.66 -1.44 0.21 0.31 -0.77 -3.10 -1.88 -1.29<br />
Brent (Cracking)<br />
Mediterranean<br />
0.49 0.90 -0.26 -1.17 1.33 1.37 0.31 -1.74 -0.36 0.36<br />
Urals (Hydroskimming) -0.27 0.68 -1.04 -1.72 1.16 1.24 0.23 -2.19 -1.34 -1.07<br />
Urals (Cracking)<br />
US Gulf Coast<br />
1.10 1.89 0.46 -1.43 2.38 2.40 1.39 -0.72 0.32 0.72<br />
Brent (Cracking) 1.31 -0.10 -0.92 -0.82 0.16 0.03 -0.37 -1.91 -1.01 -0.37<br />
WTI (Cracking)<br />
Singapore<br />
0.91 0.24 -0.04 -0.29 0.39 0.14 0.41 0.34 -0.43 -0.69<br />
Dubai (Hydroskimming) -0.58 0.49 -0.20 -0.69 0.55 1.29 0.37 -1.00 -0.21 -0.22<br />
Dubai (Cracking) 0.78 1.27 0.63 -0.64 1.24 2.02 1.14 -0.29 0.63 0.79<br />
For the purposes of this <strong>Report</strong>, refining margins are calculated on the basis of an “average” refinery that is running a “typical” crude slate in a specific refining<br />
centre. Consequently, reported margins should be taken as an indication, or proxy, of changes in profitability for a given refining centre. No attempt is made<br />
to model or otherwise comment upon the relative economics of specific refineries, running individual crude slates and producing custom product slates.<br />
Refiners on the US Gulf Coast fared better due to WTI’s relative weakness. Brent cracking margins<br />
plummeted, whereas WTI cracking operations posted more moderate declines. USGC margins were<br />
supported by weather-related throughput reductions and scheduled maintenance programs heading into<br />
peak winter heating fuel demand. US destocking means that appropriate price signals will be needed if<br />
refiners are to increase crude runs.<br />
Singapore cracking and hydroskimming margins declined over the month. Margins benefited from the<br />
relative weakness of Dubai and Asian crudes and the strength of the product market relative to crude oil.<br />
Dubai cracking margins, although low, were the highest of the four major refining centres. Singapore<br />
margins were supported by incremental Asian economic activity, low product inventories and significant<br />
reductions in crude throughputs due to marginal refining economics.<br />
8 DECEMBER 1999 35
<strong>OIL</strong> <strong>PRICES</strong> <strong>AND</strong> <strong>REFINERY</strong> <strong>ACTIVITY</strong> INTERNATIONAL ENERGY AGENCY - MONTHLY <strong>OIL</strong> MARKET REPORT<br />
OECD Refinery Throughputs in October<br />
Aggregate refinery throughputs of OECD countries in October decreased by 200 kb/d, or slightly less than<br />
0.5%. Throughputs in OECD Asia increased, fully offset by decreases in OECD North America and<br />
Europe. Japan, Korea, and the UK increased their crude runs, while runs in the US, France, Italy and<br />
Spain declined. Preliminary data suggest that refinery utilisation rates in OECD countries averaged 88%<br />
in September, a decline of 1.4 percentage points from 1998. The reductions in aggregate OECD<br />
throughputs follows seasonal patterns, but with crude runs well below comparable levels established last<br />
year.<br />
North American throughputs decreased by 50 kb/d from September, in line with seasonal patterns. US<br />
throughput fell by 60 b/d for an aggregate utilisation rate of just over 90%. Utilisation rates in Canada and<br />
Mexico continue to lag behind those of the US. October and November normally represents turn-around<br />
months when refiners switch to winter heating mode operations. Consequently, utilisation rates should<br />
continue their downward path. Low margins, unscheduled maintenance, weather-related problems and<br />
year-end tax selling strategies could exacerbate these declines. These throughput reductions are occurring<br />
in tandem with the destocking of crude inventories and should tighten the market, exposing prices to<br />
increased volatility.<br />
Estimated OECD Europe throughputs in October decreased by 260 kb/d. Current crude runs are well<br />
below levels of the previous three years. France and the Italy experienced the largest declines in OECD<br />
Europe. The strength of the Brent market played havoc with regional refinery margins, and European<br />
throughputs were reduced accordingly. Throughputs normally strengthen as European refiners gear up<br />
to meet peak seasonal heating demand. European refining peaks in the winter, whereas US refining output<br />
peaks in the summer. Nonetheless, OECD Europe utilisation rate stood at only 89% in October, a massive<br />
8.3 percentage point drop from the previous year.<br />
OECD Pacific throughputs increased slightly, by 130 kb/d, in October. While throughputs increased in<br />
Japan, utilisation rates remained low relative to other regions at a paltry 75%. In contrast, Korean<br />
refineries are operating at maximum capacity. The onset of peak winter demand, combined with the<br />
strengthening Asian economies, low commercial inventories and possible Y2K stockpiling, would<br />
normally result in increased throughputs. Poor margins, on the other hand, provide an economic<br />
disincentive to increase runs.<br />
In line with seasonal patterns, refinery throughputs in November are thought to have increased across all<br />
major OECD regions. US weekly statistics suggest that US throughput levels averaged 14.7 mb/d for the<br />
four weeks ending 26 November. The level of increase, however, is expected to be lower than in previous<br />
periods, restrained by the significant crude oil destocking program forced on the market by OPEC<br />
production constraints.<br />
Refinery Crude Throughputs and Utilisation in OECD Countries<br />
million barrels per day change from Sep 98 utilisation rate 2<br />
1<br />
June July Aug Sept Oct mb/d % Oct 99 Oct 98<br />
3<br />
OECD Europe 12.82 13.30 13.45 13.22 12.96 -1.220 -8.6 88.7% 97.0%<br />
France 1.59 1.87 1.80 1.64 1.56 -0.292 -15.7 90.0% 106.8%<br />
Germany 2.14 2.09 2.23 2.24 2.21 -0.110 -4.8 97.6% 102.5%<br />
Italy 1.54 1.56 1.80 1.84 1.69 -0.194 -10.3 83.2% 92.7%<br />
Netherlands 1.07 1.09 1.04 1.08 1.01 -0.217 -17.6 83.5% 101.4%<br />
Spain 1.13 1.18 1.18 1.21 1.18 0.019 1.6 92.2% 90.7%<br />
UK 1.68 1.63 1.57 1.58 1.62 -0.160 -9.0 93.0% 102.2%<br />
US 15.12 15.27 15.47 14.78 14.72 0.630 4.5 90.3% 89.0%<br />
Canada 1.75 1.58 1.67 1.65 1.64 -0.009 -0.6 89.0% 89.5%<br />
Mexico 0.99 1.12 1.20 1.16 1.17 -0.016 -1.4 75.3% 76.3%<br />
Japan 3.57 3.88 4.05 3.92 3.99 0.220 5.8 74.5% 70.1%<br />
Korea 2.18 2.40 2.13 2.40 2.46 0.092 3.9 99.9% 96.2%<br />
Australia/New Zealand 0.86 0.84 0.84 0.84 0.83 0.107 14.7 100.6% 87.7%<br />
4<br />
OECD Total 37.30 38.40 38.80 37.97 38.57 -0.192 -0.5 87.9% 89.3%<br />
1 estimate<br />
2 based on crude throughput and current operable refining capacity<br />
3 includes Czech Republic, Hungary and Poland<br />
4 includes Czech Republic, Hungary, Poland, Mexico and Korea<br />
36 8 DECEMBER 1999
INTERNATIONAL ENERGY AGENCY - MONTHLY <strong>OIL</strong> MARKET REPORT <strong>OIL</strong> <strong>PRICES</strong> <strong>AND</strong> <strong>REFINERY</strong> <strong>ACTIVITY</strong><br />
Downstream Industry Developments<br />
On 30 November, the US Federal Trade Commission (FTC) approved the merger between Exxon and<br />
Mobil. To preserve competition, the FTC ordered the two companies to divest 2,431 gasoline stations,<br />
mainly on the East Coast and in California, pipeline interests in Alaska and the Southeast, a 130 kb/d oil<br />
refinery in Benicia, California, and other smaller assets. The divestitures will be completed within nine<br />
months, except for the refinery and gasoline stations in California. Nine thousand jobs will initially be<br />
cut from the combined company’s 123,000 worldwide employees and total cost saving is expected to<br />
exceed $2.8 billion annually. With this approval, the merger, which had been announced on 1 December<br />
1998, was completed. The merged company, Exxon Mobil, is headquartered in Irving, Texas.<br />
Tosco, the largest independent US refiner, has announced that it will buy 1,740 gasoline stations from<br />
Exxon Mobil. The deal covers Exxon-branded stations in New York state and New England and Mobilbranded<br />
stations from New Jersey to Virginia. Tosco currently has 4,500 sites to sell fuel, including both<br />
gasoline stations and convenient stores.<br />
Prior to the US approval, the Canadian Federal Competition Bureau cleared the Exxon-Mobil merger,<br />
which involved Imperial <strong>Oil</strong>, 70% owned by Exxon, and Mobil <strong>Oil</strong> Canada. Imperial <strong>Oil</strong> is the largest<br />
oil company in Canada, with a 30% market share, while Mobil <strong>Oil</strong> Canada is a major natural gas producer<br />
and has a significant interest in the Hibernia field.<br />
Mexico’s state-owned Pemex plans to have resume tenders for the upgrading and expansion of its<br />
200 kb/d Minatitlan refinery on the Gulf Coast. Mexico aims to increase its ability to refine heavy Maya<br />
grade and produce more high-octane gasoline to reduce its gasoline imports from the US.<br />
Shell and Texaco plan to swap retail assets in the UK and Greece. Texaco is trading its entire 375-site<br />
retailing network in Greece for Shell’s 80 sites in the UK. Texaco will focus its European downstream<br />
operations on Northwest Europe, while Shell’s market share in Greece will rise from 14% to 20%.<br />
The Indian <strong>Oil</strong> Corporation hired an engineering company to do front end engineering and design work<br />
for the expansion of its Barauni refinery, located northwest of Calcutta. The plant’s capacity will rise to<br />
120 kb/d from 66 kb/d by October 2001. The Barauni plant supplies eastern India with petroleum<br />
products.<br />
8 DECEMBER 1999 37
<strong>OIL</strong> <strong>PRICES</strong> <strong>AND</strong> <strong>REFINERY</strong> <strong>ACTIVITY</strong> INTERNATIONAL ENERGY AGENCY - MONTHLY <strong>OIL</strong> MARKET REPORT<br />
$/bbl<br />
2.50<br />
2.00<br />
1.50<br />
1.00<br />
0.50<br />
0.00<br />
-0.50<br />
-1.00<br />
-1.50<br />
-2.00<br />
-2.50<br />
-3.00<br />
RotterdamRefiningMargins<br />
-3.50<br />
Nov Dec Jan Feb MarApr May JunJul Aug Sep Oct Nov<br />
$/bbl<br />
BrentCracking BrentHydroskimming<br />
-3<br />
Nov Dec Jan Feb MarApr May Jun Jul Aug Sep Oct Nov<br />
$/bbl<br />
4<br />
3<br />
2<br />
1<br />
0<br />
-1<br />
-2<br />
3<br />
2<br />
1<br />
0<br />
-1<br />
USGulfRefiningMargins<br />
1<br />
BrentCracking WTICracking<br />
1<br />
Singapore Refining Margins<br />
-2<br />
Nov Dec Jan Feb MarApr May JunJul Aug Sep Oct Nov<br />
DubaiCracking DubaiHydroskimming<br />
1<br />
mbd<br />
mbd<br />
mbd<br />
14.7<br />
14.4<br />
14.1<br />
13.8<br />
13.5<br />
13.2<br />
12.9<br />
12.6<br />
12.3<br />
12.0<br />
15.9<br />
15.6<br />
15.3<br />
15<br />
14.7<br />
14.4<br />
14.1<br />
13.8<br />
13.5<br />
13.2<br />
4.9<br />
4.6<br />
4.3<br />
4.0<br />
3.7<br />
3.4<br />
3.1<br />
OECDEuropeCrudeThroughputs<br />
IncludingCzechRepublic,HungaryandPoland<br />
J F M A M J J A S O N D J<br />
1996 1997 1998 1999<br />
USCrudeThroughputs<br />
J F M A M J J A S O N D J<br />
1996 1997 1998 1999<br />
JapanCrudeThroughputs<br />
J F M A M J J A S O N D J<br />
1996 1997 1998 1999<br />
38 8 DECEMBER 1999