2013 Public Facilities Implementation Plan Update - City of Manteca
2013 Public Facilities Implementation Plan Update - City of Manteca
2013 Public Facilities Implementation Plan Update - City of Manteca

Create successful ePaper yourself
Turn your PDF publications into a flip-book with our unique Google optimized e-Paper software.
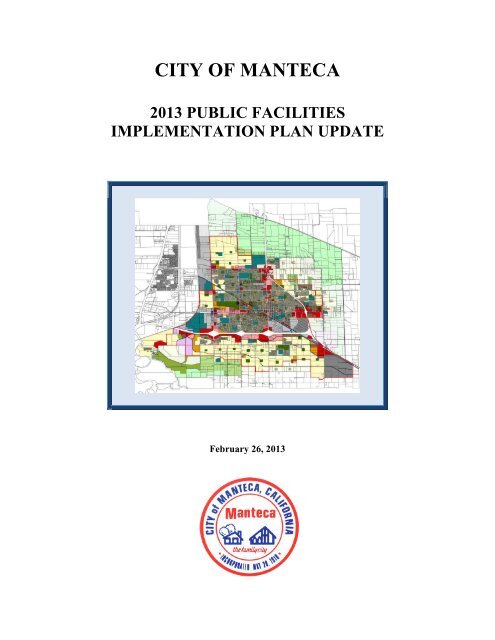
CITY OF MANTECA<br />
<strong>2013</strong> PUBLIC FACILITIES<br />
IMPLEMENTATION PLAN UPDATE<br />
February 26, <strong>2013</strong>
CITY OF MANTECA<br />
<strong>2013</strong> PUBLIC FACILITIES<br />
IMPLEMENTATION PLAN UPDATE<br />
February 26, <strong>2013</strong><br />
Prepared by:<br />
<strong>City</strong> <strong>of</strong> <strong>Manteca</strong><br />
1001 West Center Street<br />
<strong>Manteca</strong>, CA 95337<br />
Ge<strong>of</strong>f Richman<br />
Financial Consultant<br />
P.O. Box 1307<br />
Mill Valley, CA. 94942<br />
NV5, Inc.<br />
Mapping & Word Processing<br />
1215 West Center Street, Suite 201<br />
<strong>Manteca</strong>, CA 95337
TABLE OF CONTENTS<br />
1. INTRODUCTION AND EXECUTIVE SUMMARY.......................................................... 1<br />
A. Purpose <strong>of</strong> the PFIP ........................................................................................................... 1<br />
B. Summary <strong>of</strong> Fees ............................................................................................................... 1<br />
2. PROGRAM METHODOLOGY ............................................................................................ 5<br />
A. Impact Fee Model .............................................................................................................. 5<br />
B. Program Goals ................................................................................................................... 5<br />
C. Program Financing ............................................................................................................. 5<br />
D. Facility <strong>Implementation</strong> ..................................................................................................... 6<br />
E. Program Administration..................................................................................................... 6<br />
1. <strong>City</strong> Department Responsibilities .................................................................................. 6<br />
2. Payment <strong>of</strong> Fees ............................................................................................................. 7<br />
3. Expenditures and Reimbursements ................................................................................ 7<br />
4. Fee Adjustments............................................................................................................. 8<br />
5. Program <strong>Update</strong>s ............................................................................................................ 8<br />
6. <strong>City</strong> Administrative Costs .............................................................................................. 9<br />
F. Existing Liabilities ............................................................................................................. 9<br />
G. Nexus Requirements .......................................................................................................... 9<br />
H. Other Policies ..................................................................................................................... 9<br />
1. Construction Timing ...................................................................................................... 9<br />
2. Out-<strong>of</strong>-Sequence Construction..................................................................................... 10<br />
3. Business License Tax ................................................................................................... 10<br />
4. Existing Deficiencies ................................................................................................... 10<br />
3. DEVELOPMENT ASSUMPTIONS ................................................................................... 11<br />
A. Population ........................................................................................................................ 11<br />
B. Land Use Categories and Density Assumptions .............................................................. 11<br />
C. Vacant land Inventory ...................................................................................................... 13<br />
4. PFIP FEE METHODOLOGY ............................................................................................. 15<br />
A. Dwelling Unit Equivalent Factors ................................................................................... 15<br />
B. Cost Estimates .................................................................................................................. 15<br />
C. Mark-up Assumptions ...................................................................................................... 15<br />
D. Land Acquisition Assumptions ........................................................................................ 16<br />
5. WATER ............................................................................................................................... 17<br />
A. Background ...................................................................................................................... 17<br />
B. <strong>Facilities</strong> and Costs .......................................................................................................... 18<br />
1. Groundwater Supply <strong>Facilities</strong> .................................................................................... 18<br />
2. Water Treatment <strong>Facilities</strong> ........................................................................................... 18<br />
3. Costs ............................................................................................................................. 18<br />
C. Dwelling Unit Equivalents ............................................................................................... 18<br />
D. Fee Methodology ............................................................................................................. 19<br />
1. Non-PFIP Fees ............................................................................................................. 19<br />
<strong>Manteca</strong> <strong>2013</strong> PFIP <strong>Update</strong> i MTB011401<br />
February <strong>2013</strong> n:\mtb011401\reports\final\<strong>2013</strong>0226.docx
2. PFIP Fees ..................................................................................................................... 20<br />
E. Fee Schedule .................................................................................................................... 20<br />
F. Construction Responsibilities .......................................................................................... 20<br />
1. <strong>City</strong> Responsibilities .................................................................................................... 21<br />
2. Developer Responsibilities .......................................................................................... 21<br />
3. Construction Sequencing ............................................................................................. 22<br />
6. STORM DRAINAGE .......................................................................................................... 23<br />
A. Background ...................................................................................................................... 23<br />
B. <strong>Facilities</strong> and Costs .......................................................................................................... 23<br />
C. Dwelling Unit Equivalents ............................................................................................... 24<br />
D. Fee Methodology ............................................................................................................. 24<br />
E. Fee Schedule .................................................................................................................... 24<br />
F. Construction Responsibilities .......................................................................................... 26<br />
1. <strong>City</strong> Responsibilities .................................................................................................... 26<br />
2. Developer Responsibilities .......................................................................................... 27<br />
7. SEWER COLLECTION ...................................................................................................... 29<br />
A. Background ...................................................................................................................... 29<br />
B. <strong>Facilities</strong> and Costs .......................................................................................................... 29<br />
C. Dwelling Unit Equivalents ............................................................................................... 29<br />
1. Residential.................................................................................................................... 30<br />
2. Commercial .................................................................................................................. 30<br />
3. Industrial ...................................................................................................................... 30<br />
4. Equivalent Dwelling Units ........................................................................................... 30<br />
D. Fee Methodology ............................................................................................................. 31<br />
1. Non-PFIP and PFIP Fees ............................................................................................. 31<br />
2. Facility Costs ............................................................................................................... 32<br />
E. Fee Schedule .................................................................................................................... 32<br />
F. Construction Responsibilities .......................................................................................... 33<br />
1. <strong>City</strong> Responsibilities .................................................................................................... 33<br />
2. Developer Responsibilities .......................................................................................... 34<br />
3. Construction Sequencing ............................................................................................. 34<br />
8. TRANSPORTATION .......................................................................................................... 35<br />
9. REFERENCES .................................................................................................................... 36<br />
<strong>Manteca</strong> <strong>2013</strong> PFIP <strong>Update</strong> ii MTB011401<br />
February <strong>2013</strong> n:\mtb011401\reports\final\<strong>2013</strong>0226.docx
Appendix A Vacant Land Inventory<br />
Appendix B Water Data<br />
Appendix C Storm Drainage Data<br />
Appendix D Sewer Collection Data<br />
Appendix E Transportation Data<br />
Appendix F <strong>City</strong> PFIP Administration Costs<br />
Appendix G Master Reimbursement List<br />
APPENDICES<br />
LIST OF TABLES<br />
Table E-1 Summary <strong>of</strong> PFIP Water Fees, $/Meter Size ............................................................ 2<br />
Table E-2 Summary <strong>of</strong> PFIP Residential Storm Drainage Fees ................................................ 2<br />
Table E-3 Summary <strong>of</strong> PFIP MDR, HDR, and Non-Residential Storm Drainage Fees ........... 3<br />
Table E-4 Summary <strong>of</strong> PFIP Residential Sewer Collection System Fees ................................. 3<br />
Table E-5 Summary <strong>of</strong> PFIP Non-Residential Sewer Collection System Fees ......................... 4<br />
Table 3-1 Summary <strong>of</strong> Undeveloped Acreage within the <strong>City</strong> <strong>of</strong> <strong>Manteca</strong> ............................ 14<br />
Table 4-1 Land Acquisition by Dedication or Purchase .......................................................... 16<br />
Table 5-1 Water Meter Hydraulic Capacity/EDU Factors ...................................................... 19<br />
Table 5-2 Summary <strong>of</strong> PFIP Water Fees by Meter Size .......................................................... 20<br />
Table 6-1 Storm Drainage C Factors and EDU Factors .......................................................... 24<br />
Table 6-2 Projected Storm Drainage Project Costs by Zone ................................................... 25<br />
Table 6-3 Summary <strong>of</strong> PFIP Residential Storm Drainage Fees .............................................. 25<br />
Table 6-4 Summary <strong>of</strong> PFIP MDR, HDR, and Non-Residential Storm Drainage Fees .......... 25<br />
Table 7-1 Summary <strong>of</strong> Wastewater EDU Factors ................................................................... 31<br />
Table 7-2 Projected Sewer Project Costs by Zone................................................................... 33<br />
Table 7-3 Summary <strong>of</strong> PFIP Residential Sewer Collection System Fees ............................... 33<br />
Table 7-4 Summary <strong>of</strong> PFIP Non-Residential Sewer Collection System Fees ....................... 33<br />
<strong>Manteca</strong> <strong>2013</strong> PFIP <strong>Update</strong> iii MTB011401<br />
February <strong>2013</strong> n:\mtb011401\reports\final\<strong>2013</strong>0226.docx
Plate A-1 Vacant Land<br />
Plate B-1 Water Financing Zone<br />
Plate C-1 Storm Drainage Financing Zones<br />
LIST OF PLATES<br />
Plate D-1 Wastewater Collection Financing Zones<br />
<strong>Manteca</strong> <strong>2013</strong> PFIP <strong>Update</strong> iv MTB011401<br />
February <strong>2013</strong> n:\mtb011401\reports\final\<strong>2013</strong>0226.docx
1. INTRODUCTION AND<br />
EXECUTIVE SUMMARY<br />
The <strong>City</strong> <strong>of</strong> <strong>Manteca</strong> (<strong>City</strong>) developed the <strong>Public</strong> <strong>Facilities</strong> <strong>Implementation</strong> <strong>Plan</strong> (PFIP) as the<br />
implementing program for specific public infrastructure policies identified in the <strong>City</strong> <strong>of</strong><br />
<strong>Manteca</strong> General <strong>Plan</strong> 2023 Policy Document (General <strong>Plan</strong>) [1]. Originally adopted in 1993,<br />
the purpose <strong>of</strong> the PFIP is to ensure that certain public infrastructure needed for growth – namely<br />
water, wastewater, storm drainage, and transportation facilities – were adequate as the <strong>City</strong> grew<br />
and developed in accordance with its General <strong>Plan</strong>. Another purpose <strong>of</strong> the PFIP was to ensure<br />
that infrastructure was constructed in a timely manner and financed in a way that equitably<br />
divided financial responsibility in proportion to the demands placed on the new facilities.<br />
The PFIP was originally developed as a reimbursement model program that utilized developers’<br />
resources to fund and construct improvements. Developers were reimbursed either in fee credits<br />
or with funds as they were accumulated from the imposed fees. This method was successful in<br />
some aspects, but <strong>of</strong>ten required that developers fund substantial improvements with limited<br />
assurance <strong>of</strong> timely repayment. This situation ultimately presented significant barriers to growth.<br />
The <strong>City</strong> desires to update the PFIP such that these barriers are reduced. To do so, the PFIP will<br />
be revised to utilize a development impact fee model wherein the <strong>City</strong> assumes some<br />
responsibility for funding and constructing major facilities, while the developers – in most cases<br />
– simply pay their proportionate share to reimburse the <strong>City</strong> for the cost to finance and construct<br />
the infrastructure.<br />
Only water, storm drainage, and sewer collection facilities and their respective fees are updated<br />
in this <strong>2013</strong> <strong>Public</strong> <strong>Facilities</strong> <strong>Implementation</strong> <strong>Plan</strong> <strong>Update</strong> (<strong>2013</strong> PFIP). Additional time is<br />
needed to prepare the transportation program element due to the complexity <strong>of</strong> the transportation<br />
facilities. The program and fees for transportation adopted previously remain in effect until<br />
updated in the future.<br />
A. PURPOSE OF THE PFIP<br />
The <strong>City</strong>’s purpose <strong>of</strong> the PFIP is to:<br />
1) Develop impact fees that are cost-competitive within the region.<br />
2) Promote orderly growth in accordance with the General <strong>Plan</strong>.<br />
3) Develop and maintain an impact fee program that is flexible and responsive to changing<br />
market conditions.<br />
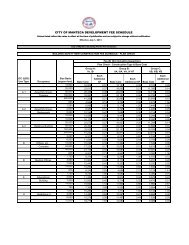
B. SUMMARY OF FEES<br />
PFIP Water Fees were originally charged on a per unit basis for residential users and on a net<br />
acreage basis for other commercial and industrial users. For the <strong>2013</strong> PFIP, Water Fees are all<br />
based on the size <strong>of</strong> meter installed, regardless <strong>of</strong> development type, and are consistent<br />
<strong>Manteca</strong> <strong>2013</strong> PFIP <strong>Update</strong> 1 MTB011401<br />
February <strong>2013</strong> n:\mtb011401\reports\final\<strong>2013</strong>0226.docx
throughout the entire <strong>City</strong>. PFIP Water Fees are comprised <strong>of</strong> a Groundwater Supply Fee, a<br />
Peaking Facility Fee, and a Distribution System Fee. Table E-1 summarizes all three fees<br />
together. Chapter 5 provides details on each individual fee.<br />
Table E-1<br />
Summary <strong>of</strong> PFIP Water Fees, $/Meter Size<br />
Meter Size, in<br />
5/8<br />
PFIP Water<br />
Fee, $<br />
<strong>Manteca</strong> <strong>2013</strong> PFIP <strong>Update</strong> 2 MTB011401<br />
February <strong>2013</strong> n:\mtb011401\reports\final\<strong>2013</strong>0226.docx<br />
3,083<br />
1 5,149<br />
1½<br />
10,267<br />
2 16,433<br />
3<br />
30,831<br />
4 51,395<br />
6<br />
102,759<br />
8 164,420<br />
PFIP fees for storm drainage are based on the land use type and the zone in which the parcel is<br />
located (see Table E-2 and Table E-3). This is the same methodology utilized in the original<br />
PFIP. However, for the <strong>2013</strong> PFIP, some <strong>of</strong> the original zones which are largely built out have<br />
been consolidated to simplify accounting and administration.<br />
Table E-2<br />
Summary <strong>of</strong> PFIP Residential Storm Drainage Fees<br />
Fee Per Dwelling Unit, $<br />
Land Use Zone 30 Zone 32 Zone 34 Zone 36 Zone 39<br />
VLDR 118 1,428 898 2,188 899<br />
LDR 47 571 359 875 359
Table E-3<br />
Summary <strong>of</strong> PFIP MDR, HDR, and Non-Residential Storm Drainage Fees<br />
Fee Per Acre, $<br />
Land Use Zone 30 Zone 32 Zone 34 Zone 36 Zone 39<br />
MDR 394 4,760 2,994 7,295 2,995<br />
HDR 512 6,189 3,892 9,483 3,894<br />
BP 709 8,569 5,389 13,131 5,391<br />
CMU 709 8,569 5,389 13,131 5,391<br />
GC 709 8,569 5,389 13,131 5,391<br />
NC 709 8,569 5,389 13,131 5,391<br />
HI 551 6,665 4,191 10,213 4,193<br />
LI 551 6,665 4,191 10,213 4,193<br />
BIP 551 6,665 4,191 10,213 4,193<br />
PFIP Sewer Fees recover the cost <strong>of</strong> providing the collection system to convey sewage generated<br />
in the <strong>City</strong> to the <strong>City</strong>’s treatment plant. The original PFIP divided the <strong>City</strong> into five financing<br />
zones, and charged per unit for residential users and per 1,000 square feet (sf) for non-residential<br />
users. In addition, some infrastructure that was amended into the PFIP was charged as a separate<br />
overlaying zone. In the <strong>2013</strong> PFIP, some <strong>of</strong> these financing zones have been consolidated. In<br />
addition, the basis for sewer fees has been changed. The <strong>2013</strong> PFIP will charge per unit for<br />
residential users but non-residential users will be charged upon usage, which will be estimated<br />
based on each development’s characteristics (see Table E-4 and Table E-5). This is expected to<br />
more accurately relate the cost <strong>of</strong> infrastructure to the actual demand.<br />
Table E-4<br />
Summary <strong>of</strong> PFIP Residential Sewer Collection System Fees<br />
Land Use<br />
Fee Per Dwelling Unit, $<br />
Zone 21 Zone 22 Zone 24 Zone 25 Zone 26<br />
VLDR 277 1,714 1,306 310 1,067<br />
LDR 277 1,714 1,306 310 1,067<br />
MDR 203 1,254 955 226 780<br />
HDR 203 1,254 955 226 780<br />
<strong>Manteca</strong> <strong>2013</strong> PFIP <strong>Update</strong> 3 MTB011401<br />
February <strong>2013</strong> n:\mtb011401\reports\final\<strong>2013</strong>0226.docx
Table E-5<br />
Summary <strong>of</strong> PFIP Non-Residential Sewer Collection System Fees<br />
Land Use<br />
$ per Gallon per Day<br />
Zone 21 Zone 22 Zone 24 Zone 25 Zone 26<br />
All Non-Residential 1.73 10.72 8.16 1.94 6.67<br />
<strong>Manteca</strong> <strong>2013</strong> PFIP <strong>Update</strong> 4 MTB011401<br />
February <strong>2013</strong> n:\mtb011401\reports\final\<strong>2013</strong>0226.docx
2. PROGRAM METHODOLOGY<br />
This chapter provides an overview <strong>of</strong> the program methodology. Topics addressed include:<br />
1) impact fee model; 2) program goals; 3) program financing; 4) program administration;<br />
5) existing liabilities; 6) nexus requirements; and 7) other policies.<br />
A. IMPACT FEE MODEL<br />
The PFIP has been revised to use a development impact fee model approach wherein the <strong>City</strong><br />
assumes some responsibility for funding and constructing major facilities, while the developers –<br />
in most cases – simply pay their proportionate share to reimburse the <strong>City</strong> for the cost to finance<br />
and construct the infrastructure.<br />
B. PROGRAM GOALS<br />
The <strong>City</strong>’s primary goals for the PFIP programs are to:<br />
1) Develop impact fees that are cost-competitive within the region.<br />
2) Promote orderly growth in accordance with the General <strong>Plan</strong>.<br />
3) Develop and maintain an impact fee program that is flexible and responsive to changing<br />
market conditions.<br />
C. PROGRAM FINANCING<br />
Development impact fees are one source <strong>of</strong> financing that is within the control <strong>of</strong> the <strong>City</strong> to<br />
provide facilities to serve new development. The <strong>City</strong> also intends to participate aggressively in<br />
Regional, State, and Federal programs that may become available to finance public<br />
improvements. However, the <strong>City</strong> is not prepared to depend on these sources to pay for public<br />
improvement projects that are essential to growth and development. Thus to fund the required<br />
infrastructure, the <strong>City</strong> plans to utilize the following sources:<br />
Development Impact Fees paid pursuant to the PFIP will be used to finance the<br />
expansion <strong>of</strong> facilities that are necessary to accommodate the demand for new<br />
capacity.<br />
Inter-Fund Borrowing, such as borrowing between PFIP Funds when practical or<br />
employing other comparable devices, may be used if development impact fees,<br />
considered alone, are insufficient to build public improvements when required. When<br />
PFIP Inter-Fund Borrowing is used, the receiving Fund shall construct facilities in the<br />
similar geographic area from which the lending Fund collected the fees. For example,<br />
if an inter-fund loan from PFIP Sewer was proposed to construct a PFIP Storm<br />
Zone 36 facility, the PFIP Sewer funds need to come from Sewer Zone 24, where<br />
both zones are similar geographically.<br />
<strong>Manteca</strong> <strong>2013</strong> PFIP <strong>Update</strong> 5 MTB011401<br />
February <strong>2013</strong> n:\mtb011401\reports\final\<strong>2013</strong>0226.docx
Outside Financing, such as bonds or other public financing instruments may be<br />
utilized to fund larger facilities in advance <strong>of</strong> the fees that will retire any such<br />
accumulated debt. Any such funding will require participation by the beneficiaries <strong>of</strong><br />
the facilities to secure repayment.<br />
D. FACILITY IMPLEMENTATION<br />
The sequence <strong>of</strong> implementing projects for increased capacity and expanded public water, sewer,<br />
and storm improvements in the <strong>City</strong> is as follows:<br />
General <strong>Plan</strong> and accompanying growth management policies and ordinances are<br />
adopted.<br />
<strong>Facilities</strong> master plans are prepared or updated and conceptual engineering is developed<br />
to identify the new facilities/capacity that will be needed to serve the expected growth.<br />
These new facilities are then programmed into the <strong>City</strong>’s 5-year Capital Improvement<br />
Program (CIP), which is updated annually and approved by the <strong>City</strong> Council at time <strong>of</strong><br />
fiscal year budget adoption. The <strong>Public</strong> Works Department programs capital projects<br />
into the CIP annually during the <strong>City</strong>’s fiscal year budget preparation process.<br />
Developers interested in submitting projects to be included in the CIP shall submit their<br />
projects to the <strong>Public</strong> Works Department by January 31 <strong>of</strong> each year unless Council<br />
authorizes projects to be added at a later date.<br />
E. PROGRAM ADMINISTRATION<br />
1. <strong>City</strong> Department Responsibilities<br />
Finance Department<br />
A. Administer fund accounting and monitor financial status <strong>of</strong> all PFIP funds.<br />
B. Document, track, and provide annual reporting on all loans and reimbursement<br />
obligations.<br />
C. Calculate annual fee updates based upon Engineering News Record Construction<br />
Cost Index (ENRCCI).<br />
D. Prepare Annual AB1600 Fee Mitigation Report.<br />
E. Determine when funds are available for reimbursement and issue reimbursements.<br />
Community Development Department<br />
<strong>Public</strong> Works<br />
A. Condition projects.<br />
B. Determine fee credits to be issued, and track disposition <strong>of</strong> fee credits.<br />
C. Collect fees as described below.<br />
A. <strong>Update</strong> Master <strong>Plan</strong>s as scheduled.<br />
<strong>Manteca</strong> <strong>2013</strong> PFIP <strong>Update</strong> 6 MTB011401<br />
February <strong>2013</strong> n:\mtb011401\reports\final\<strong>2013</strong>0226.docx
B. Program PFIP projects in <strong>City</strong> CIP.<br />
C. Manage PFIP capital projects through planning, design, and construction.<br />
D. Provide technical assistance to Finance and Community Development as needed.<br />
2. Payment <strong>of</strong> Fees<br />
Payment <strong>of</strong> PFIP fees is due at the time <strong>of</strong> issuance <strong>of</strong> building permit unless authorized by<br />
Council action to be paid at a different time. Payment <strong>of</strong> PFIP fees at occupancy <strong>of</strong> a residential<br />
or commercial facility is allowed only with <strong>City</strong> Council approval.<br />
Fees are collected by the Community Development Department. An individual acting under the<br />
supervision <strong>of</strong> the Community Development Director accomplishes all <strong>of</strong> the following:<br />
Classifies the building permit application in terms <strong>of</strong> the development impact fee zone or<br />
zones that are applicable.<br />
Selects the development impact fee rates that are applicable.<br />
Calculates the total development impact fee that is due with the building permit<br />
application.<br />
Collects the land use description and other utility data for this particular application to<br />
monitor land use data within the <strong>City</strong>.<br />
Transmits the fee information to the Finance Department and the utility data to <strong>Public</strong><br />
Works for appropriate accounting.<br />
Receipts and disbursements <strong>of</strong> the proceeds <strong>of</strong> development impact fees are managed in<br />
accordance with the normal system <strong>of</strong> accounting and financial controls. In addition, the<br />
Community Development Director or his/her designee has a responsibility to verify that the<br />
appropriate development impact fee account has been identified when funds for each<br />
development project are encumbered. This review responsibility is particularly important in<br />
those instances where fees at different levels are collected in different geographic financing<br />
zones. Accounts are maintained contemporaneously on a transaction-by-transaction basis to<br />
assure that a proper accounting can be made and that there is a visible, understandable audit trail<br />
for the use <strong>of</strong> all development impact fees.<br />
3. Expenditures and Reimbursements<br />
Funds will be used to pay PFIP costs in the following priority:<br />
1. <strong>City</strong> administration costs<br />
2. New capital projects<br />
3. Repayment <strong>of</strong> existing liabilities<br />
<strong>Manteca</strong> <strong>2013</strong> PFIP <strong>Update</strong> 7 MTB011401<br />
February <strong>2013</strong> n:\mtb011401\reports\final\<strong>2013</strong>0226.docx
To insure that the program has sufficient funds to be maintained appropriately, each fund will<br />
maintain a minimum balance <strong>of</strong> $200,000. No expenditures will be made or programed when<br />
the fund balance is below that amount. Costs <strong>of</strong> <strong>City</strong> administration for the program will be<br />
deducted from the funds annually. Project-specific costs will be charged to the individual<br />
projects, which are programed and budgeted in the CIP.<br />
When funds exceed the reserve amount, priority will be given to capital projects needed to<br />
provide facilities included in the master plans and CIP.<br />
If no projects are currently planned, any funding in excess <strong>of</strong> the designated reserves shall be<br />
used to repay existing liabilities. Reimbursement for existing liabilities shall be prioritized based<br />
upon date <strong>of</strong> Council acceptance or approval, regardless <strong>of</strong> whether the liability is a public<br />
improvement or inter-fund debt. The <strong>City</strong> shall develop and publish a master reimbursement list<br />
which will be provided with the Transportation element addendum to this document.<br />
Reimbursement for improvements will be based upon actual project costs, which shall be set by a<br />
minimum <strong>of</strong> three publicly opened, sealed bids. Sealed bids shall be submitted to and opened by<br />
the <strong>City</strong> Clerk or their designee. In the absence <strong>of</strong> public bids, the cost may be determined by<br />
the <strong>City</strong> Engineer; but in those cases, the cost for reimbursement shall be limited to the amount<br />
programed within the PFIP at the time the project is constructed. Also, financing costs are not a<br />
reimbursable cost.<br />
4. Fee Adjustments<br />
The <strong>City</strong> will review the PFIP and each development impact fee resolution annually. Any<br />
material change in development impact fees as a result <strong>of</strong> the monitoring and review <strong>of</strong> the<br />
program would be implemented as soon as feasible. The PFIP is subject to revision due to<br />
several factors. These factors include the difficulty <strong>of</strong> forecasting the rate and location <strong>of</strong><br />
development in the <strong>City</strong>, variations in the cost <strong>of</strong> construction <strong>of</strong> public improvements, and<br />
variation in the standards that may be applicable in the future to the design <strong>of</strong> public<br />
improvements.<br />
Annual fee and reimbursement rate adjustments will be calculated in October <strong>of</strong> each year and<br />
will take effect in January <strong>of</strong> the following year for every year. The automatic inflation<br />
adjustment to the fees will be based upon the preceding July 20-Cities ENRCCI. The <strong>City</strong> will<br />
advise the local representative <strong>of</strong> the Building Industry Association regarding fee increases, as<br />
well as those developers that have submitted written requests for such noticing.<br />
Should the ENRCCI be revised or discontinued, the Director <strong>of</strong> Finance will use the revised<br />
index or a comparable index, as approved by the <strong>City</strong> Council, for determining fluctuations in<br />
the cost <strong>of</strong> development.<br />
5. Program <strong>Update</strong>s<br />
The <strong>City</strong> intends to assure that the General <strong>Plan</strong> and the various master plans remain responsive<br />
to <strong>City</strong> policy and changing development conditions. The <strong>City</strong> intends to review both the<br />
General <strong>Plan</strong> and the facility master plans on a ten-year cycle. Policies in an amended General<br />
<strong>Manteca</strong> <strong>2013</strong> PFIP <strong>Update</strong> 8 MTB011401<br />
February <strong>2013</strong> n:\mtb011401\reports\final\<strong>2013</strong>0226.docx
<strong>Plan</strong> will be incorporated into all <strong>of</strong> the <strong>City</strong> facilities master plans and into each impact fee<br />
Ordinance and Resolution. In addition, the <strong>City</strong> plans to perform a major update to the PFIP<br />
program document every five years.<br />
Information about changes in the availability <strong>of</strong> Regional/State/Federal grants (principal<br />
forgiveness) and loans or other sources <strong>of</strong> revenue will be incorporated into the fee programs<br />
during the annual review.<br />
6. <strong>City</strong> Administrative Costs<br />
Appendix F provides a breakdown <strong>of</strong> the costs needed to perform the various program updates<br />
and the cost for personnel needed to administer PFIP program. Upon program adoption, the<br />
personnel costs shown in Appendix F will be used for the first three years <strong>of</strong> the program, after<br />
which the <strong>City</strong> will compare actual personnel costs to programmed costs and will make<br />
adjustments at that time, if any.<br />
F. EXISTING LIABILITIES<br />
As a result <strong>of</strong> development activity over the years, the various PFIP funds have accumulated cash<br />
balances, inter-fund borrowing obligations, and other liabilities. The PFIP fund balances as <strong>of</strong><br />
July 1, 2012, were used in the fee calculations as each zone’s current fund balance and<br />
obligations. The master reimbursement list referenced earlier in this section will show that the<br />
existing liabilities in the various PFIP funds are comprised <strong>of</strong> developer-constructed facilities<br />
that serve future growth.<br />
G. NEXUS REQUIREMENTS<br />
The PFIP incorporates CIPs and/or utilities master plans for water, sewer, and storm drainage as<br />
defined in Government Code §66002. The costs and fees that are provided in this document are<br />
based, in part, upon findings and conclusions provided in the utilities master plans. This PFIP<br />
document and the various utility master plans jointly identify the use to which the fee will be put<br />
and determine the reasonable relationship between a benefit, the fee’s use, and the type <strong>of</strong><br />
development project on which the fee is imposed.<br />
H. OTHER POLICIES<br />
1. Construction Timing<br />
<strong>Facilities</strong> will be constructed as demand occurs and are not rigidly tied to the calendar. Thus,<br />
growth forecasts are not needed nor used in the PFIP. Accordingly, the timing <strong>of</strong> facility<br />
construction in this program is self-correcting in that:<br />
A slowdown in development produces a slower rate at which additional capacity will be<br />
demanded, as well as a slower rate at which development impact fees will be collected.<br />
Consequently, the construction <strong>of</strong> facilities would slow down.<br />
<strong>Manteca</strong> <strong>2013</strong> PFIP <strong>Update</strong> 9 MTB011401<br />
February <strong>2013</strong> n:\mtb011401\reports\final\<strong>2013</strong>0226.docx
As development increases, then development impact fees will be available sooner to<br />
construct improvements for which demand has occurred sooner than expected. An<br />
excessive rate <strong>of</strong> development that is beyond that which could be accommodated because<br />
<strong>of</strong> lead time required to construct projects is unlikely because at some point, the<br />
limitations in the <strong>City</strong> Growth Management Ordinance (Chapter 18.04 <strong>of</strong> the <strong>City</strong><br />
Municipal Code) would become effective.<br />
2. Out-<strong>of</strong>-Sequence Construction<br />
In some cases, development projects maybe proposed that are not proximate to existing<br />
infrastructure. In such cases, developers may advance the construction <strong>of</strong> needed PFIP<br />
infrastructure at their cost. Infrastructure included in the PFIP that is installed by developers will<br />
be eligible for reimbursement as outlined in Section 3 above. Fee credits for advance<br />
construction will only be allowed for the specific type <strong>of</strong> infrastructure constructed. For<br />
example, if a sewer facility is built, only PFIP sewer credits will be allowed, no water or storm<br />
drain fees will be credited. Interfund transfers <strong>of</strong> fee credits will not be allowed.<br />
3. Business License Tax<br />
A business license tax was established in conjunction with the 1993 PFIP, which is still in effect.<br />
The <strong>City</strong> will transfer 50 percent <strong>of</strong> the revenue from this tax to the PFIP Sewer Fund to help<br />
lower the PFIP Sewer Fee. Accordingly, this revenue stream was included in the PFIP Sewer<br />
Fee calculations in Appendix D.<br />
4. Existing Deficiencies<br />
If a facility improvement will remedy an existing deficiency and provide new capacity, then the<br />
cost <strong>of</strong> that improvement will be allocated between new development and other financing<br />
sources as follows:<br />
The least-costly improvement to remedy the existing deficiency, in the absence <strong>of</strong> further<br />
growth, is identified. This cost is assumed to be the responsibility <strong>of</strong> existing funding<br />
sources and is not financed from development impact fees. The least costly improvement<br />
must be feasible and realistic.<br />
The cost to provide capacity for additional growth (i.e., the difference between the full<br />
cost <strong>of</strong> the improvement and the cost <strong>of</strong> the least costly improvement to remedy existing<br />
deficiencies) is financed from development impact fees.<br />
<strong>Manteca</strong> <strong>2013</strong> PFIP <strong>Update</strong> 10 MTB011401<br />
February <strong>2013</strong> n:\mtb011401\reports\final\<strong>2013</strong>0226.docx
3. DEVELOPMENT ASSUMPTIONS<br />
A summary <strong>of</strong> development assumptions is presented in this chapter including: 1) population; 2)<br />
land use categories and density assumptions; and 3) vacant land inventory.<br />
A. POPULATION<br />
Since incorporating in 1918, <strong>Manteca</strong> has been a rapidly growing city. The <strong>City</strong> experienced its<br />
highest average annual growth rate (AAGR) between 1950 and 1960 when the population grew<br />
at an AAGR <strong>of</strong> 8.04 percent. The population continued to grow at an average rate between 5 and<br />
6 percent over the following decades (1960 to 1990) [2]. The population growth slowed slightly<br />
between 1990 and 2000, and then increased through 2008. With the recent economic downturn,<br />
population growth again slowed; but unlike other communities in the area, development in the<br />
<strong>City</strong> continued at a greater rate than surrounding cities. As <strong>of</strong> January 1, 2011, the <strong>City</strong> had a<br />
population <strong>of</strong> 68,410.<br />
The total land use proposed in the <strong>City</strong> General <strong>Plan</strong> will accommodate a population <strong>of</strong> 94,000 to<br />
144,000 [2]. This projection is derived through assumptions relating to residential density, the<br />
average density, the efficiency <strong>of</strong> the land use, vacancy factors, and a market reserve for each<br />
residential land use type.<br />
Through the Growth Management Ordinance the <strong>City</strong> regulates the number <strong>of</strong> housing units<br />
approved each year according to a growth management system that reflects the availability <strong>of</strong><br />
infrastructure, the <strong>City</strong>’s ability to provide public services, housing needs, and employment<br />
growth. The Growth Management Ordinance limits population growth to 3.9 percent and<br />
development allocations are determined on a point rating system.<br />
B. LAND USE CATEGORIES AND DENSITY ASSUMPTIONS<br />
The land use categories are tailored to meet the specific needs <strong>of</strong> the <strong>City</strong>. Economic<br />
development opportunities, housing needs, and environmental characteristics are among the<br />
factors that determine the appropriate land use categories. The land use categories are<br />
implemented through the <strong>Manteca</strong> Municipal Code, Zoning Ordinance.<br />
The following are abbreviated descriptions <strong>of</strong> the various land use categories and include a<br />
description <strong>of</strong> the density assumption for each category along with the floor area ratio (FAR) as<br />
outlined in the General <strong>Plan</strong>. FAR is the ratio <strong>of</strong> building square footage to the site area.<br />
In case <strong>of</strong> conflict, the descriptions contained in the adopted General <strong>Plan</strong> shall prevail.<br />
Very Low Density Residential (VLDR) – less than 2 dwelling units per gross acre. The VLDR<br />
land use category provides for residences on larger lots and small, quasi-agricultural activities,<br />
including raising and boarding livestock.<br />
Low Density Residential (LDR) – 2.1 to 8.0 dwelling units per gross acre. The LDR land use<br />
will establish a mix <strong>of</strong> dwelling unit types and character determined by the individual site and<br />
<strong>Manteca</strong> <strong>2013</strong> PFIP <strong>Update</strong> 11 MTB011401<br />
February <strong>2013</strong> n:\mtb011401\reports\final\<strong>2013</strong>0226.docx
market conditions. The density range allows substantial flexibility in selecting dwelling unit<br />
types and parcel configurations to suit particular site conditions and housing needs.<br />
Medium Density Residential (MDR) – 8.1 to 15 dwelling units per gross acre. The MDR use<br />
includes single family homes and smaller scale multi-family developments, including garden<br />
apartments, townhouses, and cluster housing.<br />
High Density Residential (HDR) – 15.1 to 25 dwelling units per acre. The HDR use includes<br />
multi-family apartment style housing.<br />
Commercial Mixed Use (CMU) – 15.1 to 25 dwelling units per acre; FAR 1.0; maximum site<br />
coverage 50 percent. The CMU designation accommodates a variety <strong>of</strong> purposes including high<br />
density residential, employment centers, retail commercial, and pr<strong>of</strong>essional <strong>of</strong>fices. The mixed<br />
use concept would integrate a mix <strong>of</strong> compatible uses on a single site.<br />
Business Industrial Park (BIP) – FAR 1.0; maximum site coverage 50 percent. The BIP<br />
designation is intended to provide sites for large uses in an <strong>of</strong>fice park environment that would<br />
include multi-tenant buildings.<br />
Business Pr<strong>of</strong>essional (BP) – FAR 1.5; maximum site coverage 50 percent. The BP land use is<br />
intended primarily for <strong>of</strong>fice and related uses in a landscaped site. The use category is<br />
specifically intended for the frontage along State Route (SR) 120 and along other major roads<br />
and in the Central Business District (CBD). This designation provides for pr<strong>of</strong>essional and<br />
administrative <strong>of</strong>fices, medical and dental clinics, laboratories, financial institutions, public and<br />
quasi-public uses, and similar and compatible uses.<br />
Neighborhood Commercial (NC) – FAR 2.0 in the CBD and 0.6 outside the CBD.<br />
This designation provides for locally oriented retail and service uses; <strong>of</strong>fices, restaurants, and<br />
service stations; public and quasi-public uses; and similar and compatible uses.<br />
General Commercial (GC) – FAR 0.6; maximum site coverage 40 percent. The GC category<br />
provides for wholesale, warehousing, and heavy commercial uses; highway oriented commercial<br />
retail; public and quasi-public uses; and similar and compatible uses. The designation is also<br />
intended to accommodate visitor commercial, lodging, commercial recreation, and public<br />
gathering facilities such as amphitheaters or public gardens.<br />
Light Industrial (LI) – FAR 0.7; maximum site coverage 60 percent. The LI designation<br />
provides for industrial parks, warehouses, distribution centers, light manufacturing, public and<br />
quasi-public uses and similar, compatible uses.<br />
Heavy Industrial (HI) – FAR 0.5; maximum site coverage 40 percent. The HI designation<br />
provides for manufacturing, processing, assembling, research, wholesale, and storage uses;<br />
trucking terminals, railroad and freight stations; and similar activities that require separation<br />
from residential uses due to noise, vibration, or other characteristics incompatible with<br />
residential use.<br />
<strong>Manteca</strong> <strong>2013</strong> PFIP <strong>Update</strong> 12 MTB011401<br />
February <strong>2013</strong> n:\mtb011401\reports\final\<strong>2013</strong>0226.docx
Agriculture (AG) – The AG designation provides for agricultural uses (such as vineyards,<br />
orchards, and row crops), single family homes directly related to the agricultural use <strong>of</strong> the<br />
property, limited industrial uses directly related to agriculture, and similar and compatible uses.<br />
Open Space (OS) – The OS category encompasses habitat, open space, natural areas, lands <strong>of</strong><br />
special status species, wetlands, and riparian areas. These areas are set aside as permanent open<br />
space preserves to protect environmentally sensitive areas.<br />
Park (P) – This designation provides for neighborhood, community, and regional parks; golf<br />
courses; and other outdoor recreational facilities within urban development.<br />
<strong>Public</strong>/Quasi-<strong>Public</strong> (P/QP) – This designation provides for government-owned facilities,<br />
public and private schools, institutions, civic uses and public utilities, and quasi-public uses such<br />
as hospitals and churches.<br />
Urban Reserve (UR) – UR is applied to many properties around the perimeter <strong>of</strong> the <strong>City</strong>. In<br />
most instances the UR category overlies another land use category. In these instances the<br />
underlying land use is the intended use when the land is ultimately annexed to the <strong>City</strong>. UR with<br />
no underlying land use indicates that the <strong>City</strong> intends to expand in the time horizon beyond the<br />
current General <strong>Plan</strong> and that it is premature to indicate a specific future land use in this area.<br />
C. VACANT LAND INVENTORY<br />
The <strong>City</strong> calculated the amount <strong>of</strong> vacant land remaining within the General <strong>Plan</strong> boundary and<br />
the results are summarized in Table 3-1. Plate A-1 in Appendix A provides a graphic depiction.<br />
<strong>Manteca</strong> <strong>2013</strong> PFIP <strong>Update</strong> 13 MTB011401<br />
February <strong>2013</strong> n:\mtb011401\reports\final\<strong>2013</strong>0226.docx
Table 3-1<br />
Summary <strong>of</strong> Undeveloped Acreage<br />
within the <strong>City</strong> <strong>of</strong> <strong>Manteca</strong><br />
Land Use Type<br />
Undeveloped<br />
Acreage<br />
AG (LDR) 3,692.80<br />
BIP 179.98<br />
BP 1.00<br />
CMU 229.44<br />
GC 291.56<br />
HDR 127.26<br />
HI 485.00<br />
LDR 3,401.44<br />
LI 750.37<br />
MDR 218.69<br />
NC 56.16<br />
OS 444.76<br />
P 94.76<br />
PQP 216.02<br />
UR 1,709.12<br />
UR-AG (LDR) 1,613.75<br />
UR-BIP 408.70<br />
UR-CMU 415.14<br />
UR-GC 40.43<br />
UR-LDR 1,381.35<br />
UR-LI 114.45<br />
UR-MDR 19.74<br />
UR-P 67.52<br />
UR-PQP 11.65<br />
UR-VLDR 746.63<br />
VLDR 659.51<br />
Total 17,377.24<br />
<strong>Manteca</strong> <strong>2013</strong> PFIP <strong>Update</strong> 14 MTB011401<br />
February <strong>2013</strong> n:\mtb011401\reports\final\<strong>2013</strong>0226.docx
4. PFIP FEE METHODOLOGY<br />
The PFIP fee methodology is presented in this chapter including: 1) dwelling unit equivalent<br />
(DUE) factors; 2) cost estimates; 3) mark-up assumptions; and 4) land acquisition assumptions.<br />
A. DWELLING UNIT EQUIVALENT FACTORS<br />
DUEs are units <strong>of</strong> measure that standardize land use categories (residential, commercial,<br />
industrial, etc.). A low-density, single-family residential unit has a DUE factor <strong>of</strong> 1.0. The DUE<br />
factor for other land use types is developed based on the anticipated demand for each land use<br />
category relative to the demand for a low-density, single-family residential unit. Additional<br />
information regarding the derivation <strong>of</strong> DUEs for water, sewer, and storm drainage can be found<br />
in the 2005 Water Master <strong>Plan</strong>, <strong>2013</strong> Storm Drainage Master <strong>Plan</strong>, and 2012 Wastewater<br />
Collection System Master <strong>Plan</strong>.<br />
DUEs are commonly utilized to calculate the probable demand that a user places on facilities by<br />
assignment <strong>of</strong> an equivalency factor. DUEs are measured differently for each component in the<br />
PFIP. The term DUE may be used interchangeably with EDU, equivalent dwelling unit.<br />
B. COST ESTIMATES<br />
The facility master plans identify the public facilities to serve the forecasted development.<br />
Results <strong>of</strong> the master plan studies specify the sizes <strong>of</strong> facilities to serve the demand and represent<br />
a preliminary design level <strong>of</strong> accuracy. Opinions <strong>of</strong> probable construction cost are conceptual<br />
and are based upon information available at the time <strong>of</strong> preparation.<br />
Appurtenant facilities have been accounted for within the unit prices. Opinions <strong>of</strong> probable cost<br />
are based upon current cost data for similar construction in the region, contractors, and suppliers.<br />
Opinions <strong>of</strong> cost are referenced to ENRCCI (9324) as <strong>of</strong> July 2012. Costs will be adjusted for<br />
inflation based on changes in the ENRCCI.<br />
Estimates <strong>of</strong> environmental review cost have been included in the cost <strong>of</strong> administering the PFIP.<br />
C. MARK-UP ASSUMPTIONS<br />
Contingency factors have been applied to the opinions <strong>of</strong> probable construction cost.<br />
Contingencies represent a combination <strong>of</strong> factors allowing for additional costs associated with<br />
unknown site conditions, extra quantities <strong>of</strong> materials, etc. Ancillary project costs (design<br />
engineering including surveying, geotechnical, and other specialties; plan check; construction<br />
management; surveying; and inspection) have also been estimated and are set in correlation with<br />
the anticipated level <strong>of</strong> complexity <strong>of</strong> the various types <strong>of</strong> projects.<br />
Design services would typically include preliminary studies; plans, specifications, and estimates;<br />
and construction consultation. Based on industry accepted standards <strong>of</strong> practice and cost<br />
estimating guides, these percentages are reasonable for the type and magnitude <strong>of</strong> projects in the<br />
PFIP and are consistent with engineering practice.<br />
<strong>Manteca</strong> <strong>2013</strong> PFIP <strong>Update</strong> 15 MTB011401<br />
February <strong>2013</strong> n:\mtb011401\reports\final\<strong>2013</strong>0226.docx
D. LAND ACQUISITION ASSUMPTIONS<br />
For the purposes <strong>of</strong> preparing the financial plan, land will be assumed to be either dedicated or<br />
purchased in accordance with Table 4-1.<br />
Infrastructure<br />
Category<br />
Table 4-1<br />
Land Acquisition by Dedication or Purchase<br />
<strong>Facilities</strong> for Which<br />
Lands are to be Dedicated<br />
(No cost to the <strong>City</strong>)<br />
Water Pipelines<br />
Well sites (within parks)<br />
Storm Drainage Detention basins serving individual<br />
and combined projects<br />
Easements serving individual projects<br />
Pipelines<br />
Canals serving individual projects<br />
Sewer Pipelines<br />
Trunks<br />
<strong>Facilities</strong> for Which<br />
Lands are to be Purchased<br />
(Cost born by PFIP)<br />
Treatment plant<br />
Storage tank sites<br />
Well sites (not in parks)<br />
Treatment plant and disposal areas<br />
Lift Stations<br />
<strong>Manteca</strong> <strong>2013</strong> PFIP <strong>Update</strong> 16 MTB011401<br />
February <strong>2013</strong> n:\mtb011401\reports\final\<strong>2013</strong>0226.docx
5. WATER<br />
This chapter provides PFIP information as it pertains to the <strong>City</strong> water system. A summary <strong>of</strong><br />
the information is as follows: 1) background; 2) facilities and costs; 3) dwelling unit equivalents;<br />
4) fee methodology; 5) fee schedule; and 6) construction responsibilities.<br />
A. BACKGROUND<br />
The <strong>City</strong> <strong>of</strong> <strong>Manteca</strong> 2005 Water Master <strong>Plan</strong> (2005 WMP) presents the results <strong>of</strong> an evaluation<br />
<strong>of</strong> the water supply and distribution system. The planning document provides a tool for<br />
addressing changing regulations, aging infrastructure, and anticipated growth in planning future<br />
improvements to its water system through the year 2035. The purpose <strong>of</strong> the 2005 WMP is to<br />
provide a comprehensive planning document to guide improvement and expansion <strong>of</strong> the <strong>City</strong><br />
water system to meet current and future needs for a safe, reliable water supply and distribution<br />
system.<br />
Key objectives <strong>of</strong> the 2005 WMP affecting future development projects include the following:<br />
Provide a strategic approach to comply with the new maximum contaminant level (MCL)<br />
for arsenic, which took effect in January 2006, through the addition <strong>of</strong> a combination <strong>of</strong><br />
treatment and storage facilities.<br />
Evaluate alternatives and plan water system improvements to facilitate delivery <strong>of</strong> the<br />
South San Joaquin Irrigation District (SSJID) surface water supply. Alternatives<br />
addressed a groundwater supply and storage plan to meet a conjunctive groundwater/<br />
surface water use approach by the <strong>City</strong> without exceeding the aquifer’s safe yield.<br />
<strong>Update</strong> the <strong>City</strong>’s existing water distribution system hydraulic model and conduct<br />
hydraulic modeling to determine distribution system expansion requirements.<br />
Prepare a CIP for the water system that identifies projects for completion by the <strong>City</strong>.<br />
This CIP included improvements needed for the existing system (funded by ratepayers)<br />
and growth driven improvements funded by this program.<br />
The 2005 WMP reviews water demand required to provide for the 2023 General <strong>Plan</strong> lands<br />
within the Primary Urban Service Area (PUSA) through buildout. Historically, the <strong>City</strong> has<br />
utilized separate planning documents for Zone 11 (2002 Water Master <strong>Plan</strong>) and Zone 12 (1993<br />
PFIP) to define the required capital improvements. The earlier area contained in Zone 11<br />
included the existing developed portions <strong>of</strong> <strong>Manteca</strong> with growth generally limited to infill<br />
development and redevelopment. The earlier area contained in Zone 12 included the lightly<br />
developed lands that could be characterized as agricultural areas with significant urban<br />
development potential. However, because the <strong>City</strong> water system operates as a single system, the<br />
<strong>City</strong> uses one planning document for all areas, which have been merged into a single zone<br />
designated as Zone 12. See Plate B-1 in Appendix B for a depiction <strong>of</strong> Zone 12.<br />
<strong>Manteca</strong> <strong>2013</strong> PFIP <strong>Update</strong> 17 MTB011401<br />
February <strong>2013</strong> n:\mtb011401\reports\final\<strong>2013</strong>0226.docx
B. FACILITIES AND COSTS<br />
New water supply comes from groundwater and surface water. Groundwater supply is limited to<br />
safe yield limits and surface water supply is limited to capacity available at the South San<br />
Joaquin Irrigation District (SSJID) water plant. Service is provided by a network <strong>of</strong> water wells,<br />
storage tanks, and distribution pipelines. The water system for current and future users will be<br />
operated as a single pressure zone.<br />
1. Groundwater Supply <strong>Facilities</strong><br />
New wells will be located as needed to supplement existing groundwater and surface water<br />
supplies, optimize distribution, and maintain minimum pressures during peak conditions<br />
throughout the system.<br />
2. Water Treatment <strong>Facilities</strong><br />
With the increase in regulations, treatment <strong>of</strong> groundwater has become a standard expense, even<br />
on newer wells. The <strong>City</strong> anticipates having to provide treatment for a significant portion <strong>of</strong> new<br />
wells. Currently the <strong>City</strong> provides treatment on 76.5 percent <strong>of</strong> the <strong>City</strong> wells for arsenic,<br />
volatile organic compounds, or other constituents. The hope or expectation that new wells would<br />
require less treatment is <strong>of</strong>fset by the potential for additional regulation that could increase water<br />
treatment requirements. Hence, for planning purposes, the PFIP anticipates funding treatment at<br />
the same ratio.<br />
3. Costs<br />
Costs for major water infrastructure (wells and tanks) are based upon the capacity provided by<br />
each water facility, the users’ anticipated demand determined by the size <strong>of</strong> meter, and current<br />
engineer’s opinion <strong>of</strong> probable costs. The need for water mains is based upon the pipe system<br />
outlined in the 2005 WMP and updated as needed to serve the areas included in the <strong>City</strong> General<br />
<strong>Plan</strong>.<br />
C. DWELLING UNIT EQUIVALENTS<br />
All PFIP water fees will be charged based upon the meter size installed. A standard residential<br />
water meter (less than 1-inch) is the standard meter for a single family residence or single EDU<br />
and is considered an EDU factor <strong>of</strong> 1.0. Larger meters and their respective hydraulic<br />
capacity/EDU factor are shown in Table 5-1.<br />
<strong>Manteca</strong> <strong>2013</strong> PFIP <strong>Update</strong> 18 MTB011401<br />
February <strong>2013</strong> n:\mtb011401\reports\final\<strong>2013</strong>0226.docx
D. FEE METHODOLOGY<br />
Table 5-1<br />
Water Meter Hydraulic Capacity/EDU Factors<br />
Meter Size, in<br />
Hydraulic Capacity/<br />
EDU Factor<br />
5/8 1.00<br />
1 1.67<br />
1½ 3.33<br />
2 5.33<br />
3 10.00<br />
4 16.67<br />
6 33.33<br />
8 53.33<br />
The <strong>City</strong> has established a fee structure that allocates costs to construct water infrastructure<br />
related to new development. There are two types <strong>of</strong> fees assessed, non-PFIP fees which have<br />
been adopted by separate <strong>City</strong> resolutions and PFIP fees which are adopted in connection with<br />
this document. Brief descriptions <strong>of</strong> what are included in the fees are provided. Descriptions <strong>of</strong><br />
the non-PFIP fees are provided for informational purposes only. Because these fees are adopted<br />
by separate <strong>City</strong> resolution, policies related to these fees including fee adjustments are identified<br />
in other <strong>City</strong> documents.<br />
1. Non-PFIP Fees<br />
Meter Installation Fee<br />
The Meter Installation Fee recovers the <strong>City</strong>’s cost to install new water meters. The fee includes<br />
the cost <strong>of</strong> the meter, meter box, pipe fittings, labor, and equipment charges.<br />
Surface Water Debt Fee<br />
The Surface Water Debt Fee is development’s proportionate share <strong>of</strong> the capitalized costs <strong>of</strong> the<br />
surface water treatment system and transmission system.<br />
Surface Water Capital Fee<br />
The Surface Water Capital Fee is development’s proportionate share <strong>of</strong> ongoing capital<br />
improvement projects to improve, upgrade, and rehabilitate the surface water treatment system<br />
and transmission system.<br />
<strong>Manteca</strong> <strong>2013</strong> PFIP <strong>Update</strong> 19 MTB011401<br />
February <strong>2013</strong> n:\mtb011401\reports\final\<strong>2013</strong>0226.docx
2. PFIP Fees<br />
Groundwater Supply Fee<br />
The Groundwater Supply Fee recovers the cost <strong>of</strong> new well construction required to supply water<br />
to new development. The costs include: environmental fees; test wells; well drilling, casing and<br />
development; consulting services; electrical service charges; and water treatment systems.<br />
Peaking Facility Fee<br />
The Peaking Facility Fee recovers the cost to construct water storage and booster pumping<br />
facilities to provide peaking demand and fire flows for new development. The costs include:<br />
environmental fees; site acquisition; consulting services; electrical service charges; and<br />
construction <strong>of</strong> tanks and booster pumping facilities.<br />
Distribution System Fee<br />
The Distribution System Fee will reimburse developers for the cost <strong>of</strong> installing and oversizing<br />
public water mains installed in the public right <strong>of</strong> way.<br />
E. FEE SCHEDULE<br />
The PFIP fees described above combine to establish the PFIP Water Fee. Table 5-2 summarizes<br />
the fees by meter size. The tables in Appendix B identify the costs and calculations associated<br />
with the PFIP fees.<br />
Table 5-2<br />
Summary <strong>of</strong> PFIP Water Fees by Meter Size<br />
Meter Size, in Groundwater<br />
Supply Fee, $<br />
Peaking<br />
Facility Fee, $<br />
Distribution<br />
System Fee, $<br />
PFIP Water<br />
Fee, $<br />
5/8 968 1,489 626 3,083<br />
1 1,616 2,487 1,046 5,149<br />
1½ 3,223 4,958 2,085 10,267<br />
2 5,159 7,936 3,337 16,433<br />
3 9,680 14,890 6,261 30,831<br />
4 16,136 24,822 10,437 51,395<br />
6 32,262 49,628 20,869 102,759<br />
8 51,621 79,408 33,391 164,420<br />
F. CONSTRUCTION RESPONSIBILITIES<br />
The <strong>City</strong> and developer have responsibilities for construction <strong>of</strong> water facilities as follows:<br />
<strong>Manteca</strong> <strong>2013</strong> PFIP <strong>Update</strong> 20 MTB011401<br />
February <strong>2013</strong> n:\mtb011401\reports\final\<strong>2013</strong>0226.docx
1. <strong>City</strong> Responsibilities<br />
As funds are available, the <strong>City</strong> will construct all wells and storage tanks. The <strong>City</strong> may also<br />
install some water transmission and/or distribution mains needed for looping or redundancy.<br />
2. Developer Responsibilities<br />
The developer will be responsible for construction <strong>of</strong> the distribution system and dedication <strong>of</strong><br />
well and tank sites as described below.<br />
Distribution System<br />
Water mains will be installed by developers as outlined in the 2005 WMP on a typical one-half<br />
mile grid spacing. All development projects that construct streets on this grid will be responsible<br />
for installing a minimum 12-inch water main with associated appurtenances (valves, hydrants,<br />
etc.).<br />
Developers that install 12-inch diameter water mains on the main one-mile grid will be entitled<br />
to fee credits and/or reimbursement at the rates provided in Appendix B.<br />
All in-tract water mains on the “Interior Grid,” which are spaced roughly on the half-mile grid,<br />
shall be 12-inch diameter and will be credited and/or reimbursed based upon the rates provided<br />
in Appendix B for “oversizing” <strong>of</strong> water mains from an 8-inch to 12-inch.<br />
In locations where the <strong>City</strong> requires larger water mains (16-inch to 18-inch diameter) to be<br />
installed on the Main Grid to provide efficient movement and distribution <strong>of</strong> water through the<br />
<strong>City</strong> system, the installer will be credited and/or reimbursed at the amount per foot shown in<br />
Table B-7 in Appendix B. Actual location <strong>of</strong> large mains shall be as directed by the <strong>City</strong>.<br />
The timing <strong>of</strong> reimbursements is contingent on the availability <strong>of</strong> funds for such purpose, based<br />
on order <strong>of</strong> project acceptance. No reimbursements will be made when the distribution fund<br />
balance is less than $200,000.<br />
Well and Tank Sites<br />
To provide sufficient opportunity for placement <strong>of</strong> productive groundwater facilities or wells, the<br />
<strong>City</strong> will require the dedication <strong>of</strong> a suitable well site within every quarter section. All projects<br />
that include the development <strong>of</strong> more than 40 acres within any given quarter section shall <strong>of</strong>fer<br />
for dedication a suitable well site for exclusive use <strong>of</strong> the installation <strong>of</strong> a water well and any<br />
needed treatment facilities, unless a suitable well site has already been proven for that quarter<br />
section.<br />
Prior to the dedication <strong>of</strong> the well site, the developer shall provide access and permission to the<br />
<strong>City</strong> to complete an exploratory well or test well. If the test well is successful, the <strong>of</strong>fer <strong>of</strong><br />
dedication will be accepted. If the test well is not successful, the developer shall provide an<br />
alternate site at an agreed-upon location for a second test well.<br />
<strong>Manteca</strong> <strong>2013</strong> PFIP <strong>Update</strong> 21 MTB011401<br />
February <strong>2013</strong> n:\mtb011401\reports\final\<strong>2013</strong>0226.docx
A suitable well site shall be at least 5,000 sf and shall be fenced appropriately.<br />
Well sites that are part <strong>of</strong> parks or other multi use facilities, for which other non-water credit is<br />
being taken, shall not be subject to any credit or reimbursement. Developers that dedicate a sole<br />
use well site will be entitled to fee credits and or reimbursement for the value <strong>of</strong> the well site as<br />
established in Appendix B. Should the value <strong>of</strong> the dedicated site exceed the Groundwater<br />
Supply Fee obligation, the developer shall be entitled to reimbursement as outlined in Chapter 2.<br />
Reimbursements are contingent on the availability <strong>of</strong> funds for such purpose. Funding for well<br />
site reimbursement will come solely from the Groundwater Supply Fee Fund.<br />
Tank sites will be acquired and or dedicated as needed to support development. Developers<br />
that dedicate tank sites will be entitled to fee credits or reimbursement for the value <strong>of</strong> the tank<br />
site, as established in Appendix B. Should the value <strong>of</strong> the dedicated site exceed the Peaking<br />
Facility Fee obligation, the developer shall be entitled to reimbursement as outlined in Chapter 2.<br />
The timing <strong>of</strong> reimbursements is contingent on the availability <strong>of</strong> funds for such purpose.<br />
Funding for tank site reimbursement will come solely from the Peaking Facility Fee Fund.<br />
Reimbursement for dedicated tank sites will only be made after the tanks are installed and<br />
functional. Other tank sites may be acquired by the <strong>City</strong> or may be a consideration <strong>of</strong> project<br />
approval.<br />
All well and tank sites shall be as approved by the Director <strong>of</strong> <strong>Public</strong> Works and may be<br />
combined with other public facility sites such as parks or landscape strips where feasible.<br />
3. Construction Sequencing<br />
While pressurized systems can be installed virtually anywhere, the <strong>City</strong> generally plans to install<br />
new supply and peaking facilities in a concentric manner starting at the perimeter <strong>of</strong> the existing<br />
water system. This is to provide for redundancy and to ensure that fire flow demands are met for<br />
additions to the water system.<br />
<strong>Manteca</strong> <strong>2013</strong> PFIP <strong>Update</strong> 22 MTB011401<br />
February <strong>2013</strong> n:\mtb011401\reports\final\<strong>2013</strong>0226.docx
6. STORM DRAINAGE<br />
This chapter provides PFIP information as it pertains to the <strong>City</strong> storm drainage system. A<br />
summary <strong>of</strong> the information is as follows: 1) background; 2) facilities and costs; 3) dwelling unit<br />
equivalents; 4) fee methodology; 5) fee schedule; and 6) construction responsibilities.<br />
A. BACKGROUND<br />
The <strong>2013</strong> Storm Drain Master <strong>Plan</strong> (<strong>2013</strong> SDMP) provides a comprehensive planning document<br />
to guide improvement and expansion <strong>of</strong> the <strong>City</strong>’s storm drainage system to meet current and<br />
future needs in a safe and reliable manner while maintaining compliance with all applicable<br />
regulations.<br />
Key objectives <strong>of</strong> the <strong>2013</strong> SDMP affecting future development include the following:<br />
Compliance with the provisions <strong>of</strong> the SSJID/<strong>City</strong> Master Drainage Agreement.<br />
Compliance with stormwater quality provisions in the State Water Resources Control<br />
Board’s stormwater NPDES permit for Phase II cities.<br />
Adherence to the drainage methodology.<br />
The <strong>2013</strong> SDMP evaluates drainage from the General <strong>Plan</strong> lands within the PUSA through build<br />
out. Five planning zones have been identified to define the capital improvements needed to<br />
serve future growth: Zones 30, 32, 34, 36 and 39. With the exception <strong>of</strong> drainage Zone 39, all<br />
drainage zones are located in the SSJID service area. See Plate C-1 in Appendix C for a<br />
depiction <strong>of</strong> the drainage zones.<br />
B. FACILITIES AND COSTS<br />
Stormwater control is essential to protect the <strong>City</strong> from flooding during storm events. This<br />
protection is provided through a series <strong>of</strong> storm drains, detention basins, and pumping facilities.<br />
For zones within the SSJID service area, the <strong>City</strong> has an agreement with SSJID to allow<br />
discharge into the SSJID facilities. SSJID facilities then convey the run<strong>of</strong>f to the San Joaquin<br />
River. While areas <strong>of</strong> the <strong>City</strong> currently are allowed to have direct discharge to SSJID facilities,<br />
new development cannot discharge direct to the SSJID facilities and attenuation facilities must<br />
be installed to control the run<strong>of</strong>f. For development in Zone 39, which is outside the SSJID<br />
service area, separate facilities will be constructed to convey the run<strong>of</strong>f to one regional pump<br />
station that will discharge into Walthall Slough.<br />
Development is required to install attenuation facilities for control <strong>of</strong> storm run<strong>of</strong>f within their<br />
area <strong>of</strong> influence. Through the collection <strong>of</strong> PFIP fees, the <strong>City</strong> will construct the necessary<br />
pipelines and pump stations to convey stormwater to the appropriate discharge points.<br />
<strong>Manteca</strong> <strong>2013</strong> PFIP <strong>Update</strong> 23 MTB011401<br />
February <strong>2013</strong> n:\mtb011401\reports\final\<strong>2013</strong>0226.docx
The total storm drainage CIP construction cost is approximately $16,309,170 <strong>of</strong> which<br />
$2,754,291 is the responsibility <strong>of</strong> SSJID and not included in the PFIP fee calculation.<br />
C. DWELLING UNIT EQUIVALENTS<br />
Allocation <strong>of</strong> costs is based on run-<strong>of</strong>f coefficients (“C” factor). C factors represent the ratio <strong>of</strong><br />
the rate <strong>of</strong> run<strong>of</strong>f to the rate <strong>of</strong> rainfall at average rainfall intensity. Table 6-1 provides a<br />
summary <strong>of</strong> the C factor and EDU factor by land use type. The <strong>2013</strong> SDMP provides additional<br />
details regarding how the C factors for the various land uses are derived and the corresponding<br />
EDU factors.<br />
D. FEE METHODOLOGY<br />
Table 6-1<br />
Storm Drainage C Factors and EDU Factors<br />
Land Use Unit<br />
C Factor<br />
per Unit<br />
EDU<br />
Factor<br />
VLDR DU 0.1500 2.50<br />
LDR DU 0.0600 1.00<br />
MDR DU 0.0556 0.93<br />
HDR DU 0.0382 0.64<br />
AG (LDR) DU 0.0600 1.00<br />
BP acre 0.9000 15.00<br />
CMU acre 0.9000 15.00<br />
GC acre 0.9000 15.00<br />
NC acre 0.9000 15.00<br />
HI acre 0.7000 11.67<br />
LI acre 0.7000 11.67<br />
BIP acre 0.7000 11.67<br />
Allocation <strong>of</strong> costs is based on run-<strong>of</strong>f coefficients utilized per land use.<br />
E. FEE SCHEDULE<br />
The costs <strong>of</strong> facilities and the division <strong>of</strong> construction costs among the fee zones are summarized<br />
in Table 6-2. Table C-4 in Appendix C provides a breakdown <strong>of</strong> the projects and an allocation<br />
<strong>of</strong> projects costs to the individual zones.<br />
<strong>Manteca</strong> <strong>2013</strong> PFIP <strong>Update</strong> 24 MTB011401<br />
February <strong>2013</strong> n:\mtb011401\reports\final\<strong>2013</strong>0226.docx
Table 6-2<br />
Projected Storm Drainage Project Costs by Zone<br />
Parameter Cost, $<br />
Zone 30 367,925<br />
Zone 32 2,340,341<br />
Zone 34 1,545,490<br />
Zone 36 7,677,541<br />
Zone 39 1,623,582<br />
SSJID Costs a<br />
2,754,291<br />
Total Project Costs 16,309,170<br />
a Portion <strong>of</strong> project costs to be paid by SSJID based<br />
on the SSJID/<strong>City</strong> drainage agreement.<br />
The PFIP Storm Drainage Fees are provided in Table 6-3 for residential land uses and Table 6-4<br />
for non-residential land uses.<br />
Table 6-3<br />
Summary <strong>of</strong> PFIP Residential Storm Drainage Fees<br />
Fee Per Dwelling Unit, $<br />
Land Use Zone 30 Zone 32 Zone 34 Zone 36 Zone 39<br />
VLDR 118 1,428 898 2,188 899<br />
LDR 47 571 359 875 359<br />
Table 6-4<br />
Summary <strong>of</strong> PFIP MDR, HDR, and Non-Residential Storm Drainage Fees<br />
Fee Per Acre, $<br />
Land Use Zone 30 Zone 32 Zone 34 Zone 36 Zone 39<br />
MDR 394 4,760 2,994 7,295 2,995<br />
HDR 512 6,189 3,892 9,483 3,894<br />
BP 709 8,569 5,389 13,131 5,391<br />
CMU 709 8,569 5,389 13,131 5,391<br />
GC 709 8,569 5,389 13,131 5,391<br />
NC 709 8,569 5,389 13,131 5,391<br />
HI 551 6,665 4,191 10,213 4,193<br />
LI 551 6,665 4,191 10,213 4,193<br />
BIP 551 6,665 4,191 10,213 4,193<br />
<strong>Manteca</strong> <strong>2013</strong> PFIP <strong>Update</strong> 25 MTB011401<br />
February <strong>2013</strong> n:\mtb011401\reports\final\<strong>2013</strong>0226.docx
F. CONSTRUCTION RESPONSIBILITIES<br />
The <strong>City</strong> and developer have responsibilities for construction <strong>of</strong> storm drainage facilities as<br />
follows:<br />
1. <strong>City</strong> Responsibilities<br />
<strong>City</strong> responsibilities are discussed below.<br />
SSJID Drain Improvements<br />
As funds are available, the <strong>City</strong> will construct a new pipeline to increase the capacity <strong>of</strong> Drain 5<br />
to accommodate future flows. The Drain 5 improvement costs are included in the Zone 34 PFIP<br />
fee structure.<br />
Zone 32 Conveyance Improvements<br />
As funds are available, the <strong>City</strong> will construct a new pipeline to connect Lateral Rga to Drain 3<br />
per the <strong>2013</strong> SDMP. The cost <strong>of</strong> this connector pipe is included in the Zone 32 PFIP fee<br />
structure.<br />
Zone 36 Improvements<br />
As funds are available, the <strong>City</strong> will construct a drainage pipeline in Woodward Avenue – known<br />
as the South Drain – to serve as the main stormwater conveyance facility for Zone 36. The <strong>City</strong><br />
will also construct a pump station and force main – called the South Drain Pump Station and<br />
Force Main – to convey storm water from the South Drain Pipeline to the French Camp Outlet<br />
Canal (FCOC). In addition, the <strong>City</strong> will construct several junction structures to divert water<br />
from the dual use laterals to the South Drain. The cost <strong>of</strong> the South Drain, South Drain Pump<br />
Station and Force Main, and the junction structures are included in the Zone 36 PFIP fee<br />
structure.<br />
Water Level Monitoring Stations<br />
As funds are available, the <strong>City</strong> will construct water level monitoring facilities in the various<br />
PFIP zones and in the FCOC to monitor water elevations in real-time to prevent flooding caused<br />
by additional drainage flows. Each zone’s proportionate share <strong>of</strong> the water level monitoring<br />
stations is included the various PFIP zone fees.<br />
FCOC Culvert Crossing Improvements<br />
As identified in the <strong>2013</strong> SDMP, several existing culvert crossings in the FCOC need<br />
improvement to accommodate additional drainage flows. The existing SSJID/<strong>City</strong> drainage<br />
agreement contains cost-sharing provisions regarding these culvert crossing improvements<br />
wherein both parties share equally in the costs. As funds are available, the <strong>City</strong> or SSJID will<br />
construct the culvert crossing improvements, and the <strong>City</strong>’s 50 percent cost share for all FCOC<br />
<strong>Manteca</strong> <strong>2013</strong> PFIP <strong>Update</strong> 26 MTB011401<br />
February <strong>2013</strong> n:\mtb011401\reports\final\<strong>2013</strong>0226.docx
improvements needed for growth is included in the PFIP fee structure. The FCOC culvert<br />
crossing improvement costs are spread proportionately among the PFIP zones based upon the<br />
contribution <strong>of</strong> each zone.<br />
2. Developer Responsibilities<br />
Developer responsibilities are discussed below.<br />
Local Drainage Management <strong>Facilities</strong><br />
Developers will install, at their expense, local drainage collection, attenuation, pumping, and<br />
conveyance facilities necessary to serve their development. This includes facilities needed to<br />
convey stormwater from development projects to the nearest SSJID dual-use lateral. It is also<br />
the responsibility <strong>of</strong> the developer to collect and convey drainage from arterial streets adjacent to<br />
their projects to the local attenuation facility.<br />
While the <strong>City</strong> encourages regionalization <strong>of</strong> attenuation facilities, this effort is left to the<br />
developers to make arrangements amongst themselves. Should developers reach an arrangement<br />
for a regional attenuation facility, the <strong>City</strong> will support this effort by establishing and<br />
administering an area <strong>of</strong> benefit (AOB) for the regional facility. Costs for local collection<br />
facilities and local/regional attenuation facilities are not included in the PFIP program.<br />
SSJID Lateral Improvements<br />
SSJID laterals will be used to convey stormwater from the local/regional attenuation facilities to<br />
SSJID drains or the South Drain. While laterals are important conveyance facilities, all costs to<br />
replace and/or upsize the existing laterals are not included in the PFIP for the reasons described<br />
below.<br />
SSJID laterals are found throughout the existing and undeveloped areas <strong>of</strong> the <strong>City</strong>; and virtually<br />
all existing laterals in the PFIP planning area are 42-inch diameter in size, which is the size<br />
needed to convey build-out storm flows at the 96-hour drainage rate. Also, SSJID requires new<br />
development projects that disturb their laterals to remove, realign, and replace the laterals, at the<br />
developer’s expense, with at least the same diameter pipe as the existing lateral. Moreover,<br />
SSJID requires an increase in pipe diameter to the next standard pipe size (or more) to account<br />
for additional headloss created by any pipeline realignments. Because these are SSJID<br />
requirements, there are no replacement and/or upsizing costs in the PFIP.<br />
The <strong>City</strong> does acknowledge the possibility that an existing SSJID lateral in the PFIP planning<br />
area may be less than 42-inch diameter. In the event that a lateral is found to be less than<br />
42-inch diameter and should SSJID not require the replacement pipe to be at least a 42-inch pipe,<br />
the <strong>City</strong> will require the developer to upsize the pipe to 42-inch diameter. Should this situation<br />
occur, the developer will be reimbursed the incremental cost increase <strong>of</strong> a 42-inch pipe per the<br />
reimbursement policies in Chapter 2.<br />
<strong>Manteca</strong> <strong>2013</strong> PFIP <strong>Update</strong> 27 MTB011401<br />
February <strong>2013</strong> n:\mtb011401\reports\final\<strong>2013</strong>0226.docx
Zone 39 Improvements<br />
Zone 39 is outside <strong>of</strong> the SSJID service area, and therefore SSJID facilities cannot be used to<br />
convey run<strong>of</strong>f from this area. As a result, the <strong>2013</strong> SDMP identifies a conveyance and disposal<br />
system separate from SSJID facilities for this zone. The storm infrastructure needed for Zone 39<br />
will be funded and constructed by the developer first to develop in this zone. Because this<br />
infrastructure will be sized to serve all <strong>of</strong> Zone 39, the developer will be reimbursed the cost <strong>of</strong><br />
these facilities, less their proportionate share <strong>of</strong> the cost, in accordance with the reimbursement<br />
policies in Chapter 2.<br />
<strong>Manteca</strong> <strong>2013</strong> PFIP <strong>Update</strong> 28 MTB011401<br />
February <strong>2013</strong> n:\mtb011401\reports\final\<strong>2013</strong>0226.docx
7. SEWER COLLECTION<br />
This chapter provides PFIP information as it pertains to the <strong>City</strong> sewer collection system. A<br />
summary <strong>of</strong> the information is as follows: 1) background; 2) facilities and costs; 3) dwelling unit<br />
equivalents; 4) fee methodology; 5) fee schedule; and 6) construction responsibilities.<br />
A. BACKGROUND<br />
The 2012 Wastewater Collection System Master <strong>Plan</strong> <strong>Update</strong> (2012 WWCSMP) has been<br />
developed to ensure that the <strong>City</strong>’s trunk sewer system can cost-effectively meet the demands <strong>of</strong><br />
development goals adopted in the General <strong>Plan</strong> with appropriate consideration <strong>of</strong> construction<br />
costs and operation and maintenance issues.<br />
As part <strong>of</strong> the 2012 WWCSMP, residential wastewater generation factors (WGFs) for future<br />
development were reduced to reflect upcoming water conservation legislation for residential<br />
development based on a generation factors study. The study also focused on reductions <strong>of</strong><br />
industrial and general commercial WGFs to reflect historical water use data from local<br />
businesses.<br />
The 2012 WWCSMP evaluates wastewater conveyance requirements through buildout based on<br />
the General <strong>Plan</strong> for lands within the PUSA. Five planning zones have been delineated to define<br />
the capital improvements need to serve future growth: Zones 21, 22, 24, 25, and 26. See Plate<br />
D-1 in Appendix D for a depiction <strong>of</strong> the sewer zones.<br />
B. FACILITIES AND COSTS<br />
The overall collection sewer strategy consists <strong>of</strong> a combination trunk sewer gravity collection<br />
system with pump or lift stations located along the alignment to convey wastewater to an influent<br />
pump station located at the <strong>City</strong> Wastewater Quality Control Facility (WQCF). The North<br />
<strong>Manteca</strong> Collection Strategy (NMCS) and South <strong>Manteca</strong> Collection Strategy (SMCS) will<br />
collect flow from areas where future growth is expected. The Central <strong>Manteca</strong> Collection<br />
Strategy (CMCS) will connect the existing collection system to the NMCS.<br />
Construction <strong>of</strong> the NMCS, SMCS, and CMCS were grouped into potential projects for<br />
implementation in the future as part <strong>of</strong> the <strong>City</strong> CIP. The total wastewater collection system CIP<br />
construction cost is approximately $57,917,602 <strong>of</strong> which $6,272,214 is related to existing<br />
development and not included in the PFIP fee calculations.<br />
C. DWELLING UNIT EQUIVALENTS<br />
WGFs are utilized to calculate the anticipated wastewater flows generated by residential,<br />
commercial, and industrial development. The 2012 WWCSMP utilizes updated WGFs for future<br />
residential, commercial, and industrial land uses based on water conservation legislation for<br />
residential development and historical water use data from local businesses [3].<br />
<strong>Manteca</strong> <strong>2013</strong> PFIP <strong>Update</strong> 29 MTB011401<br />
February <strong>2013</strong> n:\mtb011401\reports\final\<strong>2013</strong>0226.docx
1. Residential<br />
California approved the 2010 California Green Building Standards Code (CALGreen 2010)<br />
which requires new buildings in California to become more efficient by mandating new<br />
construction to meet minimum standards. CALGreen 2010 requires a 20 percent reduction in<br />
indoor water use from the 2008 Title 24 baseline. Other legislation and water conservation<br />
programs include the 20x2020 Water Conservation <strong>Plan</strong>, LEED, Senate Bill (SB) 407, and EPA<br />
WaterSense ® Program, each <strong>of</strong> which have similar goals in water use reduction and efficiency to<br />
CALGreen.<br />
With the new CALGreen legislation and other water conservation programs, indoor water use<br />
(and wastewater flows) is expected to decrease significantly for new residential development.<br />
2. Commercial<br />
WGFs for general commercial land uses in the <strong>City</strong> were updated in the 2012 WWCSMP after<br />
reviewing historical water usage data from existing commercial developments at Spreckels Park<br />
and Big League Dreams.<br />
3. Industrial<br />
WGFs for heavy and light industrial land uses in the <strong>City</strong> were updated in the 2012 WWCSMP<br />
after reviewing historical water usage data from existing industrial developments.<br />
4. Equivalent Dwelling Units<br />
Based on the WGFs by land use type, Table 7-1 provides the per unit EDU factor for each land<br />
use. The 2012 WWCSMP provides detail on the derivation <strong>of</strong> EDU factors for the various land<br />
uses.<br />
<strong>Manteca</strong> <strong>2013</strong> PFIP <strong>Update</strong> 30 MTB011401<br />
February <strong>2013</strong> n:\mtb011401\reports\final\<strong>2013</strong>0226.docx
D. FEE METHODOLOGY<br />
Table 7-1<br />
Summary <strong>of</strong> Wastewater EDU Factors<br />
Land Use<br />
Unit EDU Factor<br />
VLDR DU 1.00<br />
LDR DU 1.00<br />
MDR DU 0.73<br />
HDR DU 0.73<br />
BIP acre 7.50<br />
CMU acre 15.46<br />
GC acre 4.69<br />
HI acre 6.25<br />
LI acre 6.25<br />
NC acre 7.00<br />
P acre 2.50<br />
PQP acre 2.66<br />
This section describes the non-PFIP and PFIP fees and also briefly summarizes how project costs<br />
are developed.<br />
1. Non-PFIP and PFIP Fees<br />
The <strong>City</strong> has established a fee structure that allocates costs to construct sewer infrastructure<br />
related to new development. There are two types <strong>of</strong> fees assessed, non-PFIP fees which have<br />
been adopted by separate <strong>City</strong> resolutions and PFIP fees which are adopted in connection with<br />
this document. Brief descriptions <strong>of</strong> what are included in the fees are also provided.<br />
Descriptions <strong>of</strong> the non-PFIP fees are provided for informational purposes only. Because these<br />
fees are adopted by separate <strong>City</strong> resolution, policies related to these fees including fee<br />
adjustments are identified in other <strong>City</strong> documents.<br />
Non-PFIP Fees<br />
Wastewater Connection Fee: The WQCF Phase III Expansion Project corrected a number <strong>of</strong><br />
existing deficiencies at the plant and thus benefited current rate payers. Based on an analysis <strong>of</strong><br />
project costs and proposed improvements, the expansion costs were allocated between rate<br />
payers and new development.<br />
The Wastewater Connection Fee was imposed in 2003 on new development during the Phase III<br />
Expansion in lieu <strong>of</strong> development impact fees. The Wastewater Connection Fee varies based on<br />
the timing <strong>of</strong> the development in relation to the Expansion Schedule(s) under construction.<br />
<strong>Manteca</strong> <strong>2013</strong> PFIP <strong>Update</strong> 31 MTB011401<br />
February <strong>2013</strong> n:\mtb011401\reports\final\<strong>2013</strong>0226.docx
WQCF Phase 3 Completion Fee: As part <strong>of</strong> a sewer rate study in 2007-2008, the connection fee<br />
schedule was re-evaluated to account for actual project costs. The study found that the<br />
Wastewater Connection Fee for the Phase III Expansion Project needed to be increased to repay<br />
the interfund loan obligations and the additional debt needed to complete the project. To comply<br />
with bonding requirements, a separate fee, called the WQCF Phase 3 Completion Fee, was<br />
implemented.<br />
PFIP Fees<br />
The Sewer Collection System Fee will fund the installation <strong>of</strong> pipelines and pump stations<br />
needed to serve future growth. The fee will also finance administration <strong>of</strong> the fund and advance<br />
planning for system and processing expansion.<br />
2. Facility Costs<br />
<strong>Facilities</strong> are sized to accommodate the projected flows along the route. The following method<br />
was used to estimate wastewater flow:<br />
Establish sewer shed boundaries to assign areas which will contribute flow to the trunk<br />
sewer.<br />
Obtain land use information for each shed from the General <strong>Plan</strong> land use diagram.<br />
Multiply land use areas within each shed by the corresponding WGF to obtain the<br />
projected average dry weather flow (ADWF) for each shed.<br />
Estimate peak wet weather flow (PWWF) by multiplying the projected ADWF with the<br />
peaking factor (PF). PWWF is the flow used to size trunk sewers, pump/lift stations, and<br />
force mains.<br />
Unit costs were developed in the 2012 WWCSMP for sewers, manholes, isolation gates, and<br />
other elements identified as recommended improvements. Construction costs for the NMCS,<br />
SMCS, and CMCS were divided by fee zone for each link or element, where applicable. Costs<br />
for the zones contributing to each link were calculated based on ADWF.<br />
E. FEE SCHEDULE<br />
The costs <strong>of</strong> all the facilities included in the NMCS, SMCS, CMCS and the division <strong>of</strong><br />
construction costs among the fee zones is summarized in Table 7-2. Table D-2 in Appendix D<br />
provides a breakdown <strong>of</strong> the projects and an allocation <strong>of</strong> projects costs to the individual zones.<br />
<strong>Manteca</strong> <strong>2013</strong> PFIP <strong>Update</strong> 32 MTB011401<br />
February <strong>2013</strong> n:\mtb011401\reports\final\<strong>2013</strong>0226.docx
Table 7-2<br />
Projected Sewer Project Costs by Zone<br />
Parameter Cost, $<br />
Zone 21 2,198,517<br />
Zone 22 17,973,626<br />
Zone 24 26,992,527<br />
Zone 25 2,786,963<br />
Zone 26 1,693,755<br />
<strong>City</strong> Costs a<br />
6,272,214<br />
Total Project Costs 57,917,602<br />
a Portion <strong>of</strong> project costs to be paid by the <strong>City</strong> to<br />
alleviate existing deficiencies.<br />
The PFIP Sewer Collection System Fees for residential land uses are provided in Table 7-3. The<br />
fees for non-residential land uses are provided in Table 7-4<br />
Table 7-3<br />
Summary <strong>of</strong> PFIP Residential Sewer Collection System Fees<br />
Land Use<br />
Fee Per Dwelling Unit, $<br />
Zone 21 Zone 22 Zone 24 Zone 25 Zone 26<br />
VLDR 277 1,714 1,306 310 1,067<br />
LDR 277 1,714 1,306 310 1,067<br />
MDR 203 1,254 955 226 780<br />
HDR 203 1,254 955 226 780<br />
Table 7-4<br />
Summary <strong>of</strong> PFIP Non-Residential Sewer Collection System Fees<br />
Land Use<br />
$ per Gallon per Day<br />
Zone 21 Zone 22 Zone 24 Zone 25 Zone 26<br />
All Non-Residential 1.73 10.72 8.16 1.94 6.67<br />
F. CONSTRUCTION RESPONSIBILITIES<br />
The <strong>City</strong> and developer have responsibilities for construction <strong>of</strong> sewer facilities as follows:<br />
1. <strong>City</strong> Responsibilities<br />
As funds are available, the <strong>City</strong> will construct the sewer facilities shown in the 2012 WWCSMP.<br />
If insufficient funds are available, developers may advance construction by providing funding<br />
<strong>Manteca</strong> <strong>2013</strong> PFIP <strong>Update</strong> 33 MTB011401<br />
February <strong>2013</strong> n:\mtb011401\reports\final\<strong>2013</strong>0226.docx
following <strong>City</strong> approval. In such an event, developers shall be entitled to reimbursement for<br />
costs in accordance with the PFIP reimbursement policy in Chapter 2.<br />
2. Developer Responsibilities<br />
Developers will install, at their expense, local collection and conveyance facilities necessary to<br />
serve their development. The costs <strong>of</strong> the local collection and conveyance facilities are not<br />
included in the PFIP program.<br />
3. Construction Sequencing<br />
The gravity-based sewer systems will be constructed concentrically outward beginning with the<br />
infrastructure with the lowest invert elevations and advancing in sequence to the infrastructure<br />
with the highest invert elevations. This approach will be used to ensure that newly installed<br />
facilities can be put into service immediately. For sewer facilities, the lowest elevation is the<br />
influent pump station wet well at the WQCF.<br />
<strong>Manteca</strong> <strong>2013</strong> PFIP <strong>Update</strong> 34 MTB011401<br />
February <strong>2013</strong> n:\mtb011401\reports\final\<strong>2013</strong>0226.docx
This section will be added by addendum when complete.<br />
8. TRANSPORTATION<br />
<strong>Manteca</strong> <strong>2013</strong> PFIP <strong>Update</strong> 35 MTB011401<br />
February <strong>2013</strong> n:\mtb011401\reports\final\<strong>2013</strong>0226.docx
9. REFERENCES<br />
[1] <strong>City</strong> <strong>of</strong> <strong>Manteca</strong> General <strong>Plan</strong> 2023 Policy Document, Adopted October 6, 2003;<br />
Housing Element Amended June 15, 2010; Circulation Element Amended April 5, 2011<br />
[2] <strong>Manteca</strong> General <strong>Plan</strong> Housing Element, Mintier Harnish <strong>Plan</strong>ning Consultants, Adopted<br />
June 15, 2010<br />
[3] Wastewater Generation Factors, Technical Memorandum – Draft, Nolte Associates, Inc.,<br />
November 2010.<br />
<strong>Manteca</strong> <strong>2013</strong> PFIP <strong>Update</strong> 36 MTB011401<br />
February <strong>2013</strong> n:\mtb011401\reports\final\<strong>2013</strong>0226.docx
Appendix A<br />
Vacant Land Inventory
Table A-1<br />
<strong>City</strong> <strong>of</strong> <strong>Manteca</strong><br />
PFIP Vacant Land Summary - Acres<br />
Land Use<br />
Vacant Land -<br />
Acres<br />
AG (LDR) 3,692.80<br />
BIP 179.98<br />
BP 1.00<br />
CMU 229.44<br />
GC 291.56<br />
HDR 127.26<br />
HI 485.00<br />
LDR 3,401.44<br />
LI 750.37<br />
MDR 218.69<br />
NC 56.16<br />
OS 444.76<br />
P 94.76<br />
PQP 216.02<br />
UR 1,709.12<br />
UR-AG (LDR) 1,613.75<br />
UR-BIP 408.70<br />
UR-CMU 415.14<br />
UR-GC 40.43<br />
UR-LDR 1,381.35<br />
UR-LI 114.45<br />
UR-MDR 19.74<br />
UR-P 67.52<br />
UR-PQP 11.65<br />
UR-VLDR 746.63<br />
VLDR 659.51<br />
Total 17,377.24
LEGEND<br />
VACANT PARCEL
Appendix B<br />
Water Data
Table B-1<br />
<strong>City</strong> <strong>of</strong> <strong>Manteca</strong><br />
PFIP Water Fee<br />
Sumary <strong>of</strong> PFIP Water Fees<br />
Meter<br />
Size<br />
Hydraulic<br />
Capacity<br />
Factor<br />
Groundwater<br />
Supply Fee<br />
Peaking<br />
Facility Fee<br />
PFIP Fees<br />
Distribution<br />
System Fee Total<br />
5/8" 1.00 $968 $1,489 $626 $3,083<br />
1" 1.67 $1,616 $2,487 $1,046 $5,149<br />
1 1/2" 3.33 $3,223 $4,958 $2,085 $10,267<br />
2" 5.33 $5,159 $7,936 $3,337 $16,433<br />
3" 10.00 $9,680 $14,890 $6,261 $30,831<br />
4" 16.67 $16,136 $24,822 $10,437 $51,395<br />
6" 33.33 $32,262 $49,628 $20,869 $102,759<br />
8" 53.33 $51,621 $79,408 $33,391 $164,420
Table B-1.1<br />
<strong>City</strong> <strong>of</strong> <strong>Manteca</strong><br />
PFIP Water Fee<br />
Water Fee Calculation Summary<br />
Groundwater Peaking Distribution<br />
Supply Facility System Source/<br />
Description Fee Fee Fee Totals Notes<br />
PROJECT CONSTRUCTION COSTS<br />
Capital Improvements <strong>Plan</strong><br />
Current Projects -<br />
Future Projects 1,950,000<br />
Total Master <strong>Plan</strong> CIP (July 2010 $) 1,950,000<br />
-<br />
2,478,000<br />
2,478,000<br />
-<br />
20,889,000<br />
20,889,000<br />
-<br />
25,317,000<br />
25,317,000<br />
S<strong>of</strong>t Costs 293,000 273,000<br />
- 566,000 See Note (4)<br />
S<strong>of</strong>t Cost % <strong>of</strong> Construction Costs 15% 11% 0% 2%<br />
Inflation Adjustment to 2012 $ 121,737<br />
149,308<br />
1,133,731<br />
1,404,776<br />
Total PFIP CIP 2,364,737 2,900,308 22,022,731 27,287,776<br />
% <strong>of</strong> PFIP CIP 8.7% 10.6% 80.7% 100.0%<br />
See Note (12)<br />
FINANCING COSTS<br />
Total PFIP CIP 802,823 984,648 1,869,166 3,656,637 See Note (3)<br />
Total Estimated Financing Costs 802,823 984,648 1,869,166<br />
Finance Cost % <strong>of</strong> CIP 33.9% 33.9% 8.5% 0.0%<br />
PFIP ADMINISTRATION COSTS<br />
Program <strong>Update</strong>s and On-Going Admin -<br />
<strong>City</strong> Administrative Costs - Variable -<br />
Total PFIP Admin Costs -<br />
FUND BALANCES<br />
Net Fund Balance (Deficit) (413,862)<br />
Fees From Remaining PFIP Development -<br />
Total Fund Balances (413,862)<br />
Net Costs Funded From PFIP Fee 3,581,421<br />
Total EDUs Served 3,700<br />
-<br />
-<br />
-<br />
(507,595)<br />
-<br />
(507,595)<br />
4,392,550<br />
2,950<br />
3,169,688<br />
-<br />
3,169,688<br />
(3,854,287)<br />
-<br />
(3,854,287)<br />
30,915,872<br />
49,377<br />
3,169,688<br />
- See Note (5),(6)<br />
3,169,688<br />
(4,775,743) 6/30/12 Balance - Note (11)<br />
-<br />
(4,775,743)<br />
35,233,207<br />
Fee Per EDU $ 968 $ 1,489 $ 626<br />
See Table B-1 for Fees Per Meter<br />
Note (1) Note (6)<br />
Notes:<br />
(1) Groundwater fee based on the per EDU cost <strong>of</strong> one well.<br />
(2) Assumes entire cost <strong>of</strong> current projects funded by 30 year debt service with 2.0% interest.<br />
(3) Assumes 100% <strong>of</strong> PFIP CIP costs are financed for Supply and Peaking, 25% for Distribution, see Table B-6 for financing assumptions.<br />
(4) S<strong>of</strong>t cost estimates shown in Tables B2-B8.<br />
(5) <strong>City</strong> Admistrative Costs - Variable assumed to be 0% <strong>of</strong> PFIP CIP costs.<br />
(6) Distribution System Fee based on estimate <strong>of</strong> the cost <strong>of</strong> infrastructure to serve buildout.<br />
(7) EDU = 660 gpd (200 per capita x 3.3 persons per household)<br />
(8) Groundwater supply costs detailed in Table B-2.<br />
(9) Peaking facility costs detailed in Table B-6.<br />
(10) Distribution facility costs detailed in Table B-7 and B-8.<br />
(11) Water fund balance spread to water fees based on CIP costs.<br />
(12) CIP costs based on July 2010 ENR (8844) were adjusted to July 2012 ENR (9324).
Table B-2<br />
<strong>City</strong> <strong>of</strong> <strong>Manteca</strong><br />
PFIP Water Fee<br />
Groundwater Supply Fee<br />
Well Capacity, gpm 2,000<br />
Dwelling Unit Use, gpm 0.237<br />
Max Day Peak Factor 2.00<br />
Redundancy Factor 1.15<br />
Dwelling Units Served 3,700<br />
CONSTRUCTION COSTS<br />
Well Drilling and Development 281,000<br />
Water Treatment 900,000<br />
Well Improvements 765,000<br />
Source<br />
$ Table B-3<br />
$ Table B-4<br />
$ Table B-5<br />
Subtotal Construction Costs $ 1,950,000<br />
SOFT COSTS<br />
Environmental / <strong>Plan</strong>ning 2.0% $39,000<br />
Design 9.0% $175,500<br />
Construction Management/Engineering 4.0% $78,000<br />
Subtotal S<strong>of</strong>t Costs $293,000<br />
TOTAL COSTS $2,240,000<br />
Source: <strong>City</strong> <strong>of</strong> <strong>Manteca</strong>.
Table B-3<br />
<strong>City</strong> <strong>of</strong> <strong>Manteca</strong><br />
PFIP Water Fee<br />
Groundwater Supply<br />
Opinion <strong>of</strong> Probable Cost<br />
Well Drilling and Development<br />
TEST WELL<br />
Drill and develop $40,000<br />
Sampling $8,000<br />
Abandonment $8,000<br />
Subtotal $56,000<br />
Contingency 100% $56,000<br />
Subtotal Test Well $112,000<br />
PRODUCTION WELL<br />
Drill Case and Develop $145,000<br />
Sampling $2,000<br />
Subtotal $147,000<br />
Contingency 15% $22,050<br />
Subtotal Production Well $169,050<br />
TOTAL WELL DRILLING AND DEVELOPMENT COST $281,000<br />
Source: <strong>City</strong> <strong>of</strong> <strong>Manteca</strong>.
Table B-4<br />
<strong>City</strong> <strong>of</strong> <strong>Manteca</strong><br />
PFIP Water Fee<br />
Groundwater Supply<br />
Opinion <strong>of</strong> Probable Cost<br />
Well Improvements<br />
Earthwork $23,200<br />
Paving $34,800<br />
Fencing $11,800<br />
Precast Vaults $18,750<br />
Pump Pedestal $3,300<br />
Reinforcing Steel $8,600<br />
Well Building $26,700<br />
CMU $33,000<br />
Metal Fabrications $5,700<br />
Carpentry $24,800<br />
Ro<strong>of</strong> $7,500<br />
Flashing & Painting $4,000<br />
Skylight $4,000<br />
Doors & Hardware $6,200<br />
Coating and Painting $17,700<br />
Building Specialties $4,300<br />
Louvers $3,900<br />
Ventilation $3,700<br />
Main Switchboard $288,300<br />
Main Switchboard Inst. $10,000<br />
Underground Rough-in $22,000<br />
Under Slab Rough-in $9,000<br />
Conduit & Fitting $32,000<br />
Wire & Cables $15,000<br />
Engine Generator $117,000<br />
Generator Slab $8,300<br />
Above Ground Fuel Tank $20,500<br />
Subtotal $764,050<br />
Contingency 10% $76,405<br />
Mobilization 5% $38,203<br />
Site Acquisition (5,000 SF) $4/SF $20,000<br />
TOTAL WELL IMPROVEMENTS COST $900,000<br />
Source: <strong>City</strong> <strong>of</strong> <strong>Manteca</strong>.
Table B-5<br />
<strong>City</strong> <strong>of</strong> <strong>Manteca</strong><br />
PFIP Water Fee<br />
Groundwater Supply<br />
Opinion <strong>of</strong> Probable Cost<br />
Water Treatment<br />
Treatment Cost $ 870,000<br />
Contingency 15% $ 130,500<br />
Total Water Treatment $ 1,000,000<br />
TOTAL WATER TREATMENT COST (See (1)) 76.5% $ 765,000<br />
(1) Based upon current ratio (13/17) <strong>of</strong> <strong>City</strong> wells requiring some form <strong>of</strong> treatment<br />
Source: <strong>City</strong> <strong>of</strong> <strong>Manteca</strong>.
Table B-6<br />
<strong>City</strong> <strong>of</strong> <strong>Manteca</strong><br />
PFIP Water Fee<br />
Peaking Costs & Summary<br />
1.0 mg Storage Tank and Booster Pump<br />
Peaking Capacity, GPM 5,000<br />
EDU Served at 0.474 gpm, 2.8 PF, 15% Redundancy 3,280<br />
1.0 mg Storage Tank and Booster Pump Cost $ 2,751,000<br />
CONSTRUCTION COST<br />
Site Prep. Clearing and Grubbing $5,000<br />
Excavation, Shoring, Import and Earthwork $50,000<br />
Paving and Site Work $200,000<br />
Yard Piping and Appurtenances $150,000<br />
Booster Pump and Control Building $200,000<br />
Booster Pump Electrical $100,000<br />
Standby Generator $120,000<br />
SCADA $25,000<br />
Tank $1,000,000<br />
Subtotal $1,850,000<br />
Site Acquisition $350,000<br />
2 Acres @ 4$/SF<br />
Mobilization 5% $92,500<br />
Contingency 10% $185,000<br />
Total Construction Cost $2,478,000<br />
SOFT COSTS<br />
Environmental/<strong>Plan</strong>ning 2% $49,560<br />
Design 5% $123,900<br />
Construction Management/Engineering 4% $99,120<br />
Subtotal S<strong>of</strong>t Costs $273,000<br />
TOTAL TANK AND BOOSTER PUMP $2,751,000<br />
Source: <strong>City</strong> <strong>of</strong> <strong>Manteca</strong>.
Table B-7<br />
<strong>City</strong> <strong>of</strong> <strong>Manteca</strong><br />
PFIP Water Fee<br />
Distribution System Summary<br />
Reimbursement<br />
Item Length Rate ($/LF) Total Cost<br />
12" pipe - Main Grid 270,000<br />
16"-18" pipe - Main Grid 30,000<br />
12" Pipe - interior 150,000<br />
$ 58.65 $15,835,500<br />
$ 82.20 $2,466,000<br />
$ 17.25 $2,587,500<br />
Sub Total Distribution System $20,889,000<br />
Administrative Costs 0.0% $0<br />
TOTAL DISTRIBUTION SYSTEM COST $20,889,000<br />
Total number <strong>of</strong> EDUs supported (Total Sewer EDUs) 49,377<br />
Source: <strong>City</strong> <strong>of</strong> <strong>Manteca</strong>.
Table B-8<br />
<strong>City</strong> <strong>of</strong> <strong>Manteca</strong><br />
PFIP Water Fee<br />
Distribution System Costs<br />
Concept: LF Miles<br />
Total Future Pipe to be Installed 450,000 85<br />
Main - one mile grid - for oversizing only, same as internal grid 67% 300,000 57<br />
Interior grid - oversize reimbursement only 33% 150,000 28<br />
Typical Costs to Install 8" Water Main Amount<br />
Unit Price<br />
($/unit) $<br />
8" PVC Pipe - complete in place 1,000 18 $ 18,000<br />
Gate Valves 3 1,500 $ 4,500<br />
Hydrant Assembly 3 3,500 $ 10,500<br />
Air Release Valves 1 3,000 $ 3,000<br />
$ 36,000<br />
Cost / LF with 5% contingency & 10% s<strong>of</strong>t costs $ 41.40<br />
Typical Costs to Install 12" Water Main Amount<br />
Unit Price<br />
($/unit) $<br />
12" PVC Pipe - complete in place 1,000 30 $ 30,000<br />
Gate Valves 3 2,500 $ 7,500<br />
Hydrant Assembly 3 3,500 $ 10,500<br />
Air Release Valves 1 3,000 $ 3,000<br />
$ 51,000<br />
Cost / LF with 5% contingency & 10% s<strong>of</strong>t costs $ 58.65<br />
Typical Costs to Install 16" or 18" Water Main Amount<br />
Unit Price<br />
($/unit) $<br />
16" PVC Pipe - complete in place 1,000 46 $ 46,000<br />
Butterfly Valves 3 3,000 $ 9,000<br />
Hydrant Assembly 3 3,500 $ 10,500<br />
Air Release Valves 1 3,000 $ 3,000<br />
$ 68,500<br />
Cost / LF with 10% contingency & 10% s<strong>of</strong>t costs $ 82.20<br />
SOFT COSTS - Water Line only 10%<br />
Environmental - 2%, Design - 4%, Construction Management - 4%
Table B-9<br />
<strong>City</strong> <strong>of</strong> <strong>Manteca</strong><br />
PFIP Water Fee<br />
Financing Assumptions<br />
Description Amount<br />
Annual Interest Rate 2.00%<br />
Term - Years 30<br />
Payments per year 1<br />
Loan Constant - Annual Debt Service (per $1,000) $44.65<br />
Annual Finance Cost (per $1,000) $11.32<br />
Source: <strong>City</strong> <strong>of</strong> <strong>Manteca</strong>.<br />
Notes: Annual Finance Cost (per $1,000) = Loan constant at 2% - Loan Constant at 0%
ZONE 12<br />
LEGEND<br />
WATER FEE ZONE 12
Appendix C<br />
Storm Drainage Data
Table C-1<br />
<strong>City</strong> <strong>of</strong> <strong>Manteca</strong><br />
PFIP Storm Drainage Collection Fee<br />
Storm Drainage Fee Calculation Summary<br />
Zone 30 Zone 32 Zone 34 Zone 36 Zone 39<br />
Cost (31+32) Cost (33+34+35) Cost Cost Cost Source/<br />
Description Estimate Estimate Estimate Estimate Estimate Totals Notes<br />
PROJECT CONSTRUCTION COSTS<br />
Capital Improvements <strong>Plan</strong><br />
Current Projects -<br />
Future Projects 348,984<br />
Total Master <strong>Plan</strong> CIP (July 2010 $) 348,984<br />
S<strong>of</strong>t Costs (12% <strong>of</strong> Construction Costs) 41,878<br />
Inflation Adjustment to 2012 $ 21,214<br />
-<br />
2,219,860<br />
2,219,860<br />
266,383<br />
134,939<br />
-<br />
1,465,928<br />
1,465,928<br />
175,911<br />
89,109<br />
-<br />
7,282,301<br />
7,282,301<br />
873,876<br />
442,669<br />
-<br />
1,540,000<br />
1,540,000<br />
184,800<br />
93,612<br />
-<br />
12,857,074 Table C-4<br />
12,857,074<br />
1,542,849<br />
781,543<br />
Total PFIP CIP 412,076 2,621,182 1,730,949 8,598,847 1,818,412 15,181,465<br />
% <strong>of</strong> PFIP CIP 2.7% 17.3% 11.4% 56.6% 12.0% 100.0%<br />
See Note (4)<br />
See Note (1)<br />
FINANCING COSTS<br />
Total PFIP CIP 139,899 889,885 587,653 2,919,288 617,347 5,154,072 See Note (3)<br />
Total Estimated Financing Costs 139,899 889,885 587,653 2,919,288 617,347 5,154,072<br />
Finance Cost % <strong>of</strong> CIP 33.9% 33.9% 33.9% 33.9% 33.9% 33.9%<br />
PFIP ADMINISTRATION COSTS<br />
Program <strong>Update</strong>s and On-Going Admin 75,046<br />
<strong>City</strong> Administrative Costs - Variable -<br />
Total PFIP Admin Costs 75,046<br />
FUND BALANCES<br />
Net Fund Balance (Deficit) -<br />
Fees From Remaining PFIP Development -<br />
Total Fund Balances -<br />
Net Costs Funded From PFIP Fee 627,021<br />
Total Development Units (Acres x C) 796<br />
477,363<br />
-<br />
477,363<br />
(678,937)<br />
-<br />
(678,937)<br />
4,667,368<br />
315,236<br />
-<br />
315,236<br />
(486,480)<br />
-<br />
(486,480)<br />
3,120,318<br />
1,566,002<br />
-<br />
1,566,002<br />
(2,236,041)<br />
-<br />
(2,236,041)<br />
15,320,178<br />
331,165<br />
-<br />
331,165<br />
-<br />
-<br />
-<br />
2,766,923<br />
Fee Per Development Unit ($/Acres x C) $ 787 $ 9,521 $ 5,987 $ 14,590 $ 5,990<br />
Notes:<br />
(1) CIP costs based on July 2010 ENR (8844) were adjusted to July 2012 ENR (9324).<br />
(2) Assumes entire cost <strong>of</strong> current projects funded by 30 year debt service with 2.0% interest.<br />
(3) Assumes 100% <strong>of</strong> PFIP CIP costs are financed, see Table C-6 for financing assumptions.<br />
(4) Contingency estimate <strong>of</strong> 10% included in construction cost estimates, 12% s<strong>of</strong>t cost estimate from <strong>City</strong> <strong>of</strong> <strong>Manteca</strong>.<br />
(5) <strong>City</strong> Administrative Costs - Variable assumed to be 0.0% <strong>of</strong> PFIP CIP costs.<br />
490<br />
521<br />
1,050<br />
462<br />
2,764,813 See Appendix F<br />
-<br />
2,764,813<br />
See Note (5)<br />
(3,401,458) June 30, 2012 Balance<br />
-<br />
(3,401,458)<br />
26,501,808<br />
3,320
Table C-2<br />
<strong>City</strong> <strong>of</strong> <strong>Manteca</strong><br />
PFIP Storm Drainage Collection Fee<br />
Fee Summary<br />
Land Use Units<br />
C per<br />
Gross<br />
Acre Zone 30<br />
Zone 32<br />
(31+32)<br />
Zone 34<br />
(33+34+35) Zone 36 Zone 39 Units<br />
(Acres x C) $ 787 $ 9,521 $ 5,987 $ 14,590 $ 5,990<br />
VLDR Acre 0.30<br />
LDR Acre 0.30<br />
MDR Acre 0.50<br />
HDR Acre 0.65<br />
OS Acre -<br />
P Acre -<br />
PQP Acre -<br />
AG (LDR) Acre 0.30<br />
BP Acre 0.90<br />
CMU Acre 0.90<br />
GC Acre 0.90<br />
NC Acre 0.90<br />
HI Acre 0.70<br />
LI Acre 0.70<br />
BIP Acre 0.70<br />
UR Acre 0.30<br />
UR-VLDR Acre 0.30<br />
UR-LDR Acre 0.30<br />
UR-MDR Acre 0.50<br />
UR-P Acre -<br />
UR-PQP Acre -<br />
UR-AG (LDR) Acre 0.30<br />
UR-BIP Acre 0.70<br />
UR-CMU Acre 0.90<br />
UR-GC Acre 0.90<br />
UR-LI Acre 0.70<br />
Fee Per Acre Fee Per Unit<br />
Dwelling Unit 2.00<br />
Dwelling Unit 5.00<br />
$ 394 $ 4,760 $ 2,994 $ 7,295 $ 2,995 Dwelling Unit<br />
$ 512 $ 6,189 $ 3,892 $ 9,483 $ 3,894 Dwelling Unit<br />
$ - $ - $ - $ - $ -<br />
Acre<br />
$ - $ - $ - $ - $ -<br />
Acre<br />
$ - $ - $ - $ - $ -<br />
Acre<br />
Dwelling Unit 5.00<br />
$ 709 $ 8,569 $ 5,389 $ 13,131 $ 5,391 Acre<br />
$ 709 $ 8,569 $ 5,389 $ 13,131 $ 5,391 Acre<br />
$ 709 $ 8,569 $ 5,389 $ 13,131 $ 5,391 Acre<br />
$ 709 $ 8,569 $ 5,389 $ 13,131 $ 5,391 Acre<br />
$ 551 $ 6,665 $ 4,191 $ 10,213 $ 4,193 Acre<br />
$ 551 $ 6,665 $ 4,191 $ 10,213 $ 4,193 Acre<br />
$ 551 $ 6,665 $ 4,191 $ 10,213 $ 4,193 Acre<br />
$ 236 $ 2,856 $ 1,796 $ 4,377 $ 1,797 Dwelling Unit<br />
Dwelling Unit 2.00<br />
Dwelling Unit 5.00<br />
$ 394 $ 4,760 $ 2,994 $ 7,295 $ 2,995 Dwelling Unit<br />
$ - $ - $ - $ - $ -<br />
Acre<br />
$ - $ - $ - $ - $ -<br />
Acre<br />
Dwelling Unit 5.00<br />
$ 551 $ 6,665 $ 4,191 $ 10,213 $ 4,193 Acre<br />
$ 709 $ 8,569 $ 5,389 $ 13,131 $ 5,391 Acre<br />
$ 709 $ 8,569 $ 5,389 $ 13,131 $ 5,391 Acre<br />
$ 551 $ 6,665 $ 4,191 $ 10,213 $ 4,193 Acre<br />
Units Per<br />
Acre Zone 30<br />
Zone 32<br />
(31+32)<br />
Zone 34<br />
(33+34+35) Zone 36 Zone 39<br />
$ 118 $ 1,428 $ 898 $ 2,188 $ 899<br />
$ 47 $ 571 $ 359 $ 875 $ 359<br />
$ 47 $ 571 $ 359 $ 875 $ 359<br />
$ 118 $ 1,428 $ 898 $ 2,188 $ 899<br />
$ 47 $ 571 $ 359 $ 875 $ 359<br />
$ 47 $ 571 $ 359 $ 875 $ 359
Table C-3<br />
<strong>City</strong> <strong>of</strong> <strong>Manteca</strong><br />
PFIP Storm Drainage Collection Fee<br />
EDU Calculation<br />
Land Use Units<br />
C per<br />
Gross Acre<br />
VLDR Acre 0.3000<br />
LDR Acre 0.3000<br />
MDR Acre 0.5000<br />
HDR Acre 0.6500<br />
OS Acre 0.1000<br />
P Acre 0.1000<br />
PQP Acre 0.1000<br />
AG (LDR) Acre 0.3000<br />
BP Acre 0.9000<br />
CMU Acre 0.9000<br />
GC Acre 0.9000<br />
NC Acre 0.9000<br />
HI Acre 0.7000<br />
LI Acre 0.7000<br />
BIP Acre 0.7000<br />
UR Acre 0.3000<br />
UR-VLDR Acre 0.3000<br />
UR-LDR Acre 0.3000<br />
UR-MDR Acre 0.5000<br />
UR-P Acre 0.1000<br />
UR-PQP Acre 0.1000<br />
UR-AG (LDR) Acre 0.3000<br />
UR-BIP Acre 0.7000<br />
UR-CMU Acre 0.9000<br />
UR-GC Acre 0.9000<br />
UR-LI Acre 0.7000<br />
Source: <strong>City</strong> <strong>of</strong> <strong>Manteca</strong>.<br />
EDU Factor Per Acre<br />
EDU<br />
Factor<br />
Per Unit Units<br />
1.00<br />
1.00<br />
1.67<br />
2.17<br />
-<br />
-<br />
-<br />
1.00<br />
3.00<br />
3.00<br />
3.00<br />
3.00<br />
2.33<br />
2.33<br />
2.33<br />
1.00<br />
1.00<br />
1.00<br />
1.67<br />
-<br />
-<br />
1.00<br />
2.33<br />
3.00<br />
3.00<br />
2.33<br />
Units<br />
Per Acre<br />
Dwelling Unit 2.00<br />
Dwelling Unit 5.00<br />
Dwelling Unit 9.00<br />
Dwelling Unit 17.00<br />
Acre 1.00<br />
Acre 1.00<br />
Acre 1.00<br />
Dwelling Unit 5.00<br />
Acre 1.00<br />
Acre 1.00<br />
Acre 1.00<br />
Acre 1.00<br />
Acre 1.00<br />
Acre 1.00<br />
Acre 1.00<br />
Dwelling Unit 5.00<br />
Dwelling Unit 2.00<br />
Dwelling Unit 5.00<br />
Dwelling Unit 9.00<br />
Acre 1.00<br />
Acre 1.00<br />
Dwelling Unit 5.00<br />
Acre 1.00<br />
Acre 1.00<br />
Acre 1.00<br />
Acre 1.00<br />
EDU Factor Per Unit<br />
C per<br />
Unit<br />
0.1500<br />
0.0600<br />
0.0556<br />
0.0382<br />
0.1000<br />
0.1000<br />
0.1000<br />
0.0600<br />
0.9000<br />
0.9000<br />
0.9000<br />
0.9000<br />
0.7000<br />
0.7000<br />
0.7000<br />
0.0600<br />
0.1500<br />
0.0600<br />
0.0556<br />
0.1000<br />
0.1000<br />
0.0600<br />
0.7000<br />
0.9000<br />
0.9000<br />
0.7000<br />
EDU<br />
Factor Per<br />
Unit<br />
2.50<br />
1.00<br />
0.93<br />
0.64<br />
-<br />
-<br />
-<br />
1.00<br />
15.00<br />
15.00<br />
15.00<br />
15.00<br />
11.67<br />
11.67<br />
11.67<br />
1.00<br />
2.50<br />
1.00<br />
0.93<br />
-<br />
-<br />
1.00<br />
11.67<br />
15.00<br />
15.00<br />
11.67
Table C-4<br />
<strong>City</strong> <strong>of</strong> <strong>Manteca</strong><br />
PFIP Storm Drainage Collection Fee<br />
Project Cost Summary<br />
Zone Zone Zone Zone Zone Zone Zone Zone<br />
Project Number Project Name 30 31 32 33 34 35 36 39 Totals Source / Notes<br />
Total Development EDUs Developed in Each Zone 13,271.5<br />
FCOC 1 French Camp Road Crossing 13,271.5 3,089.3 5,081.1 2,349.3 2,344.6 3,991.8 17,501.1<br />
FCOC 2 Roth Road Crossing 3,089.3 5,081.1 2,349.3 2,344.6 3,991.8 17,501.1<br />
FCOC 3 Union Pacific Railroad Crossing 2,349.3 2,344.6 3,991.8 17,501.1<br />
FCOC 4 Farm Road Crossing (4'x8' Box Culvert) 3,991.8 17,501.1<br />
Drain 3A Connect DR3A to Lat Rga (48" & 2,000') 3,089.3<br />
Drain 3 Monterey Place Improvement 5,081.1<br />
Drain 5 Interceptor, Upstream <strong>of</strong> Golf Course 2,344.6<br />
South PS South Drain Pump Station 17,501.1<br />
Austin PS Austin Road Pump Station (to Lat Y) 17,501.1<br />
Force Main 48" Force Main (1,400') 17,501.1<br />
66" RCP1 Bella Vista to South Pump Station 17,501.1<br />
Lat Ya Dual-Use Drain at Woodward (60" RCP) 17,501.1<br />
66" RCP2 Woodward - Union to Main St 17,501.1<br />
42" RCP Lat Tbb to Austin Rd End 17,501.1<br />
Jux Box Two Junction Boxes at Woodward-Ya 17,501.1<br />
Lat X Connect Woodward to Lateral X 17,501.1<br />
Trails <strong>of</strong> <strong>Manteca</strong><br />
South Pump Station 7,698.2<br />
Zone Zone Zone Zone Zone Zone Zone Zone<br />
Project Number Project Name 30 31 32 33 34 35 36 39 Totals<br />
FCOC 1 French Camp Road Crossing 28% 6% 11% 5% 5% 8% 37% 100%<br />
FCOC 2 Roth Road Crossing -<br />
9% 15% 7% 7% 12% 51% 100%<br />
FCOC 3 Union Pacific Railroad Crossing -<br />
-<br />
-<br />
9% 9% 15% 67% 100%<br />
FCOC 4 Farm Road Crossing (4'x8' Box Culvert) -<br />
-<br />
-<br />
-<br />
-<br />
19% 81% 100%<br />
Drain 3A Connect DR3A to Lat Rga (48" & 2,000') -<br />
100% -<br />
-<br />
-<br />
-<br />
-<br />
100%<br />
Drain 3 Monterey Place Improvement -<br />
-<br />
100% -<br />
-<br />
-<br />
-<br />
100%<br />
Drain 5 Interceptor, Upstream <strong>of</strong> Golf Course -<br />
-<br />
-<br />
-<br />
100% -<br />
-<br />
100%<br />
South PS South Drain Pump Station -<br />
-<br />
-<br />
-<br />
-<br />
-<br />
100% 100%<br />
Austin PS Austin Road Pump Station (to Lat Y) -<br />
-<br />
-<br />
-<br />
-<br />
-<br />
100% 100%<br />
Force Main 48" Force Main (1,400') -<br />
-<br />
-<br />
-<br />
-<br />
-<br />
100% 100%<br />
66" RCP1 Bella Vista to South Pump Station -<br />
-<br />
-<br />
-<br />
-<br />
-<br />
100% 100%<br />
Lat Ya Dual-Use Drain at Woodward (60" RCP) -<br />
-<br />
-<br />
-<br />
-<br />
-<br />
100% 100%<br />
66" RCP2 Woodward - Union to Main St -<br />
-<br />
-<br />
-<br />
-<br />
-<br />
100% 100%<br />
42" RCP Lat Tbb to Austin Rd End -<br />
-<br />
-<br />
-<br />
-<br />
-<br />
100% 100%<br />
Jux Box Two Junction Boxes at Woodward-Ya -<br />
-<br />
-<br />
-<br />
-<br />
-<br />
100% 100%<br />
Lat X Connect Woodward to Lateral X -<br />
-<br />
-<br />
-<br />
-<br />
-<br />
100% 100%<br />
Trails <strong>of</strong> <strong>Manteca</strong><br />
South Pump Station -<br />
3,089.3<br />
-<br />
5,081.1<br />
-<br />
2,349.3<br />
-<br />
2,344.6<br />
-<br />
3,991.8<br />
-<br />
17,501.1<br />
-<br />
7,698.2<br />
55,326.9<br />
47,628.7<br />
34,357.2<br />
26,186.8<br />
21,493.0<br />
3,089.3<br />
5,081.1<br />
2,344.6<br />
17,501.1<br />
17,501.1<br />
17,501.1<br />
17,501.1<br />
17,501.1<br />
17,501.1<br />
17,501.1<br />
17,501.1<br />
17,501.1<br />
7,698.2<br />
100% 100%<br />
Cost Allocation <strong>of</strong> <strong>Manteca</strong> Cost Share to Drainage Zones<br />
<strong>City</strong> <strong>of</strong><br />
<strong>Manteca</strong> Zone Zone Zone Zone Zone Zone Zone Zone<br />
Project Number Project Name Project Cost SSJID Share PFIP Cost 30 31 32 33 34 35 36 39 Totals<br />
FCOC 1<br />
Crossings<br />
French Camp Road Crossing $ 1,500,000 $ 750,000 $ 750,000 $ 208,984 $ 48,646 $ 80,011 $ 36,994 $ 36,919 $ 62,859 $ 275,587<br />
$ 750,000 Future Improve<br />
FCOC 2 Roth Road Crossing $ 1,000,000 $ 500,000 $ 500,000<br />
$ 44,958 $ 73,945 $ 34,189 $ 34,120 $ 58,093 $ 254,694<br />
$ 500,000 Future Improve<br />
FCOC 3 Union Pacific Railroad Crossing $ 850,000 $ 425,000 $ 425,000<br />
$ 38,128 $ 38,051 $ 64,786 $ 284,035<br />
$ 425,000 Future Improve<br />
FCOC 4 Farm Road Crossing (4'x8' Box Culvert) $ 450,000 $ 225,000 $ 225,000<br />
$ 41,789 $ 183,211<br />
$ 225,000 Future Improve<br />
Drain 3A Connect DR3A to Lat Rga (48" & 2,000') $ 600,000 $ 300,000 $ 300,000<br />
$ 300,000<br />
$ 300,000 Future Improve<br />
Drain 3 Monterey Place Improvement $ 400,000 $ - $ 400,000<br />
$ 400,000<br />
$ 400,000 Future Improve<br />
Drain 5 Interceptor, Upstream <strong>of</strong> Golf Course $ 700,000 $ - $ 700,000<br />
$ 700,000<br />
$ 700,000 Future Improve<br />
$ 5,500,000 $ 2,200,000 $ 3,300,000 $ 208,984 $ 393,604 $ 553,956 $ 109,311 $ 809,090 $ 227,527 $ 997,528 $ - $ 3,300,000<br />
South PS<br />
Pump Stations - South Levee<br />
South Drain Pump Station $ 1,250,000 $ - $ 1,250,000<br />
$ 1,250,000<br />
$ 1,250,000 South & Levee<br />
Austin PS Austin Road Pump Station (to Lat Y) $ 500,000 $ - $ 500,000<br />
$ 500,000<br />
$ 500,000 South & Levee<br />
Total Pump Stations $ 1,750,000 $ - $ 1,750,000 $ - $ - $ - $ - $ - $ - $ 1,750,000 $ - $ 1,750,000<br />
Force Main<br />
New Pipes - South & Levee<br />
48" Force Main (1,400') $ 408,000 $ - $ 408,000<br />
$ 408,000<br />
$ 408,000 Future Improve<br />
66" RCP1 Bella Vista to South Pump Station $ 724,500 $ - $ 724,500<br />
$ 724,500<br />
$ 724,500 Future Improve<br />
Lat Ya Dual-Use Drain at Woodward (60" RCP) $ - $ - $ -<br />
$ -<br />
$ - Future Improve<br />
66" RCP2 Woodward - Union to Main St $ 1,459,774 $ - $ 1,459,774<br />
$ 1,459,774<br />
$ 1,459,774 Future Improve<br />
42" RCP Lat Tbb to Austin Rd End $ 1,160,000 $ - $ 1,160,000<br />
$ 1,160,000<br />
$ 1,160,000 Future Improve<br />
Jux Box Two Junction Boxes at Woodward-Ya $ 150,000 $ - $ 150,000<br />
$ 150,000<br />
$ 150,000 Future Improve<br />
Lat X Connect Woodward to Lateral X $ 825,000 $ 412,500 $ 412,500<br />
$ 412,500<br />
$ 412,500 Future Improve<br />
Total New Pipes $ 4,727,274 $ 412,500 $ 4,314,774 $ - $ - $ - $ - $ - $ - $ 4,314,774 $ - $ 4,314,774<br />
Monitor<br />
Monitoring Wells<br />
20 Monitoring Wells (Zone 35 does not tie) $ 800,000 $ - $ 800,000 $ 80,000 $ 80,000 $ 120,000 $ 80,000 $ 80,000 $ 160,000 $ 160,000 $ 40,000 $ 800,000 Levee & Monitor<br />
Sub-Total $ 12,777,274 $ 2,612,500 $ 10,164,774 $ 288,984 $ 473,604 $ 673,956 $ 189,311 $ 889,090 $ 387,527 $ 7,222,301 $ 40,000 $ 10,164,774<br />
Trails <strong>of</strong> <strong>Manteca</strong><br />
South Pump Station $ 1,500,000 $ - $ 1,500,000<br />
$ 1,500,000 $ 1,500,000 Trails<br />
Sub-Total $ 1,500,000 $ - $ 1,500,000 $ - $ - $ - $ - $ - $ - $ - $ 1,500,000 $ 1,500,000<br />
Phase I<br />
North Drainage System<br />
Lateral Rga C to D $ 1,012,300 $ - $ 1,012,300<br />
$ 1,012,300<br />
$ 1,012,300 North<br />
Sub-Total $ 1,012,300 $ - $ 1,012,300 $ - $ 1,012,300 $ - $ - $ - $ - $ - $ - $ 1,012,300<br />
Oversizing Reimbursement (Note (2)) $ 180,000 $ - $ 180,000 $ 60,000 $ - $ 60,000 $ - $ - $ - $ 60,000 $ - $ 180,000<br />
Total $ 15,469,574 $ 2,612,500 $ 12,857,074 $ 348,984 $ 1,485,904 $ 733,956 $ 189,311 $ 889,090 $ 387,527 $ 7,282,301 $ 1,540,000 $ 12,857,074<br />
Notes:<br />
(1) For the monitoring wells zone 35 includes costs for zone 37 + 38<br />
(2) Reimbursement for upsizing from 36" to 42" based on 3,000 ft. at $20 lf.<br />
Expected Development (EDUs)<br />
Percentage Allocation <strong>of</strong> <strong>Manteca</strong> Cost Share to Drainage Zones<br />
Table C-5
Table C-5<br />
<strong>City</strong> <strong>of</strong> <strong>Manteca</strong><br />
PFIP Storm Drainage Collection Fee<br />
Development Summary<br />
Vacant Land Summary - Acres Percent <strong>of</strong> Vacant Land Assumed to Develop Vacant Land Assumed to Develop (Acres) Land Developed (Acres) x C<br />
Zone Zone Zone Zone Zone Zone Zone Zone Zone Zone Zone Zone Zone Zone Zone Zone Zone Zone Zone Zone Zone Zone Zone Zone Zone Zone Zone Zone Zone Zone Zone Zone<br />
Land Use 30 31 32 33 34 35 36 39 30 31 32 33 34 35 36 39 30 31 32 33 34 35 36 39 C 30 31 32 33 34 35 36 39<br />
AG (LDR) 3,273.27<br />
BIP -<br />
BP -<br />
CMU -<br />
GC -<br />
HDR -<br />
HI 95.53<br />
LDR 443.23<br />
LI 225.26<br />
MDR -<br />
NC -<br />
OS -<br />
P 8.20<br />
PQP 43.82<br />
UR -<br />
UR-AG (LDR) 851.65<br />
UR-BIP -<br />
UR-CMU -<br />
UR-GC -<br />
UR-LDR -<br />
UR-LI 114.45<br />
UR-MDR -<br />
UR-P -<br />
UR-PQP -<br />
UR-VLDR -<br />
VLDR 105.79<br />
Total 5,161.19<br />
111.62<br />
-<br />
-<br />
18.22<br />
17.02<br />
-<br />
-<br />
108.87<br />
-<br />
-<br />
-<br />
14.81<br />
5.89<br />
112.52<br />
340.85<br />
255.34<br />
-<br />
43.06<br />
40.43<br />
675.66<br />
-<br />
19.74<br />
33.54<br />
11.65<br />
352.59<br />
25.82<br />
2,187.64<br />
-<br />
-<br />
-<br />
53.05<br />
23.06<br />
39.83<br />
-<br />
426.00<br />
137.93<br />
8.29<br />
10.90<br />
0.99<br />
26.42<br />
-<br />
237.68<br />
47.57<br />
-<br />
-<br />
-<br />
78.71<br />
-<br />
-<br />
4.01<br />
-<br />
-<br />
3.14<br />
1,097.59<br />
-<br />
-<br />
-<br />
0.83<br />
0.89<br />
-<br />
72.68<br />
21.50<br />
139.40<br />
16.44<br />
1.28<br />
-<br />
-<br />
-<br />
-<br />
-<br />
-<br />
-<br />
-<br />
-<br />
-<br />
-<br />
-<br />
-<br />
-<br />
-<br />
253.03<br />
-<br />
-<br />
1.00<br />
33.70<br />
17.53<br />
20.74<br />
-<br />
184.09<br />
4.55<br />
51.28<br />
23.29<br />
-<br />
14.21<br />
0.83<br />
-<br />
-<br />
-<br />
-<br />
-<br />
-<br />
-<br />
-<br />
-<br />
-<br />
-<br />
-<br />
351.22<br />
-<br />
-<br />
-<br />
53.39<br />
38.64<br />
-<br />
26.07<br />
11.44<br />
239.30<br />
-<br />
10.85<br />
-<br />
-<br />
51.60<br />
-<br />
-<br />
-<br />
-<br />
-<br />
-<br />
-<br />
-<br />
-<br />
-<br />
-<br />
-<br />
431.28<br />
116.47<br />
-<br />
-<br />
46.85<br />
90.71<br />
45.84<br />
290.72<br />
1,659.58<br />
3.94<br />
76.28<br />
9.84<br />
-<br />
40.05<br />
7.24<br />
1,130.58<br />
459.19<br />
338.70<br />
273.28<br />
-<br />
481.46<br />
-<br />
-<br />
29.96<br />
-<br />
99.22<br />
524.76<br />
5,724.68<br />
191.43<br />
179.98<br />
-<br />
23.41<br />
103.69<br />
20.85<br />
-<br />
546.73<br />
-<br />
66.40<br />
-<br />
428.96<br />
-<br />
-<br />
-<br />
-<br />
70.00<br />
98.81<br />
-<br />
145.52<br />
-<br />
-<br />
-<br />
-<br />
294.82<br />
-<br />
2,170.61<br />
42.5% 42.5% - - - - 42.5% 42.5% 1,391.14<br />
- - - - - - - 85.0% -<br />
- - - - 85.0% - - -<br />
-<br />
- 85.0% 85.0% 85.0% 85.0% 85.0% 85.0% 85.0% -<br />
- 85.0% 85.0% 85.0% 85.0% 85.0% 85.0% 85.0% -<br />
- - 85.0% - 85.0% - 85.0% 85.0% -<br />
85.0% - - 85.0% 85.0% 85.0% 85.0% -<br />
81.20<br />
85.0% 85% 85.0% 85.0% 85.0% 85.0% 85.0% 85.0% 376.74<br />
85.0% - 85.0% 85.0% 85.0% 85.0% 85.0% -<br />
191.47<br />
- - 85.0% 85.0% 85.0% - 85.0% 85% -<br />
- - 85.0% 85.0% 85.0% 85.0% 85.0% -<br />
-<br />
- 85.0% 85.0% - - - - 85% -<br />
85.0% 85.0% 85.0% - 85.0% - 85.0% -<br />
6.97<br />
85.0% 85.0% - - 85.0% 85.0% 85.0% -<br />
37.25<br />
- 20.0% 20.0% - - - 20.0% -<br />
-<br />
20.0% 20.0% 20.0% - - - 20.0% -<br />
170.33<br />
- - - - - - 20.0% 20% -<br />
- 20.0% - - - - 20.0% 20% -<br />
- 20.0% - - - - - -<br />
-<br />
- 20.0% 20.0% - - - 20.0% 20% -<br />
20.0% - - - - - - -<br />
22.89<br />
- 20.0% - - - - - -<br />
-<br />
- 20.0% 20.0% - - - 20.0% -<br />
-<br />
- 20.0% - - - - - -<br />
-<br />
- 20.0% - - - - 20.0% 20% -<br />
25.0% 25.0% 25.0% - - - 25.0% -<br />
26.45<br />
2,304.44<br />
47.44<br />
-<br />
-<br />
15.48<br />
14.47<br />
-<br />
-<br />
92.54<br />
-<br />
-<br />
-<br />
12.59<br />
5.00<br />
95.64<br />
68.17<br />
51.07<br />
-<br />
8.61<br />
8.09<br />
135.13<br />
-<br />
3.95<br />
6.71<br />
2.33<br />
70.52<br />
6.46<br />
644.19<br />
-<br />
-<br />
-<br />
45.09<br />
19.60<br />
33.85<br />
-<br />
362.10<br />
117.24<br />
7.05<br />
9.27<br />
0.84<br />
22.45<br />
-<br />
47.54<br />
9.51<br />
-<br />
-<br />
-<br />
15.74<br />
-<br />
-<br />
0.80<br />
-<br />
-<br />
0.78<br />
691.88<br />
-<br />
-<br />
-<br />
0.71<br />
0.76<br />
-<br />
61.78<br />
18.27<br />
118.49<br />
13.97<br />
1.09<br />
-<br />
-<br />
-<br />
-<br />
-<br />
-<br />
-<br />
-<br />
-<br />
-<br />
-<br />
-<br />
-<br />
-<br />
-<br />
215.07<br />
-<br />
-<br />
0.85<br />
28.64<br />
14.90<br />
17.63<br />
-<br />
156.48<br />
3.87<br />
43.58<br />
19.80<br />
-<br />
12.08<br />
0.71<br />
-<br />
-<br />
-<br />
-<br />
-<br />
-<br />
-<br />
-<br />
-<br />
-<br />
-<br />
-<br />
298.54<br />
-<br />
-<br />
-<br />
45.38<br />
32.85<br />
-<br />
22.16<br />
9.72<br />
203.40<br />
-<br />
9.22<br />
-<br />
-<br />
43.86<br />
-<br />
-<br />
-<br />
-<br />
-<br />
-<br />
-<br />
-<br />
-<br />
-<br />
-<br />
-<br />
366.59<br />
49.50<br />
-<br />
-<br />
39.82<br />
77.11<br />
38.97<br />
247.12<br />
1,410.64<br />
3.34<br />
64.84<br />
8.36<br />
-<br />
34.04<br />
6.16<br />
226.12<br />
91.84<br />
67.74<br />
54.66<br />
-<br />
96.29<br />
-<br />
-<br />
5.99<br />
-<br />
19.84<br />
131.19<br />
2,673.57<br />
81.36<br />
152.99<br />
-<br />
19.89<br />
88.14<br />
17.72<br />
-<br />
464.72<br />
-<br />
56.44<br />
-<br />
364.61<br />
-<br />
-<br />
-<br />
-<br />
14.00<br />
19.76<br />
-<br />
29.10<br />
-<br />
-<br />
-<br />
-<br />
58.96<br />
-<br />
1,367.71<br />
0.3000<br />
0.7000<br />
0.9000<br />
0.9000<br />
0.9000<br />
0.6500<br />
0.7000<br />
0.3000<br />
0.7000<br />
0.5000<br />
0.9000<br />
-<br />
-<br />
-<br />
0.3000<br />
0.3000<br />
0.7000<br />
0.9000<br />
0.9000<br />
0.3000<br />
0.7000<br />
0.5000<br />
-<br />
-<br />
0.3000<br />
0.3000<br />
417.34<br />
-<br />
-<br />
-<br />
-<br />
-<br />
56.84<br />
113.02<br />
134.03<br />
-<br />
-<br />
-<br />
-<br />
-<br />
-<br />
51.10<br />
-<br />
-<br />
-<br />
-<br />
16.02<br />
-<br />
-<br />
-<br />
-<br />
7.93<br />
14.23<br />
-<br />
-<br />
13.93<br />
13.02<br />
-<br />
-<br />
27.76<br />
-<br />
-<br />
-<br />
-<br />
-<br />
-<br />
20.45<br />
15.32<br />
-<br />
7.75<br />
7.28<br />
40.54<br />
-<br />
1.97<br />
-<br />
-<br />
21.16<br />
1.94<br />
-<br />
-<br />
-<br />
40.58<br />
17.64<br />
22.00<br />
-<br />
108.63<br />
82.07<br />
3.52<br />
8.34<br />
-<br />
-<br />
-<br />
14.26<br />
2.85<br />
-<br />
-<br />
-<br />
4.72<br />
-<br />
-<br />
-<br />
-<br />
-<br />
0.24<br />
-<br />
-<br />
-<br />
0.64<br />
0.68<br />
-<br />
43.25<br />
5.48<br />
82.94<br />
6.99<br />
0.98<br />
-<br />
-<br />
-<br />
-<br />
-<br />
-<br />
-<br />
-<br />
-<br />
-<br />
-<br />
-<br />
-<br />
-<br />
-<br />
-<br />
-<br />
0.77<br />
25.78<br />
13.41<br />
11.46<br />
-<br />
46.94<br />
2.71<br />
21.79<br />
17.82<br />
-<br />
-<br />
-<br />
-<br />
-<br />
-<br />
-<br />
-<br />
-<br />
-<br />
-<br />
-<br />
-<br />
-<br />
-<br />
-<br />
-<br />
-<br />
40.84<br />
29.56<br />
-<br />
15.51<br />
2.92<br />
142.38<br />
-<br />
8.30<br />
-<br />
-<br />
-<br />
-<br />
-<br />
-<br />
-<br />
-<br />
-<br />
-<br />
-<br />
-<br />
-<br />
-<br />
-<br />
14.85<br />
-<br />
-<br />
35.84<br />
69.40<br />
25.33<br />
172.98<br />
423.19<br />
2.34<br />
32.42<br />
7.53<br />
-<br />
-<br />
-<br />
67.84<br />
27.55<br />
47.42<br />
49.19<br />
-<br />
28.89<br />
-<br />
-<br />
-<br />
-<br />
5.95<br />
39.36<br />
24.41<br />
107.09<br />
-<br />
17.91<br />
79.32<br />
11.52<br />
-<br />
139.42<br />
-<br />
28.22<br />
-<br />
-<br />
-<br />
-<br />
-<br />
-<br />
9.80<br />
17.79<br />
-<br />
8.73<br />
-<br />
-<br />
-<br />
-<br />
17.69<br />
-<br />
796.29 185.36 304.87 140.96 140.67 239.51 1,050.07 461.89<br />
24% 6% 9% 4% 4% 7% 32% 14%
Table C-6<br />
<strong>City</strong> <strong>of</strong> <strong>Manteca</strong><br />
PFIP Storm Drainage Collection Fee<br />
Financing Assumptions<br />
Description Amount<br />
Annual Interest Rate 2.00%<br />
Term - Years 30<br />
Payments per year 1<br />
Loan Constant - Annual Debt Service (per $1,000) $44.65<br />
Annual Finance Cost (per $1,000) $11.32<br />
Source: <strong>City</strong> <strong>of</strong> <strong>Manteca</strong>.<br />
Notes: Annual Finance Cost (per $1,000) = Loan constant at 2% - Loan Constant at 0%
ZONE 39<br />
ZONE 34<br />
ZONE 36<br />
ZONE 30<br />
ZONE 32<br />
LEGEND<br />
STORM DRAINAGE FEE ZONE 30<br />
STORM DRAINAGE FEE ZONE 32<br />
STORM DRAINAGE FEE ZONE 34<br />
STORM DRAINAGE FEE ZONE 36<br />
STORM DRAINAGE FEE ZONE 39
Appendix D<br />
Sewer Collection Data
Table D-1<br />
<strong>City</strong> <strong>of</strong> <strong>Manteca</strong><br />
PFIP Sewer Collection Fee<br />
Sewer Fee Calculation Summary<br />
Zone 21 Zone 22 Zone 24 Zone 25 Zone 26<br />
Cost Cost Cost Cost Cost Source/<br />
Description Estimate Estimate Estimate Estimate Estimate Totals Notes<br />
PROJECT CONSTRUCTION COSTS<br />
Capital Improvements <strong>Plan</strong><br />
Current Projects -<br />
Future Projects 2,085,337<br />
Total Master <strong>Plan</strong> CIP (July 2010 $) 2,085,337<br />
S<strong>of</strong>t Costs 166,827<br />
Inflation Adjustment to 2012 $ 122,234<br />
-<br />
17,048,343<br />
17,048,343<br />
1,472,067<br />
1,005,178<br />
-<br />
25,602,950<br />
25,602,950<br />
2,257,796<br />
1,512,116<br />
-<br />
2,643,490<br />
2,643,490<br />
258,879<br />
157,523<br />
-<br />
1,606,560<br />
1,606,560<br />
160,365<br />
95,898<br />
-<br />
48,986,680 See Table D-2 for details<br />
48,986,680<br />
4,315,934<br />
2,892,951<br />
Total PFIP CIP 2,374,398 19,525,589 29,372,862 3,059,893 1,862,823 56,195,565<br />
% <strong>of</strong> PFIP CIP 4.2% 34.7% 52.3% 5.4% 3.3% 100.0%<br />
FINANCING COSTS COSTS<br />
Total PFIP CIP<br />
Total Estimated Financing Costs 707,967 5,787,873 8,692,142 897,459 545,423<br />
Finance Cost % <strong>of</strong> CIP 707,967 5,787,873 8,692,142 897,459 545,423<br />
33.9% 33.9% 33.9% 33.9% 33.9%<br />
PFIP ADMINISTRATION COSTS<br />
Program <strong>Update</strong>s and On-Going Admin 141,015<br />
<strong>City</strong> Administrative Costs - Variable -<br />
Total PFIP Admin Costs 141,015<br />
FUND BALANCES<br />
Net Fund Balance (Deficit) 48,081<br />
Fees From Remainig PFIP Development -<br />
Total Fund Balances 48,081<br />
Net Costs Funded From PFIP Fee 3,175,299<br />
1,159,619<br />
-<br />
1,159,619<br />
(1,832,534)<br />
-<br />
(1,832,534)<br />
28,305,614<br />
1,744,445<br />
-<br />
1,744,445<br />
(3,758,396)<br />
-<br />
(3,758,396)<br />
43,567,846<br />
181,726<br />
-<br />
181,726<br />
(8,920)<br />
-<br />
(8,920)<br />
4,147,997<br />
110,632<br />
-<br />
110,632<br />
-<br />
-<br />
-<br />
2,518,879<br />
See Table D-2 for details<br />
See Note (9)<br />
16,630,864 See Note (2)<br />
16,630,864<br />
3,337,438 See Note (6)<br />
-<br />
3,337,438<br />
See Note (5)<br />
(5,551,769) <strong>Update</strong>d 6/30/2012 Balance<br />
-<br />
(5,551,769)<br />
81,715,635<br />
Capacity Provided (GPD) 698,810 2,092,410 3,969,703 873,716 265,667 7,900,305<br />
Fee Per Gallon $ 4.54 $ 13.53 $ 10.98 $ 4.75 $ 9.48<br />
Oversizing Offset (Per Gallon) $ (2.81) $ (2.81) $ (2.81) $ (2.81) $ (2.81)<br />
See Note (7)<br />
Net Sewer Fee Per Gallon After Offset $ 1.73 $ 10.72 $ 8.16 $ 1.94 $ 6.67<br />
Capacity Provided (EDUs = DU Basis) 4,368 13,078 24,811 5,461 1,660 49,377<br />
Fee EDU (Units) $ 727 $ 2,164 $ 1,756 $ 760 $ 1,517<br />
Oversizing Offset (Per EDU) $ (450) $ (450) $ (450) $ (450) $ (450)<br />
See Note (8)<br />
Net Sewer Fee Per EDU After Offset $ 277 $ 1,714 $ 1,306 $ 310 $ 1,067<br />
Notes:<br />
(1) Woodward Park project completed and reflected in beginning fund balances.<br />
(2) Assumes entire cost <strong>of</strong> current projects funded by 30 year debt service with 2.0% interest, see Table D-5 for calculation details.<br />
(3) Assumes 100% <strong>of</strong> PFIP CIP costs are financed, see Table D-6 for financing assumptions.<br />
(4) Contingency estimate <strong>of</strong> 10% built into the construction costs, s<strong>of</strong>t costs detailed in Table D-2.<br />
(5) <strong>City</strong> Administrative Costs - Variable assumed to be 0.0% <strong>of</strong> PFIP CIP costs.<br />
(6) For details <strong>of</strong> Program <strong>Update</strong>s and On-Going Admin see Appendix F.<br />
(7) 50% <strong>of</strong> oversizing charge <strong>of</strong>fset Sewer Fee ($900 * 50%) / 160 gpd = $2.81 <strong>of</strong>fset per gallon<br />
(8) 50% <strong>of</strong> oversizing charge <strong>of</strong>fset Sewer Fee ($900 * 50%) = $450 <strong>of</strong>fset per EDU<br />
(9) CIP costs based on July 2010 ENR (8844) were adjusted to July 2012 ENR (9324).
Table D-1.1<br />
<strong>City</strong> <strong>of</strong> <strong>Manteca</strong><br />
PFIP Sewer Collection Fee<br />
EDU Factors<br />
Land Use Units<br />
GPD (per<br />
acre) Zone 21 Zone 22 Zone 24 Zone 25 Zone 26 Units<br />
Fee Per Gallon: $ 1.73 $ 10.72 $ 8.16 $ 1.94 $ 6.67<br />
AG Acre -<br />
BIP Acre 1,200<br />
CMU Acre 2,473<br />
GC Acre 750<br />
HDR Acre 2,337<br />
HI Acre 1,000<br />
LDR Acre 808<br />
LI Acre 1,000<br />
MDR Acre 1,346<br />
NC Acre 1,120<br />
OS Acre -<br />
P Acre 400<br />
PQP Acre 425<br />
UR Acre 320<br />
UR-AG Acre -<br />
UR-BIP Acre 1,200<br />
UR-CMU Acre 2,473<br />
UR-GC Acre 750<br />
UR-LDR Acre 808<br />
UR-LI Acre 600<br />
UR-MDR Acre 1,346<br />
UR-P Acre 400<br />
UR-PQP Acre 425<br />
UR-VLDR Acre 320<br />
VLDR Acre 320<br />
-<br />
2,078<br />
4,282<br />
1,299<br />
4,046<br />
1,731<br />
1,399<br />
1,731<br />
2,330<br />
1,939<br />
-<br />
693<br />
736<br />
554<br />
-<br />
2,078<br />
4,282<br />
1,299<br />
1,399<br />
1,039<br />
2,330<br />
693<br />
736<br />
554<br />
554<br />
-<br />
12,858<br />
26,499<br />
8,036<br />
25,042<br />
10,715<br />
8,658<br />
10,715<br />
14,423<br />
12,001<br />
-<br />
4,286<br />
4,554<br />
3,429<br />
-<br />
12,858<br />
26,499<br />
8,036<br />
8,658<br />
6,429<br />
14,423<br />
4,286<br />
4,554<br />
3,429<br />
3,429<br />
Fee Per Acre Fee Per Unit<br />
-<br />
9,795<br />
20,186<br />
6,122<br />
19,076<br />
8,163<br />
6,595<br />
8,163<br />
10,987<br />
9,142<br />
-<br />
3,265<br />
3,469<br />
2,612<br />
-<br />
9,795<br />
20,186<br />
6,122<br />
6,595<br />
4,898<br />
10,987<br />
3,265<br />
3,469<br />
2,612<br />
2,612<br />
-<br />
2,322<br />
4,785<br />
1,451<br />
4,522<br />
1,935<br />
1,564<br />
1,935<br />
2,605<br />
2,167<br />
-<br />
774<br />
822<br />
619<br />
-<br />
2,322<br />
4,785<br />
1,451<br />
1,564<br />
1,161<br />
2,605<br />
774<br />
822<br />
619<br />
619<br />
-<br />
8,003<br />
16,492<br />
5,002<br />
15,585<br />
6,669<br />
5,388<br />
6,669<br />
8,976<br />
7,469<br />
-<br />
2,668<br />
2,834<br />
2,134<br />
-<br />
8,003<br />
16,492<br />
5,002<br />
5,388<br />
4,001<br />
8,976<br />
2,668<br />
2,834<br />
2,134<br />
2,134<br />
Acre -<br />
Acre 1.00<br />
Acre 1.00<br />
Acre 1.00<br />
Dwelling Unit 19.97<br />
Acre 1.00<br />
Dwelling Unit 5.05<br />
Acre 1.00<br />
Dwelling Unit 11.50<br />
Acre 1.00<br />
Acre 1.00<br />
Acre 1.00<br />
Acre 1.00<br />
Acre 1.00<br />
Acre -<br />
Acre 1.00<br />
Acre 1.00<br />
Acre 1.00<br />
Dwelling Unit 5.05<br />
Acre 1.00<br />
Dwelling Unit 11.50<br />
Acre 1.00<br />
Acre 1.00<br />
Dwelling Unit 2.00<br />
Dwelling Unit 2.00<br />
Units Per<br />
Acre Zone 21 Zone 22 Zone 24 Zone 25 Zone 26<br />
-<br />
2,078<br />
4,282<br />
1,299<br />
203<br />
1,731<br />
277<br />
1,731<br />
203<br />
1,939<br />
-<br />
693<br />
736<br />
554<br />
-<br />
2,078<br />
4,282<br />
1,299<br />
277<br />
1,039<br />
203<br />
693<br />
736<br />
277<br />
277<br />
-<br />
12,858<br />
26,499<br />
8,036<br />
1,254<br />
10,715<br />
1,714<br />
10,715<br />
1,254<br />
12,001<br />
-<br />
4,286<br />
4,554<br />
3,429<br />
-<br />
12,858<br />
26,499<br />
8,036<br />
1,714<br />
6,429<br />
1,254<br />
4,286<br />
4,554<br />
1,714<br />
1,714<br />
-<br />
9,795<br />
20,186<br />
6,122<br />
955<br />
8,163<br />
1,306<br />
8,163<br />
955<br />
9,142<br />
-<br />
3,265<br />
3,469<br />
2,612<br />
-<br />
9,795<br />
20,186<br />
6,122<br />
1,306<br />
4,898<br />
955<br />
3,265<br />
3,469<br />
1,306<br />
1,306<br />
-<br />
2,322<br />
4,785<br />
1,451<br />
226<br />
1,935<br />
310<br />
1,935<br />
226<br />
2,167<br />
-<br />
774<br />
822<br />
619<br />
-<br />
2,322<br />
4,785<br />
1,451<br />
310<br />
1,161<br />
226<br />
774<br />
822<br />
310<br />
310<br />
-<br />
8,003<br />
16,492<br />
5,002<br />
780<br />
6,669<br />
1,067<br />
6,669<br />
780<br />
7,469<br />
-<br />
2,668<br />
2,834<br />
2,134<br />
-<br />
8,003<br />
16,492<br />
5,002<br />
1,067<br />
4,001<br />
780<br />
2,668<br />
2,834<br />
1,067<br />
1,067
Table D-1.2<br />
<strong>City</strong> <strong>of</strong> <strong>Manteca</strong><br />
PFIP Sewer Collection Fee<br />
EDU Factors<br />
Land Use Units<br />
Wastwater<br />
Generation<br />
Factor (WGF)<br />
(gpd/acre) (a)<br />
AG Acre -<br />
BIP Acre 1,200<br />
CMU Acre 2,473<br />
GC Acre 750<br />
HDR Acre 2,337<br />
HI Acre 1,000<br />
LDR Acre 808<br />
LI Acre 1,000<br />
MDR Acre 1,346<br />
NC Acre 1,120<br />
OS Acre -<br />
P Acre 400<br />
PQP Acre 425<br />
UR Acre 320<br />
UR-AG Acre -<br />
UR-BIP Acre 1,200<br />
UR-CMU Acre 2,473<br />
UR-GC Acre 750<br />
UR-LDR Acre 808<br />
UR-LI Acre 600<br />
UR-MDR Acre 1,346<br />
UR-P Acre 400<br />
UR-PQP Acre 425<br />
UR-VLDR Acre 320<br />
VLDR Acre 320<br />
Notes:<br />
(a) per 2012 Wastewater Collection System Master <strong>Plan</strong><br />
EDU Factor<br />
(per acre) Units<br />
-<br />
1.49<br />
3.06<br />
0.93<br />
2.89<br />
1.24<br />
1.00<br />
1.24<br />
1.67<br />
1.39<br />
-<br />
0.50<br />
0.53<br />
0.40<br />
-<br />
1.49<br />
3.06<br />
0.93<br />
1.00<br />
0.74<br />
1.67<br />
0.50<br />
0.53<br />
0.40<br />
0.40<br />
Units Per<br />
Acre<br />
Wastewater<br />
Generation<br />
Factor (WGF)<br />
Per Unit<br />
EDU Factor<br />
(per unit)<br />
Acre 0 -<br />
Acre 1.00<br />
Acre 1.00<br />
Acre 1.00<br />
Dwelling Unit 19.97<br />
Acre 1.00<br />
Dwelling Unit 5.05<br />
Acre 1.00<br />
Dwelling Unit 11.50<br />
Acre 1.00<br />
Acre 1.00<br />
Acre 1.00<br />
Acre 1.00<br />
Acre 1.00<br />
1,200 7.50<br />
2,473 15.46<br />
750 4.69<br />
117 0.73<br />
1,000 6.25<br />
160 1.00<br />
1,000 6.25<br />
117 0.73<br />
1,120 7.00<br />
0 -<br />
400 2.50<br />
425 2.66<br />
320 2.00<br />
Acre 0 -<br />
Acre 1.00<br />
Acre 1.00<br />
Acre 1.00<br />
Dwelling Unit 5.05<br />
Acre 1.00<br />
Dwelling Unit 11.50<br />
Acre 1.00<br />
Acre 1.00<br />
Dwelling Unit 2.00<br />
Dwelling Unit 2.00<br />
1,200 7.50<br />
2,473 15.46<br />
750 4.69<br />
160 1.00<br />
600 3.75<br />
117 0.73<br />
400 2.50<br />
425 2.66<br />
160 1.00<br />
160 1.00
Table D-1.3<br />
<strong>City</strong> <strong>of</strong> <strong>Manteca</strong><br />
PFIP Sewer Collection Fee<br />
New Development - Total EDUs Developed<br />
Sewer Zone Land Use<br />
ZONE 21 (includes old Zone 23)<br />
Undeveloped<br />
Acres (a)<br />
Percentage<br />
Developed<br />
Expected<br />
Developed<br />
Acres (a) Units<br />
CMU 127 100% 127 Acre 2,473<br />
GC 47 100% 47 Acre 750<br />
HDR 35 100% 35 Acre 2,337<br />
LDR 162 100% 162 Acre 808<br />
LI 43 100% 43 Acre 1,000<br />
MDR 56 100% 56 Acre 1,346<br />
NC 13 100% 13 Acre 1,120<br />
P 9 100% 9 Acre 400<br />
VLDR 7 100% 7 Acre 320<br />
GPD (per<br />
acre) Total GPD<br />
313,184<br />
35,015<br />
81,590<br />
130,976<br />
Total Zone 21 497 497.23 698,810<br />
GPD per EDU<br />
Estimated GPD<br />
ZONE 22 AG 3,385 100% 3,385 Acre -<br />
CMU 29 100% 29 Acre 2,473<br />
GC 19 100% 19 Acre 750<br />
HDR 26 100% 26 Acre 2,337<br />
HI 175 100% 175 Acre 1,000<br />
LDR 1,033 100% 1,033 Acre 808<br />
LI 528 100% 528 Acre 1,000<br />
MDR 19 100% 19 Acre 1,346<br />
NC 22 100% 22 Acre 1,120<br />
OS 15 100% 15 Acre -<br />
P 44 100% 44 Acre 400<br />
PQP 157 100% 157 Acre 425<br />
UR 579 20% 116 Acre 320<br />
UR-AG 1,153 20% 231 Acre -<br />
UR-CMU 43 20% 9 Acre 2,473<br />
UR-GC 40 20% 8 Acre 750<br />
UR-LDR 754 20% 151 Acre 808<br />
UR-LI 114 20% 23 Acre 600<br />
UR-MDR 20 20% 4 Acre 1,346<br />
UR-P 38 20% 8 Acre 400<br />
UR-PQP 12 20% 2 Acre 425<br />
UR-VLDR 353 20% 71 Acre 320<br />
VLDR 128 100% 128 Acre 320<br />
42,512<br />
75,262<br />
14,663<br />
3,443<br />
2,165<br />
-<br />
72,440<br />
14,071<br />
59,982<br />
175,128<br />
834,691<br />
527,842<br />
25,705<br />
25,184<br />
-<br />
17,708<br />
66,800<br />
37,026<br />
-<br />
21,296<br />
6,065<br />
121,907<br />
Total Zone 22 8,686 6,202.42 2,092,410<br />
GPD per EDU 2484.0421<br />
Estimated GPD -0.2860<br />
ZONE 24 AG 111 100% 111 Acre -<br />
BIP 45 100% 45 Acre 1,200<br />
CMU 163 100% 163 Acre 2,473<br />
GC 320 100% 320 Acre 750<br />
HDR 68 100% 68 Acre 2,337<br />
HI 564 100% 564 Acre 1,000<br />
LDR 1,934 100% 1,934 Acre 808<br />
LI 180 100% 180 Acre 1,000<br />
MDR 114 100% 114 Acre 1,346<br />
NC 21 100% 21 Acre 1,120<br />
P 108 100% 108 Acre 400<br />
PQP 85 100% 85 Acre 425<br />
UR 1,131 20% 226 Acre 320<br />
UR-AG 459 20% 92 Acre -<br />
UR-BIP 339 20% 68 Acre 1,200<br />
UR-CMU 294 20% 59 Acre 2,473<br />
UR-LDR 481 20% 96 Acre 808<br />
UR-P 30 20% 6 Acre 400<br />
UR-VLDR 79 20% 16 Acre 320<br />
VLDR 525 100% 525 Acre 320<br />
13,734<br />
5,313<br />
3,005<br />
990<br />
22,566<br />
40,956<br />
-<br />
53,592<br />
402,487<br />
240,082<br />
159,555<br />
563,792<br />
1,562,720<br />
180,021<br />
152,874<br />
22,988<br />
43,341<br />
36,143<br />
72,355<br />
-<br />
81,288<br />
145,295<br />
77,804<br />
2,397<br />
5,039<br />
167,930<br />
Total Zone 24 7,050 4,800 3,969,703<br />
GPD per EDU 2249.8935<br />
Estimated GPD -0.3191<br />
ZONE 25 AG 191 100% 191 Acre -<br />
BIP 135 100% 135 Acre 1,200<br />
GC 79 100% 79 Acre 750<br />
HDR 19 100% 19 Acre 2,337<br />
LDR 546 100% 546 Acre 808<br />
MDR 49 100% 49 Acre 1,346<br />
OS 429 100% 429 Acre -<br />
UR-BIP 70 20% 14 Acre 1,200<br />
UR-CMU 99 20% 20 Acre 2,473<br />
UR-LDR 146 20% 29 Acre 808<br />
UR-VLDR 196 20% 39 Acre 320<br />
-<br />
162,389<br />
58,923<br />
43,753<br />
440,998<br />
Total Zone 25 1,958 1,550 873,716<br />
GPD per EDU<br />
Estimated GPD<br />
ZONE 26 GC 58 100% 58 Acre 750<br />
LDR 275 100% 275 Acre 808<br />
65,921<br />
-<br />
16,801<br />
48,871<br />
23,516<br />
12,542<br />
43,410<br />
222,257<br />
Total Zone 25 333 333 265,667<br />
GPD per EDU<br />
Estimated GPD<br />
TOTAL TOTAL 18,525 13,382 7,900,305<br />
GPD per EDU<br />
Estimated GPD<br />
Notes:<br />
(a) Source: Per <strong>City</strong> GIS analysis
Table D-2<br />
<strong>City</strong> <strong>of</strong> <strong>Manteca</strong><br />
PFIP Sewer Collection Fee<br />
Sewer Capital Improvements Program<br />
Total Existng Zone 21 Zone 22 Zone 24 Zone 25 Zone 26 Total<br />
Project Development Cost Cost Cost Cost Cost PFF<br />
Project Description Cost Share Estimate Estimate Estimate Estimate Estimate Share Totals<br />
Forced Pipelines<br />
Force Main OSFM 276,000<br />
Force Main 27N 263,000<br />
Force Main 27S 165,000<br />
Force Main 28 292,000<br />
Force Main 36 1,565,000<br />
Force Main FMN-01 336,000<br />
Subtotal Forced Pipelines Construction 2,897,000<br />
S<strong>of</strong>t Costs (8.0%) 231,760<br />
Total Forced Pipelines 3,128,760<br />
Gravity Pipelines<br />
Link 1 1,135,000<br />
Link 100 539,000<br />
Link 10S 1,359,000<br />
Link 14A 63,000<br />
Link 2 770,000<br />
Link 22S1 2,011,000<br />
Link 22 3,633,000<br />
Link 22S2 1,016,000<br />
Link 22S 800,000<br />
Link 25 736,000<br />
Link 3 1,471,000<br />
Link 33 924,000<br />
Link 4 764,000<br />
Link 5 2,987,000<br />
Link 51 1,038,000<br />
Link 52 749,000<br />
Link 53 1,227,000<br />
Link 54 1,353,000<br />
Link 56 58,000<br />
Link 66S2 838,000<br />
Link 66S3 833,000<br />
Link 66S4 129,000<br />
Link 69S1 1,647,000<br />
Link 69S2 362,000<br />
Link 71 142,000<br />
Link 72 363,000<br />
Link 72A 1,774,000<br />
Link 73 720,000<br />
Link 73B 147,000<br />
Link 74 289,000<br />
Link 75 552,000<br />
Link 76 418,000<br />
Link 77 410,000<br />
Link 79 1,231,000<br />
Link 80 392,000<br />
Link 81 1,220,000<br />
Link 8S 1,346,000<br />
Link 90 1,464,000<br />
Link 91 754,000<br />
Link 92 620,000<br />
Link 93 319,000<br />
Link 93SI 304,000<br />
Link 94 319,000<br />
Link 95 309,000<br />
Link 96 441,000<br />
Link 97 341,000<br />
Link 98 371,000<br />
Link 99 369,000<br />
Link 9S 1,057,000<br />
Subtotal Gravity Pipelines 42,114,000<br />
S<strong>of</strong>t Costs (8.0%) 3,369,120<br />
Total Gravity Pipelines 45,483,120<br />
Pump/Lift Stations<br />
South Main Lift Station 1,145,000<br />
South Union Lift Station 780,000<br />
SR-99 Lift Station 1,145,000<br />
Trails <strong>of</strong> <strong>Manteca</strong> Lift Station 1,145,000<br />
Yosemite Square Pump Station 1,145,000<br />
Austin Business Pump Station 1,145,000<br />
Chadwick Pump Station 780,000<br />
Tara Park, Stage 1 Updgrade 100,000<br />
Tara Park, Stage 2 Updgrade 100,000<br />
Woodward Park, Stage 1 Updgrade 100,000<br />
Louise Avenue Lift Station 780,000<br />
Oakwood Shores Pump Station 780,000<br />
South Airport Lift Station 780,000<br />
Subtotal Pump/Lift Stations 9,925,000<br />
S<strong>of</strong>t Costs (12.0%) 1,191,000<br />
Total Pump/Lift Stations 11,116,000<br />
Reclaimed Water<br />
Subtotal Reclaimed Water -<br />
Subtotal - Construction Costs 54,936,000<br />
Subtotal - S<strong>of</strong>t Costs 4,791,880<br />
Total Costs 59,727,880<br />
Source: <strong>City</strong> <strong>of</strong> <strong>Manteca</strong>.<br />
-<br />
-<br />
-<br />
485,100<br />
508,620<br />
374,500<br />
613,500<br />
-<br />
732,000<br />
377,000<br />
545,600<br />
280,720<br />
97,280<br />
287,100<br />
278,100<br />
396,900<br />
306,900<br />
333,900<br />
332,100<br />
5,949,320<br />
475,946<br />
6,425,266<br />
-<br />
-<br />
-<br />
-<br />
5,949,320<br />
475,946<br />
6,425,266<br />
-<br />
-<br />
-<br />
53,900<br />
301,747<br />
213,465<br />
349,695<br />
-<br />
417,240<br />
214,890<br />
74,400<br />
38,280<br />
206,720<br />
31,900<br />
30,900<br />
44,100<br />
34,100<br />
37,100<br />
36,900<br />
2,085,337<br />
166,827<br />
2,252,164<br />
-<br />
-<br />
-<br />
-<br />
2,085,337<br />
166,827<br />
2,252,164<br />
336,000<br />
336,000<br />
26,880<br />
362,880<br />
227,633<br />
161,035<br />
263,805<br />
1,353,000<br />
58,000<br />
838,000<br />
833,000<br />
129,000<br />
1,647,000<br />
362,000<br />
142,000<br />
363,000<br />
1,774,000<br />
720,000<br />
147,000<br />
289,000<br />
552,000<br />
418,000<br />
410,000<br />
1,231,000<br />
392,000<br />
1,220,000<br />
314,760<br />
162,110<br />
14,007,343<br />
1,120,587<br />
15,127,930<br />
1,145,000<br />
780,000<br />
780,000<br />
2,705,000<br />
324,600<br />
3,029,600<br />
-<br />
17,048,343<br />
1,472,067<br />
18,520,410<br />
263,000<br />
165,000<br />
292,000<br />
1,565,000<br />
2,285,000<br />
182,800<br />
2,467,800<br />
964,750<br />
1,359,000<br />
63,000<br />
654,500<br />
2,011,000<br />
3,633,000<br />
1,016,000<br />
800,000<br />
736,000<br />
1,250,350<br />
649,400<br />
2,538,950<br />
1,346,000<br />
-<br />
1,057,000<br />
18,078,950<br />
1,446,316<br />
19,525,266<br />
1,145,000<br />
780,000<br />
1,145,000<br />
1,145,000<br />
72,000<br />
72,000<br />
100,000<br />
780,000<br />
5,239,000<br />
628,680<br />
5,867,680<br />
-<br />
25,602,950<br />
2,257,796<br />
27,860,746<br />
-<br />
-<br />
-<br />
124,850<br />
84,700<br />
161,810<br />
674,520<br />
84,040<br />
328,570<br />
-<br />
1,458,490<br />
116,679<br />
1,575,169<br />
1,145,000<br />
20,000<br />
20,000<br />
1,185,000<br />
142,200<br />
1,327,200<br />
-<br />
2,643,490<br />
258,879<br />
2,902,369<br />
276,000<br />
276,000<br />
22,080<br />
298,080<br />
45,400<br />
30,800<br />
58,840<br />
249,480<br />
30,560<br />
119,480<br />
534,560<br />
42,765<br />
577,325<br />
8,000<br />
8,000<br />
780,000<br />
796,000<br />
95,520<br />
891,520<br />
-<br />
1,606,560<br />
160,365<br />
1,766,925<br />
276,000<br />
263,000<br />
165,000<br />
292,000<br />
1,565,000<br />
336,000<br />
2,897,000<br />
231,760<br />
3,128,760<br />
1,135,000<br />
53,900<br />
1,359,000<br />
63,000<br />
770,000<br />
2,011,000<br />
3,633,000<br />
1,016,000<br />
800,000<br />
736,000<br />
1,471,000<br />
924,000<br />
764,000<br />
2,987,000<br />
529,380<br />
374,500<br />
613,500<br />
1,353,000<br />
58,000<br />
838,000<br />
833,000<br />
129,000<br />
1,647,000<br />
362,000<br />
142,000<br />
363,000<br />
1,774,000<br />
720,000<br />
147,000<br />
289,000<br />
552,000<br />
418,000<br />
410,000<br />
1,231,000<br />
392,000<br />
1,220,000<br />
1,346,000<br />
732,000<br />
377,000<br />
74,400<br />
38,280<br />
206,720<br />
31,900<br />
30,900<br />
44,100<br />
34,100<br />
37,100<br />
36,900<br />
1,057,000<br />
36,164,680<br />
2,893,174<br />
39,057,854<br />
1,145,000<br />
780,000<br />
1,145,000<br />
1,145,000<br />
1,145,000<br />
1,145,000<br />
780,000<br />
100,000<br />
100,000<br />
100,000<br />
780,000<br />
780,000<br />
780,000<br />
9,925,000<br />
1,191,000<br />
11,116,000<br />
-<br />
48,986,680<br />
4,315,934<br />
53,302,614<br />
276,000<br />
263,000<br />
165,000<br />
292,000<br />
1,565,000<br />
336,000<br />
2,897,000<br />
231,760<br />
3,128,760<br />
1,135,000<br />
539,000<br />
1,359,000<br />
63,000<br />
770,000<br />
2,011,000<br />
3,633,000<br />
1,016,000<br />
800,000<br />
736,000<br />
1,471,000<br />
924,000<br />
764,000<br />
2,987,000<br />
1,038,000<br />
749,000<br />
1,227,000<br />
1,353,000<br />
58,000<br />
838,000<br />
833,000<br />
129,000<br />
1,647,000<br />
362,000<br />
142,000<br />
363,000<br />
1,774,000<br />
720,000<br />
147,000<br />
289,000<br />
552,000<br />
418,000<br />
410,000<br />
1,231,000<br />
392,000<br />
1,220,000<br />
1,346,000<br />
1,464,000<br />
754,000<br />
620,000<br />
319,000<br />
304,000<br />
319,000<br />
309,000<br />
441,000<br />
341,000<br />
371,000<br />
369,000<br />
1,057,000<br />
42,114,000<br />
3,369,120<br />
45,483,120<br />
1,145,000<br />
780,000<br />
1,145,000<br />
1,145,000<br />
1,145,000<br />
1,145,000<br />
780,000<br />
100,000<br />
100,000<br />
100,000<br />
780,000<br />
780,000<br />
780,000<br />
9,925,000<br />
1,191,000<br />
11,116,000<br />
-<br />
54,936,000<br />
4,791,880<br />
59,727,880
Table D-4<br />
<strong>City</strong> <strong>of</strong> <strong>Manteca</strong><br />
PFIP Sewer Collection Fee<br />
Undeveloped Acreage - Sewer Zones<br />
SEWER ZONE LAND USE<br />
UNDEVELOPED<br />
ACRES<br />
ZONE 21 BP 1.0000<br />
CMU 76.1844<br />
GC 36.6312<br />
HDR 34.9124<br />
LDR 155.2875<br />
LI 7.9108<br />
MDR 55.9150<br />
NC 13.0917<br />
P 8.6079<br />
VLDR 6.7650<br />
ZONE 22 AG 3385.3007<br />
CMU 29.2923<br />
GC 18.7611<br />
HDR 25.6662<br />
HI 175.1279<br />
LDR 1033.0335<br />
LI 527.8424<br />
MDR 19.0973<br />
NC 22.4860<br />
OS 15.3685<br />
P 44.2700<br />
PQP 157.1758<br />
UR 578.5375<br />
UR-AG 1152.6551<br />
UR-CMU 43.0578<br />
UR-GC 40.4348<br />
UR-LDR 754.3747<br />
UR-LI 114.4495<br />
UR-MDR 19.7362<br />
UR-P 37.5610<br />
UR-PQP 11.6529<br />
UR-VLDR 352.5933<br />
VLDR 127.9861<br />
ZONE 23 CMU 50.4571<br />
GC 10.0556<br />
LDR 6.8119<br />
LI 34.6008<br />
ZONE 24 AG 111.4787<br />
BIP 44.6599<br />
CMU 162.7524<br />
GC 320.1093<br />
HDR 68.2732<br />
HI 563.7922<br />
LDR 1934.0595<br />
LI 180.0213<br />
MDR 113.5767<br />
NC 20.5254<br />
P 108.3517<br />
PQP 85.0424<br />
UR 1130.5528<br />
UR-AG 459.1962<br />
UR-BIP 338.6979<br />
UR-CMU 293.7625<br />
UR-LDR 481.4602<br />
UR-P 29.9604<br />
UR-VLDR 78.7369<br />
VLDR 524.7825<br />
ZONE 25 AG 191.4289<br />
BIP 135.3244<br />
GC 78.5645<br />
HDR 18.7220<br />
LDR 545.7898<br />
MDR 48.9758<br />
OS 428.9815<br />
UR-BIP 70.0028<br />
UR-CMU 98.8098<br />
UR-LDR 145.5194<br />
UR-VLDR 195.9684<br />
TOTAL 18192.5709
Table D-5<br />
<strong>City</strong> <strong>of</strong> <strong>Manteca</strong><br />
PFIP Sewer Collection Fee<br />
Financing Assumptions<br />
Description Amount<br />
Annual Interest Rate 2.00%<br />
Term - Years 30<br />
Payments per year 1<br />
Loan Constant - Annual Debt Service (per $1,000) $44.65<br />
Annual Finance Cost (per $1,000) $11.32
ZONE 26<br />
ZONE 25<br />
ZONE 24<br />
ZONE 22<br />
ZONE 21<br />
LEGEND<br />
WASTEWATER COLLECTION FEE ZONE 21<br />
WASTEWATER COLLECTION FEE ZONE 22<br />
WASTEWATER COLLECTION FEE ZONE 24<br />
WASTEWATER COLLECTION FEE ZONE 25<br />
WASTEWATER COLLECTION FEE ZONE 26
Appendix E<br />
Transportation Data<br />
- To be added in future -
Appendix F<br />
<strong>City</strong> PFIP Administration Costs
Table F-1<br />
<strong>City</strong> <strong>of</strong> <strong>Manteca</strong><br />
PFIP Sewer Collection Fee<br />
<strong>City</strong> Administration Costs<br />
Wastewater<br />
Estimated<br />
Costs<br />
PFIP <strong>Update</strong>s - 5 Year 112,500<br />
PFIP <strong>Update</strong>s - Annual 156,250<br />
Master <strong>Plan</strong> <strong>Update</strong>s 1,593,750<br />
<strong>City</strong> Administrative Costs - On Going 1,474,938<br />
Total PFIP Admin Costs 3,337,438<br />
Storm Drainage<br />
PFIP <strong>Update</strong>s - 5 Year 112,500<br />
PFIP <strong>Update</strong>s - Annual 156,250<br />
Master <strong>Plan</strong> <strong>Update</strong>s 1,031,250<br />
<strong>City</strong> Administrative Costs - On Going 1,464,813<br />
Total PFIP Admin Costs 2,764,813<br />
Water<br />
PFIP <strong>Update</strong>s - 5 Year 112,500<br />
PFIP <strong>Update</strong>s - Annual 156,250<br />
Master <strong>Plan</strong> <strong>Update</strong>s 1,406,250<br />
<strong>City</strong> Administrative Costs - On Going 1,494,688<br />
Total PFIP Admin Costs 3,169,688<br />
Transportation<br />
PFIP <strong>Update</strong>s - 5 Year 112,500<br />
PFIP <strong>Update</strong>s - Annual 156,250<br />
Master <strong>Plan</strong> <strong>Update</strong>s 1,687,500<br />
<strong>City</strong> Administrative Costs - On Going 1,517,188<br />
Total PFIP Admin Costs 3,473,438<br />
Totals<br />
PFIP <strong>Update</strong>s - 5 Year 450,000<br />
PFIP <strong>Update</strong>s - Annual 625,000<br />
Master <strong>Plan</strong> <strong>Update</strong>s 5,718,750<br />
<strong>City</strong> Administrative Costs - On Going 5,951,625<br />
Total PFIP Admin Costs 12,745,375
Table F-2<br />
<strong>City</strong> <strong>of</strong> <strong>Manteca</strong><br />
PFIP On-Going Administration<br />
<strong>City</strong> Administration Costs<br />
FY13 Estimated<br />
Annual Annual Years In PFIP<br />
Description FTEs Cost PFIP Cost<br />
Analyst 1.00 116,875 116,880<br />
Analyst 0.10 101,210 10,120<br />
Deputy Finance 0.20 149,095 29,820<br />
Deputy Director PW 0.10 171,655 17,170<br />
Director CD 0.10 213,400 21,340<br />
Total Annual Personnel Costs 1.50 195,330<br />
Personnel $ 195,330 25 $ 4,883,250<br />
IT Allocation $ 22,735 25 $ 568,375<br />
Annual Audit $ 20,000 25 $ 500,000<br />
Costs To Be Allocated To Each Fee Fund $ 990,300<br />
$ 5,951,625<br />
FUND ALLOCATIONS - 25 Year Program<br />
$<br />
$<br />
8,750,000<br />
2,798,375<br />
Wastewater<br />
Personnel 25% $ 1,220,813<br />
IT Allocation 23% $ 129,125<br />
Annual Audit 25% $ 125,000<br />
Total $ 1,474,938<br />
Storm Drain<br />
Personnel 25% $ 1,220,813<br />
IT Allocation 21% $ 119,000<br />
Annual Audit 25% $ 125,000<br />
Total $ 1,464,813<br />
Transportation<br />
Personnel 25% $ 1,220,813<br />
IT Allocation 30% $ 171,375<br />
Annual Audit 25% $ 125,000<br />
Total $ 1,517,188<br />
Water<br />
Personnel 25% $ 1,220,813<br />
IT Allocation 26% $ 148,875<br />
Annual Audit 25% $ 125,000<br />
Total $ 1,494,688<br />
Total Fund Allocations<br />
Personnel 100% $ 4,883,250<br />
IT Allocation 100% $ 568,375<br />
Annual Audit 100% $ 500,000<br />
Total $ 5,951,625<br />
Notes:<br />
(1) Source: <strong>City</strong> <strong>of</strong> <strong>Manteca</strong>.<br />
(2) Cost will be allocated within each fee to each fee zone based on the percentage <strong>of</strong> CIP costs.
Table F-3<br />
<strong>City</strong> <strong>of</strong> <strong>Manteca</strong><br />
PFIP Program <strong>Update</strong> Costs<br />
<strong>City</strong> Administration Costs<br />
Description Frequency<br />
Years In<br />
PFIP Fee<br />
<strong>Update</strong>s in<br />
PFIP<br />
Cost Per<br />
<strong>Update</strong><br />
Total Cost in<br />
PFIP<br />
PFIP 5 Year Program <strong>Update</strong><br />
PFIP Program <strong>Update</strong> Every 5 Years 25 5 $ 75,000 $ 375,000<br />
Legal assistance on Program <strong>Update</strong> Every 5 Years 25 5 $ 15,000 $ 75,000<br />
Costs To Be Allocated To Each Facility Category $ 90,000 $ 450,000<br />
PFIP <strong>Update</strong> Allocated<br />
Wastewater 25% $ 22,500 $ 112,500<br />
Storm Drain 25% $ 22,500 $ 112,500<br />
Transportation 25% $ 22,500 $ 112,500<br />
Water 25% $ 22,500 $ 112,500<br />
Total PFIP <strong>Update</strong> Costs $ 90,000 $ 450,000<br />
PFIP Annual Program Review/<strong>Update</strong><br />
Pr<strong>of</strong>essional Services Annually 25 25 $ 25,000 $ 625,000<br />
Costs To Be Allocated To Each Facility Category $ 25,000 $ 625,000<br />
PFIP <strong>Update</strong> Allocated<br />
Wastewater 25% $ 6,250 $ 156,250<br />
Storm Drain 25% $ 6,250 $ 156,250<br />
Transportation 25% $ 6,250 $ 156,250<br />
Water 25% $ 6,250 $ 156,250<br />
Total PFIP Annual <strong>Update</strong> Costs $ 25,000 $ 625,000<br />
WASTEWATER<br />
Sewer Master <strong>Plan</strong> Every 10 Years 50 5 $ 225,000 $ 1,125,000<br />
EIR for Sewer Master <strong>Plan</strong> Every 10 Years 50 5 $ 200,000 $ 1,000,000<br />
Total Master <strong>Plan</strong> <strong>Update</strong>s $ 425,000 $ 2,125,000<br />
New Devlopment Share 75% $ 1,593,750<br />
Existing Development Share 25% $ 531,250<br />
STORM DRAIN<br />
Storm Drain Master <strong>Plan</strong> Every 10 Years 50 5 $ 200,000 $ 1,000,000<br />
EIR for Storm Drain Master <strong>Plan</strong> Every 10 Years 50 5 $ 75,000 $ 375,000<br />
Total Master <strong>Plan</strong> <strong>Update</strong>s $ 275,000 $ 1,375,000<br />
New Devlopment Share 75% $ 1,031,250<br />
Existing Development Share 25% $ 343,750<br />
WATER<br />
Water Master <strong>Plan</strong> Every 10 Years 50 5 $ 225,000 $ 1,125,000<br />
EIR for Water Master <strong>Plan</strong> Every 10 Years 50 5 $ 150,000 $ 750,000<br />
Total Master <strong>Plan</strong> <strong>Update</strong>s $ 375,000 $ 1,875,000<br />
New Devlopment Share 75% $ 1,406,250<br />
Existing Development Share 25% $ 468,750<br />
TRANSPORTATION<br />
Transportation Master <strong>Plan</strong> Every 10 Years 50 5 $ 275,000 $ 1,375,000<br />
EIR for Transportation Master <strong>Plan</strong> Every 10 Years 50 5 $ 175,000 $ 875,000<br />
Total Maser <strong>Plan</strong> <strong>Update</strong>s $ 450,000 $ 2,250,000<br />
New Devlopment Share 75% $ 1,687,500<br />
Existing Development Share 25% $ 562,500<br />
Sub-Total Master <strong>Plan</strong>s $ 1,525,000 $ 7,625,000<br />
New Devlopment Share $ 5,718,750<br />
Existing Development Share $ 1,906,250<br />
Grand Total $ 1,640,000 $ 8,700,000<br />
New Devlopment Share $ 6,793,750<br />
Existing Development Share $ 1,906,250<br />
Notes:<br />
(1) Source: <strong>City</strong> <strong>of</strong> <strong>Manteca</strong>.<br />
(2) In the future, it is anticipated that all master plans with require EIR's.<br />
(3) Cost will be allocated to each fee zone based on the percentage <strong>of</strong> CIP costs.
Appendix G<br />
Master Reimbursement List<br />
- To be added in future -