Evolution MegaLab: Notes for teachers
Evolution MegaLab: Notes for teachers
Evolution MegaLab: Notes for teachers

Create successful ePaper yourself
Turn your PDF publications into a flip-book with our unique Google optimized e-Paper software.
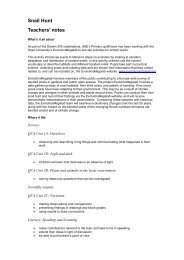
<strong>Notes</strong> <strong>for</strong> <strong>teachers</strong><br />
Getting started<br />
Go to the main website and download the following pdfs and photocopy them as needed:<br />
Then:<br />
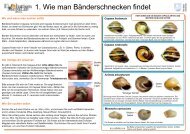
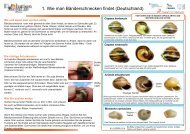
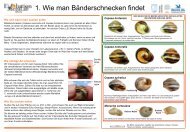
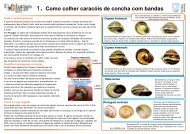
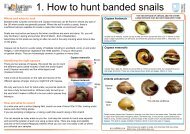
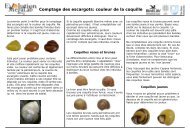
‘How to Hunt’ which has instructions on how to identify banded snails<br />
The Record Sheet<br />
A more detailed identification guide called ‘Want to know more’<br />
• Decide on a short username <strong>for</strong> your class<br />
• Register using this name by following the instructions on the site.<br />
• Familiarize yourself with the site.<br />
During data input you are asked to give the Hunt (i.e. a set of data collected at a particular<br />
place and time) a name. You can produce as many hunts as you like, so each student, or<br />
each group of students in the class can have their own. When you download the data, sort it<br />
by username and all the class results will be grouped together.<br />
What can you do?<br />
The Hunt can be used in many different ways. The choice is yours and will depend on the age<br />
of students, among other things. Here are some suggestions.<br />
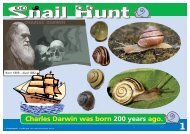
Demonstrate biological variation<br />
Variation is the raw material on which natural selection acts. The most fundamental thing<br />
anyone hunting <strong>for</strong> Cepaea can discover is just how much variation there actually is. This<br />
point alone would be a valuable take-home message <strong>for</strong> younger students. For older ones<br />
you might introduce the idea of the inheritance of variation.<br />
Discuss the genetics<br />
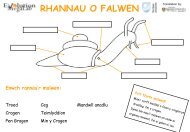
Three Mendelian loci control the characters that we are interested in:<br />
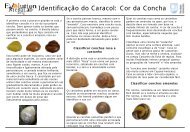
Shell colour is determined at one locus:<br />
Brown (C B ) is dominant to Pink (C P ) which is dominant to Yellow (C Y )<br />
Banding is controlled by two loci:<br />
One locus controls band presence/ absence:<br />
Absence (U) is dominant to presence (u)<br />
The above 2 loci (colour and band presence/absence) are linked (i.e. occur on the same<br />
chromosome).<br />
Another locus controls the suppression of bands 1, 2, 4 & 5, producing a single band in the<br />
mid position (M). One band is dominant to 5 bands (m).<br />
Using the in<strong>for</strong>mation given, and knowing that Cepaea is diploid; you can get students to write<br />
down the possible genetic make-up (genotypes) of their samples. Because of dominance, the<br />
SUPPORTED BY:
2 genotype frequencies cannot be calculated directly. For example, a snail with a UU<br />
genotype will have the same 1-banded phenotype as one that is Uu.<br />
The codes we have used <strong>for</strong> the different alleles mentioned above are simplified ones and are<br />
different from those given in the document on genetics, which are those used in research.<br />
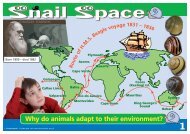
Investigate adaptation<br />
The variation in shell patterns in Cepaea was once regarded as of no adaptive significance to<br />
the animals, but we now know that shell colour and banding influence the visibility of snails to<br />
thrushes that prey upon them and also the body temperature of the snail.<br />
Discuss how you would expect these two <strong>for</strong>ces of natural selection to influence the<br />
distribution of different morphs.<br />
Ask students to <strong>for</strong>mulate hypotheses that might be tested with data collected in the Hunt.<br />
How might the frequency of morphs change over time if thrushes decline in numbers or the<br />
climate warms up?<br />
What effect would other birds or hedgehogs that also prey upon Cepaea have upon your<br />
expectations?<br />
Data on changing song thrush numbers can be found on the BTO website at:<br />
http://www.bto.org<br />
Investigate the ecology of Cepaea<br />
What kinds of habitats does Cepaea like? Why? What do they eat? What other species are<br />
found in the same habitats and what are the possible relationships among them? (e.g.<br />
competition, predation).<br />
Download and analyse data<br />
From the download page on the main website you can download selected data.<br />
The download file is in CSV (Comma Separated Value) <strong>for</strong>mat which can be opened with any<br />
spreadsheet program.<br />
Students can use a spreadsheet to sort that data by any of the fields. Which fields you choose<br />
will depend upon what questions you are trying to answer. The fields are:<br />
Username<br />
Record Name<br />
Comment<br />
Habitat<br />
Latitude<br />
Longitude<br />
Date of Hunt<br />
SUPPORTED BY:<br />
Common Name<br />
Binomial Name<br />
Total<br />
Pink Unbanded<br />
Pink 1 Band<br />
Pink 5 Bands<br />
Yellow Unbanded<br />
Yellow 1 Band<br />
Yellow 5 Bands<br />
Brown Unbanded<br />
Brown 1 Band<br />
Brown 5 Bands