Evotec Munich
Evotec Munich
Evotec Munich

Create successful ePaper yourself
Turn your PDF publications into a flip-book with our unique Google optimized e-Paper software.
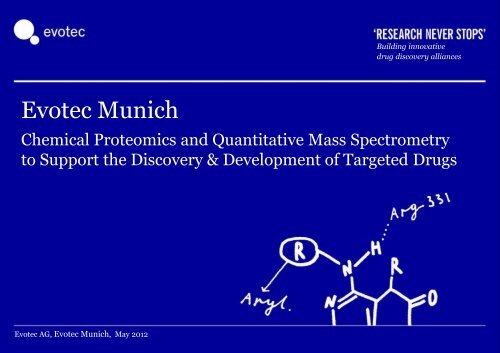
<strong>Evotec</strong> <strong>Munich</strong><br />
Building innovative<br />
drug discovery alliances<br />
Chemical Proteomics and Quantitative Mass Spectrometry<br />
to Support the Discovery & Development of Targeted Drugs<br />
<strong>Evotec</strong> AG, <strong>Evotec</strong> <strong>Munich</strong>, May 2012
About <strong>Evotec</strong> <strong>Munich</strong><br />
A leader in chemical proteomics and quantitative mass spectrometry<br />
• <strong>Evotec</strong>’s Center of Excellence for Proteomics and Oncology<br />
• Emerged from Kinaxo Biotechnologies GmbH, a Max Planck spin-off founded by the renowned cancer<br />
researcher Prof. Axel Ullrich<br />
• Collaborates with leading academic research laboratories including the lab of Prof. Matthias Mann at the<br />
Max Planck Institute<br />
• Combines highest service quality standards with powerful technological innovation developed by leading<br />
proteomics scientists such as Dr. Henrik Daub, <strong>Evotec</strong>’s VP Technology & Science<br />
PAGE 1 Selected publications by <strong>Evotec</strong> <strong>Munich</strong> scientists and <strong>Evotec</strong> <strong>Munich</strong> scientific advisors
PAGE 2<br />
<strong>Evotec</strong> <strong>Munich</strong><br />
Technology Offering
PAGE<br />
State of the art proteomics technologies<br />
Support development of targeted drugs<br />
Cellular Target Profiling ® Subproteomic Cellular Target Profiling ®<br />
3<br />
Target<br />
discovery<br />
Target ID &<br />
validation<br />
Scaffold<br />
selection /<br />
HT<br />
screens<br />
Screening<br />
Early stop-loss<br />
decision for scaffold<br />
selection<br />
On/off<br />
target<br />
profiling<br />
Mode of<br />
Action<br />
analysis<br />
(KinAffinity ® , Epigenetics Target Profiling ® )<br />
Response<br />
Prediction<br />
Biomarker<br />
Assays<br />
H2L LO Preclinic PhI/II<br />
Cellular Profiling to<br />
accompany H2L<br />
Selectivity analysis of lead<br />
compounds<br />
PTM signatures as<br />
predictive biomarkers<br />
Omics Technologies (Phosphoproteomics, Acetylomics)
PAGE 4<br />
Cellular Target Profiling <br />
Revelation of a compound’s cellular target spectrum<br />
• Determinates a compound‘s proteome-wide binding affinities in any cell line or<br />
tissue of choice<br />
• State-of-the-art chemical proteomics facilitates unbiased native profiling against<br />
endogenously expressed, full length proteins in the presence of cellular co-factors and complex partners<br />
• Adresses previously unavailable targets in combination with phenotypic screens and thus broadens the<br />
available chemical space for drug discovery<br />
• Leads to compounds with a relevant efficacy profile, ready for in vivo POC studies<br />
• Extensive, non-target class restricted track record in target deconvolution and profiling of various small<br />
molecule compounds (e.g. kinase inhibitors, antibiotics, epigenetic drugs, small molecules targeting<br />
metabolic enzymes, ligases, reductases, transferases, heat shock proteins, cyclooxygenases)
PAGE<br />
Light Medium Heavy<br />
Cellular Target Profiling <br />
Workflow<br />
Arg6 /Lys4 Arg0 /Lys0 Arg10 /Lys8 LC-MS/MS (1)<br />
Proteome labeling<br />
Metabolic<br />
Chemical<br />
Compound / target binding<br />
Labeled lysates are incubated with<br />
immobilized compound at different densities<br />
of coupled compound.<br />
Different concentrations of soluble compound<br />
are added to the mixture of labeled lysate at a<br />
fixed density of coupled compound.<br />
Identification and quantification of proteins<br />
Identification and determination of the relative amounts of the<br />
captured proteins by liquid chromatography and quantitative mass<br />
spectrometry<br />
Determination of K d,free values<br />
Generation of compound/target curves for immobilized and free<br />
compound. Application of Cheng-Prusoff equation to determine<br />
the K d,free values of all target proteins<br />
Light Medium Heavy<br />
Arg6 /Lys4 Arg0 /Lys0 Arg10 /Lys8 LC-MS/MS (2)<br />
5 Sharma et al., Nat Methods. 2009 Oct;6(10): 741-4<br />
Patent Protection EP2045332B1
Kd [µM]<br />
0.01<br />
0.1<br />
1.0<br />
10<br />
PAGE 6<br />
PI3-kinase catalytic subunit delta (PIK3CD)<br />
PI3-kinase catalytic subunit beta (PIK3CB)<br />
PI3-kinase regulatory subunit beta (PIK3R 2)<br />
PI3-kinase regulatory subunit gamma (PIK3R3)<br />
Beclin-1 (BECN1)<br />
PI3-kinase regulatory subunit 4 (PIK3R4)<br />
PI3-kinase catalytic subunit type 3 (PIK3C3)<br />
UV radiation resistance-assoc. gene protein (UVRAG)<br />
PI4-kinase catalytic subunit alpha (PI4KA)<br />
PI3-kinase catalytic subunit alpha (PIK3CA)<br />
Glycogen synthase kinase-3 alpha (GSK3A)<br />
Adenosine kinase (ADK)<br />
Zn-bdg alcohol dehydrogenase domain-cont. prot. 2<br />
Diphthine synthase (DPH5)<br />
Glycogen synthase kinase-3 beta (GSK3B)<br />
Serine/threonine-protein kinase RIO2 (RIOK2)<br />
Ketosamine-3-kinase (FN3KRP)<br />
Pyridoxal kinase (PDXK)<br />
Lactoylglutathione lyase (GLO1)<br />
Isochorismatase domain-containing protein 2 (ISOC2)<br />
Phospholipase D3 (PLD3)<br />
Deoxycytidine kinase (DCK)<br />
DNA-dep. protein kinase catalytic subunit (PRKDC)<br />
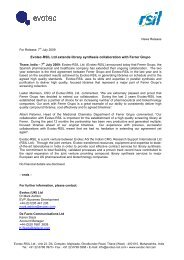
Cellular Target Profiling <br />
Profiling of a kinase inhibitor<br />
Protein kinases<br />
Kinase assoc. proteins<br />
Non-kinase proteins<br />
PIK3CD<br />
PIK3CB<br />
PIK3C3<br />
PIK3CA<br />
K d,free = 87 nM<br />
K d,free = 300 nM<br />
K d,free = 800 nM<br />
K d,free = 1366 nM<br />
UCB’s cpd discriminates PI3K isoforms within a<br />
cancer cell line
0,01<br />
0,1<br />
1<br />
10<br />
K d [µM]<br />
PAGE 7<br />
UNC0638 BIX-01294<br />
N<br />
O<br />
O<br />
N<br />
WIZ<br />
GLP<br />
G9a<br />
Protein X<br />
OCR<br />
NH<br />
N<br />
N<br />
Cellular Target Profiling <br />
Profiling of methyltransferase inhibitors<br />
N<br />
H<br />
N<br />
WIZ<br />
GLP<br />
G9A<br />
N N<br />
N<br />
O<br />
O<br />
Cellular target proteins for the published G9a selective<br />
methyltransferase inhibitors UNC0638 and BIX-01294 were<br />
identified in human CML (K562) cells<br />
Comparison with published in vitro data revealed known as well<br />
as previously unknown target proteins for both compounds<br />
Protein UNC0638<br />
K dµM<br />
<strong>Evotec</strong><br />
UNC0638<br />
IC 50µM<br />
Vedadi et al<br />
BIX-01294<br />
K dµM<br />
<strong>Evotec</strong><br />
BIX-01294<br />
IC 50µM<br />
Vedadi et al<br />
WIZ 0,039 - 0,056 -<br />
GLP 0,099 0,019 0,101 0,034<br />
Protein X 0,270 - -<br />
G9A 0,152 < 0,015 0,294 0,180<br />
OCR 4,524 - - -<br />
WIZ Widely-interspaced zinc finger-containing protein, mediating EHMT1 / EHMT2 interaction<br />
Protein X Possible UNC0638 off-target protein, validation experiments ongoing<br />
OCR Spindlin-1 / Ovarian cancer-related protein<br />
Vedadi et al, 2007, Nat Chem Biol., 7:566-74
0,1<br />
1<br />
10<br />
K d [µM]<br />
PAGE 8<br />
Parafibromin (CDC73)<br />
HSP90alpha (HSP90AA1)<br />
Probable Xaa-Pro aminopeptidase 3 (XPNPEP3)<br />
Putative HSP90beta 4 (HSP90AB4P)<br />
HSP90beta (HSP90AB1)<br />
Endoplasmin (HSP90B1)<br />
1-phosphatidylinositol-4,5-bisphosphate<br />
phosphodiesterase eta-1 (PLCH1)<br />
Adenosine kinase (ADK)<br />
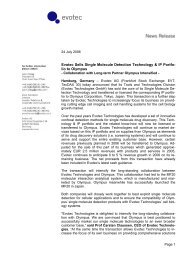
Cellular Target Profiling <br />
Profiling of the geldanamycin derivative 17-DMAG<br />
HSP90 protein family<br />
Other protein<br />
Cellular Target Profiling confirmed Hsp90 as prime target for<br />
17-DMAG, which is consistent with literature data<br />
In total, four members of the Hsp90 family were identified and<br />
K d values of the highly homologous isoforms Hsp90-alpha and<br />
Hsp90-beta were determined. Only very few other protein<br />
targets were identified, indicating high specificity of 17-DMAG<br />
for Hsp90.<br />
17-DMAG<br />
(17-dimethyl-amino-ethylamino-17-demethoxygeldanamycin)
Protein<br />
Name<br />
PAGE 9<br />
Sequence<br />
Coverage<br />
[%]<br />
Cellular Target Profiling <br />
Target deconvolution of 3 related compounds with different cellular activity<br />
Cancer cell viability Compound 1 < Compound 2 < Compound 3<br />
EC 50 ~ 50 nM ~ 150 nM ~ 1µM<br />
Binding Curve<br />
(Linker<br />
Compound)<br />
120<br />
100<br />
80<br />
Competition<br />
Cpd 1<br />
K dfree [M]<br />
Cpd 1<br />
Competition<br />
Cpd 2<br />
K dfree [M]<br />
Cpd 2<br />
Competition<br />
Cpd 3<br />
60<br />
60<br />
60<br />
60<br />
Protein Y 64,9 40<br />
40<br />
0,146 40<br />
1,06 1,3<br />
40<br />
% Bound<br />
20<br />
0<br />
-20<br />
120<br />
100<br />
80<br />
10 1<br />
Conc [µM]<br />
10 2<br />
K dfree [M]<br />
Cpd 3<br />
60<br />
60<br />
60<br />
60<br />
40<br />
Protein E 66,9 40<br />
40<br />
0,195 40<br />
0,308 0,329<br />
% Bound<br />
% Bound<br />
20<br />
0<br />
-20<br />
120<br />
100<br />
80<br />
10 1<br />
Conc [µM]<br />
10 2<br />
60<br />
80<br />
80<br />
60<br />
40<br />
60<br />
60<br />
40<br />
Protein F 60,7 - 3,2 3,42<br />
20<br />
40<br />
40<br />
0<br />
-20<br />
120<br />
100<br />
80<br />
10 1<br />
Conc [µM]<br />
10 2<br />
80<br />
Protein G 71,3<br />
60<br />
40<br />
60<br />
40<br />
-<br />
60<br />
40<br />
3,63<br />
60<br />
40<br />
3,91<br />
% Bound<br />
20<br />
0<br />
-20<br />
10 1<br />
Conc [µM]<br />
10 2<br />
% Bound<br />
% Bound<br />
% Bound<br />
% Bound<br />
120<br />
100<br />
80<br />
20<br />
0<br />
-20<br />
120<br />
100<br />
80<br />
20<br />
0<br />
-20<br />
140<br />
120<br />
100<br />
20<br />
0<br />
-20<br />
120<br />
100<br />
20<br />
0<br />
-20<br />
10 -2<br />
10 -2<br />
10 -2<br />
10 -2<br />
10 -1<br />
10 0<br />
Conc [µM]<br />
10 -1<br />
10 0<br />
Conc [µM]<br />
10 -1<br />
10 0<br />
Conc [µM]<br />
10 -1<br />
10 0<br />
Conc [µM]<br />
10 1<br />
10 1<br />
10 1<br />
10 1<br />
Protein Y is most likely the relevant cellular target<br />
Observed phenotypes are consistent with literature data about target MoA<br />
% Bound<br />
% Bound<br />
% Bound<br />
% Bound<br />
120<br />
100<br />
80<br />
20<br />
-20<br />
120<br />
100<br />
80<br />
20<br />
0<br />
-20<br />
140<br />
120<br />
100<br />
-20<br />
120<br />
100<br />
0<br />
20<br />
80<br />
20<br />
-20<br />
0<br />
0<br />
10 -2<br />
10 -2<br />
-2<br />
10<br />
-2<br />
10<br />
10 -1<br />
10 0<br />
Conc [µM]<br />
10 -1<br />
10 0<br />
Conc [µM]<br />
-1<br />
10<br />
Conc [µM]<br />
-1<br />
10<br />
Conc [µM]<br />
10 1<br />
10 1<br />
0 1<br />
10 10<br />
0 1<br />
10 10<br />
% Bound<br />
% Bound<br />
% Bound<br />
% Bound<br />
120<br />
100<br />
80<br />
20<br />
-20<br />
120<br />
100<br />
80<br />
20<br />
0<br />
-20<br />
0<br />
120<br />
100<br />
80<br />
20<br />
0<br />
-20<br />
120<br />
100<br />
80<br />
20<br />
0<br />
-20<br />
10 -2<br />
10 -2<br />
10 -2<br />
10 -2<br />
10 -1<br />
10 0<br />
Conc [µM]<br />
10 -1<br />
10 0<br />
Conc [µM]<br />
10 -1<br />
10 0<br />
Conc [µM]<br />
10 -1<br />
10 0<br />
Conc [µM]<br />
10 1<br />
10 1<br />
10 1<br />
10 1
PAGE 10<br />
Cellular Target Profiling in sub-proteomes<br />
Cellular profiling of kinase inhibitors and epigenetics drugs<br />
• Fast, reliable profiling of sub-proteomes of interest<br />
• High quality native selectivity data for kinase inhibitors or epigenetic drugs<br />
• Correlation of in vivo data with native target information to support the selection of drug candidates in a<br />
variety of medical indications<br />
• KinAffinity ® facilitates profiling against more than 300 native kinases<br />
• KinAffinity ® allows for identification of additional kinase targets not<br />
detectable by kinase panel screening<br />
• Epigenetics Target Profiling ® facilitates profiling of epigenetics<br />
drugs under native conditions<br />
Extensive kinome coverage
Extensive Kinome Coverage<br />
PAGE 11<br />
KinAffinity <br />
Fast profiling of endogenously expressed kinases using a generic matrix<br />
Using KinAffinity , more than<br />
300 protein kinases from all<br />
kinase families can be enriched<br />
for cellular profiling (red dots).<br />
On average, 100-200 kinases<br />
can be profiled in one cell-line /<br />
per single experiment<br />
Kinase domain sequences were taken from Manning, G. et al., The protein kinase complement of<br />
the human genome. Science, 298 (2002), 1912-34. The kinome tree was constructed using<br />
ClustalW2 [Larkin, MA. et al., Clustal W and Clustal X version 2.0., Bioinformatics, 23 (2007),<br />
2947-8] and Dendroscope [Huson, DH. et al., Dendroscope: An interactive viewer for large<br />
phylogenetic trees. BMC Bioinformatics, 8 (2007), 460].
0,01<br />
0,1<br />
1<br />
10<br />
K d[µM]<br />
PAGE 12<br />
MAP4K5<br />
GAK<br />
ABL2<br />
ABL1<br />
LYN<br />
MAP4K3<br />
FYN<br />
SRC<br />
MAP4K4<br />
FRK<br />
CSK<br />
QIK<br />
EphA2<br />
EphB4<br />
MAP2K2<br />
ACK<br />
TNIK<br />
QSK<br />
SLK<br />
MAP2K1<br />
MAP3K2<br />
LOK<br />
YES<br />
MYT1<br />
ZAK<br />
EphB2<br />
FAK<br />
MAP3K4<br />
GCN2<br />
CK1d<br />
FER<br />
IKKe<br />
MST4<br />
MST3<br />
MST1<br />
SYK<br />
MAP2K6<br />
PYK2<br />
LRRK2<br />
ILK<br />
MST2<br />
TLK2<br />
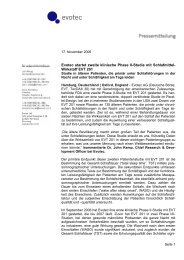
Target profile of bosutinib in PC3 cells<br />
KinAffinity <br />
Native kinome profiling<br />
Bosutinib (SKI606, Wyeth) is currently tested in breast<br />
cancer and CML<br />
KinAffinity ® enriched nearly 200 endogenously expressed<br />
kinases from human prostate cancer (PC3) cells<br />
45 of these kinases were identified as molecular targets of<br />
bosutinib<br />
N<br />
O<br />
N O N<br />
Cl Cl<br />
HN O<br />
N
0,01<br />
0,1<br />
1<br />
K d[µM]<br />
PAGE 13<br />
DDR1<br />
BCR<br />
ABL1<br />
ABL2<br />
PIP4K2A<br />
PIP4K2C<br />
Target profile of imatinib in K562 cells<br />
KinAffinity <br />
Native kinome profiling of type II inhibitors<br />
Imatinib (Gleevec , Novartis) is approved for the treatment of<br />
CML and GIST and is known to inhibit several tyrosine<br />
kinases<br />
KinAffinity identified imatinib’s main kinase targets with the<br />
exception of PDGFR, which is not expressed in K562 cells<br />
N<br />
N<br />
N<br />
N NH<br />
H<br />
O<br />
N<br />
N
0,1<br />
1<br />
10<br />
K d M<br />
PAGE 14<br />
K d [µM]<br />
MIER3<br />
C16orf87<br />
SIN3A<br />
SIN3B<br />
MIER1<br />
NCOR1<br />
RCOR2<br />
NCOR2<br />
MIER2<br />
CHD3<br />
GPS2<br />
BHC80<br />
ZNF217<br />
GSE1<br />
BRAF35<br />
CoREST<br />
HDAC1<br />
RERE<br />
ZNF261<br />
AOF2<br />
GATAD2A<br />
RCOR3<br />
HDAC2<br />
IRA1<br />
WDR5<br />
MTA3<br />
TBL1<br />
GATAD2B<br />
CHD4<br />
MTA1<br />
MBD3<br />
RBBP4<br />
HMG20A<br />
HDAC3<br />
MTA2<br />
ISOC2<br />
ZNF198<br />
RBBP7<br />
HDAC6<br />
DBP5<br />
MBD2<br />
KPNA3<br />
PP3476<br />
HDAC10<br />
KPNA4<br />
LAMB2<br />
ALDH2<br />
MBLAC2<br />
CK2a1<br />
ALDH1B1<br />
TTC38<br />
HDAC8<br />
Epigenetics Target Profiling <br />
Profiling of SAHA (Vorinostat) using a generic matrix<br />
80<br />
80<br />
60<br />
60<br />
40<br />
40<br />
HDAC1 20<br />
20<br />
0,19<br />
120<br />
100<br />
100<br />
80<br />
80<br />
60<br />
60<br />
40<br />
HDAC4 40<br />
-<br />
20<br />
20<br />
% Bound<br />
0<br />
-20<br />
120<br />
20<br />
0<br />
-20<br />
1<br />
10 102<br />
Conc [µM]<br />
120<br />
120<br />
100<br />
100<br />
80<br />
80<br />
60<br />
60<br />
40<br />
HDAC5 40<br />
-<br />
20<br />
20<br />
100<br />
100<br />
80<br />
80<br />
60<br />
60<br />
HDAC7 -<br />
40<br />
40<br />
% Bound<br />
% Bound<br />
0<br />
-20<br />
120<br />
20<br />
0<br />
-20<br />
1<br />
10 102<br />
Conc [µM]<br />
120<br />
100<br />
100<br />
80<br />
80<br />
60<br />
60<br />
HDAC6 40<br />
0,43<br />
40<br />
1<br />
10 102<br />
Conc [µM]<br />
120<br />
100<br />
100<br />
80<br />
80<br />
60<br />
60<br />
HDAC8 6,5<br />
40<br />
40<br />
% Bound<br />
120<br />
20<br />
0<br />
-20<br />
1<br />
10 102<br />
Conc [µM]<br />
100<br />
100<br />
80<br />
80<br />
60<br />
60<br />
HDAC10 0,79<br />
40<br />
40<br />
% Bound<br />
% Bound<br />
% Bound<br />
120<br />
100<br />
0<br />
-20<br />
120<br />
100<br />
0<br />
-20<br />
120<br />
20<br />
0<br />
-20<br />
1<br />
10 102<br />
Conc [µM]<br />
80<br />
80<br />
60<br />
60<br />
40<br />
40<br />
HDAC2 0,24<br />
20<br />
20<br />
% Bound<br />
120<br />
100<br />
0<br />
-20<br />
1<br />
10 102<br />
Conc [µM]<br />
80<br />
80<br />
60<br />
60<br />
40<br />
40<br />
HDAC3 0,35<br />
20<br />
20<br />
HDAC<br />
Known HDAC complex partner<br />
Other proteins<br />
Target profile in human ovarian cancer (A2780) cells<br />
% Bound<br />
Binding Competition K d M<br />
1<br />
10 102<br />
Conc [µM]<br />
1<br />
10 102<br />
Conc [µM]<br />
1<br />
10 102<br />
Conc [µM]<br />
% Bound<br />
% Bound<br />
% Bound<br />
% Bound<br />
% Bound<br />
% Bound<br />
% Bound<br />
% Bound<br />
% Bound<br />
120<br />
100<br />
0<br />
-20<br />
120<br />
100<br />
0<br />
-20<br />
120<br />
100<br />
0<br />
-20<br />
120<br />
0<br />
-20<br />
0<br />
-20<br />
20<br />
0<br />
-20<br />
120<br />
20<br />
0<br />
-20<br />
20<br />
0<br />
-20<br />
120<br />
20<br />
0<br />
-20<br />
-2<br />
10 10-1 100 101<br />
Conc [µM]<br />
-2<br />
10 10-1 100 101<br />
Conc [µM]<br />
-2<br />
10 10-1 100 101<br />
Conc [µM]<br />
-2<br />
10 10-1 100 101<br />
Conc [µM]<br />
-2<br />
10 10-1 100 101<br />
Conc [µM]<br />
-2<br />
10 10-1<br />
Conc [µM]<br />
100 101<br />
-2<br />
10 10-1 100 101<br />
Conc [µM]<br />
-2<br />
10 10-1 100 101<br />
Conc [µM]<br />
-2<br />
10 10-1 100 101<br />
Conc [µM]<br />
Epigenetics Target Profiling allows for<br />
maximum HDAC coverage and constitutes<br />
a native assay under conditions that<br />
preserve the integrity of HDAC complexes
PAGE 15<br />
Quantitative proteomics and in vivo PTM analysis<br />
Mode of Action analysis of targeted drugs & biomarker identification<br />
• High-end mass spectrometry and software applications facilitate quantitative analyses of the complete<br />
proteome or protein modifications such as phosphorylation or acetylation in living cells, tissue or<br />
patient samples<br />
• Monitoring of global protein expression changes and comprehensive investigation of signaling<br />
pathways to determine the influence of drug treatment, age, disease state or mutation status on<br />
biological systems<br />
• Applications include mode of action analysis of targeted<br />
drugs and discovery of biomarkers (protein<br />
expression, phosphorylation, acetylation) for patient<br />
stratification<br />
Non-responder Responder<br />
P<br />
P<br />
P<br />
P<br />
P<br />
gene expression<br />
proliferation<br />
P<br />
P<br />
Biomarker<br />
P<br />
P<br />
P<br />
P<br />
P<br />
P<br />
gene expression<br />
proliferation<br />
P<br />
P<br />
Biomarker<br />
P
PAGE 16<br />
Complete Proteome Analysis<br />
Large-scale, label-free quantification of proteins<br />
Recent advances in sample processing and mass spectrometry enables fast<br />
identification of ~7,000 proteins per cell line<br />
In a comparative proteomics analysis co-published by <strong>Evotec</strong> <strong>Munich</strong> scientists,<br />
more than 10,000 proteins were identified across 11 cell lines (this corresponds to<br />
51% of the human genes)<br />
Comparisons with deep sequencing data indicate this<br />
covers most of the proteome expressed in human cancer<br />
cell lines<br />
Proteome profiling has thus reached a level of<br />
comprehensiveness similar to mRNA profiling<br />
Geiger et al, 2012,, MCP, 11, M111 014050<br />
Schaab et al., 2012, MCP, 11, M111 014068
PAGE 17<br />
PhosphoScout ®<br />
Mode of Action analysis of targeted drugs & biomarker identification<br />
Quantitative mass spectrometry to facilitate unbiased monitoring of dynamic phosphorylation events in vivo<br />
on a global scale<br />
Reliable measurement of more than 15,000 phosphorylation sites in a single experiment<br />
Isotopic labeling<br />
protein<br />
preparation<br />
P<br />
enzymetic<br />
cleavage<br />
SCX<br />
Global phosphoproteome<br />
enrichment<br />
LC-MS/MS Data Analysis<br />
I<br />
MS<br />
m/z<br />
MaxQuant Software<br />
(Dept. M. Mann, MPI)<br />
Unbiased, global quantitative<br />
phosphoproteome analysis<br />
I<br />
MS/MS<br />
m/z<br />
G-V-S-P-A-W-R<br />
P<br />
PhosphoScout ® Workflow<br />
P
PAGE 18<br />
PhosphoScout ® - Case Study Sorafenib (Nexavar ® )<br />
Experimental design & Identification of regulated phosphorylation sites<br />
Control Treated (30 min) Treated (90 min)<br />
PhosphoScout ® workflow<br />
Sorafenib<br />
Phosphorylations from 3 biological replicates All P-sites<br />
No. of detected phosphorylation sites 15,825<br />
No. of detected proteins with phosphorylation sites 3,931<br />
No. of regulated sites 1,012<br />
No. of proteins with regulated phosphorylation sites 605<br />
PC-3 (human prostate<br />
cancer) cells<br />
Only class I sites (phosphorylation sites that could be localized<br />
within the peptide sequence with high confidence ) were used<br />
in our pathway analysis<br />
Identification of differentially regulated phosphorylation sites at<br />
a false discovery rate of 5% based on a global rank test
MAPK-Pathway<br />
PhosphoScout ® - Case Study Sorafenib (Nexavar ® )<br />
Data analysis - Identification of regulated protein networks<br />
mTOR Pathway<br />
The „SubExtractor“ algorithm integrates<br />
phosphoproteomics data with information<br />
from STRING protein/protein interactions<br />
to unbiasedly identify differentially<br />
regulated subnetworks<br />
PAGE 19 Klammer et al., 2010, BMC Bioinformatics,11:351
N<br />
O<br />
N<br />
PAGE 20<br />
O<br />
N<br />
O<br />
N<br />
F F<br />
F<br />
Cl<br />
PhosphoScout ® - Case Study Sorafenib (Nexavar ® )<br />
Data analysis – Analysis of regulated networks<br />
Translation<br />
P<br />
P<br />
10x up-regulated<br />
not regulated<br />
10x down-regulated
PAGE 21<br />
Acetylomics<br />
Mode of Action analysis of targeted drugs<br />
Comprehensive mass spectrometric analysis of global cellular<br />
acetylation in relevant biological samples<br />
Identification of novel acetylation sites and correlation of known<br />
acetylation effects with a drug‘s mechanism of action<br />
Acetylomics is an ideal tool to extend the mechanistic relevance and<br />
research interest in HDACs well beyond the field of chromatin<br />
biology<br />
Combination with <strong>Evotec</strong> <strong>Munich</strong>‘s additional services such as global<br />
phosphoproteomics allows for a unique approach to study a drug‘s<br />
influence on a variety of post translational modifications<br />
Identification of regulated acetylation networks<br />
mean ratio treatment A<br />
mean ratio treatment B<br />
Comparison of differentially regulated<br />
acetylation-sites in dependence of different<br />
treatment conditions
Test sample set<br />
(cell lines, xenografts,<br />
patient samples)<br />
PAGE 22<br />
Proteome and Phosphoproteome Biomarker<br />
Discovery – Complementary Approaches<br />
Measurement of 10.000+ Phosphosites and/or 6.000+ Proteins<br />
Quantitative<br />
phosphoproteome<br />
profiling<br />
Quantitative<br />
proteome<br />
profiling<br />
responder<br />
non-resp.<br />
responder<br />
non-resp.<br />
PTM sites<br />
Protein expression<br />
Global analysis of cellular kinase<br />
activity<br />
Direct linkage with kinase function<br />
Analyses of other PTMs possible, such<br />
as lysine acetylation for HDACs<br />
Global analysis of cellular protein<br />
levels<br />
Target class independent<br />
Adapted to small sample sizes<br />
Easy transition from discovery to<br />
validation/routine analysis
PAGE 23<br />
Summary<br />
<strong>Evotec</strong> <strong>Munich</strong> provides state-of-the art Cellular Target Profiling ® to identify a small molecule‘s<br />
on/off-target interactions on a proteom wide level or on subproteomic target classes of interest<br />
Quantitative mass spectrometry is employed to monitor dynamic post translational modification<br />
events in vivo on a global scale that enables correlation of known PTM effects with a drug‘s<br />
mechanism of action<br />
<strong>Evotec</strong> <strong>Munich</strong> offers service technologies that facilitate a comprehensive cellular global<br />
mode of action analysis of targeted drugs
Your contact:<br />
proteomics@evotec.com<br />
Building innovative<br />
drug discovery alliances