advanced water treatment with ozone and slow sand filtration - eWISA
advanced water treatment with ozone and slow sand filtration - eWISA
advanced water treatment with ozone and slow sand filtration - eWISA

You also want an ePaper? Increase the reach of your titles
YUMPU automatically turns print PDFs into web optimized ePapers that Google loves.
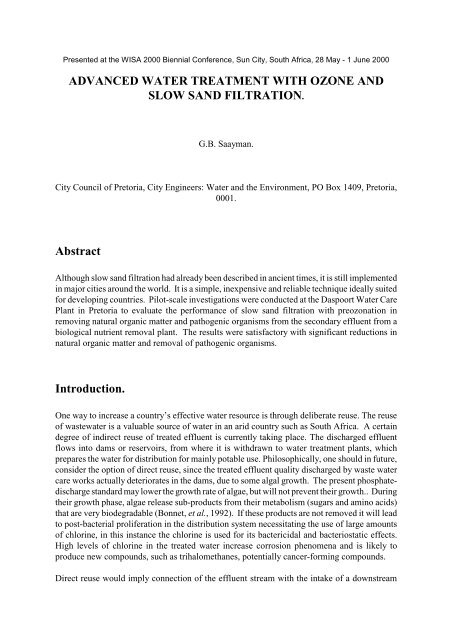
Presented at the WISA 2000 Biennial Conference, Sun City, South Africa, 28 May - 1 June 2000<br />
ADVANCED WATER TREATMENT WITH OZONE AND<br />
SLOW SAND FILTRATION.<br />
G.B. Saayman.<br />
City Council of Pretoria, City Engineers: Water <strong>and</strong> the Environment, PO Box 1409, Pretoria,<br />
0001.<br />
Abstract<br />
Although <strong>slow</strong> s<strong>and</strong> <strong>filtration</strong> had already been described in ancient times, it is still implemented<br />
in major cities around the world. It is a simple, inexpensive <strong>and</strong> reliable technique ideally suited<br />
for developing countries. Pilot-scale investigations were conducted at the Daspoort Water Care<br />
Plant in Pretoria to evaluate the performance of <strong>slow</strong> s<strong>and</strong> <strong>filtration</strong> <strong>with</strong> preozonation in<br />
removing natural organic matter <strong>and</strong> pathogenic organisms from the secondary effluent from a<br />
biological nutrient removal plant. The results were satisfactory <strong>with</strong> significant reductions in<br />
natural organic matter <strong>and</strong> removal of pathogenic organisms.<br />
Introduction.<br />
One way to increase a country’s effective <strong>water</strong> resource is through deliberate reuse. The reuse<br />
of waste<strong>water</strong> is a valuable source of <strong>water</strong> in an arid country such as South Africa. A certain<br />
degree of indirect reuse of treated effluent is currently taking place. The discharged effluent<br />
flows into dams or reservoirs, from where it is <strong>with</strong>drawn to <strong>water</strong> <strong>treatment</strong> plants, which<br />
prepares the <strong>water</strong> for distribution for mainly potable use. Philosophically, one should in future,<br />
consider the option of direct reuse, since the treated effluent quality discharged by waste <strong>water</strong><br />
care works actually deteriorates in the dams, due to some algal growth. The present phosphatedischarge<br />
st<strong>and</strong>ard may lower the growth rate of algae, but will not prevent their growth.. During<br />
their growth phase, algae release sub-products from their metabolism (sugars <strong>and</strong> amino acids)<br />
that are very biodegradable (Bonnet, et al., 1992). If these products are not removed it will lead<br />
to post-bacterial proliferation in the distribution system necessitating the use of large amounts<br />
of chlorine, in this instance the chlorine is used for its bactericidal <strong>and</strong> bacteriostatic effects.<br />
High levels of chlorine in the treated <strong>water</strong> increase corrosion phenomena <strong>and</strong> is likely to<br />
produce new compounds, such as trihalomethanes, potentially cancer-forming compounds.<br />
Direct reuse would imply connection of the effluent stream <strong>with</strong> the intake of a downstream
potable <strong>water</strong> reclamation plant. This type of scheme would obviously require a higher chemical<br />
<strong>and</strong> microbiological quality effluent <strong>and</strong> some upgrading to the downstream <strong>treatment</strong> plant.<br />
Conventional waste <strong>water</strong> <strong>treatment</strong> plant effluent contains unacceptable levels of <strong>slow</strong>ly<br />
biodegradable dissolved organic compounds <strong>and</strong> pathogenic micro-organisms.<br />
Ozone can serve as a chemical oxidizing agent as well as a disinfectant. It does not produce<br />
halogenated organic compounds, unless bromide ions are present in the <strong>water</strong> being ozonized.<br />
Ozone is second only to fluorine in oxidative strength. The bacterial kill rate of <strong>ozone</strong> is about<br />
3 125 times that of chlorine. Ozone de-activates E. Coli, fungus, virus, <strong>and</strong> faecal coliforms by<br />
different means depending on the organism. In bacteria the reaction of <strong>ozone</strong> <strong>with</strong> the double<br />
bonds of fatty acids in the bacterial cell walls results in a change of cell permeability <strong>and</strong> leakage<br />
of cell content. In viruses, alteration of the protein capsid prevents the virus from being taken<br />
up by susceptible cells. This rupture <strong>and</strong> disintegration of the cell in a process called lysing takes<br />
seconds. Chlorine diffuses through the cell wall <strong>and</strong> results in death by attack of enzymes. This<br />
process can take minutes or even hours. Cyst organisms such as the Giardia cyst are the most<br />
resistant to all disinfectants, because of their protective shells. The extent of inactivation or<br />
destruction of microorganisms is related to the product (CT) of the concentration of disinfectant<br />
(C, in mg.l -1 ) times the contact time (T, in minutes).<br />
The United State Environmental Protection Agency (US EPA) promulgated regulations for the<br />
disinfection of drinking <strong>water</strong> which incorporate the concept of CT values. (US EPA, 1989). For<br />
disinfection <strong>with</strong> <strong>ozone</strong>, EPA recommends a maximum CT value of 2,9 mg.l -1 -min at<br />
temperatures below 1 O C decreasing to 0.48 mg.l -1 -min at 25 O C. At these values <strong>ozone</strong> will<br />
guarantee the inactivation of 99,9 % (3-logs) of Giardia cysts, <strong>and</strong> simultaneously, the<br />
inactivation to greater than 99,999 % (5-logs) of enteric viruses. Table 1 values are<br />
recommended by the US EPA for obtaining varying logarithms of inactivation of Giardia<br />
lamblia cyst <strong>with</strong> <strong>ozone</strong>. When even 0,5 log inactivation of Giardia cysts is obtained <strong>with</strong><br />
<strong>ozone</strong>, more than 5-logs of inactivation of enteric viruses will be obtained, along <strong>with</strong> total<br />
bacterial kills. Table 1 lists CT values recommended by the US EPA for obtaining varying<br />
logarithms of inactivation of Giardia lamblia cysts at varying temperatures.<br />
TABLE 1<br />
CT VALUES FOR INACTIVATION OF Giardia CYSTS BY OZONE (US EPA 1889)<br />
Logs of Inactivation<br />
Temperature, O C<br />
Microorganisms tend to concentrate at the gas-liquid surface of a bubble due to their surface<br />
active properties <strong>and</strong> are therefore exposed to higher levels of <strong>ozone</strong> than the residual <strong>ozone</strong><br />
found in the bulk of the <strong>water</strong>. The degree of microorganism inactivation is greatly improved<br />
for a system containing both <strong>ozone</strong> bubbles <strong>and</strong> an <strong>ozone</strong> residual compared to a system having<br />
only an <strong>ozone</strong> residual.<br />
Although there are a few organic compounds which are rapidly oxidized to destruction (i.e.<br />
formic acid, phenol), the greater majority are only partially oxidized, even by as strong an<br />
oxidizing agent as <strong>ozone</strong>, in an aqueous solution. One of the advantages of partial oxidation of<br />
organic compounds in <strong>water</strong> is that the compounds become more polar than they were originally.<br />
Polar groupings such as carbonyl (>C=O), carboxyl (-COOH), <strong>and</strong> hydroxyl (-OH) groups are<br />
formed. In the presence of polyvalent cations (calcium, magnesium, iron, aluminium,<br />
manganese), these polar groupings combines <strong>with</strong> the cations producing insoluble complexes<br />
which can be removed by <strong>filtration</strong>. This process called “micro flocculation”, the flocculation<br />
of soluble micro pollutants, has been described by Maier (1984).<br />
According to Grady, et al (1984) ozonation of activated sludge effluent resulted in an increase<br />
in low molecular weight material at the expense of larger molecular molecules. The reduction<br />
in molecular size <strong>and</strong> increased polarity is believed to make the molecules more readily<br />
assimilable for bacterial catabolism (Singer, 1988).<br />
In the <strong>water</strong> industry there is a misconception that <strong>slow</strong> s<strong>and</strong> <strong>filtration</strong> is an old-fashioned<br />
technology that has been rendered obsolete by advances in high-rate <strong>filtration</strong> techniques. Slow<br />
s<strong>and</strong> <strong>filtration</strong> is not outdated <strong>and</strong> is at least as efficient if not better than physico-chemical<br />
processes (Montiel, et al, 1989). A conventional <strong>slow</strong> s<strong>and</strong> filter requires no pre<strong>treatment</strong>. <strong>slow</strong><br />
s<strong>and</strong> filters can be successfully implemented where a lack of funding <strong>and</strong> expertise in the<br />
development, management <strong>and</strong> operation of complex projects exist.<br />
A number of researchers have investigated the application of <strong>slow</strong> s<strong>and</strong> <strong>filtration</strong> in the tertiary<br />
<strong>treatment</strong> of sewage effluent. A laboratory-scale <strong>slow</strong> s<strong>and</strong> <strong>filtration</strong> unit operated by Ellis<br />
(1987) consistently removed 90 % of the suspended solids, more than 65 % of the remaining<br />
BOD <strong>and</strong> over 95 % of the coliform organisms from settled biofilter effluent. The length of<br />
operational runs averaged 20 days at 3.5 m 3 .m -2 .d -1 <strong>and</strong> 13 days at 7.0 m 3 .m -2 .d -1 using a 0.6 mm<br />
effective s<strong>and</strong> size filter. Very good removal of total coliform bacteria <strong>and</strong> turbidity were found<br />
by Farooq <strong>and</strong> Al-Yousef (1993). Removal of biological oxygen dem<strong>and</strong> (BOD), (79-92 %),<br />
chemical oxygen dem<strong>and</strong> (40-60 %), st<strong>and</strong>ard plate count (88-93 %), nitrate (17-30 %),<br />
phosphate (8.3-8.4 %), <strong>and</strong> sulphate (5-10 %) at various s<strong>and</strong> depths <strong>and</strong> two different sizes of<br />
s<strong>and</strong> were observed by Farooq et al (1994). If filters are properly designed, constructed,<br />
operated, <strong>and</strong> maintained, they can be effective in removing Giardia cyst from a contaminated<br />
<strong>water</strong> source over a wide range of operating conditions. More research is necessary to determine<br />
the effectiveness of <strong>slow</strong> s<strong>and</strong> filters in removing Cryptosporidium oocysts (Fogel et al).<br />
However, according to Timms et al (1995) <strong>slow</strong> s<strong>and</strong> <strong>filtration</strong> is a highly efficient means of<br />
removing Cryptosporidium oocyst from <strong>water</strong>. A reduction of better than 99.997 % at <strong>filtration</strong><br />
rates of 9.6 m 3 .m -2 .d -1 was achieved. The oocysts were retained in the upper layers of the filter<br />
bed <strong>and</strong> showed no sign of moving to lower levels. This characteristic of the <strong>slow</strong> s<strong>and</strong> <strong>filtration</strong><br />
process makes it well suited for the protection of drinking <strong>water</strong> from Cryptosporidium. Poynter<br />
<strong>and</strong> Slade (1977) investigated the removal enteroviruses using attenuated polio virus type 1,<br />
naturally occurring bacteria <strong>and</strong> bacteriophage T7 from contaminated <strong>water</strong>. The <strong>slow</strong> s<strong>and</strong>
filters were found to be highly effective in removing viruses. In comparison bacteria were less<br />
<strong>and</strong> bacteriophages were more efficiently removed than the polio virus.<br />
Gould et al (1984) investigated the use of <strong>ozone</strong> <strong>and</strong> <strong>slow</strong> s<strong>and</strong> <strong>filtration</strong> in removal of humic<br />
colour from <strong>water</strong>. Their results show that approximately 10 % of the total organic carbon<br />
(TOC) was removed by <strong>slow</strong> s<strong>and</strong> <strong>filtration</strong>. With pre-ozonation TOC removal increases to<br />
25%.<br />
The objective of this study is demonstrate on pilot scale the application of <strong>slow</strong> s<strong>and</strong> <strong>filtration</strong><br />
<strong>with</strong> pre-ozonation as a means of tertiary <strong>treatment</strong> of secondary effluent from an activatedsludge<br />
plant to meet the requirements for the direct production of save drinking <strong>water</strong>.<br />
Material <strong>and</strong> methods,<br />
This study was undertaken using two pilot-scale <strong>slow</strong><br />
s<strong>and</strong> filters at the Daspoort Water Care Plant in<br />
Pretoria where a high quality effluent from a effective<br />
biological nutrient removal was available.<br />
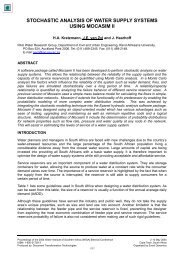
Ozonation.<br />
Ozone was generated on site using an Ozonia Ozat<br />
type CFS-1 <strong>ozone</strong> generator <strong>with</strong> a nominal production<br />
65 g O 3.h -1 at a nominal concentration of 6 % (w/w)<br />
using pure oxygen. The <strong>ozone</strong> transfer efficiency of<br />
counter flow bubble column contactor is better than a<br />
packed column system (Gould et al, 1984). Therefore,<br />
use was made of a counter flow bubble column<br />
contactor, 7 m high <strong>and</strong> 300 mm in diameter. The<br />
effective <strong>water</strong> depth was 6 m (Figure 1). A painted<br />
steel pipe was used. The feed <strong>water</strong> was introduced at<br />
the top of the column, while the <strong>ozone</strong> was let in at the<br />
bottom. The <strong>ozone</strong> was evenly dispersed through a<br />
fine bubble diffuser. Initially a diffuser made from<br />
compressed polyethylene balls was used. This diffuser<br />
was not <strong>ozone</strong>-resistant <strong>and</strong> was replaced by a<br />
Figure 1 Counter flow bubble<br />
column contactor.<br />
Carborundum diffuser. Ozone that was not utilized in the column was wasted into the<br />
atmosphere. To determine the <strong>ozone</strong> transfer efficiency the <strong>ozone</strong> concentration in the inlet of<br />
the counter flow bubble column <strong>and</strong> the gases escaping from the top of the column was<br />
measured.<br />
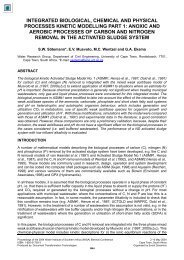
Slow s<strong>and</strong> filters.<br />
The pilot plant, shown diagrammatically in Figure 2, consisted of two <strong>slow</strong> s<strong>and</strong> filters operating<br />
in parallel. The diameter of the circular spiral wound polyethylene filters were 2.5 m <strong>and</strong> the total<br />
height 2.8 m .This provided a filter area of 4.91 m 2 per filter. At a <strong>filtration</strong> rate of 7 l.min >1 ,<br />
the filter loading rate was ca 2 m 3 .m -2 .d -1 or 2 m.d -1 .
Figure 2 Slow s<strong>and</strong> filter.<br />
The filter beds consisted of a 1 000 mm layer of fine s<strong>and</strong> <strong>with</strong> an effective size of 0.35 mm <strong>and</strong><br />
a uniformity coefficient of 2.5. Underneath the s<strong>and</strong> was a 300 mm layer of gravel (5 - 13 mm).<br />
The <strong>water</strong> depth above the s<strong>and</strong> was controlled at 1 200 mm by a float valve fitted to the outlet<br />
of the filter. The <strong>filtration</strong> rate was adjusted by means of a gate valve on the outlet of the float<br />
valve basin. An overflow in the inlet to the filter ensured the level of the <strong>water</strong> <strong>and</strong> thus the<br />
loading rate of the filter. Head losses were measured <strong>with</strong> manometers at 300 mm, 600 mm, <strong>and</strong><br />
in the gravel below the fine s<strong>and</strong> layer. The was no under drain system, the effluent were drawn<br />
off from the centre of the filter in the gravel layer.<br />
Sampling<br />
Two grab samples per week of the raw feed, ozonated feed, <strong>and</strong> filtrate were collected <strong>and</strong><br />
analysed. During the initial stages of the experiment it was argued that because the loading rate<br />
of the filters was 2 m.d -1 effluent sample must be collected 24 hours after the influent sample in<br />
order to compare the results. However, no significant differences were observed in the removal<br />
rates calculated on samples collected on the same day <strong>and</strong> those collected 24 hours apart.<br />
Analytical methods<br />
St<strong>and</strong>ard analytical techniques were applied to determination of chemical parameters <strong>and</strong><br />
bacterial count in the samples.<br />
Use was made of an Aquadoc Analyzer to measure the organic carbon content of the <strong>water</strong>. The<br />
analyser utilizes the persulphate-ultraviolet oxidation method, which is a rapid <strong>and</strong> precise<br />
method for the measurement of trace levels of dissolved organic carbon in <strong>water</strong>. Before<br />
measuring the DOC the samples are filtered through 0.45 µm filters.<br />
Experimental Design
For the first day of every filter run the secondary effluent from the biological nutrient removal<br />
plant was let into the filter <strong>with</strong>out <strong>ozone</strong> pre<strong>treatment</strong>. This was done to ensure the<br />
establishment of an active layer on bacteria on the s<strong>and</strong> media surface.<br />
Experiment 1<br />
Water was extracted from a holding pond <strong>with</strong> hydraulic retention time of 12 hours. In this pond<br />
further sedimentation takes place resulting in <strong>water</strong> <strong>with</strong> low suspended solids. The bottom of<br />
this pond must be scoured on a regular basis.<br />
Filter 1 received <strong>water</strong> ozonated at a rate of 1.75 mg O 3 / mg DOC. The other was used as a<br />
control <strong>and</strong> received untreated <strong>water</strong>. Due to problems in the commissioning of the control filter<br />
(Filter 2) <strong>filtration</strong> started twenty days later than the filter receiving ozonated <strong>water</strong>.<br />
Experiment 2<br />
This run was a repeat of the first run. However, the <strong>water</strong> was extracted directly after the<br />
secondary settling tank. The suspended biomass in the secondary effluent blocked the filter<br />
receiving untreated <strong>water</strong> (Filter 2) <strong>with</strong>in nine days <strong>and</strong> the filter receiving ozonated (Filter 2)<br />
<strong>water</strong> after thirteen days. The experiment was terminated after sixteen days. To overcome this<br />
problem a coarse s<strong>and</strong> filter was installed. A normal swimming pool filter was used.. This filter<br />
was back washed once a day.<br />
Experiment 3<br />
In experiment 3 the feed to Filter 1 was initially ozonated at a rate of 1.82 mg O 3 / mg DOC.<br />
This dosage was decreased to 1.46 mg O 3 / mg DOC on day 25. Filter 2 received untreated<br />
<strong>water</strong>. Removal attributable to ozonation, before <strong>filtration</strong>, was also measured.<br />
Experiment 4<br />
Both filters received <strong>water</strong> ozonated at a rate of 0.75 mg O 3 / mg DOC. Filter 1 was protected<br />
against sunlight to prevent the growth of algae.<br />
Experiment 5<br />
Both filters received ozonated <strong>water</strong>. Filter 1 was protected against sunlight to prevent the<br />
growth of algae. The <strong>water</strong> in the <strong>ozone</strong> contact column was recycled through a germicidal<br />
ultraviolet light unit in order to enhance the oxidation potential of the <strong>ozone</strong>. During the first<br />
twenty five days a <strong>ozone</strong> dosage of 1.04 mg O 3 / mg DOC was maintained. The dosage was<br />
increased to 2.48 mg O 3 / mg DOC for the remainder of the filter run.<br />
Experiment 6<br />
Both filters received <strong>water</strong> ozonated at a rate of 1.08 mg O 3 / mg DOC. Both filters were<br />
exposed to sunlight to allow the growth of algae. The <strong>filtration</strong> rates were 4 m 3 .m -2 .d -1 <strong>and</strong><br />
2 m 3 .m -2 .d -1 through Filter 1 <strong>and</strong> Filter 2 respectively.
Table 2 summarize the various experimental conditions.<br />
Table 2 : Summary of experimental conditions.<br />
Experiment<br />
number 1 2 3 4 5 6<br />
Ozonated feed<br />
monitored No No Yes Yes Yes Yes<br />
Filter 1 1.75 mg 1.67 mg<br />
1.82 mg<br />
1.46 mg<br />
Filter 2 Control Control Control<br />
0.75 mg<br />
Covered<br />
0.75 mg<br />
Open<br />
1.04 mg<br />
2.48 mg<br />
+UV Covered<br />
1.04 mg<br />
2.48 mg<br />
+UV Open<br />
1.08 mg<br />
4 m 3 .m -2 .d -1<br />
1.08 mg<br />
2 m 3 .m -2 .d -1<br />
Dosage in mg O 3 per mg DOC (average calculated dosages). Filtration rate 2 m 3 .m -2 .d -1 (exception in<br />
Experiment 6)<br />
Results <strong>and</strong> Discussion<br />
The methods used for the physical <strong>and</strong> chemical examination of the samples were the same as<br />
those adopted for the analysis of potable <strong>water</strong> The details of the analytical results are<br />
summarize in Table 3.
Feed <strong>water</strong><br />
TABLE 3<br />
Average Analytical Results under various Experimental Conditions.<br />
Experiment 1 2 3 4 5 6<br />
Colour in Hazen units 9.2 13.8 12.9 10.4 10.6 9.5<br />
Turbidity NTU 3.3 3 1.6 1.3 1.4 2<br />
Nitrate as mg N/l 4.2 5.3 3.3 5.5 6.1 4.9<br />
Ammonia as mg N/l 6.3 4.2 4.4 6.5 5.3 5<br />
o-Phosphate as mg P/l 0.5 0.3 0.8 0.4 1.2 0.2<br />
DOC 11.8 11.6 11.8 12.8 14.3 13.4<br />
Feed <strong>water</strong> after ozonation<br />
Colour in Hazen units 8.7 6.8 8.4 6.5<br />
Turbidity NTU 1.1 1.0 1.2 1.5<br />
Nitrate as mg N/l<br />
3.6<br />
5 3.7 4.9<br />
Ammonia as mg N/l 4 6.4 5.3 5<br />
o-Phosphate as mg P/l 0.8 0.3 1.2 0.3<br />
DOC 10.9 12.2 13.7 12.1<br />
Filter 1<br />
Colour in Hazen units 2.9 3.5 3.8 4.4 5.3 5.3<br />
Turbidity NTU 0.5 0.3 0.5 0.3 0.3 0.3<br />
Nitrate as mg N/l 5.5 7.1 5 5.9 5.9 6.3<br />
Ammonia as mg N/l 0.4 0.1 0.2 0.3 0.4 0<br />
o-Phosphate as mg P/l 0.9 0.4 0.9 0.5 0.2 0.5<br />
DOC 8.7 9.6 7.7 9.5 10.7 10.5<br />
Filter 2<br />
Colour in Hazen units 5.1 6.2 7.1 5.2 5.1 5<br />
Turbidity 0.6 0.5 0.5 0.4 0.3 0.2<br />
Nitrate as mg N/l 5.9 5.8 4.2 5.5 5.9 6.6<br />
Ammonia as mg N/l 0.6 0.3 0.3 0.3 0.4 0<br />
o-Phosphate as mg P/l 1 0.5 1.01 0.5 0.2 0.5<br />
DOC 10.7 10.8 10.5 9 10.6 9.6
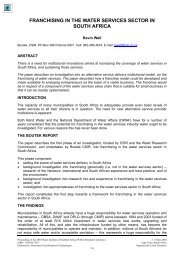
Figure 4 Changes in the Nitrate-N<br />
concentrations under various<br />
experimental conditions.<br />
Nitrification <strong>and</strong> Denitrification<br />
The changes in the nitrate-nitrogen <strong>and</strong> saline<br />
ammonium-nitrogen are plotted in Figure 3<br />
<strong>and</strong> Figure 4 respectively.<br />
The influent nitrate-N concentrations range<br />
from 3.3 to 5.5 mg N.l -1 (Table 3), whereas<br />
the effluent concentrations ranged from 4.2 to<br />
7.1 mg N.l -1 . Ellis (1993) <strong>and</strong> Farooq et al<br />
(1994) reported a nett removal of nitrate-N.<br />
However, from their reports it is not clear<br />
whether the effluent used contained any saline<br />
ammonium-N. The saline ammonium-N<br />
concentration of the effluent use in this<br />
investigation ranged from 4.2 to 6.5 mg N.l -1 .<br />
Virtually complete nitrification of this<br />
ammonium-N was observed (Figure 4). The<br />
total nitrogen (sum of the nitrate-N <strong>and</strong> ammonium-N) as a percentage of the influent value is<br />
plotted in Figure 5. From this figure it is clear that more than 40 % of the influent nitrogen was<br />
removed in the <strong>slow</strong> s<strong>and</strong> filter. The factors commonly favouring nitrification are dissolved<br />
oxygen (DO), pH, <strong>and</strong> temperature. The influent pH range of 7.04 <strong>and</strong> 7.83, is in the excellent<br />
range. DO levels were not measured but the <strong>water</strong> leaving the <strong>ozone</strong> column will be saturated<br />
<strong>with</strong> pure oxygen, therefore, the DO levels above the s<strong>and</strong> layer should be sufficient to promote<br />
nitrification. From this it can be concluded that nitrification is possible in the upper biological<br />
active layer of the filter. Denitrification is<br />
considered to be an anoxic process, occurring<br />
in the absence of oxygen, <strong>and</strong> requires an<br />
organic or inorganic electron donor. Bacteria<br />
capable of denitrification are both<br />
heterotrophic <strong>and</strong> autotrophic. As the <strong>water</strong><br />
percolates through the biological layer in the<br />
presence of biodegradable organic carbon<br />
compounds the DO is depleted. The DO<br />
levels in the s<strong>and</strong> will be low. If some of the<br />
DOC measured in the effluent of the filter is<br />
biodegradable denitrification will take place<br />
in the s<strong>and</strong> layer. This conclusion is<br />
supported by the observations of Farooq et al<br />
(1994) that denitrification decreases <strong>with</strong><br />
decreasing filter depth.<br />
Figure 3 Nitrification of saline ammonium-<br />
N under various experimental<br />
conditions.<br />
The extend of denitrification in all the<br />
Experiments was similar as can be see in<br />
Figure 5. The denitrification measured in<br />
Experiment 3 is plotted in Figure 6. The initial dosage in this Experiment was 1.82 mg O 3 /mg<br />
DOC . On day 25 this was lowered to 1.46 mg O 3 /mg DOC.
Figure 5 Denitrification under various<br />
experimental conditions<br />
nitrogen removal can be attributed directly to<br />
ozonation. The average nitrogen removal in<br />
the filters was 40.0% <strong>with</strong> ozonation <strong>and</strong><br />
38.4% <strong>with</strong>out.<br />
The Effect of Slow S<strong>and</strong> Filtration on Ortho-phosphate.<br />
Figure 7 The release(+)/uptake(-) of<br />
phosphate under various<br />
experimental conditions.<br />
The difference in the denitrification from<br />
treated <strong>and</strong> untreated <strong>water</strong> was rather small,<br />
however, in the filter receiving ozonated<br />
<strong>water</strong> the denitrification was slightly higher.<br />
From Figure 6 it is also clear that little or no<br />
Figure 6 Total nitrogen ( NH 4-N + NO 3-N)<br />
measured in Experiment 3.<br />
The changes in the ortho-phosphate concentrations in the effluent of the various processes are<br />
illustrated in Figure 7. The values are expressed as a percentage of the incoming phosphate.<br />
The suspended solids in the secondary effluent used in this investigation consists mainly of<br />
activated sludge from a nutrient removal plant rich in phosphate. This phosphate is easily<br />
released under anaerobic <strong>and</strong> anoxic conditions.<br />
The o-phosphate concentrations in the feed<br />
<strong>water</strong> ranged from 0.3 to 0.8 mg P.l -1 . The<br />
phosphate concentrations in the filtrate<br />
produced from treated <strong>water</strong> ranged from 0.4<br />
to 1.1 <strong>and</strong> in the filtrate produced from<br />
untreated <strong>water</strong> 0.5 to 1.1 mg P.l -1 . This<br />
supports the conclusion that anoxic conditions<br />
develops in the filter where denitrification <strong>and</strong><br />
phosphate release are possible. The average<br />
release of phosphate in the filters ranged from<br />
23.3 % to 129.2 %. The average phosphate<br />
release for all the filter runs was 56.9 % In the<br />
filters receiving <strong>water</strong> treated <strong>with</strong> <strong>ozone</strong><br />
consistently more phosphate was released.<br />
In Experiments 3 <strong>and</strong> 4, uptake of phosphate,<br />
<strong>and</strong> in Experiment 5 <strong>and</strong> 6, release of<br />
phosphate was measured after treating the
<strong>water</strong> <strong>with</strong> <strong>ozone</strong>. It is, therefore, not possible to came to a valid conclusion on the effect of<br />
ozonation on the phosphate in the <strong>water</strong>.<br />
Turbidity <strong>and</strong> Colour<br />
The effect of ozonation <strong>and</strong>/or <strong>filtration</strong> is<br />
graphically represented in Figure 8 <strong>and</strong> Figure<br />
9. Regrettably the lower detection of the<br />
equipment available to measure colour was ca 5<br />
Hazen units, therefore values below 5 are not<br />
reliable. The colour of the incoming <strong>water</strong><br />
ranged from 9.2 to 13.8 Hazen units. After<br />
ozonation this was lower to 6.5 to 8.7 Hazen<br />
units. The colour of the filtrate <strong>with</strong>out <strong>ozone</strong><br />
pre<strong>treatment</strong> ranged from 5.1 to 7.1 units. In<br />
the experiments where the <strong>water</strong> was ozonated<br />
the colour of the filtrate ranged from 2.9 to 5.3<br />
units.<br />
Superficially it appears as if there is relation<br />
between the incoming colour intensity <strong>and</strong> the<br />
removal efficiency, however, the limitations of<br />
the equipment used in measuring the colour<br />
Figure 9 Percentage of the incoming turbidity<br />
removed under various experimental<br />
conditions.<br />
Figure 8 Percentage of the incoming colour<br />
removed under various<br />
experimental conditions.<br />
make such a statement invalid. To the naked<br />
eye the filtrate from the filters receiving <strong>ozone</strong><br />
treated <strong>water</strong> appears “colourless”. Without<br />
<strong>ozone</strong>, colour was still visible in the filtrate.<br />
Treating the influent <strong>water</strong> <strong>with</strong> <strong>ozone</strong> improve<br />
colour removal.<br />
The turbidity of incoming <strong>water</strong> ranged from<br />
0.9 to 4.9 NTU. The turbidity of the filtrate in<br />
al the experiments was less than 1 NTU. The<br />
individual values ranged from 0.2 to 1.1 NTU.<br />
Protecting the filter against sunlight have had<br />
no effect on the turbidity of the filtrate. Slow<br />
s<strong>and</strong> filters are known to very efficient in the<br />
removal of turbidity, its not surprising that<br />
treating the <strong>water</strong> <strong>with</strong> <strong>ozone</strong> before <strong>filtration</strong><br />
did not improve the removal significantly.<br />
Ozonation <strong>with</strong>out <strong>filtration</strong> removed between<br />
19.7% <strong>and</strong> 30.2% of the turbidity due to micro-flocculation. Although the centrifugal pump used<br />
in Experiment 5 to recycle the <strong>water</strong> across the <strong>ozone</strong> contact column might have caused<br />
shearing of floc, no increase in of the turbidity of the <strong>water</strong> entering the filters was observed.<br />
Organic Carbon<br />
The usual parameters to assess the organic quality of waste <strong>water</strong> are biological oxygen dem<strong>and</strong>
(BOD), oxygen absorbed (OA), <strong>and</strong> chemical oxygen dem<strong>and</strong> (COD). However, if the pollution<br />
level of <strong>water</strong> is low these parameters are not reliable indicators to use. In such cases dissolved<br />
organic carbon (DOC) is a better indicator of the organic quality. COD in the filtrate ranged from<br />
0 to 12 mg O.l -1 while the DOC range was 7.7 to 10.8 mg C.l -1 .<br />
Initially the effect of <strong>ozone</strong> <strong>with</strong>out <strong>filtration</strong> on the <strong>water</strong> quality was not monitored. Only after<br />
seeing the improvement in the visual appearance of the <strong>water</strong>, it was decided to determine the<br />
effect on the chemical quality. In Experiment 1 a mishap in the control filter delayed the<br />
commissioning of the filter by twenty days.<br />
The results are, therefore, not directly<br />
comparable <strong>and</strong> are plotted separately in<br />
Figures 10 <strong>and</strong> 11.<br />
Figure 10 DOC removed from ozonated<br />
secondary effluent by <strong>slow</strong> s<strong>and</strong><br />
<strong>filtration</strong>.<br />
In the control filter an active microbial<br />
population was established in twenty days. This<br />
longer filter ripening period in the filter<br />
receiving ozonated secondary effluent may be<br />
attributed to the residual <strong>ozone</strong> in the feed<br />
<strong>water</strong>. No time for the decomposition of the<br />
<strong>ozone</strong> was initially allowed because it was<br />
belief that <strong>ozone</strong> does not have a residual<br />
effect. At the end of Experiment 1 a holding<br />
tank <strong>with</strong> a ten minute retention time was<br />
installed.<br />
In this investigation time for filter ripening,<br />
which refers to the period normally allowed for<br />
the microbial development in the<br />
schmutzdecke <strong>and</strong> underlying filter media, was<br />
not allowed. From Figure 10 it is clear that<br />
filter ripening period was ca twenty-five days.<br />
Figure 11 DOC removed from secondary<br />
effluent by <strong>slow</strong> s<strong>and</strong> <strong>filtration</strong>.<br />
From an analysis of the Figure 10 <strong>and</strong> 11 one can state that ca 9% of the residual carbon<br />
compounds in this activated sludge plant is biodegradable, <strong>and</strong> that by treating the effluent <strong>with</strong><br />
<strong>ozone</strong> a further ca 19% is converted into compounds that are biodegradable.<br />
The secondary effluent used in Experiment 1 was <strong>with</strong>drawn from a holding pond, the suspended<br />
solids was less than 10 mg.l -1 . Normally the suspended solids in activated sludge is ca 15 mg.l -1 .<br />
Another observation is the sizes of the floc in the <strong>water</strong>. The floc in the <strong>water</strong> from the holding<br />
pond was smaller than the floc carried over in the settling tanks. In Experiment 2 <strong>water</strong> was<br />
abstracted from a canal direct downstream from the secondary settling tanks. The DOC removals<br />
achieved under this conditions are plotted in Figure 12.
The biomass in this <strong>water</strong> blocked the s<strong>and</strong> filters <strong>with</strong>in two weeks. The experiment was,<br />
therefore, terminated after sixteen days. It is<br />
evident that for long filter runs the floc must be<br />
small.<br />
Figure 12 Percentage of the incoming DOC<br />
removed in Experiment 2.<br />
In this experiment DOC removal stabilizes<br />
<strong>with</strong>in eight days in the filter receiving <strong>water</strong><br />
treated <strong>with</strong> <strong>ozone</strong>. In the normal operation of<br />
a <strong>slow</strong> s<strong>and</strong> filter the top layer is scrap off been<br />
filter runs. If the previously formed<br />
schmutzdecke is not removed carefully<br />
inoculation of the filter media for the next filter<br />
run will occur. As this was the only the second<br />
run, due to a lack in experience in removing the<br />
top layer, this could have happened. The lower<br />
dosage (1.67 mg O 3 against 1.75 mg O 3/ mg<br />
DOC) did not lower the degree of removal.<br />
To solve the problems of filter blockages resulting in short filter runs a coarse s<strong>and</strong> filter was<br />
installed to filter the feed <strong>water</strong> before ozonation.<br />
In Experiment 3 the effect of <strong>ozone</strong> on the DOC removal before <strong>filtration</strong> was monitored <strong>and</strong> the<br />
dosage were lower from 1.82 mg O 3 to 1.46 mg O 3/mg DOC after twenty-five days to test the<br />
sensitivity of DOC removal to the <strong>ozone</strong> dose. The DOC removal in Experiment 3 is plotted in<br />
Figure13.<br />
In this experiment there was no acclimatization<br />
period. Maximum DOC removal was<br />
observed right away. It is thus clear that the<br />
active population established on the media in<br />
Experiment 2 was not removed in the cleaning<br />
cycle.<br />
In this experiment the average DOC removed<br />
by ozonation <strong>with</strong>out <strong>filtration</strong> was 7.7%.<br />
Filtration <strong>with</strong>out ozonation removed 11.7%.<br />
From this it can be concluded that for the<br />
period of this experiment at least 4% of the<br />
incoming was biodegradable. Filter 1 removed<br />
on the average 35.9% of the incoming DOC. In<br />
this case 24.2% of the DOC in the secondary<br />
effluent was made biodegradable by ozonation.<br />
Figure 13 Percentage of the incoming DOC<br />
removed in Experiment 3<br />
Lowering the dosage from 1.82 mg O 3 /mg DOC to 1.46 mg O 3 /mg DOC has had a small impact<br />
on the amount of DOC removed. The differences between the amount of DOC removed in the<br />
filter receiving <strong>ozone</strong> treated <strong>water</strong> <strong>and</strong> the filter fed untreated <strong>water</strong> ranged from 18.2 to 29.8%<br />
at the higher dosage <strong>and</strong> 17.0 to 29.3% at the lower dosage (one day 42 an abnormal high<br />
difference of 37.5% was measure). From this it is clear that under specific conditions only certain<br />
organic compounds can be oxidized. If enough <strong>ozone</strong> is dosed to meet this dem<strong>and</strong> the excess
will be wasted.<br />
Figure 14 Percentage of the incoming<br />
dissolved organic carbon removed<br />
in Experiment 4.<br />
During the first experiments a layer of algae<br />
formed on top of the filters. To minimize the<br />
risk of the development of odours <strong>and</strong>/or tastes<br />
filter 1 in Experiment 4 was covered <strong>with</strong> a<br />
tarpaulin. In Experiment 4 both filters received<br />
secondary effluent ozonated at a rate of<br />
0.75 mg O 3 /mg DOC. The DOC removed in<br />
Experiment 4 is plotted in Figure 14 as a<br />
percentage of the incoming DOC.<br />
The average DOC removed in the filters was<br />
25.6% <strong>and</strong> 25.9%. Preventing the growth of<br />
algae in the filters did not affect the DOC<br />
removal negatively. This result was expected<br />
seeing that algae are autotrophic organisms.<br />
Limiting algae growth extended the filter run<br />
by 43%. The head loss limit set at 350 mm.<br />
was reached on day 71 in filter 2 <strong>and</strong> on day<br />
104 in filter 2.<br />
In Experiment 5 the influent to both the filters was ozonated. Filter 1 was covered to <strong>slow</strong> down<br />
or prevent algal growth. A recycling pump was installed to recycle the ozonated <strong>water</strong> from the<br />
bottom of the contact column through a germicidal ultra-violet light unit to the top. Ozone is<br />
photochemically decomposed by UV radiation forming hydroxyl free radicals (OH > ). In aqueous<br />
solution, these radicals are stronger oxidising agents than molecular <strong>ozone</strong>. The half-life of<br />
hydroxyl free radicals is in the order of microseconds, but considerable chemical oxidation of<br />
dissolved organic material may be possible. Most of spectral energy of a germicidal UV lamp<br />
is emitted at 254 nm. This wavelength is in the range for optimum destruction of <strong>ozone</strong> by UV.<br />
The degree of DOC removal observed in this experiment is plotted in Figure 15.<br />
At the dosage of 1.04 mg O 3 /mg DOC the<br />
average removal of DOC in solution after<br />
ozonation was 18.1% (range 11.3 to 23.5%).<br />
In comparison 19.2% of the DOC after<br />
ozonation was removed in Experiment 6<br />
under similar conditions. Increasing the<br />
dosage rate to 2.48 mg O 3 improved the DOC<br />
removal to 24.8% (range 13.1 to 35.6%), an<br />
increase of 37%. Apparently UV light did not<br />
enhance the oxidation process at this higher<br />
dosage level.<br />
In Experiments 3 the dosage of 1.46<br />
mg O 3/mg DOC removal was 40.8% higher<br />
than the removal at the dosage of 0.75 mg<br />
O 3/mg DOC in Experiment 4.<br />
Figure 15 Percentage of the incoming<br />
dissolved organic carbon removed<br />
in Experiment 5
Regrettably the UV unit was not available for further trails at lower dosages.<br />
In Experiment 6 the effect of <strong>filtration</strong> rate on<br />
DOC removal was investigated. The<br />
secondary effluent to both filters was treated<br />
<strong>with</strong> <strong>ozone</strong> at a rate of 1.08 mg O 3 / mg DOC.<br />
The DOC removed in this experiment is<br />
plotted in Figure 16.<br />
The <strong>filtration</strong> rate through Filter 1 was<br />
4 m.d >1 <strong>and</strong> through Filter 2, 2 m.d >1 . At the<br />
<strong>slow</strong>er <strong>filtration</strong> rate 27.9% of the incoming<br />
dissolved organic carbon was removed <strong>and</strong> at<br />
the faster rate 22.1%. The experiment was<br />
terminated on day 34 because the head loss in<br />
Filter 1 had increased to 472 mm. In Filter 1<br />
the head loss was only 71 mm.<br />
Figure 16 Percentage of the incoming<br />
dissolved organic carbon removed<br />
at various filter loadings.<br />
At the <strong>filtration</strong> rate of 4 m.d >1 62.5% more<br />
dissolved organic carbon was removed, but the concentration of the residual DOC in the filtrate<br />
was higher. The objective of this investigation was to lower the concentration preferably to the<br />
potable target <strong>water</strong> quality range of 0 > 5 mg C .l >1 .<br />
At the higher filter loading the length of the filter run was also reduced substantially.<br />
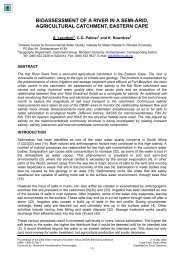
Figure 17 The relationship between <strong>ozone</strong> dosage in mg O 3<br />
per mg DOC <strong>and</strong> the %DOC removed.<br />
% DOC removed = 3.38[O 3] + 23.<br />
In Figure 17, the daily measured percentage dissolved carbon removed is plotted against the<br />
<strong>ozone</strong> dosage. The st<strong>and</strong>ard error in the coefficient of the regression line drawn in Figure 17 is
0.96 <strong>and</strong> in the constant 6.63. In each filter run the <strong>ozone</strong> dose based on the <strong>filtration</strong> rate was<br />
kept constant. However, the concentration <strong>and</strong> nature of the incoming dissolved organic carbon<br />
varies from sample to sample. This explains the poor correlation between DOC removal <strong>and</strong><br />
<strong>ozone</strong> dosage based on DOC concentration. From Figure 17 it is obvious that if the <strong>ozone</strong><br />
dem<strong>and</strong> of the incoming <strong>water</strong> is satisfied the amount of dissolved organic carbon removed is<br />
not a direct function of the <strong>ozone</strong> dosed. Therefore, the presence of free <strong>ozone</strong> in the <strong>water</strong><br />
leaving the <strong>ozone</strong> contact column should be used to control the <strong>ozone</strong> dosage.<br />
The chemical quality of the secondary effluent used in this investigation is such that it will be<br />
aggressive to cement-like material <strong>and</strong> corrosive to ferrous <strong>and</strong> other metals because it has a<br />
negative precipitation potential of 9.74 mg CaCO 3.l >1 , at 20 o C. Removal of the organic carbon<br />
increases this negative precipitation potential even further to 14.20 mg CaCO 3.l >1 . The addition<br />
of 6.02 mg Ca(OH) 2.l >1 will stabilise the filtrate.<br />
Microbiological Results<br />
The total coliforms in the influent ranged from 25 000 to >250 000 colony forming units (CFU)<br />
per 100 ml, <strong>and</strong> the faecal coliforms from 20 000 to >250 000 CFU per 100 ml. Ozonation<br />
followed by <strong>filtration</strong> reduced the total coliforms count to a range of nil to 100 CFU per 100 ml<br />
(average 5) <strong>and</strong> the faecal coliforms from nil to 20 CFU per 100 ml (average 1). In the case<br />
where the secondary effluent was filtered <strong>with</strong>out <strong>ozone</strong> pre<strong>treatment</strong> the ranges were nil to 14<br />
000 CFU/100 ml for total coliforms <strong>and</strong> nil to 3 800 CFU/100 ml. The 95 percentile value for<br />
faecal coliforms in the filtrate produced from ozonated secondary effluent was 1.9 that is 2 CFU<br />
per 100 ml. Thus, the filtrate did not meet the requirement set in the Special St<strong>and</strong>ards for<br />
discharging treated waste <strong>water</strong> into the environment. Further disinfection will, therefore, be<br />
required.<br />
Head loss in the Filters.<br />
The head loss development in all the<br />
filter runs was similar. The head loss<br />
measure in Experiment 4 is plotted in<br />
Figure 18.<br />
From Figure 18 it is clear that the<br />
development of head loss was<br />
extremely small during the initial<br />
period of the filter operation which<br />
later increased exponentially. Most<br />
of the head loss occurred in the top<br />
layer (Schumtzdecke). Therefore, by<br />
removing this layer between filter<br />
runs restores the head loss.<br />
In this experiment Filter 1 was Figure 18 The development of head loss in a <strong>slow</strong><br />
covered <strong>with</strong> a tarpaulin to prevent<br />
s<strong>and</strong> filter.<br />
algae growth. This led to a <strong>slow</strong>er<br />
head loss development <strong>and</strong> an increase in the filter run.
Conclusions<br />
The following specific conclusions may be drawn from this investigation:<br />
1. Substantially all the incoming saline ammonium-nitrogen was nitrified in/or on the <strong>slow</strong> s<strong>and</strong><br />
filters in all the filter run. Although an increase in the nitrate-nitrogen concentrations<br />
occurred, 30 to 40% of the incoming total nitrogen was removed by denitrification. The final<br />
nitrate-nitrogen concentration was in the range which is generally well tolerated in potable<br />
<strong>water</strong>.<br />
2. Under all conditions ortho-phosphate was released during <strong>slow</strong> s<strong>and</strong> <strong>filtration</strong> from the<br />
biomass in the secondary effluent from an biological nutrient removal plant, used in the<br />
investigation In the filters receiving <strong>water</strong> pre-treated <strong>with</strong> <strong>ozone</strong> consistently more phosphate<br />
was released.<br />
3. Ozonation per se has had little impact on the total nitrogen <strong>and</strong> ortho-phosphate.<br />
4. Slow s<strong>and</strong> <strong>filtration</strong> <strong>with</strong> <strong>and</strong> <strong>with</strong>out <strong>ozone</strong> pre<strong>treatment</strong> reduced turbidity consistently to<br />
below 1 NTU.<br />
5. Slow s<strong>and</strong> <strong>filtration</strong> <strong>with</strong> <strong>ozone</strong> pre<strong>treatment</strong> removed the colour in secondary effluent to<br />
levels lower than the detection limits of the equipment normally used for colour<br />
measurement. Without <strong>ozone</strong> pre<strong>treatment</strong> the colour in the filtrate was still detectable.<br />
6. Direct <strong>filtration</strong> of effluent after the secondary settling tanks reduces the filter run drastically.<br />
This can be overcome by using an intermediate maturation pond <strong>with</strong> a retention time short<br />
enough to prevent the growth of algae or by coarse s<strong>and</strong> <strong>filtration</strong> to remove the biomass<br />
carried over in the secondary settling tanks.<br />
7. Slow s<strong>and</strong> <strong>filtration</strong> <strong>with</strong>out <strong>ozone</strong> pre<strong>treatment</strong> removes approximately 10% of the incoming<br />
dissolved organic carbon, 40% of the DOC removed is biodegradable. Very good treated<br />
<strong>water</strong> quality was achieved <strong>with</strong> pre-ozonation followed by <strong>slow</strong> s<strong>and</strong> <strong>filtration</strong>, 20 to 35%<br />
of the incoming dissolved organic carbon was removed.<br />
8. On virgin s<strong>and</strong> filter ripening took 20 to 25 days. In successive filter runs no allowances for<br />
filter ripening need to be made.<br />
9. Head loss development was extremely small during the initial period of the filter operation.<br />
Later it increased exponentially. Most of the head loss occurred in the top layer. Limiting<br />
the growth of algae by protecting the filters against sunlight, reduces head loss development<br />
<strong>and</strong> increases the length of the filter runs substantially.<br />
10.Very good removal of total coliforms <strong>and</strong> faecal coliforms was achieved, however, additional<br />
disinfection will be required to comply <strong>with</strong> the 0 CFU per 100 ml faecal coliforms<br />
requirement of the Special St<strong>and</strong>ards set for discharging into the environment.<br />
Acknowledgement
The author is grateful to the Department of Water <strong>and</strong> the Environment, City Council of Pretoria,<br />
for providing the necessary funds to conduct this investigation. Sincere thanks to the staff at the<br />
Daspoort Chemical Laboratory <strong>and</strong> Water Care Works for their help <strong>with</strong> the analysis of the<br />
samples <strong>and</strong> operation of the pilot plants.<br />
References<br />
BONNET MC, WELLTE B <strong>and</strong> MONTIEL (1992) Removal of Biodegradable Dissolved<br />
Organic Carbon in a Water Treatment Plant. Water Res. 26(12) 1673-1680.<br />
ELLIS KV (1987) Slow s<strong>and</strong> <strong>filtration</strong> as a technique for tertiary <strong>treatment</strong> of municipal<br />
sewages. Wat. Res 21(4) 403-410.<br />
FAROOQ S <strong>and</strong> AL-YOUSEF AK (1993) Slow s<strong>and</strong> <strong>filtration</strong> of secondary effluent. Journal<br />
of Environmental Engineering. 119(4) 615-630.<br />
FAROOQ S, AL-YOUSEF, AL-LAYLA RI <strong>and</strong> ISHAQ AM (1994) Tertiary <strong>treatment</strong> of<br />
sewage effluent via pilot scale <strong>slow</strong> s<strong>and</strong> <strong>filtration</strong>. Environmental Technology. 15 18-28.<br />
FOGEL D <strong>and</strong> ISAAC-RENTON J (1993) Removing Giardia <strong>and</strong> Cryptosporidium by <strong>slow</strong><br />
s<strong>and</strong> <strong>filtration</strong>. Journal of the American Water Works Association. 85(11) 77-84.<br />
GOULD MH, CAMERON DA <strong>and</strong> ZABEL TF (1984) An experimental study of ozonation<br />
followed by <strong>slow</strong> s<strong>and</strong> <strong>filtration</strong> for the removal of humic colour <strong>water</strong>. Ozone: Science <strong>and</strong><br />
Engineering. 6 3-15.<br />
GRADY CP, KIRSCH EJ KOCZWARA MK, TRGOVCICH B <strong>and</strong> WATT RD (1984)<br />
Molecular weight distributions in activated sludge effluents. Water Res. 18(2) 239-246.<br />
MAIER D, (1984) Microflocculation by <strong>ozone</strong>. H<strong>and</strong>book of <strong>ozone</strong> technology <strong>and</strong><br />
applications. Volume 2. Editors R. G Rice <strong>and</strong> A. N. Netzer. (Stoneham, MA: Butterworth<br />
Publioshers, Inc.,), 123-140.<br />
MONTIEL A, WELTE B <strong>and</strong> BARBIER JM (1989) Improvement of <strong>slow</strong> s<strong>and</strong> <strong>filtration</strong>.<br />
Environmental Technology Letters. 10 29-40.<br />
POYNTER SFB <strong>and</strong> SLADE JS (1977) The removal of viruses by <strong>slow</strong> s<strong>and</strong> <strong>filtration</strong>. Prog.<br />
Wat. Tech. 9 75-88.<br />
SINGER PC (1988) Ozonation research in drinking <strong>water</strong>. AWWA Res Fdn., Denver, colo<br />
TIMMS S, SLADE JS <strong>and</strong> FRICKER CR (1995) Removal of Cryptosporidium by <strong>slow</strong> s<strong>and</strong><br />
<strong>filtration</strong>. Wat. Sci. Tech. 31(5-6) 81-84.<br />
US Environmental Protection Agency (1989) National Primary Drinking Water Regulations;<br />
Filtration, Disinfection, Turbidity, Giardia lamblia, Virusses, Legionella, <strong>and</strong> Heterotrophic<br />
Bacteria, Final Rule. Federal Register 54(124) 27485-27541.