Utilization of Corn Co-Products in the Beef Industry - UNL Water ...
Utilization of Corn Co-Products in the Beef Industry - UNL Water ...
Utilization of Corn Co-Products in the Beef Industry - UNL Water ...

You also want an ePaper? Increase the reach of your titles
YUMPU automatically turns print PDFs into web optimized ePapers that Google loves.
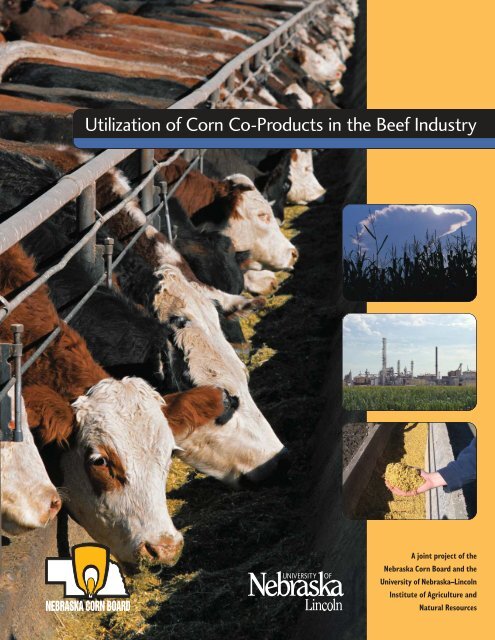
<strong>Utilization</strong> <strong>of</strong> <strong><strong>Co</strong>rn</strong> <strong>Co</strong>-<strong>Products</strong> <strong>in</strong> <strong>the</strong> <strong>Beef</strong> <strong>Industry</strong><br />
A jo<strong>in</strong>t project <strong>of</strong> <strong>the</strong><br />
Nebraska <strong><strong>Co</strong>rn</strong> Board and <strong>the</strong><br />
University <strong>of</strong> Nebraska–L<strong>in</strong>coln<br />
Institute <strong>of</strong> Agriculture and<br />
Natural Resources
UTILIZATION OF CORN CO-PRODUCTS<br />
IN THE BEEF INDUSTRY<br />
A jo<strong>in</strong>t project <strong>of</strong> <strong>the</strong> Nebraska <strong><strong>Co</strong>rn</strong> Board<br />
and <strong>the</strong><br />
University <strong>of</strong> Nebraska-L<strong>in</strong>coln<br />
Institute <strong>of</strong> Agriculture and Natural Resources<br />
Agricultural Research Division<br />
<strong>Co</strong>operative Extension Division<br />
For more <strong>in</strong>formation or to request additional copies <strong>of</strong> this manual,<br />
contact <strong>the</strong> Nebraska <strong><strong>Co</strong>rn</strong> Board at 1-800-632-6761 or e-mail k.brunkhorst@necorn.state.ne.us.<br />
Brought to you by Nebraska corn producers through <strong>the</strong>ir corn check<strong>of</strong>f dollars—<br />
expand<strong>in</strong>g demand for Nebraska corn and value-added corn products.
FEEDING OF CORN MILLING CO-PRODUCTS TO<br />
BEEF CATTLE<br />
G. E. Erickson,T. J. Klopfenste<strong>in</strong>, D. C. Adams, R. J. Rasby<br />
Department <strong>of</strong> Animal Science<br />
University <strong>of</strong> Nebraska-L<strong>in</strong>coln<br />
INTRODUCTION<br />
<strong><strong>Co</strong>rn</strong> mill<strong>in</strong>g co-products are expected to <strong>in</strong>crease dramatically <strong>in</strong> supply.Two primary types <strong>of</strong> mill<strong>in</strong>g<br />
processes currently exist, result<strong>in</strong>g <strong>in</strong> quite different feed products.The dry mill<strong>in</strong>g process produces<br />
distillers gra<strong>in</strong>s plus solubles, and <strong>the</strong> wet mill<strong>in</strong>g process produces corn gluten feed.These feeds can<br />
be marketed as wet feed, or <strong>the</strong>y can be dried and marketed as ei<strong>the</strong>r dry corn gluten feed or dry<br />
distillers gra<strong>in</strong>s with or without solubles. For <strong>the</strong> purposes <strong>of</strong> this article, only wet corn gluten feed<br />
(WCGF) and wet distillers gra<strong>in</strong>s plus solubles (WDGS) will be discussed.The majority <strong>of</strong> plant<br />
expansions are dry mill<strong>in</strong>g plants that produce WDGS; however, an <strong>in</strong>crease <strong>in</strong> supply <strong>of</strong> WCGF<br />
is also expected.Therefore, <strong>the</strong>se feeds may be very attractive for beef producers to use as an energy<br />
source.This article will focus on <strong>the</strong> production, composition <strong>of</strong> <strong>the</strong>se feeds, energy values, and<br />
economics <strong>of</strong> us<strong>in</strong>g WDGS. Some o<strong>the</strong>r management issues will be discussed as well <strong>in</strong>clud<strong>in</strong>g gra<strong>in</strong><br />
process<strong>in</strong>g when <strong>the</strong>se co-products are used <strong>in</strong> feedlot diets, roughage level when <strong>the</strong>se co-products<br />
are used, and feed<strong>in</strong>g comb<strong>in</strong>ations <strong>of</strong> WDGS and WCGF. Forage fed situations will be covered with<br />
dried co-products as this will be <strong>the</strong> most common application for both energy and prote<strong>in</strong><br />
supplementation <strong>in</strong> many forage feed<strong>in</strong>g situations.<br />
3
FEEDING OF CORN MILLING CO-PRODUCTS TO BEEF CATTLE<br />
WET MILLING<br />
Wet mill<strong>in</strong>g is a process that requires use <strong>of</strong> high quality<br />
(No. 2 or better) corn that results <strong>in</strong> numerous products<br />
for human use. Dur<strong>in</strong>g this process (Figure 1), corn is<br />
“steeped” and <strong>the</strong> kernel components are separated <strong>in</strong>to<br />
corn bran, starch, corn gluten meal (prote<strong>in</strong>), germ, and<br />
soluble components.Wet corn gluten feed usually consists<br />
<strong>of</strong> corn bran and steep, with germ meal added if <strong>the</strong> plant<br />
has those capabilities. For a more complete review <strong>of</strong> <strong>the</strong><br />
wet mill<strong>in</strong>g process, <strong>the</strong> reader is referred to Blanchard<br />
(1992). Dry corn gluten feed conta<strong>in</strong>s less energy than<br />
wet corn gluten feed (Ham et al., 1995) when fed at high<br />
levels <strong>in</strong> f<strong>in</strong>ish<strong>in</strong>g diets.Wet corn gluten feed can vary<br />
depend<strong>in</strong>g on <strong>the</strong> plant capabilities. Steep liquor conta<strong>in</strong>s<br />
more energy than corn bran or germ meal as well as<br />
prote<strong>in</strong> (Scott et al., 1997).Therefore, plants that apply<br />
more steep to corn bran or germ meal will produce WCGF<br />
that is higher <strong>in</strong> CP and energy.<br />
WCGF conta<strong>in</strong>s 16 to 23% CP, which is approximately<br />
80% rum<strong>in</strong>ally degradable (degradable <strong>in</strong>take prote<strong>in</strong>,<br />
DIP) prote<strong>in</strong> used by microbes. Dur<strong>in</strong>g wet mill<strong>in</strong>g, corn<br />
gluten meal is removed and marketed <strong>in</strong> higher value<br />
markets. <strong><strong>Co</strong>rn</strong> gluten meal should not be confused with<br />
Figure 1– Schematic <strong>of</strong> <strong>the</strong> wet mill<strong>in</strong>g <strong>in</strong>dustry result<strong>in</strong>g<br />
<strong>in</strong> wet or dry corn gluten feed.<br />
STEEP<br />
STEEP<br />
GRIND<br />
SEPARATION<br />
CORN BRAN<br />
WET CORN GLUTEN FEED<br />
CORN<br />
WASH WATER<br />
STARCH, SWEETENER, ALCOHOL<br />
GLUTEN MEAL<br />
CORN OIL<br />
GERM MEAL, SCREENINGS,<br />
DIST SOLUBLES<br />
DRY CORN GLUTEN FEED<br />
4<br />
WCGF, as corn gluten meal conta<strong>in</strong>s approximately 60%<br />
CP which is only 40% DIP or 60% bypass prote<strong>in</strong><br />
(undegradable <strong>in</strong>take prote<strong>in</strong>, UIP). Dist<strong>in</strong>ct differences<br />
exist for WCGF, even with<strong>in</strong> companies, due to plant-toplant<br />
variation. Stock et al., (1999) divided WCGF <strong>in</strong>to<br />
two ma<strong>in</strong> categories, depend<strong>in</strong>g on <strong>the</strong> ratio <strong>of</strong> steep to<br />
bran. Because <strong>of</strong> differences <strong>in</strong> <strong>the</strong> amount <strong>of</strong> steep added,<br />
WCGF has approximately 101 to 115% <strong>the</strong> energy value<br />
<strong>of</strong> dry-rolled corn when fed at levels <strong>of</strong> 20 to 60% <strong>of</strong> diet<br />
DM (Stock et al., 1999). Higher energy (and prote<strong>in</strong>)<br />
is associated with greater amounts <strong>of</strong> steep <strong>in</strong> WCGF.<br />
DRY MILLING<br />
In <strong>the</strong> dry mill<strong>in</strong>g <strong>in</strong>dustry, <strong>the</strong> feed product(s) that are<br />
produced are distillers gra<strong>in</strong>s, distillers gra<strong>in</strong>s + solubles,<br />
and distillers solubles. Depend<strong>in</strong>g on <strong>the</strong> plant and whe<strong>the</strong>r<br />
it is produc<strong>in</strong>g wet or dry feed, <strong>the</strong> relative amounts <strong>of</strong><br />
distillers gra<strong>in</strong>s and distillers solubles mixed toge<strong>the</strong>r varies.<br />
However, our current estimates are that wet distillers<br />
gra<strong>in</strong>s + solubles are approximately 65% distillers gra<strong>in</strong>s<br />
and 35% distillers solubles (DM basis). Distillers gra<strong>in</strong>s<br />
(+ solubles) will hereby be referred to as ei<strong>the</strong>r WDGS<br />
(wet distillers gra<strong>in</strong>s) or DDGS (dry distillers gra<strong>in</strong>s).<br />
Figure 2 – Schematic <strong>of</strong> <strong>the</strong> dry mill<strong>in</strong>g <strong>in</strong>dustry with <strong>the</strong><br />
feed products produced.<br />
DISTILLERS GRAINS<br />
WDG, DDG<br />
CORN, GRAINS<br />
GRIND, WET, COOK<br />
FERMENTATION<br />
STILL<br />
STILLAGE<br />
WDGS<br />
DDGS<br />
YEAST, ENZYMES<br />
ALCOHOL<br />
& CO 2<br />
DISTILLERS SOLUBLES
Table 1 – Energy value <strong>of</strong> wet vs dry distillers gra<strong>in</strong>s <strong>in</strong> f<strong>in</strong>ish<strong>in</strong>g diets when fed at 40% <strong>of</strong> diet DM.<br />
<strong>Co</strong>ntrol WDGS Low a Medium a High a<br />
DMI, lb/d 24.2 b bc 23.56 b 25.3 c 25.0 a 25.9 a<br />
ADG, lb 3.23 b 3.71 c 3.66 c 3.71 c 3.76 c<br />
Feed/ga<strong>in</strong> 7.69 b 6.33 c 6.94 d 6.76 d 6.90 d<br />
Improvement:<br />
Diet -- 21.5 ………….11.9 (ave.)…….…..<br />
Distillers vs corn -- 53.8 …………….29.8…………….<br />
a Level <strong>of</strong> ADIN, 9.7, 17.5 and 28.8% <strong>in</strong> DDGS.<br />
b,c,d Means <strong>in</strong> same row with different superscripts differ (P
FEEDING OF CORN MILLING CO-PRODUCTS TO BEEF CATTLE<br />
used (average <strong>of</strong> 40%), <strong>the</strong> energy was 130% that <strong>of</strong><br />
corn.Vander Pol et al., (2005b) conducted an economic<br />
comparison for cattle fed no WDGS, and 10, 20, 30, 40,<br />
and 50% WDGS. In this study, corn was evaluated us<strong>in</strong>g<br />
10-year average price, and with ei<strong>the</strong>r a $0.05 or $0.10<br />
<strong>in</strong>crease <strong>in</strong> price per bushel, due to basis on corn near an<br />
ethanol plant. Scenarios were compared for feedlots near<br />
<strong>the</strong> plant, 30, 60, and 100 miles from <strong>the</strong> plant. <strong>Co</strong>sts<br />
that were accounted for were extra feed<strong>in</strong>g cost due to<br />
handl<strong>in</strong>g diets greater <strong>in</strong> moisture, bushel price, and<br />
distance from <strong>the</strong> plant. Increased return was based on<br />
energy value <strong>of</strong> WDGS (Figure 4) at each level fed.The<br />
optimum level for feedlot producers is 30 to 40% <strong>of</strong> diet<br />
DM when plants are with<strong>in</strong> 30 miles <strong>of</strong> <strong>the</strong> ethanol plant.<br />
As <strong>the</strong> distance <strong>in</strong>creases from <strong>the</strong> plant to <strong>the</strong> feedlot,<br />
<strong>the</strong> optimum <strong>in</strong>clusion <strong>of</strong> WDGS decreases to 20 to 30%.<br />
This comparison suggests that more WDGS can be fed<br />
than traditional levels <strong>of</strong> 15 to 20%; however, <strong>the</strong><br />
optimum <strong>in</strong>clusion is dependent on more than just <strong>the</strong><br />
energy value <strong>of</strong> WDGS. Factors such as price, cattle<br />
performance, distance from <strong>the</strong> plant, and corn price<br />
<strong>in</strong>fluence <strong>the</strong> economic optimum <strong>in</strong>clusion amount. Of<br />
course, <strong>the</strong>se economic returns are dependent on our<br />
assumptions <strong>of</strong> purchas<strong>in</strong>g WDGS at 95% <strong>of</strong> corn price.<br />
$/hd above 0% WDGS per 153 d<br />
30<br />
25<br />
20<br />
15<br />
10<br />
5<br />
0<br />
-5<br />
At Plant<br />
30 miles<br />
60 miles<br />
100 miles<br />
0 10 20 30 40 50<br />
WDGS Inclusion, % <strong>of</strong> DM<br />
6<br />
COMPOSITION<br />
Table 2 conta<strong>in</strong>s data on plant averages and some<br />
<strong>in</strong>dication <strong>of</strong> variation for various corn mill<strong>in</strong>g co-products.<br />
Variation exists from plant to plant and with<strong>in</strong> a plant.<br />
These table values should not replace sampl<strong>in</strong>g and<br />
analysis <strong>of</strong> feed from <strong>in</strong>dividual plants.The dry distillers<br />
gra<strong>in</strong>s plus solubles (DDGS),WDGS, and condensed corn<br />
distillers solubles (CCDS) are all from one plant <strong>in</strong><br />
Nebraska and represent average values for 2003.The<br />
standard deviations are for composite weekly samples, not<br />
for load variation. Sampl<strong>in</strong>g frequency is important as<br />
actual variation observed from load to load at a feedlot is<br />
quite different than variation from weekly samples.The<br />
plant with an excellent database on variability is <strong>the</strong><br />
Cargill Blair facility.The standard deviation is low on DM<br />
change from load to load.This relates to two th<strong>in</strong>gs:<br />
process development to m<strong>in</strong>imize variation and culture <strong>of</strong><br />
those operat<strong>in</strong>g <strong>the</strong> plant to m<strong>in</strong>imize variation <strong>in</strong> feed<br />
products.The coefficient <strong>of</strong> variation (CV, %) can be<br />
calculated as: (standard deviation/average) x 100.The<br />
energy values used <strong>in</strong> Table 2 are based on performance<br />
data summarized <strong>in</strong> this paper and o<strong>the</strong>r reviews. In<br />
ano<strong>the</strong>r recent review <strong>of</strong> composition and variation <strong>in</strong><br />
plants and across plants, <strong>the</strong> reader is referred to Holt and<br />
Figure 4 – Economic return<br />
from feed<strong>in</strong>g WDGS when<br />
fed at 0, 10, 20, 30, 40,<br />
or 50% <strong>of</strong> diet DM.
Table 2. Nutrient composition <strong>of</strong> selected corn mill<strong>in</strong>g co-products.<br />
Feedstuff: a<br />
DRC b WCGF-A WCGF-B DDGS c<br />
Pritchard (2004). Moisture and DM variation are<br />
probably <strong>of</strong> greatest importance with wet co-products.<br />
However, both fat and S can vary <strong>in</strong> wet distillers gra<strong>in</strong>s<br />
which could lead to changes <strong>in</strong> energy value and potential<br />
for toxicity, respectively.<br />
USE IN FORAGE DIETS<br />
<strong>Beef</strong> calves from wean<strong>in</strong>g until <strong>the</strong>y enter feedlots,<br />
develop<strong>in</strong>g heifers and beef cows are fed primarily forage<br />
diets. Especially <strong>in</strong> <strong>the</strong> w<strong>in</strong>ter, forages are low <strong>in</strong> prote<strong>in</strong><br />
and phosphorus and need to be supplemented. <strong><strong>Co</strong>rn</strong><br />
gluten feed conta<strong>in</strong>s highly digestible fiber and degradable<br />
prote<strong>in</strong> which are good sources <strong>of</strong> energy and prote<strong>in</strong> for<br />
rumen microbes, especially <strong>in</strong> forage-based diets (DeHaan<br />
et al., 1983).Wet and dry corn gluten feed were<br />
compared to dry-rolled corn for grow<strong>in</strong>g calves fed grass<br />
hay, wheat straw, and corn stalklage.The gluten feed or<br />
corn replaced 40% <strong>of</strong> <strong>the</strong> forage (Oliveros et al., 1987).<br />
7<br />
WDGS c<br />
CCDS c<br />
MWDGS steep d<br />
DM 90.0 44.7 60.0 90.4 34.9 35.5 45-50 49.4(49.0) e<br />
SD 0.88 0.89 0.05 1.7 3.6 1.4 NA 1.0(0.58) e<br />
CP, % <strong>of</strong> DM 9.8 19.5 24.0 33.9 31.0 23.8 NA 35.1<br />
SD 1.1 0.63 0.51 1.3 0.9 1.5 NA 1.1<br />
UIP, % <strong>of</strong> CP 60.0 20.0 20.0 65.0 65.0 65.0 NA 20.0<br />
P, % <strong>of</strong> DM 0.32 0.66 0.99 0.51 0.84 1.72 NA 1.92<br />
SD 0.04 0.03 0.04 0.08 0.06 0.27 NA 0.11<br />
TDN, % 90.0 90.0 94.5 101 112 112 NA 113<br />
NEg, Mcal/lb 0.70 0.71 0.80 0.78 0.87 0.87 NA 0.88<br />
a<br />
DRC=dry rolled corn with NRC (1996) values, WCGF=wet corn gluten feed from two plants, DDGS=dried distillers gra<strong>in</strong>s + solubles,<br />
WDGS=wet distillers gra<strong>in</strong>s + solubles, CCDS=condensed corn distillers solubles (corn syrup), MWDGS=modified wet distillers<br />
gra<strong>in</strong>s + solubles, steep is steep liquor from wet mill<strong>in</strong>g plants.<br />
b<br />
DRC values based on NRC (1996) values with approximately 3500 samples<br />
c<br />
Values are from spr<strong>in</strong>g, 2003 from only one plant <strong>in</strong> Nebraska that produces DDGS, WDGS, and CCDS with standard<br />
deviation based on weekly composites.<br />
d<br />
DM values represent variation from daily composites for a 60-d period. O<strong>the</strong>r nutrients are based on monthly composites<br />
for 2002 and half <strong>of</strong> 2003.<br />
e<br />
Values <strong>in</strong> paren<strong>the</strong>ses are monthly composites for 2003 from one plant <strong>in</strong> Nebraska, with assumptions that it is a<br />
mixture <strong>of</strong> steep and distillers solubles.<br />
The supplements nearly doubled ga<strong>in</strong>s and improved feed<br />
conversion (Table 3).Wet and dry gluten feeds had better<br />
feed conversions than corn and WCGF had better feed<br />
conversion than DCGF.The apparent energy value <strong>of</strong><br />
DCGF was 10% greater than corn, while WCGF was<br />
31% higher than DCGF and 42% greater than corn <strong>in</strong><br />
<strong>the</strong>se forage-based diets.<br />
Table 3. Wet or dry corn gluten feed or corn <strong>in</strong> forage<br />
based diets for grow<strong>in</strong>g calves a .<br />
Forage <strong><strong>Co</strong>rn</strong> DCGF WCGF<br />
DMI, lb/d 11.7 18.0 16.4 16.2<br />
ADG, lb 1.16 2.25 2.15 2.36<br />
Feed/ga<strong>in</strong> 10.5 8.01 7.64 6.86<br />
a Balanced for 11.5% CP.
FEEDING OF CORN MILLING CO-PRODUCTS TO BEEF CATTLE<br />
Table 4. Escape Prote<strong>in</strong> Values<br />
Source % prote<strong>in</strong> escape<br />
Soybean meal 30<br />
Wet distillers gra<strong>in</strong>s 60-70<br />
Dried distillers gra<strong>in</strong>s 60-70<br />
Distillers solubles 30<br />
Clearly, gluten feed is an excellent source <strong>of</strong> nutrients for<br />
forage-based diets.There is little to no starch <strong>in</strong> gluten<br />
feed, which results <strong>in</strong> no negative effect on fiber digestion.<br />
The DIP <strong>in</strong> gluten feed is an excellent source <strong>of</strong> prote<strong>in</strong><br />
for microbes. Prote<strong>in</strong> <strong>in</strong> forages is highly degraded <strong>in</strong> <strong>the</strong><br />
rumen. In certa<strong>in</strong> production situations, cattle may need<br />
to be supplemented with undegraded (UIP; bypass)<br />
prote<strong>in</strong> to meet metabolizable prote<strong>in</strong> (MP) requirements.<br />
Distillers gra<strong>in</strong>s (wet or dry) are an excellent source <strong>of</strong><br />
undegraded prote<strong>in</strong> and phosphorus.The values obta<strong>in</strong>ed<br />
from feed<strong>in</strong>g trials for undegraded prote<strong>in</strong> are shown <strong>in</strong><br />
Table 4.Wet gra<strong>in</strong>s were compared to dry gra<strong>in</strong>s and <strong>the</strong><br />
value <strong>of</strong> <strong>the</strong> prote<strong>in</strong> was similar (Table 5).This suggests<br />
that <strong>the</strong> high escape prote<strong>in</strong> value <strong>of</strong> distillers gra<strong>in</strong>s is<br />
due to <strong>the</strong> <strong>in</strong>nate characteristics <strong>of</strong> <strong>the</strong> prote<strong>in</strong> and not to<br />
dry<strong>in</strong>g or moisture content, and does not appear to be<br />
<strong>in</strong>fluenced by acid-detergent <strong>in</strong>soluble prote<strong>in</strong> (ADIN)<br />
which is a common measure <strong>of</strong> heat damaged prote<strong>in</strong>.<br />
The value <strong>of</strong> distillers gra<strong>in</strong>s as a prote<strong>in</strong> supplement is<br />
illustrated <strong>in</strong> Table 6.We have shown <strong>the</strong> formulation and<br />
cost <strong>of</strong> a soybean meal based supplement and a distillers<br />
gra<strong>in</strong>s based supplement.They should have equal feed<strong>in</strong>g<br />
value but <strong>the</strong> distillers gra<strong>in</strong>s supplement is less expensive<br />
because <strong>of</strong> <strong>the</strong> high escape value <strong>of</strong> <strong>the</strong> prote<strong>in</strong>. Less<br />
expensive midds and urea can <strong>the</strong>n be used <strong>in</strong> <strong>the</strong><br />
supplement.This illustrates just how economical distillers<br />
gra<strong>in</strong>s can be as a supplement to stockers, heifers and cows.<br />
Stocker calves, develop<strong>in</strong>g heifers and cows may need<br />
energy supplementation <strong>in</strong> addition to supplemental<br />
8<br />
Table 5. Wet and Dry Gra<strong>in</strong>s for Calves<br />
Supplement ADG Prote<strong>in</strong> efficency a ADIN b<br />
Urea 1.00 -- ---<br />
WG 1.46 2.6 ---<br />
DDGS 1.42 2.0 9.7<br />
DDGS 1.47 1.8 17.5<br />
DDGS 1.54 2.5 28.8<br />
a Pounds ga<strong>in</strong>/lb supplemental prote<strong>in</strong>.<br />
b Acid detergent <strong>in</strong>soluble nitrogen, measure <strong>of</strong> amount <strong>of</strong> heat<strong>in</strong>g.<br />
prote<strong>in</strong> and phosphorus. It is advantageous if <strong>the</strong> same<br />
commodity can be used for supplemental energy as well as<br />
prote<strong>in</strong>.We previously stated that distillers gra<strong>in</strong>s should<br />
have 120% <strong>the</strong> energy value <strong>of</strong> corn gra<strong>in</strong>. Additional<br />
advantages for distillers gra<strong>in</strong>s are that it conta<strong>in</strong>s very little<br />
starch and <strong>the</strong>refore should not depress fiber digestion.<br />
Dur<strong>in</strong>g drought conditions, <strong>the</strong>se co-products may be<br />
very competitive as energy supplements for use by<br />
ranchers.When forage quality is poor (w<strong>in</strong>ter) or<br />
quantity is limit<strong>in</strong>g (drought), co-products may fit.<br />
Research efforts at <strong>the</strong> University <strong>of</strong> Nebraska-L<strong>in</strong>coln<br />
have focused on <strong>the</strong> usefulness and value <strong>of</strong> dry co-products<br />
<strong>in</strong> cow-calf situations.<br />
Table 6. Value <strong>of</strong> Distillers Gra<strong>in</strong>s - 40% Supplement<br />
SBM DDGS<br />
SBM 78.7% ---<br />
DG - 60%<br />
Midds 20.3 32.8<br />
Urea --- 6.2<br />
M<strong>in</strong>erals 1.0 1.0<br />
Ingredient cost $153 $95<br />
Prices: SBM, $161; DDGS, $95; Midds, $61; Urea, $280<br />
(corn $75).
Loy et al., (2004) concluded that DCGF decreases feed<br />
costs compared to conventional hay feed<strong>in</strong>g when fed<br />
over <strong>the</strong> w<strong>in</strong>ter for develop<strong>in</strong>g heifers on a commercial,<br />
Nebraska ranch <strong>in</strong> <strong>the</strong> sandhills. In <strong>the</strong>ir study, a treatment<br />
system (TRT) was compared to <strong>the</strong>ir conventional<br />
management us<strong>in</strong>g over 550 heifers <strong>in</strong> each group across<br />
two years.The TRT system utilized only grazed w<strong>in</strong>ter<br />
forage and DCGF supplementation compared to some<br />
w<strong>in</strong>ter graz<strong>in</strong>g, with hay and prote<strong>in</strong> supplementation.<br />
Performance differences are presented <strong>in</strong> Table 7;<br />
however, little differences were observed <strong>in</strong> develop<strong>in</strong>g<br />
heifer performance by design.The major implication was<br />
reduced costs ($6.71 per heifer) through <strong>the</strong> w<strong>in</strong>ter while<br />
ma<strong>in</strong>ta<strong>in</strong><strong>in</strong>g excellent performance and reproduction.<br />
A similar experiment was conducted us<strong>in</strong>g DDGS (Stalker<br />
et al., 2006). Because <strong>of</strong> <strong>the</strong> higher energy content <strong>of</strong><br />
DDGS, a smaller amount was needed to meet prote<strong>in</strong> and<br />
energy requirements <strong>of</strong> <strong>the</strong>se bred heifers (1353 heifers<br />
were used). Feed<strong>in</strong>g DDGS and graz<strong>in</strong>g w<strong>in</strong>ter range with<br />
heifers led to slightly better w<strong>in</strong>ter ga<strong>in</strong>s and changes <strong>in</strong><br />
Table 7. Weight, body condition, and conception rates <strong>of</strong><br />
heifers <strong>in</strong> two systems.<br />
Item CON TRT<br />
Year One<br />
Pre-calv<strong>in</strong>g BW change, lb 100.0 98.3<br />
Pre-calv<strong>in</strong>g BCS change -0.16 a -0.08 b<br />
Post-calv<strong>in</strong>g BW change, lb -100.1 -98.3<br />
Post-calv<strong>in</strong>g BCS change 0.16 0.28<br />
Year Two<br />
Pre-calv<strong>in</strong>g BW change, lb -5.1 a 12.3 b<br />
Pre-calv<strong>in</strong>g BCS change -0.75 a -0.48 b<br />
Post-calv<strong>in</strong>g BW change, lb 2.82 0.04<br />
Post-calv<strong>in</strong>g BCS change -0.30 a -0.57 b<br />
Pregnancy rate, %e 96.1 96.4<br />
a,b Unlike superscripts with<strong>in</strong> a row differ, P < 0.05.<br />
c,d Unlike superscripts with<strong>in</strong> a row differ, P < 0.10.<br />
e Percentage pregnant with second calf. P-value reflects chi<br />
square analysis.<br />
9<br />
Table 8. Grow<strong>in</strong>g calf performance over 84 days when fed<br />
native grass hay (CP = 8.7%) supplemented with ei<strong>the</strong>r<br />
corn or DDG for two levels <strong>of</strong> ga<strong>in</strong>. Net energy was 27%<br />
greater for DDG compared to corn (Loy et al., 2003a).<br />
Low a High a<br />
ADG, lb/d <strong><strong>Co</strong>rn</strong> .81 ± .06 1.57 ± .05<br />
DDGS .99 ± .05 1.89 ± .05<br />
Feed conversion <strong><strong>Co</strong>rn</strong> 15.9 ± .5 9.8 ± .5<br />
(DMI/ADG) DDGS 12.8 ± .5 8.0 ± .5<br />
aLOW = supplement fed at 0.21% BW, HIGH = supplement fed at<br />
0.81% BW.<br />
bDDGS = dry distillers gra<strong>in</strong>s; DRC = dry rolled corn<br />
body condition compared to <strong>the</strong> hay-fed, control heifers.<br />
Pregnancy rates were 97% for both treatments. Most<br />
important, $10.47 per heifer was saved <strong>in</strong> feed costs by<br />
us<strong>in</strong>g DDGS and w<strong>in</strong>ter range versus a conventional<br />
system <strong>of</strong> hay, supplement, and range.<br />
An experiment was conducted with 120 crossbred heifers<br />
to determ<strong>in</strong>e <strong>the</strong> value <strong>of</strong> dry distillers gra<strong>in</strong>s (DDGS) <strong>in</strong><br />
high-forage diets, and to evaluate <strong>the</strong> effect <strong>of</strong> supplement<strong>in</strong>g<br />
daily compared to three times weekly (Loy et al., 2003).<br />
Heifers were fed to consume grass hay ad libitum and<br />
supplemented with DDGS or dry rolled corn (DRC).<br />
Supplements were fed at two levels, and <strong>of</strong>fered ei<strong>the</strong>r<br />
daily or three times per week <strong>in</strong> equal proportions.<br />
Heifers supplemented daily ate more hay, ga<strong>in</strong>ed faster<br />
(1.37 vs. 1.24 lb per day), but were not more efficient<br />
than those supplemented on alternate days (Table 8). At<br />
both levels <strong>of</strong> ga<strong>in</strong>, DDGS heifers ga<strong>in</strong>ed more and were<br />
more efficient than DRC fed heifers. The calculated net<br />
energy values for DDGS were 27% greater than for DRC.<br />
Ten rum<strong>in</strong>ally-cannulated heifers received no supplement,<br />
dry distillers gra<strong>in</strong>s (DDGS) daily, DDGS on alternat<strong>in</strong>g<br />
days, dry rolled corn daily, or corn on alternat<strong>in</strong>g days<br />
(Loy et al., 2004). Hay <strong>in</strong>take was higher for nonsupplemented<br />
than for supplemented heifers (Table 9).<br />
No <strong>in</strong>take differences were observed between DDGS and
FEEDING OF CORN MILLING CO-PRODUCTS TO BEEF CATTLE<br />
Table 9. Treatment effects on <strong>in</strong>take, neutral detergent fiber disappearance, rum<strong>in</strong>al pH, and <strong>in</strong>take pattern.<br />
Item CON a DRC-D a DRC-A a DDGS-D a DDGS-A a<br />
Hay DMI, %BW b, c 1.88 1.69 1.58 1.69 1.66<br />
Total DM, %BW b, c 1.88 2.10 1.98 2.09 2.06<br />
NDF disappearance, %/hour b,d 4.34 3.43 3.65 4.09 4.01<br />
Average rum<strong>in</strong>al pH b,d 6.30 6.22 6.22 6.12 6.19<br />
Meals per day c,e 5.9 6.6 4.0 6.0 5.1<br />
a CON = no supplement; DRC-D = dry rolled corn supplement fed at 0.46% <strong>of</strong> BW daily; DRC-A = DRC at 0.92% <strong>of</strong> BW on alternate days;<br />
DDGS-D = dry distillers gra<strong>in</strong>s + solubles supplement fed at 0.45% <strong>of</strong> BW daily; DDGS-A = DDGS at 0.90% <strong>of</strong> BW on alternate days.<br />
b CON vs supplemented treatments, P < 0.05<br />
c Supplementation frequency effect, P < 0.10<br />
d DDGS vs DRC, P < 0.05<br />
e Supplement x frequency <strong>in</strong>teraction, P < 0.08<br />
corn-supplemented heifers. Heifers supplemented daily<br />
had higher and more consistent <strong>in</strong>takes than those <strong>in</strong><br />
alternate-day treatments, particularly with<strong>in</strong> cornsupplemented<br />
heifers. Rum<strong>in</strong>al pH and hay fiber<br />
disappearance were greater <strong>in</strong> non-supplemented heifers.<br />
<strong><strong>Co</strong>rn</strong>-supplemented heifers had slower rates <strong>of</strong> fiber<br />
disappearance than DDGS-supplemented.<br />
Dry distillers gra<strong>in</strong>s conta<strong>in</strong> approximately 65% UIP (% <strong>of</strong><br />
CP), consequently forage based diets that <strong>in</strong>clude dried<br />
distillers gra<strong>in</strong>s fed as an energy source are commonly<br />
deficient <strong>in</strong> degradable <strong>in</strong>take prote<strong>in</strong> (DIP) but conta<strong>in</strong><br />
excess metabolizable prote<strong>in</strong> (MP). Cattle convert excess<br />
MP to urea which is potentially recycled to <strong>the</strong> rumen and<br />
can serve as a source <strong>of</strong> DIP. Many factors <strong>in</strong>fluence urea<br />
recycl<strong>in</strong>g and <strong>the</strong> amount <strong>of</strong> urea that is recycled when<br />
DDGS is <strong>in</strong>cluded <strong>in</strong> a forage based diet is not known.The<br />
objective <strong>of</strong> <strong>the</strong>se trials was to determ<strong>in</strong>e if added DIP<br />
(i.e. urea) is required <strong>in</strong> forage based diets where DDGS<br />
is <strong>in</strong>cluded at levels <strong>in</strong> excess <strong>of</strong> <strong>the</strong> MP requirement.<br />
Two experiments evaluated supplemental degradable<br />
<strong>in</strong>take prote<strong>in</strong> requirements when dried distillers gra<strong>in</strong>s<br />
were fed as an energy source <strong>in</strong> forage based diets (Stalker<br />
et al., 2004). Diets were formulated to be greater than<br />
100 g/day deficient <strong>in</strong> degradable <strong>in</strong>take prote<strong>in</strong> but with<br />
excess <strong>in</strong> metabolizable prote<strong>in</strong>. In both experiments, no<br />
10<br />
response <strong>in</strong> performance was observed when urea was<br />
added to <strong>the</strong> diet (Table 10). Sufficient urea was probably<br />
recycled to correct <strong>the</strong> degradable <strong>in</strong>take prote<strong>in</strong> deficiency.<br />
These studies <strong>in</strong>dicate add<strong>in</strong>g urea to meet <strong>the</strong> degradable<br />
<strong>in</strong>take prote<strong>in</strong> requirement is not necessary when dried<br />
distillers gra<strong>in</strong>s are fed as an energy source <strong>in</strong> forage based<br />
diets. In a similarly designed experiment with DDGS fed<br />
to f<strong>in</strong>ish<strong>in</strong>g cattle at ei<strong>the</strong>r 10 or 20% <strong>of</strong> diet DM, no<br />
advantage was observed between cattle supplemented with<br />
urea (DIP) or not suggest<strong>in</strong>g recycl<strong>in</strong>g was occurr<strong>in</strong>g <strong>in</strong><br />
f<strong>in</strong>ish<strong>in</strong>g diets supplemented with 10 or 20% DDGS<br />
(Vander Pol et al., 2005c). However, some numerical<br />
differences suggested a conservative approach would be to<br />
follow NRC (1996) guidel<strong>in</strong>es for DIP supplementation if<br />
distillers gra<strong>in</strong>s are provided at less than 20% <strong>of</strong> diet DM.<br />
Thirty heifers graz<strong>in</strong>g smooth bromegrass were <strong>in</strong>dividually<br />
supplemented with 0, 1.0, 2.1, 3.1, or 4.2 lb per head<br />
per day (DM) dried distillers gra<strong>in</strong>s (DDGS) for 84 days<br />
to determ<strong>in</strong>e effects <strong>of</strong> DDGS supplementation on ADG<br />
and forage <strong>in</strong>take, and to determ<strong>in</strong>e <strong>the</strong> value <strong>of</strong> DDGS <strong>in</strong><br />
graz<strong>in</strong>g enterprises (MacDonald et al, 2004). Forage <strong>in</strong>take<br />
was estimated us<strong>in</strong>g <strong>the</strong> 1996 NRC model.<br />
Supplementation <strong>of</strong> DDGS resulted <strong>in</strong> a l<strong>in</strong>ear <strong>in</strong>crease<br />
<strong>in</strong> ADG (Figure 5) and decreased estimated forage <strong>in</strong>take<br />
(Figure 6). Morris et al. (2005) fed ei<strong>the</strong>r a high quality
Table 10. Performance and allanto<strong>in</strong> to creat<strong>in</strong><strong>in</strong>e ratios <strong>in</strong> ur<strong>in</strong>e <strong>of</strong> animals fed diets where 0, 33, 67, 100, or 133% <strong>of</strong> <strong>the</strong> NRC<br />
predicted degradable <strong>in</strong>take prote<strong>in</strong> requirement was met with supplemental urea<br />
Diet F-Test<br />
Item 0 33 67 100 133 SEM P-value<br />
Experiment 1<br />
Initial BW, lb 611 611 615 617 614 11 0.99<br />
F<strong>in</strong>al BW, lb 694 697 680 702 702 15 0.85<br />
ADG, lb 1.06 1.03 0.93 1.01 1.04 0.07 0.77<br />
Total DMI, lb 11.3 11.4 11.4 11.5 11.4 0.2 0.95<br />
F:G 11.1 11.8 13.2 11.8 11.7 0.9 0.54<br />
Allanto<strong>in</strong>:creat<strong>in</strong><strong>in</strong>e 0.66 0.66 0.56 0.68 0.67 0.08 0.84<br />
Experiment 2<br />
Initial wt., lb 452 449 1 0.10<br />
F<strong>in</strong>al wt., lb 579 585 4 0.38<br />
ADG, lb 1.53 1.63 0.05 0.17<br />
Total DMI, lb 11.9 11.6 0.5 0.76<br />
F:G 9.8 9.1 0.5 0.33<br />
Allanto<strong>in</strong>:creat<strong>in</strong><strong>in</strong>e 0.89 0.89 0.04 0.98<br />
ab Means with<strong>in</strong> a row with unlike superscripts differ (P
FEEDING OF CORN MILLING CO-PRODUCTS TO BEEF CATTLE<br />
Figure 6. Effect <strong>of</strong> supplemental dried distillers gra<strong>in</strong>s on<br />
forage <strong>in</strong>take as predicted by <strong>the</strong> 1996 NRC model.<br />
20<br />
18<br />
16<br />
14<br />
12<br />
10<br />
8<br />
6<br />
4<br />
2<br />
Forage Intake (lb per day, DM)<br />
0<br />
0.0 1.0 2.1 3.1 4.2<br />
Supplemental Dried Distillers Gra<strong>in</strong>s (lb per day, DM)<br />
y=-1.72x + 17.5<br />
WDGS have little to no starch rema<strong>in</strong><strong>in</strong>g follow<strong>in</strong>g <strong>the</strong><br />
mill<strong>in</strong>g process.Therefore, feed<strong>in</strong>g <strong>the</strong>se co-products will<br />
dilute <strong>the</strong> starch that is fed and may <strong>in</strong>fluence rumen<br />
metabolism. Krehbiel et al., (1995) observed a decrease<br />
<strong>in</strong> subacute acidosis when WCGF was fed to metabolism<br />
12<br />
steers. In many experiments, feed<strong>in</strong>g WCGF results <strong>in</strong><br />
<strong>in</strong>creased DMI, which would be considered a symptom<br />
<strong>of</strong>ten observed with subacute acidosis.<br />
Because process<strong>in</strong>g corn <strong>in</strong>creases rate <strong>of</strong> digestion by<br />
microbes, rumen acid production is <strong>in</strong>creased and <strong>the</strong> risk<br />
<strong>of</strong> acidosis is <strong>in</strong>creased (Stock and Britton, 1993).<br />
Feed<strong>in</strong>g wet corn gluten feed (WCGF) helps prevent <strong>the</strong><br />
risk <strong>of</strong> acidosis with high-gra<strong>in</strong> diets (Krehbiel et al.,<br />
1995). Numerous studies have been conducted at <strong>the</strong><br />
University <strong>of</strong> Nebraska-L<strong>in</strong>coln to determ<strong>in</strong>e if energy<br />
values are markedly improved <strong>in</strong> diets conta<strong>in</strong><strong>in</strong>g WCGF<br />
when corn is more <strong>in</strong>tensely processed. Scott et al.<br />
(2003) evaluated various corn process<strong>in</strong>g techniques<br />
(Table 11). Feed conversions were improved as process<strong>in</strong>g<br />
<strong>in</strong>tensity <strong>in</strong>creased when feed<strong>in</strong>g calves or yearl<strong>in</strong>gs.<br />
Rank<strong>in</strong>g <strong>of</strong> process<strong>in</strong>g based on feed conversions (lowest<br />
to highest) was whole, dry-rolled (DRC), f<strong>in</strong>ely ground<br />
(FGC), high-moisture (HMC), and steam-flaked (SFC) for<br />
Table 11 – Effect <strong>of</strong> corn process<strong>in</strong>g when fed with wet corn gluten feed (Macken et al., 2006; Scott et al., 2003).<br />
25% WCGF<br />
(Macken et al., 2006) Process<strong>in</strong>g methoda DRC FGC RHMC GHMC SFC<br />
ADG, lb 4.23 4.35 4.21 4.24 4.33<br />
Feed:ga<strong>in</strong> ratio, DM 5.49b 5.29c 5.13 d 5.05d 4.91e NEg (corn), Mcal/cwt 70.0 73.4 76.4 77.7 80.4<br />
Fecal starch, % 19.2b 11.8c 10.6cd 8.4d 4.1e 32% WCGF with calves<br />
(Scott et al., 2003) Process<strong>in</strong>g methoda Whole DRC FGC RHMC SFC<br />
ADG, lb 4.18 4.24 4.17 4.15 4.25<br />
Feed:ga<strong>in</strong> ratio, DM 5.92b 5.52c 5.32d 5.26de 5.18 e<br />
22% WCGF with yearl<strong>in</strong>gs<br />
(Scott et al., 2003) Process<strong>in</strong>g methoda DRC FRC RHMC SFC<br />
ADG, lb 3.98b 3.95b 4.02b 4.22c Feed:ga<strong>in</strong> ratio, DM 6.09bc 6.15 b 5.97c 5.54d a<br />
DRC = dry rolled corn, FGC = f<strong>in</strong>e ground corn, FRC = f<strong>in</strong>e rolled corn, RHMC = rolled high moisture corn,<br />
GHMC = ground high moisture corn, SFC = steam flaked corn, whole = whole corn.<br />
b,c,d,e<br />
Means with different superscripts differ (P < 0.05).
Table 12. Effect <strong>of</strong> corn process<strong>in</strong>g when fed with wet distillers gra<strong>in</strong>s (Vander Pol et al., 2006).<br />
30% WDGS <strong>in</strong>cluded <strong>in</strong> all diets<br />
Process<strong>in</strong>g method e<br />
Whole DRC DR/HM HMC SFC FGC<br />
DMI, lb/ 23.1 a 22.6 a 21.5 b 21.0 bc 20.4 c 20.4 c<br />
ADG 3.85 a 4.05 b 3.91 ab 3.89 ab 3.59 c 3.38 d<br />
F:G 6.07 a 5.68 bc 5.61 bc 5.46 c 5.76 b 6.15 a<br />
a,b,c,d Means with different superscripts differ (P < 0.05).<br />
e DRC = dry rolled corn, FGC = f<strong>in</strong>e ground corn, HMC = high moisture corn, SFC = steam flaked corn, whole = whole corn.<br />
calves. Relative improvements <strong>in</strong> F:G for DRC, FGC,<br />
HMC and SFC compared to whole corn were 6.8%,<br />
10.1%, 11.1% and 12.5%, respectively.When fed to<br />
yearl<strong>in</strong>gs, whole corn was not <strong>in</strong>cluded, but response to<br />
process<strong>in</strong>g was not as favorable as with calves. Feed<strong>in</strong>g<br />
f<strong>in</strong>e rolled corn (FRC) and HMC did not significantly<br />
improve feed conversion compared to DRC. Macken et<br />
al. (2006) fed DRC, FGC, SFC, and HMC processed as<br />
rolled (roller mill) and ground (tub gr<strong>in</strong>der) to calves<br />
with all diets conta<strong>in</strong><strong>in</strong>g 25% WCGF. Whole corn was<br />
not fed <strong>in</strong> this study, but process<strong>in</strong>g corn more <strong>in</strong>tensely<br />
significantly improved performance. Net energy<br />
calculated from performance (Owens et al., 2002 and<br />
NRC, 1996) was <strong>in</strong>creased by 4.8%, 9.1%, 11.0% and<br />
14.9% for FGC, RHMC, GHMC and SFC, respectively,<br />
compared to DRC.<br />
Apparently, HMC appears to have greater energy value<br />
when diets conta<strong>in</strong> WCGF than what was previously<br />
observed (diets not conta<strong>in</strong><strong>in</strong>g WCGF). Because HMC has<br />
greater rum<strong>in</strong>al starch digestibility than DRC or SFC<br />
(<strong>Co</strong>oper et al., 2002), HMC when fed to cattle has a<br />
greater potential for acidosis (when fed alone). However,<br />
feed<strong>in</strong>g HMC <strong>in</strong> comb<strong>in</strong>ation with WCGF appears to<br />
<strong>in</strong>crease efficiency <strong>of</strong> utilization <strong>of</strong> HMC, perhaps by<br />
reduc<strong>in</strong>g acidosis. For example, <strong>the</strong> energy value <strong>of</strong> HMC<br />
<strong>in</strong> diets comprised <strong>of</strong> HMC as <strong>the</strong> only gra<strong>in</strong> source is<br />
lower than that observed when fed <strong>in</strong> comb<strong>in</strong>ation with<br />
o<strong>the</strong>r gra<strong>in</strong>s (Stock et al., 1991) or <strong>in</strong> co-product diets.<br />
Previous reviews reported that HMC feed<strong>in</strong>g resulted <strong>in</strong><br />
2% greater efficiency than DRC (Owens et al., 1997).<br />
13<br />
However, based on work with HMC-based diets conta<strong>in</strong><strong>in</strong>g<br />
20 to 35% WCGF, cattle are 5 to 10% more efficient than<br />
those fed WCGF and DRC. Our conclusion is that <strong>in</strong>tense<br />
process<strong>in</strong>g has tremendous value <strong>in</strong> diets conta<strong>in</strong><strong>in</strong>g WCGF.<br />
However, it was unclear what <strong>the</strong> effect <strong>of</strong> corn<br />
process<strong>in</strong>g is <strong>in</strong> diets conta<strong>in</strong><strong>in</strong>g WDGS.Vander Pol et al.,<br />
(2006) fed diets conta<strong>in</strong><strong>in</strong>g ei<strong>the</strong>r whole, DRC, HMC, a<br />
50:50 blend <strong>of</strong> HMC and DRC (DM basis), SFC, or FGC<br />
to calf-feds for 168 days. Cattle fed DRC, HMC, or a<br />
comb<strong>in</strong>ation <strong>of</strong> HMC and DRC ga<strong>in</strong>ed more and were<br />
more efficient (lower feed conversion) than cattle fed<br />
whole corn (Table 12). Interest<strong>in</strong>gly, cattle fed steam-flaked<br />
corn and f<strong>in</strong>ely ground corn were not as efficient. It is<br />
unclear why f<strong>in</strong>ely ground and steam flaked corn did not<br />
respond when diets conta<strong>in</strong>ed WDGS similar to diets<br />
conta<strong>in</strong><strong>in</strong>g WCGF. However, <strong>the</strong> diets conta<strong>in</strong><strong>in</strong>g HMC<br />
and WDGS resulted <strong>in</strong> excellent performance. More work<br />
is <strong>in</strong> progress to address <strong>the</strong> optimum corn process<strong>in</strong>g<br />
method with diets conta<strong>in</strong><strong>in</strong>g WDGS.<br />
ROUGHAGES<br />
Roughages are <strong>of</strong>ten <strong>in</strong>cluded at low levels (
FEEDING OF CORN MILLING CO-PRODUCTS TO BEEF CATTLE<br />
with WCGF level and hay level).Table 13 provides<br />
performance <strong>of</strong> cattle fed each diet.There was a significant<br />
<strong>in</strong>teraction between WCGF and alfalfa level for feed<br />
conversion, <strong>the</strong>refore, only simple effects are presented <strong>in</strong><br />
Table 13.With 0% WCGF, <strong>in</strong>creas<strong>in</strong>g alfalfa level <strong>in</strong>creased<br />
ADG and DMI with no effect on feed conversion.With<br />
35% WCGF, <strong>in</strong>creas<strong>in</strong>g alfalfa hay <strong>in</strong>creased ADG and<br />
DMI, but h<strong>in</strong>dered (<strong>in</strong>creased) feed conversion l<strong>in</strong>early. It<br />
appears that roughage can be decreased (elim<strong>in</strong>ated) <strong>in</strong><br />
DRC-based diets that conta<strong>in</strong> 35% or more WCGF.<br />
However, ADG was reduced for <strong>the</strong> 0% hay, 35% WCGF<br />
treatment which has economic implications. Similar results<br />
have been observed with SFC-based diets where alfalfa can<br />
be reduced to 2% with at least 25% WCGF (S<strong>in</strong>dt et al.,<br />
2001). Parsons et al., (2001) observed no change <strong>in</strong> feed<br />
conversion when roughage was decreased from 9 to 0%<br />
alfalfa <strong>in</strong> SFC diets with 40% Sweet Bran WCGF.<br />
However, <strong>in</strong> <strong>the</strong>ir study, DMI and ADG decreased l<strong>in</strong>early.<br />
Just as with data <strong>in</strong> conventional, corn-based diets,<br />
optimum amount <strong>of</strong> roughage appears to be dependent on<br />
gra<strong>in</strong> process<strong>in</strong>g and level <strong>of</strong> WCGF. No data are available<br />
address<strong>in</strong>g roughage level <strong>in</strong> diets with distillers gra<strong>in</strong>s<br />
alone, but we are currently work<strong>in</strong>g on it.<br />
COMBINATIONS OF CO-PRODUCTS<br />
With <strong>the</strong> large expansion <strong>of</strong> ethanol plants <strong>in</strong> <strong>the</strong><br />
Midwest, an option for many feedlots will be utiliz<strong>in</strong>g<br />
both WDGS and WCGF at <strong>the</strong> same time. In addition to<br />
<strong>the</strong>ir commercial availability, ano<strong>the</strong>r reason for feed<strong>in</strong>g a<br />
comb<strong>in</strong>ation <strong>of</strong> WDGS and WCGF is due to <strong>the</strong>ir<br />
nutritional pr<strong>of</strong>iles. Synergistic effects <strong>in</strong> feed<strong>in</strong>g a<br />
comb<strong>in</strong>ation <strong>of</strong> <strong>the</strong>se co-products may be observed<br />
because <strong>of</strong> differences <strong>in</strong> fat, effective fiber, and prote<strong>in</strong><br />
components. Loza et al., (2004) fed yearl<strong>in</strong>g steers a<br />
50:50 blend <strong>of</strong> WDGS and WCGF (DM basis) at <strong>in</strong>clusion<br />
levels rang<strong>in</strong>g from 0 to 75% DM.This experiment also<br />
evaluated different forage levels. A level <strong>of</strong> 7.5% alfalfa<br />
hay was used across all <strong>the</strong> treatments. Additional<br />
treatments were also evaluated us<strong>in</strong>g a lower alfalfa level<br />
with each <strong>of</strong> <strong>the</strong> co-product diets, decreas<strong>in</strong>g <strong>the</strong> forage<br />
<strong>in</strong>clusion as <strong>the</strong> rate <strong>of</strong> <strong>in</strong>clusion <strong>of</strong> co-products <strong>in</strong> <strong>the</strong><br />
diets <strong>in</strong>creased (i.e. 25% blend had 5% alfalfa <strong>in</strong> <strong>the</strong> lower<br />
forage treatment, 75% blend had 0% alfalfa <strong>in</strong> <strong>the</strong> lower<br />
forage treatment). Results <strong>in</strong>dicated that <strong>the</strong>re were no<br />
differences <strong>in</strong> cattle performance between forage levels<br />
for each co-product blend level.The lack <strong>of</strong> differences <strong>in</strong><br />
performance with decreas<strong>in</strong>g forage would <strong>in</strong>dicate that<br />
<strong>the</strong> byproduct <strong>in</strong>clusion was enough to prevent <strong>the</strong><br />
negative consequences <strong>of</strong> sub-acute acidosis (Table 14).<br />
The analysis <strong>of</strong> <strong>the</strong> pooled data from each co-product<br />
level <strong>in</strong>dicated that <strong>the</strong> performance <strong>of</strong> <strong>the</strong> steers fed <strong>the</strong><br />
maximum co-product level (75%), regardless <strong>of</strong> <strong>the</strong><br />
forage level, was not different than a typical corn based<br />
diet (0% co-product blend). However, <strong>the</strong> diets <strong>in</strong>clud<strong>in</strong>g<br />
a 25 and 50% blend <strong>of</strong> WDGS and WCGF resulted <strong>in</strong><br />
significantly better animal performances than <strong>the</strong> control.<br />
In conclusion, it is feasible to decrease <strong>the</strong> forage levels<br />
with high <strong>in</strong>clusion <strong>of</strong> co-products. Producers may also<br />
feed levels as high as 75% without negatively affect<strong>in</strong>g<br />
Table 13. Effect <strong>of</strong> <strong>in</strong>creas<strong>in</strong>g alfalfa hay level <strong>in</strong> diets with and without WCGF for f<strong>in</strong>ish<strong>in</strong>g yearl<strong>in</strong>gs fed dry-rolled corn based diets.<br />
0 % WCGF 35% WCGF<br />
Alfalfa level 0 3.75 7.5 0 3.75 7.5<br />
DMIa 22.7 23.8 24.2 23.3 24.9 25.6<br />
ADGa 3.68 4.01 4.01 3.94 4.07 4.07<br />
Feed to Ga<strong>in</strong>b 6.21 5.95 6.02 5.95 6.10 6.25<br />
a<br />
Non-significant <strong>in</strong>teraction between WCGF and alfalfa level; Significant (P < 0.10) <strong>in</strong>crease due to WCGF; Significant<br />
b<br />
(P < 0.03) l<strong>in</strong>ear <strong>in</strong>crease for alfalfa level.<br />
WCGF x alfalfa level <strong>in</strong>teraction (P < 0.09); L<strong>in</strong>ear effect (P < 0.06) <strong>of</strong> alfalfa level with<strong>in</strong> 35% WCGF, no effect <strong>of</strong><br />
alfalfa hay with 0% WCGF.<br />
14
Table 14. Effect <strong>of</strong> different <strong>in</strong>clusion levels <strong>of</strong> a 50:50 blend <strong>of</strong> WCGF and WDGS (DM basis) and forage levels fed to yearl<strong>in</strong>g steers.<br />
Blend: 0%DM 25% DM 50% DM 75% DM<br />
Alfalfa: 7.5 5 7.5 2.5 7.5 0 7.5<br />
DMI, lb/day 24.3 a 26.3 bc 26.5 b 25.4 c 26.1 bc 23.0 d 23.6 ad<br />
ADG, lb/day 3.99 a 4.70 b 4.57 b 4.55 b 4.56 b 3.86 a 3.93 a<br />
F/G 6.10 a 5.60 c 5.80 bc 5.59 c 5.73 bc 5.97 ab 6.01 ab<br />
a,b,c,d Means with different superscripts differ (P
REFERENCES<br />
■ Blanchard, P. H. 1992.Technology <strong>of</strong> corn wet mill<strong>in</strong>g<br />
and associated processes. Industrial Chemistry Library,<br />
Vol. 4. Elsevier, New York.<br />
■ Bremer,V. B, G.E. Erickson,T.J. Klopfenste<strong>in</strong>, M. L<br />
Gibson, K. J.Vander Pol, M.A. Greenquist. 2005.<br />
Feedlot performance <strong>of</strong> a new distillers byproduct<br />
(Dakota Bran) for f<strong>in</strong>ish<strong>in</strong>g cattle. J. Anim. Sci. 83:(Suppl.<br />
1.) National abstract<br />
■ <strong>Co</strong>oper, R.J., C.T. Milton,T.J. Klopfenste<strong>in</strong>,T.L. Scott,<br />
C.B.Wilson, and R.A. Mass. 2002. Effect <strong>of</strong> corn<br />
process<strong>in</strong>g on starch digestion and bacterial crude prote<strong>in</strong><br />
flow <strong>in</strong> f<strong>in</strong>ish<strong>in</strong>g cattle. J. Anim. Sci. 80:797-804.<br />
■ DeHann, K.,T. Klopfenste<strong>in</strong>, R. Stock, S. Abrams and<br />
R. Britton. 1982.Wet distillers co-products for grow<strong>in</strong>g<br />
rum<strong>in</strong>ants. Nebraska <strong>Beef</strong> Rep. MP_43:33.<br />
■ DeHaan, K.,T. Klopfenste<strong>in</strong>, and R. Stock. 1983. <strong><strong>Co</strong>rn</strong><br />
gluten feed-prote<strong>in</strong> and energy source for rum<strong>in</strong>ants.<br />
Neb. <strong>Beef</strong> Rep. MP 44:19.<br />
■ Fann<strong>in</strong>g, K,T. Milton,T. Klopfenste<strong>in</strong> and M. Klemesrud.<br />
1999. <strong><strong>Co</strong>rn</strong> and sorghum distillers gra<strong>in</strong>s for f<strong>in</strong>ish<strong>in</strong>g<br />
cattle. Nebraska <strong>Beef</strong> Rep. MP_71_A:32.<br />
■ Farl<strong>in</strong>, S.D. 1981.Wet distillers gra<strong>in</strong>s for f<strong>in</strong>ish<strong>in</strong>g<br />
cattle. Am<strong>in</strong>. Nutr.'Health 36:35.<br />
■ Farran,T. B., G. E. Erickson,T. J. Klopfenste<strong>in</strong>, C. N.<br />
Macken, and R. U. L<strong>in</strong>dquist. 2004.Wet corn gluten feed<br />
and alfalfa levels <strong>in</strong> dry-rolled corn f<strong>in</strong>ish<strong>in</strong>g diets. Neb.<br />
<strong>Beef</strong> Rep. (<strong>in</strong> press).<br />
■ Firk<strong>in</strong>s, J.L., L.L. Berger and G.C. Fahey, Jr. 1985.<br />
Evaluation <strong>of</strong> wet and dry distillers gra<strong>in</strong>s and wet and<br />
dry corn gluten feeds for rum<strong>in</strong>ants. J. Anim. Sci. 60:847.<br />
Gustad, K.,T. Klopfenste<strong>in</strong>, G. Erickson, J. MacDonald,<br />
K.Vander Pol, and M. Greenquist. 2006. Dried distillers<br />
gra<strong>in</strong>s supplementation to calves graz<strong>in</strong>g corn residue.<br />
■ Ham, G.A., R.A. Stock,T.J. Klopfenste<strong>in</strong>, E.M. Larson,<br />
D.H. Sha<strong>in</strong> and R.P. Huffman. 1994.Wet corn distillers<br />
co-products compared with dried corn distillers gra<strong>in</strong>s<br />
with solubles as a source <strong>of</strong> prote<strong>in</strong> and energy for<br />
rum<strong>in</strong>ant. J. Anim. Sci. 72:3246.<br />
■ Holt, S. M., and R. H. Pritchard. 2004. <strong>Co</strong>mposition<br />
and nutritive value <strong>of</strong> corn co-products from dry mill<strong>in</strong>g<br />
ethanol plants. South Dakota State <strong>Beef</strong> Report.<br />
16<br />
■ Jordon, D.J.,T. Klopfenste<strong>in</strong>, and T. Milton. 2001.Wet<br />
corn gluten feed supplementation <strong>of</strong> calves graz<strong>in</strong>g corn<br />
residue. Nebraska <strong>Beef</strong> Rep. MP 76-A:41-43<br />
■ Krehbiel, C.R., R.A. Stock, D.W. Herold, D.H. Sha<strong>in</strong>,<br />
G.A. Ham, and J.E. Carulla. 1995. Feed<strong>in</strong>g wet corn<br />
gluten feed to reduce subacute acidosis <strong>in</strong> cattle. J. Anim.<br />
Sci. 73:2931-2939.<br />
■ Larson, E.M., R.A. Stock,T.J. Klopfenste<strong>in</strong>, M.H. S<strong>in</strong>dt<br />
and R.P. Huffman. 1993. Feed<strong>in</strong>g value <strong>of</strong> wet distillers<br />
co-products from f<strong>in</strong>ish<strong>in</strong>g rum<strong>in</strong>ants. J.Anim. Sci. 71:2228.<br />
■ Loy,T.W.,T. J. Klopfenste<strong>in</strong>, G. E. Erickson, and C. N.<br />
Macken. 2003.Value <strong>of</strong> dry distillers gra<strong>in</strong>s <strong>in</strong> high-fiber<br />
diets and effect <strong>of</strong> supplementation frequency. Nebraska<br />
<strong>Beef</strong> Cattle Report MP 80-A:8.<br />
■ Loy,T.W., J. C. MacDonald,T. J. Klopfenste<strong>in</strong>, and G.<br />
E. Erickson. 2004. Effect <strong>of</strong> distillers gra<strong>in</strong>s or corn<br />
supplementation frequency on forage <strong>in</strong>take and<br />
digestibility. Nebraska <strong>Beef</strong> Cattle Rep. MP 80-A:22-24.<br />
■ Loy,T., D.Adams,T. Klopfenste<strong>in</strong>, J. Musgrave, and B.<br />
Teichert. 2004.A system for w<strong>in</strong>ter<strong>in</strong>g spr<strong>in</strong>g-calv<strong>in</strong>g bred<br />
heifers without feed<strong>in</strong>g hay. Nebraska <strong>Beef</strong> Rep. MP 80-A:7-9.<br />
■ Loza, P.L., K. J.Vander Pol, G. E. Erickson, R. A. Stock,<br />
and T. J. Klopfenste<strong>in</strong>. 2004. <strong><strong>Co</strong>rn</strong> mill<strong>in</strong>g co-products<br />
and alfalfa levels <strong>in</strong> cattle f<strong>in</strong>ish<strong>in</strong>g diets. J. Anim. Sci. 82<br />
(Suppl. 1):158.<br />
■ MacDonald, J. C., and T. J. Klopfenste<strong>in</strong>, 2004. Dried<br />
distillers gra<strong>in</strong>s as a grazed forage supplement. Nebraska<br />
<strong>Beef</strong> Cattle Rep. MP 80-A:22-24.<br />
■ Macken, C., G. Erickson,T. Klopfenste<strong>in</strong>, and R. Stock.<br />
2005. Effects <strong>of</strong> corn process<strong>in</strong>g method and crude prote<strong>in</strong><br />
level with <strong>the</strong> <strong>in</strong>clusion <strong>of</strong> wet corn gluten feed on f<strong>in</strong>ish<strong>in</strong>g<br />
steer performance. Pr<strong>of</strong>. Anim. Scient. (In press).<br />
■ Morris, S.E.,T.J. Klopfenste<strong>in</strong>, D.C.Adams, G.E. Erickson,<br />
and K.J.Vander Pol. 2005.The effects <strong>of</strong> dried distillers<br />
gra<strong>in</strong>s on heifers consum<strong>in</strong>g low or high quality forages.<br />
Neb. <strong>Beef</strong> Rep. MP 83-A:18-20<br />
■ NRC. 1996. Nutrient Requirements <strong>of</strong> <strong>Beef</strong> Cattle<br />
(7th Ed.). National Academy Press,Wash<strong>in</strong>gton, DC.<br />
■ Oliveros, B., F. Goedeken, E. Hawk<strong>in</strong>s, and T. Klopfenste<strong>in</strong>.<br />
1987. Dry or wet bran or gluten feed for rum<strong>in</strong>ants. Neb.<br />
<strong>Beef</strong> Rep. MP 52:14.
■ Owens, F. N., D. S. Secrist,W. J. Hill, and D. R. Gill.<br />
1997. The effect <strong>of</strong> gra<strong>in</strong> source and gra<strong>in</strong> process<strong>in</strong>g<br />
on performance <strong>of</strong> feedlot cattle: a review. J. Anim.<br />
Sci. 75:868-879.<br />
■ Parsons, C. H., M. L. Galyean, G.A. Nunnery, P. J. Defoor,<br />
and G. B. Salyer. 2001. Effects <strong>of</strong> Sweet Bran brand corn<br />
gluten feed and roughage level on performance and carcass<br />
characteristics <strong>of</strong> f<strong>in</strong>ish<strong>in</strong>g beef heifers. Burnett Center<br />
Internet Progress Report No. 9. Available at: http://www.<br />
asft.ttu.edu/burnett_center/progress_reports/bc9.pdf.<br />
■ Scott,T. L., C.T. Milton, G. E. Erickson,T. J. Klopfenste<strong>in</strong>,<br />
and R. A. Stock. 2003. <strong><strong>Co</strong>rn</strong> process<strong>in</strong>g method <strong>in</strong> f<strong>in</strong>ish<strong>in</strong>g<br />
diets conta<strong>in</strong><strong>in</strong>g wet corn gluten feed. J. Anim. Sci.<br />
81:3182-3190.<br />
■ Scott,T.,T. Klopfenste<strong>in</strong>, R. Stock, and M. Klemesrud.<br />
1997. Evaluation <strong>of</strong> corn bran and corn steep liquor for<br />
f<strong>in</strong>ish<strong>in</strong>g steers. Neb. <strong>Beef</strong> Rep. MP 67-A:72-74.<br />
■ S<strong>in</strong>dt, J. J., J. S. Drouillard, J. N. Pike, S. P. Montgomery,<br />
C. M. <strong>Co</strong>etzer,T. B. Farran,T. J. Kessen, and R.T. Eth<strong>in</strong>gton.<br />
2001. Alfalfa hay and wet corn gluten feed levels <strong>in</strong> steamflaked<br />
corn f<strong>in</strong>ish<strong>in</strong>g diets. KAES Report <strong>of</strong> Progress. No.<br />
873. p. 98.<br />
■ Stalker, L. A.,T. J. Klopfenste<strong>in</strong>, D. C. Adams, and G. E.<br />
Erickson. 2004. Urea <strong>in</strong>clusion <strong>in</strong> forage-based diets<br />
conta<strong>in</strong><strong>in</strong>g dried distillers gra<strong>in</strong>s. Neb. <strong>Beef</strong> Cattle Rep.<br />
MP 80-A:20-21.<br />
■ Stalker, L.A., D.C. Adams, and T.J. Klopfenste<strong>in</strong>. 2006.<br />
A system for w<strong>in</strong>ter<strong>in</strong>g beef heifers us<strong>in</strong>g dried distillers<br />
gra<strong>in</strong>. Neb. <strong>Beef</strong> Rep. MP 88-A:13.<br />
■ Stock, R. A., J. M. Lewis,T. J. Klopfenste<strong>in</strong>, and C.T.<br />
Milton. 1999. Review <strong>of</strong> new <strong>in</strong>formation on <strong>the</strong> use <strong>of</strong><br />
wet and dry mill<strong>in</strong>g feed by-products <strong>in</strong> feedlot diets.<br />
17<br />
Proc. Am. Soc. Anim. Sci. Available at: http://www.asas.org<br />
/jas/symposia/proceed<strong>in</strong>gs/0924.pdf.<br />
■ Stock, R.A. and R.A. Britton. 1993. Acidosis <strong>in</strong> Feedlot<br />
Cattle. In: Scientific Update on Rumens<strong>in</strong>/Tylan for <strong>the</strong><br />
Pr<strong>of</strong>ession Feedlot <strong>Co</strong>nsultant. Elanco Animal Health,<br />
Indianapolis, IN. p A_1.<br />
■ Stock, R.A., M. H. S<strong>in</strong>dt, R. M. Cleale, and R.A. Britton.<br />
1991. High-moisture corn utilization <strong>in</strong> f<strong>in</strong>ish<strong>in</strong>g cattle. J.<br />
Anim. Sci. 69:1645-1656.<br />
■ Trenkle, A. 1997a. Evaluation <strong>of</strong> wet distillers gra<strong>in</strong>s <strong>in</strong><br />
f<strong>in</strong>ish<strong>in</strong>g diets for yearl<strong>in</strong>g steers. <strong>Beef</strong> Research Report-<br />
Iowa State Univ. ASRI 450.<br />
■ Trenkle, A. 1997b. Substitut<strong>in</strong>g wet distillers gra<strong>in</strong>s or<br />
condensed solubles for corn gra<strong>in</strong> <strong>in</strong> f<strong>in</strong>ish<strong>in</strong>g diets for<br />
yearl<strong>in</strong>g heifers. <strong>Beef</strong> Research Report - Iowa State Univ.<br />
ASRI 451.<br />
■ Vander Pol, K. J. G. Erickson,T. Klopfenste<strong>in</strong>, and M.<br />
Greenquist. 2005a. Effect <strong>of</strong> level <strong>of</strong> wet distillers gra<strong>in</strong>s<br />
on feedlot performance <strong>of</strong> f<strong>in</strong>ish<strong>in</strong>g cattle and energy<br />
value relative to corn. J. Anim. Sci. 83(Suppl. 2):25.<br />
■ Vander Pol, K. J. G. Erickson, and T. Klopfenste<strong>in</strong>.<br />
2005b. Economics <strong>of</strong> wet distillers gra<strong>in</strong>s use <strong>in</strong> feedlot<br />
diets. J. Anim. Sci. 83(Suppl. 2):67.<br />
■ Vander Pol, K. J., G. E. Erickson,T. J. Klopfenste<strong>in</strong>. 2005c.<br />
Degradable <strong>in</strong>take prote<strong>in</strong> <strong>in</strong> f<strong>in</strong>ish<strong>in</strong>g diets conta<strong>in</strong><strong>in</strong>g dried<br />
distillers gra<strong>in</strong>s. J.Anim. Sci. 83(Suppl. 2):62.<br />
■ Vander Pol, K. J., G. E. Erickson, M. A. Greenquist, and<br />
T. J. Klopfenste<strong>in</strong>. 2006. Effect <strong>of</strong> <strong><strong>Co</strong>rn</strong> Process<strong>in</strong>g <strong>in</strong><br />
F<strong>in</strong>ish<strong>in</strong>g Diets <strong>Co</strong>nta<strong>in</strong><strong>in</strong>g Wet Distillers Gra<strong>in</strong>s on<br />
Feedlot Performance and Carcass Characteristics <strong>of</strong><br />
F<strong>in</strong>ish<strong>in</strong>g Steers. 2006 Nebraska <strong>Beef</strong> Rep. (<strong>in</strong> press).<br />
For more <strong>in</strong>formation on <strong>the</strong> feed<strong>in</strong>g <strong>of</strong> corn mill<strong>in</strong>g co-products to beef cattle<br />
and <strong>in</strong>formation conta<strong>in</strong>ed <strong>in</strong> this manual, contact:<br />
Dr. Galen Erickson ■ University <strong>of</strong> Nebraska-L<strong>in</strong>coln ■ Department <strong>of</strong> Animal Science<br />
Room C220 ■ L<strong>in</strong>coln, NE 68583-0908 ■ 402-472-6402
www.nebraskacorn.org<br />
The University <strong>of</strong> Nebraska-L<strong>in</strong>coln does not discrim<strong>in</strong>ate based<br />
on gender, age, disability, race, color, religion, marital status,<br />
veteran’s status, national or ethnic orig<strong>in</strong>, or sexual orientation.