a novel correlation sum method for cognitive radio spectrum sensing
a novel correlation sum method for cognitive radio spectrum sensing
a novel correlation sum method for cognitive radio spectrum sensing

You also want an ePaper? Increase the reach of your titles
YUMPU automatically turns print PDFs into web optimized ePapers that Google loves.
A NOVEL CORRELATION SUM METHOD FOR<br />
COGNITIVE RADIO SPECTRUM SENSING<br />
R. K. Sharma and J. W. Wallace<br />
Department of Electrical Engineering, Jacobs University, Bremen,<br />
Campus Ring 1, 28759, Bremen, Germany, Email: ra.sharma@jacobs-university.de, wall@ieee.org<br />
I. INTRODUCTION<br />
Cognitive <strong>radio</strong> is a promising concept <strong>for</strong> coping with the <strong>spectrum</strong> scarcity in future generation wireless communication<br />
networks. This idea, including software-defined <strong>radio</strong> (SDR) as the enabling technology, was suggested by Mitola<br />
[1] to realize flexible and efficient usage of <strong>spectrum</strong>. An important component of <strong>cognitive</strong> <strong>radio</strong> is <strong>spectrum</strong> <strong>sensing</strong><br />
to detect the presence or absence of a primary (licensed) user in the <strong>spectrum</strong> <strong>for</strong> a given location. Some existing<br />
<strong>spectrum</strong> <strong>sensing</strong> techniques found in the <strong>cognitive</strong> <strong>radio</strong> literature are matched filtering, wave<strong>for</strong>m-based <strong>sensing</strong> [2],<br />
cyclostationary-based <strong>sensing</strong> [3], [4], energy detection [5]-[8], and <strong>radio</strong> identification. In this paper we present a new<br />
<strong>correlation</strong> <strong>sum</strong> <strong>method</strong>, and compare its per<strong>for</strong>mance with energy detection, which is the most common way to detect<br />
the presence of generalized, unknown signals.<br />
The rest of the paper is organized as follows: Section II introduces the problem of <strong>spectrum</strong> <strong>sensing</strong> and discusses<br />
energy-based detection. Section III describes our <strong>correlation</strong> <strong>sum</strong> <strong>method</strong> <strong>for</strong> <strong>sensing</strong>. Section IV gives some simulation<br />
results with discussions. Conclusion and future extensions are discussed in Section V.<br />
II. SPECTRUM SENSING FOR COGNITIVE RADIO<br />
Spectrum <strong>sensing</strong> determines the presence or absence of the primary user based on a specific detection model. In this<br />
work, we as<strong>sum</strong>e a received signal with the simple <strong>for</strong>m y (n) = s (n)+w (n), where s (n) is the signal to be detected,<br />
w (n) is an additive white Gaussian noise (AWGN) sample, and n is the sample index. Note that when no primary<br />
user is transmitting, s (n) = 0.<br />
1) Energy-Detector Sensing<br />
Energy detection is taken as the reference <strong>for</strong> comparison in this paper, since it is general and can be applied to any<br />
unknown signal [5]. The <strong>method</strong> has also been analyzed in the presence of signals with random amplitude and channel<br />
fading [6],[7]. For a lowpass signal having bandwidth W , the energy in a sample record of duration T is approximated<br />
by 2TW, where the received wave<strong>for</strong>m is sampled at the rate 2W . The energy is expressed as<br />
T<br />
E = n 2 (t) dt ≈<br />
0<br />
1<br />
2W<br />
where n(t) is a Gaussian noise process, and ai is the ith noise sample.<br />
2TW<br />
<br />
The results are the same <strong>for</strong> a bandpass processes provided that W is interpreted as the positive frequency bandwidth.<br />
For zero mean Gaussian distributed noise only (H0), the energy E follows central chi-square χ2 distribution with<br />
2TW degrees of freedom. In the case that the primary user (signal) is present (H1), E follows a non-central chi-square<br />
2 χ distribution with 2TW degrees freedom and a non-centrality parameter 2γ, where γ is the signal-to-noise ratio<br />
(SNR), or<br />
<br />
E =<br />
χ 2 2TW<br />
χ 2 2TW<br />
i=1<br />
H0,<br />
(2γ) H1,<br />
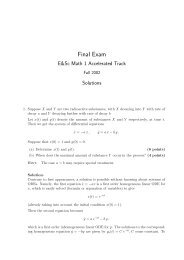
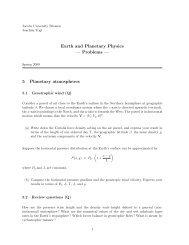
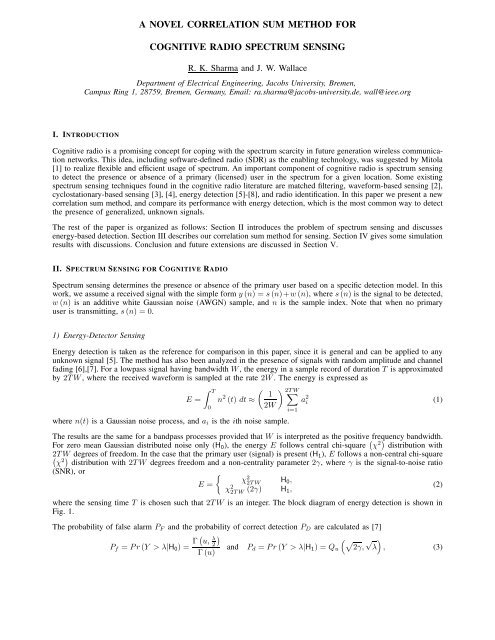
where the <strong>sensing</strong> time T is chosen such that 2TW is an integer. The block diagram of energy detection is shown in<br />
Fig. 1.<br />
The probability of false alarm PF and the probability of correct detection PD are calculated as [7]<br />
Pf = Pr (Y > λ|H0) = Γ u, λ<br />
2<br />
Γ (u)<br />
<br />
a 2 i<br />
√ <br />
and Pd = Pr (Y > λ|H1) = Qu 2γ, λ , (3)<br />
(1)<br />
(2)
(t)<br />
Band Pass<br />
Filter (W)<br />
x(t)<br />
Squaring Device<br />
y<br />
( ) ( ) 2<br />
t = •<br />
y()<br />
t<br />
E =<br />
Fig. 1. Block diagram of an energy detector<br />
T<br />
<br />
0<br />
y(<br />
t)<br />
dt<br />
> H1<br />
E Eth<br />
< H<br />
where λ is the decision threshold, Γ (., .) is the incomplete gamma function, and u = TW is the time bandwidth<br />
product. As expected, Pf is independent of γ since under H0 there is no primary signal present.<br />
III. PROPOSED CORRELATION SUM METHOD<br />
Instead of only considering the energy of the signal to be detected, we can exploit any properties that exist in signal<br />
that are not present in the noise. One such property is the auto<strong>correlation</strong> of the samples. The auto<strong>correlation</strong> function<br />
of bandpass noise is a modulated sinc function whose envelope has its first zero crossing at 1/W , where W is the<br />
bandwidth of the noise (as well as the <strong>sensing</strong> bandwidth). However, the envelope of the auto<strong>correlation</strong> function of<br />
the signal will deviate from a sinc, depending on the transmit symbol rate, modulation, and pulse shaping. When<br />
<strong>correlation</strong> is present in this signal, the first zero crossing of the auto<strong>correlation</strong> will happen at a larger time lag than<br />
that of the noise.<br />
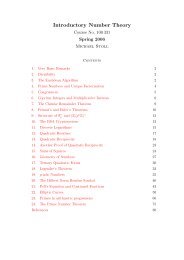
To detect the deviation of the received wave<strong>for</strong>m from noise, the envelope of the empirical auto<strong>correlation</strong> function of<br />
the received signal is integrated up to its first null τ = 1/W and this value is used as a decision statistic to test the<br />
hypothesis that a primary user is present, which exploits both the energy and auto<strong>correlation</strong> of the received samples.<br />
A block diagram of the <strong>correlation</strong> <strong>sum</strong> <strong>method</strong> is shown in Fig. 2.<br />
r(t)<br />
Band Pass<br />
Filter (2W)<br />
x(t)<br />
R<br />
x<br />
T<br />
( τ ) x(<br />
t)<br />
x(<br />
t −τ<br />
)dt<br />
= 0<br />
Envelope<br />
Detection<br />
Renv(<br />
τ )<br />
SR<br />
1<br />
W<br />
x = Renv<br />
0<br />
Fig. 2. Block diagram of the <strong>correlation</strong> <strong>sum</strong> <strong>method</strong><br />
( τ ) dτ<br />
0<br />
> H1<br />
ϖ ϖth<br />
< H<br />
The auto<strong>correlation</strong> and power spectral density (PSD) of ideal lowpass noise are related by the the Fourier trans<strong>for</strong>m<br />
pair [9]<br />
sinc (Wτ) ←→ 1<br />
W rect<br />
<br />
f<br />
,<br />
W<br />
(4)<br />
where W/2 is the bandwidth of the lowpass signal. The bandpass signal <strong>for</strong> a center frequency of fc is obtained by<br />
shifting the <strong>spectrum</strong> to +fc and −fc, resulting in bandwidth W . From the frequency shifting property [9], the PSD<br />
is related to the auto<strong>correlation</strong> as<br />
A sinc (Wτ) cos2πfcτ ←→ A<br />
2W<br />
<br />
rect<br />
<br />
f − fc<br />
+ rect<br />
W<br />
<br />
f + fc<br />
. (5)<br />
W<br />
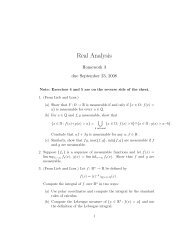
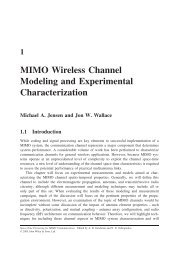
The left hand side of (5) is the auto<strong>correlation</strong> function of the bandpass noise. Its theoretical plot is shown on the left<br />
hand side of the Fig. 3. For later convenience, A is taken to be 1.6×10 5 to compare it with the simulated auto<strong>correlation</strong><br />
with the same energy. The x-axis is time lag (τ) multiplied by the sampling rate FR to obtain integer values. The<br />
envelope of the auto<strong>correlation</strong> is A sinc (Wτ), which is plotted on the right-hand side of Fig. 3, showing that the first<br />
null of the envelope of the auto<strong>correlation</strong> appears at τ = 1/W , corresponding to 40 samples on the τFR axis.<br />
An example of the auto<strong>correlation</strong> and single-sided PSD of simulated bandpass noise taking 1.6 × 10 5 samples with<br />
unit variance is shown in Fig. 4. Similarly, the auto<strong>correlation</strong> and PSD of a QPSK signal with symbol rate 1 MS/s<br />
is shown in Fig. 5, indicating a more gradual decay of the auto<strong>correlation</strong> function compared to the noise. Note that<br />
the integration of the envelope from τ = 0 to τ = 1/W is significantly larger than that of the noise, even when the<br />
energies are equal.<br />
IV. PERFORMANCE COMPARISON<br />
A. Noise Only (No Fading)<br />
Simulations of the <strong>correlation</strong> <strong>sum</strong> <strong>method</strong> were carried out <strong>for</strong> a BPSK signal (rectangular pulses) with a symbol<br />
rate of either 1 MS/s and 10 MS/s and a <strong>sensing</strong> bandwidth of 20 MHz. These simulations are compared to energy<br />
0
R g (τ*F R )<br />
1<br />
0<br />
−1<br />
x 105<br />
2<br />
Auto<strong>correlation</strong> of Bandpass Noise<br />
−2<br />
−200 −100 0 100 200<br />
τ*F R<br />
R g (τ*F R )<br />
1<br />
0<br />
−1<br />
2 x 10⁵ Enevelope of the Autocorr. of the BP Noise<br />
−2<br />
−200 −100 0 100 200<br />
Fig. 3. Theoretical auto<strong>correlation</strong> function and its envelope <strong>for</strong> bandpass noise <strong>for</strong> a bandwidth of 20 MHz and sample rate 800 ×10 6 Samples/s.<br />
R g (τ*F R )<br />
1<br />
0<br />
−1<br />
Auto<strong>correlation</strong> of the Bandpass Noise<br />
x 105<br />
2<br />
−2<br />
−200 −100 0 100 200<br />
τ*F R<br />
ψ g (f)<br />
x 10−3<br />
2.5<br />
2<br />
1.5<br />
1<br />
0.5<br />
τ*F R<br />
Single Sided PSD of the Bandpass Noise<br />
0.8 0.9 1 1.1 1.2<br />
x 10 8<br />
0<br />
f (Hz)<br />
Fig. 4. The Auto<strong>correlation</strong> and PSD (Single-Sided) of the Bandpass Noise of Bandwidth 20MHz<br />
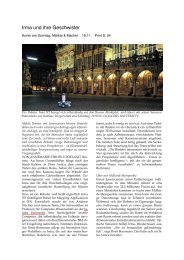
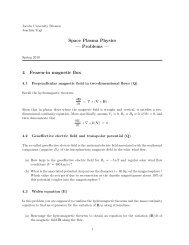
detection <strong>for</strong> a <strong>sensing</strong> time of 0.002 ms (2TW = 40), and the results are shown in Fig. 6. The improvement in the<br />
probability of detection offered by the <strong>correlation</strong> <strong>sum</strong> <strong>method</strong> is readily apparent.<br />
The results in Fig. 6 indicate that although the per<strong>for</strong>mance of energy detection does not depend on the symbol rate,<br />
the per<strong>for</strong>mance of the <strong>correlation</strong> <strong>sum</strong> <strong>method</strong> is degraded with increasing symbol rate. In the limit as the symbol rate<br />
becomes large, the transmission bandwidth is also large and the <strong>spectrum</strong> inside the <strong>sensing</strong> window becomes flat and<br />
similar to noise. In this case, the per<strong>for</strong>mance of the <strong>correlation</strong> <strong>sum</strong> <strong>method</strong> approaches that of the energy detector.<br />
The simulation was also carried out <strong>for</strong> a QPSK signal with the same parameters used <strong>for</strong> BPSK, but the per<strong>for</strong>mance<br />
is basically identical. The reason is that <strong>for</strong> the same symbol rate, the <strong>spectrum</strong> of BPSK and QPSK signals are similar.<br />
R(τ* F R )<br />
1<br />
0<br />
−1<br />
x 105<br />
2<br />
Auto<strong>correlation</strong> of the Bandpass Signal<br />
−2<br />
−200 −100 0 100 200<br />
τ*F R<br />
ψ s (f)<br />
0.2<br />
0.15<br />
0.1<br />
0.05<br />
Single Sided PDS of the Bandpass Signal<br />
0.8 0.9 1 1.1 1.2<br />
x 10 8<br />
0<br />
f(Hz)<br />
Fig. 5. The auto<strong>correlation</strong> and PSD (Single-Sided) of the bandpass QPSK Signal (1 MS/s) with a filter bandwidth of 20 MHz
Primary Detection Probability (P d ) in (%)<br />
100<br />
90<br />
80<br />
70<br />
60<br />
50<br />
40<br />
30<br />
20<br />
10<br />
ROC <strong>for</strong> SNR = −6dB<br />
CorrSum Method(R s =1 Msps)<br />
Energy Method (R s =1 Msps)<br />
CorrSum Method(R s =10 Msps)<br />
Energy Method (R s =10 Msps)<br />
0<br />
0 0.2 0.4 0.6 0.8 1<br />
False Alarm Probability (P )<br />
f<br />
Fig. 6. ROC curves comparing the per<strong>for</strong>mance of the <strong>correlation</strong><br />
<strong>sum</strong> <strong>method</strong> and energy detection <strong>method</strong> <strong>for</strong> different symbol rates<br />
as<strong>sum</strong>ing BPSK transmission<br />
B. Per<strong>for</strong>mance in Fading Environments<br />
Primary Detection Probability (P d ) in (%)<br />
100<br />
90<br />
80<br />
70<br />
60<br />
50<br />
40<br />
ROC <strong>for</strong> SNR = −6dB and Combined Fading<br />
30<br />
CorrSum Method (σ = 0dB)<br />
Energy Method(σ = 0dB)<br />
20<br />
CorrSum Method (σ = 5dB))<br />
Energy Method ((σ = 5dB)<br />
10<br />
CorrSum Method (σ = 10dB)<br />
Energy Method (σ = 10dB)<br />
0<br />
0 0.2 0.4 0.6 0.8 1<br />
False Alarm Probability (P )<br />
f<br />
Fig. 7. ROC curves comparing the per<strong>for</strong>mance of the <strong>correlation</strong> <strong>sum</strong><br />
<strong>method</strong> and energy detection <strong>method</strong> in different levels of shadowing<br />
In practice, the <strong>sensing</strong> problem involves both small-scale (multipath) and large-scale (shadow) fading. These two<br />
effects are commonly treated as independent processes that combine to produce the overall fading effect [10], and<br />
this effect usually degrades existing <strong>spectrum</strong> <strong>sensing</strong> <strong>method</strong>s. The per<strong>for</strong>mance of the <strong>correlation</strong> <strong>sum</strong> and energy<br />
detection <strong>method</strong>s in a fading environment with three different levels of log-normal shadowing is shown in Fig. 7,<br />
where σ is the log-normal shadowing standard deviation. It can be seen that <strong>for</strong> severe combined fading Pd approaches<br />
Pf , indicating that the presence of the user cannot be detected. However, the per<strong>for</strong>mance of the <strong>correlation</strong> <strong>sum</strong><br />
<strong>method</strong> is better than energy detection in all fading cases. Due to space limitations, detailed in<strong>for</strong>mation on the fading<br />
simulations is saved <strong>for</strong> the presentation.<br />
V. CONCLUSION<br />
Efficient <strong>sensing</strong> of the available <strong>spectrum</strong> opportunities is an important element of <strong>cognitive</strong> <strong>radio</strong>. This work proposed<br />
a new <strong>correlation</strong> <strong>sum</strong> <strong>method</strong> and its per<strong>for</strong>mance was compared with standard energy detection. Simulation results<br />
indicate that the new <strong>correlation</strong> <strong>sum</strong> <strong>method</strong> has better per<strong>for</strong>mance than energy detection <strong>for</strong> different types of<br />
modulation in both static and fading environments. In future work, we plan to investigate the per<strong>for</strong>mance of the new<br />
<strong>method</strong> <strong>for</strong> collaborative <strong>sensing</strong>, multiple antennas per user, and more realistic channel models.<br />
REFERENCES<br />
[1] J. Mitola III and G. Maguire Jr., “Cognitive <strong>radio</strong>: Making software <strong>radio</strong>s more personal,” IEEE Personal Communications Magazine, vol. 6,<br />
no. 4, pp. 13–18, Aug. 1999.<br />
[2] A. Sahai, R. Tandra, S. M. Mishra, and N. Hoven, “Fundamental design tradeoffs in <strong>cognitive</strong> <strong>radio</strong> systems,” in Proc. of Int. Workshop on<br />
Technology and Policy <strong>for</strong> Accessing Spectrum, Aug. 2006.<br />
[3] M. Oner and F. Jondral, “Cyclostationarity based air interface recognition <strong>for</strong> software <strong>radio</strong> systems,” in Proc. IEEE Radio and Wireless Conf.,<br />
Atlanta, Georgia, Sept. 2004, pp. 263–266.<br />
[4] W. Gardner, “Exploitation of spectral redundancy in cyclostationary signals,” IEEE Signal Processing Mag., vol. 8, no. 2, pp. 14–36, 1991.<br />
[5] H. Urkowitz, “Energy detection of unknown deterministic signals,” Proc. IEEE, vol. 55, no. 4, pp. 523–531, Apr. 1967.<br />
[6] V. Kostylev, “Energy detection of a signal with random amplitude,” Proc. 2002 IEEE Intl. Conf. Commun., vol. 3, pp. 1606– 1610, Apr. 2002.<br />
[7] F. F. Digham, M. Alouini, and M. K. Simon, “On the energy detection of unknown signals over fading channels,” in Proc. 2003 IEEE Intl.<br />
Conf. Commun., May 2003, pp. 3575–3579.<br />
[8] A. Ghasemi and E. S. Sousa, “Collaborative <strong>spectrum</strong> <strong>sensing</strong> <strong>for</strong> opportunistic access in fading environments,” in Proc. of DySPAN’05, Nov.<br />
2005, pp. 131–136.<br />
[9] S. Haykin, An Introduction to Analog and Digital Communications. John Wiley and Sons, 1989.<br />
[10] R. Prasad and A. Kegel, “Effect of Rician faded and log-normal shadowed signals on <strong>spectrum</strong> efficiency in microcellular <strong>radio</strong>,” IEEE Trans.<br />
Veh. Technol., vol. 42, no. 3, pp. 274–281, Aug. 1993.