Comparison of glycemic index of spelt and wheat ... - ResearchGate
Comparison of glycemic index of spelt and wheat ... - ResearchGate
Comparison of glycemic index of spelt and wheat ... - ResearchGate

You also want an ePaper? Increase the reach of your titles
YUMPU automatically turns print PDFs into web optimized ePapers that Google loves.
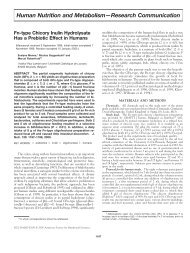
Analytical, Nutritional <strong>and</strong> Clinical Methods<br />
<strong>Comparison</strong> <strong>of</strong> <strong>glycemic</strong> <strong>index</strong> <strong>of</strong> <strong>spelt</strong> <strong>and</strong> <strong>wheat</strong> bread in<br />
human volunteers<br />
Carole Marques a , Ludovic DÕauria a , Patrice D. Cani a , Chiara Baccelli b ,<br />
Raoul Rozenberg c , Nike L. Ruibal-Mendieta d ,Géraldine Petitjean b ,<br />
Dominique L. Delacroix e , Joëlle Quetin-Leclercq b , Jean-Louis Habib-Jiwan c ,<br />
Marc Meurens d , Nathalie M. Delzenne a, *<br />
a Unité de pharmacocinétique, métabolisme, nutrition et toxicologie, Université catholique de Louvain, Av. E. Mounier 73, 1200 Bruxelles, Belgium<br />
b Unité dÕanalyse chimique et physicochimique des médicaments, Université catholique de Louvain, Av. E. Mounier 72, 1200 Bruxelles, Belgium<br />
c Laboratoire de spectrométrie de masse, Université catholique de Louvain, Pl. L. Pasteur 1, 1348 Louvain-la-Neuve, Belgium<br />
d Unité de biochimie de la nutrition, Université catholique de Louvain, Croix du Sud 2/8, 1348 Louvain-la-Neuve, Belgium<br />
e Moulin de Hollange, Rue de Chaumont 5, 6637 Hollange, Belgium<br />
Abstract<br />
Received 31 March 2005; received in revised form 4 October 2005; accepted 9 October 2005<br />
The assessment <strong>of</strong> the <strong>glycemic</strong> <strong>index</strong> (GI) seems to be an important parameter to take into account in order to better underst<strong>and</strong> the<br />
physiologic effects <strong>of</strong> foods with high carbohydrate levels. Among cereals, which are major sources <strong>of</strong> carbohydrates, <strong>spelt</strong> (Triticum<br />
<strong>spelt</strong>a L.) has been considered as particularly interesting from a nutritional point <strong>of</strong> view. The aim <strong>of</strong> this study was to evaluate<br />
in vivo the GI <strong>of</strong> white <strong>spelt</strong> bread in healthy subjects. The <strong>wheat</strong> (Triticum aestivum L.) white bread was used as reference food. To<br />
avoid differences in the production <strong>of</strong> both breads, <strong>spelt</strong> <strong>and</strong> <strong>wheat</strong> breads were baked under the same controlled conditions. Results<br />
showed that the <strong>glycemic</strong> pr<strong>of</strong>ile <strong>of</strong> <strong>spelt</strong> white bread was not different from that <strong>of</strong> <strong>wheat</strong> white bread (GI <strong>of</strong> 93 ± 9). The area under<br />
the <strong>glycemic</strong> curve significantly <strong>and</strong> negatively correlated to fasting glycemia <strong>and</strong> carbohydrate intake during evening meals preceding the<br />
test. In conclusion, the <strong>glycemic</strong> response to <strong>spelt</strong> bread was similar to that <strong>of</strong> <strong>wheat</strong> bread. However, in order to avoid more inter-individual<br />
variability, our data supports the importance to propose st<strong>and</strong>ardised carbohydrate content for the last meal before evaluating the<br />
GI <strong>of</strong> food.<br />
Ó 2005 Elsevier Ltd. All rights reserved.<br />
Keywords: Glycemic <strong>index</strong>; Spelt; Wheat; Bread; Evening meal<br />
1. Introduction<br />
Spelt (Triticum <strong>spelt</strong>a L.) is an ancient bread cereal<br />
related to <strong>wheat</strong> (Triticum aestivum L.) that has been culti-<br />
0308-8146/$ - see front matter Ó 2005 Elsevier Ltd. All rights reserved.<br />
doi:10.1016/j.foodchem.2005.10.003<br />
Food Chemistry 100 (2007) 1265–1271<br />
Abbreviations: AOAC, Association <strong>of</strong> Official Analytical Chemists;<br />
BMI, body mass <strong>index</strong>; FAO, Food <strong>and</strong> Agriculture Organisation; GI,<br />
<strong>glycemic</strong> <strong>index</strong>; HPLC, high precision liquid chromatography; IAUC,<br />
incremental area under the curve; MUFA, monounsaturated fatty acid;<br />
SEM, st<strong>and</strong>ard errors <strong>of</strong> the mean; WHO, World Health Organisation.<br />
* Corresponding author. Tel.: +322 764 73 67; fax: +322 764 73 59.<br />
E-mail address: Delzenne@pmnt.ucl.ac.be (N.M. Delzenne).<br />
Food<br />
Chemistry<br />
www.elsevier.com/locate/foodchem<br />
vated for hundreds <strong>of</strong> years, <strong>and</strong> that is now being rediscovered<br />
in Europe <strong>and</strong> North America (Abdel Aal, Hucl,<br />
& Sosulski, 1995; Abdel Aal, Sosulski, & Hucl, 1998; Ranhotra,<br />
Gelroth, Glaser, & Stallknecht, 1996). Today, more<br />
<strong>spelt</strong>-based products are available including flour, bread,<br />
breakfast cereals, pasta <strong>and</strong> crackers. It seems that this cereal<br />
has valuable nutritional <strong>and</strong>/or physiological properties,<br />
which could help promoting the consumption <strong>of</strong><br />
these products. However, no scientific basis for such claims<br />
has been established yet.<br />
Because <strong>of</strong> the high levels <strong>of</strong> carbohydrates in cereals,<br />
the determination <strong>of</strong> <strong>glycemic</strong> <strong>index</strong> (GI) <strong>of</strong> <strong>spelt</strong> bread
1266 C. Marques et al. / Food Chemistry 100 (2007) 1265–1271<br />
seemed to be an important criterion to take into account<br />
when evaluating the so-called nutritional <strong>and</strong> physiological<br />
advantages <strong>of</strong> this cereal. The GI concept was proposed for<br />
the first time by Jenkins et al. (1981), in order to give complementary<br />
information about the chemical composition <strong>of</strong><br />
carbohydrate-rich foods. This <strong>index</strong> is defined by the Food<br />
<strong>and</strong> Agriculture Organisation/World Health Organisation<br />
(FAO/WHO) as the incremental area under the blood glucose<br />
response curve <strong>of</strong> a 50 g carbohydrate portion <strong>of</strong> a test<br />
food expressed as a percentage <strong>of</strong> the response to the same<br />
amount <strong>of</strong> carbohydrate from a st<strong>and</strong>ard food taken by the<br />
same subject (FAO/WHO, 1998).<br />
The regular consumption <strong>of</strong> foods exhibiting a high GI<br />
is associated with the development <strong>of</strong> some diseases such<br />
as type 2 diabetes (Augustin, Franceschi, Jenkins, Kendall,<br />
& La Vecchia, 2002; Hodge, English, OÕDea, &<br />
Giles, 2004) <strong>and</strong> certain forms <strong>of</strong> cancer (Augustin<br />
et al., 2001, 2003a, 2003b, 2003c; Franceschi et al.,<br />
2001) <strong>and</strong> to an increased risk <strong>of</strong> cardiovascular diseases<br />
<strong>and</strong> obesity (Roberts, 2000; Ludwig, 2002). Furthermore,<br />
by promoting satiety <strong>and</strong> promoting fat oxidation at the<br />
expense <strong>of</strong> carbohydrate oxidation (Ball et al., 2003; Warren,<br />
Henry, & Simonite, 2003; Wu, Nicholas, Williams,<br />
Took, & Hardy, 2003), the intake <strong>of</strong> low GI foods may<br />
benefit weight regulation <strong>and</strong> be favourable in the treatment<br />
<strong>of</strong> obesity. Consequently, the intake <strong>of</strong> low GI foods<br />
is an important factor for maintaining a healthy diet. Several<br />
nutrients are implicated in the drop <strong>of</strong> the GI such as<br />
fat, proteins, a-amylase inhibitors (lectin, phytate), galactose,<br />
fructose <strong>and</strong> viscous fibres (guar, b-glucan) (Augustin<br />
et al., 2002). In addition, the olig<strong>of</strong>ructose, a<br />
fructan type fermentable fibre, might in addition to its<br />
‘‘fibre effect’’ exert an effect on GI, since it is able to<br />
improve glucose homeostasis (Delzenne, 2003).<br />
Bonafaccia et al. (2000) carried out a study on three<br />
<strong>spelt</strong> cultivars (Hercule, Rouquin <strong>and</strong> Ostro, Italy, 1992–<br />
1994) <strong>and</strong> showed that these cereals have a higher content<br />
<strong>of</strong> protein <strong>and</strong> soluble dietary fibre than common <strong>wheat</strong>.<br />
The presence <strong>of</strong> these nutrients may play a role in the<br />
decrease <strong>of</strong> the GI <strong>of</strong> <strong>spelt</strong>-based products.<br />
GI value can be calculated by using a mathematical formula<br />
based on an in vitro starch hydrolysis assay (Granfeldt,<br />
Bjorck, Drews, & Tovar, 1992). By using this test,<br />
<strong>spelt</strong> bread did not differ from <strong>wheat</strong> bread, in terms <strong>of</strong><br />
sugar release kinetics; the in vitro predicted GI was 105<br />
(Foster-Powell, Holt, & Br<strong>and</strong>-Miller, 2002; Skrabanja<br />
et al., 2001). Is the GI <strong>of</strong> <strong>spelt</strong> vs. <strong>wheat</strong> bread also similar<br />
in vivo? The aim <strong>of</strong> this study was to evaluate the GI <strong>of</strong><br />
<strong>spelt</strong> white bread in vivo, <strong>and</strong> to compare it with <strong>wheat</strong><br />
white bread.<br />
2. Materials <strong>and</strong> methods<br />
2.1. Materials<br />
The <strong>spelt</strong> grains (T. <strong>spelt</strong>a L. cv. Rouquin) <strong>and</strong> the<br />
<strong>wheat</strong> grains (T. aestivum L. cv. Herzog) were cultivated,<br />
respectively, in the Belgian Ardennes <strong>and</strong> the Belgian<br />
region <strong>of</strong> Famenne, during the 2001–2002 growing season.<br />
After harvest, grains from both species were milled with a<br />
roller mill in 4 breaking <strong>and</strong> 4 reducing passages <strong>and</strong> bolted<br />
on a planschister through a 100 lm sieve. The <strong>spelt</strong> <strong>and</strong><br />
<strong>wheat</strong> sieved flours produced this way are used for the baking<br />
<strong>of</strong> breads.<br />
2.2. Preparation <strong>of</strong> breads<br />
Spelt <strong>and</strong> <strong>wheat</strong> breads were made <strong>and</strong> baked with a<br />
bread maker (Home bread model, ABKE 41 MoulinexÒ)<br />
<strong>and</strong> were composed either <strong>of</strong> <strong>spelt</strong> flour (525 g) or <strong>wheat</strong><br />
flour (525 g), water (320 ml), dehydrated yeast (7 g) <strong>and</strong><br />
salt (6 g).<br />
The nutritional composition <strong>of</strong> breads has been evaluated<br />
after a chemical analysis <strong>of</strong> both flours by AOAC<br />
(2000) methods. Fructans have also been qualitatively<br />
<strong>and</strong> quantitatively evaluated by high performance liquid<br />
chromatography (HPLC) in collaboration with Orafti (Tienen,<br />
Belgium) (Joye & Hoebregs, 2000). Both breads were<br />
weighed after baking to take water loss into account in this<br />
calculation.<br />
2.3. Experimental design<br />
Ten healthy subjects (five males <strong>and</strong> five females) were<br />
included in the study. Their ages ranged from 23 to 57<br />
years old <strong>and</strong> their body mass <strong>index</strong> (BMI, in kg/m 2 ) from<br />
18.6 to 25 (Table 1). They were given a food/lifestyle questionnaire<br />
before the beginning <strong>of</strong> the experiment, in order<br />
to assess the parameters which could influence <strong>glycemic</strong><br />
response (physical exercise, time <strong>and</strong> content <strong>of</strong> the last<br />
meal, the water consumption before the test). The food<br />
analysis <strong>of</strong> the last meal was performed for each subject.<br />
The GI value <strong>of</strong> <strong>spelt</strong> bread was determined by using the<br />
previously described st<strong>and</strong>ard protocol further developed<br />
by Wolever, Jenkins, Jenkins, <strong>and</strong> Josse (1991), <strong>and</strong><br />
accepted by the FAO/WHO (1998).<br />
Briefly, the subjects were fed with a portion <strong>of</strong> <strong>spelt</strong><br />
white bread (test food) or <strong>wheat</strong> white bread (st<strong>and</strong>ard<br />
Table 1<br />
Characteristics <strong>of</strong> subjects<br />
Subjects Gender Years<br />
old<br />
Weight<br />
(kg)<br />
Height<br />
(m)<br />
BMI<br />
(kg/m 2 )<br />
1 Female 57 56 1.68 19.8<br />
2 Female 45 64 1.60 25<br />
3 Female 46 67 1.69 23.4<br />
4 Female 23 50 1.64 18.6<br />
5 Female 25 54 1.61 20.8<br />
6 Male 51 74 1.77 23.6<br />
7 Male 23 76 1.79 23.7<br />
8 Male 25 73 1.75 23.8<br />
9 Male 26 60 1.71 20.5<br />
10 Male 23 58 1.67 20.7
food) containing 50 g carbohydrates as determined by the<br />
AOAC (2000) methods. This quantity represented about<br />
95 g fresh bread.<br />
Both breads were tested three times on each subject on<br />
separate days, with intervals <strong>of</strong> at least three days between<br />
measurements performed in the same subject.<br />
The subjects came in the laboratory in the morning after<br />
10–12 h <strong>of</strong> overnight fast. The only beverage accepted during<br />
this fast was water. The blood samples were taken from<br />
subject before (0 min) <strong>and</strong> 15, 30, 45, 60, 90 <strong>and</strong> 120 min<br />
after the start <strong>of</strong> the meal. The glyceamia was measured<br />
by a strip gluco-meter based on glucose-dehydrogenase<br />
mediated oxidation <strong>of</strong> glucose (Accu-chek Sensor, Roche Ò ,<br />
Mannheim, Germany). Two glasses <strong>of</strong> water were given<br />
after 60 <strong>and</strong> 90 min to each subject. A st<strong>and</strong>ardised questionnaire<br />
was given before, during <strong>and</strong> after the experiment<br />
to analyse the sensation related to hunger, or digestion.<br />
The area under the curve for both breads was calculated<br />
geometrically as the incremental area under the blood glucose<br />
response curve (IAUC) as described by Wolever et al.<br />
(1991). Only the area above the fasting concentration was<br />
included. The experiment was performed with the agreement<br />
<strong>of</strong> the local ethical committee.<br />
2.4. Statistical analyses<br />
Results were expressed as means with st<strong>and</strong>ard errors <strong>of</strong><br />
the mean (SEM). By using an Excel spreadsheet, the paired<br />
StudentÕs t-test allowed to compare the different variables<br />
<strong>of</strong> both breads. The PearsonÕs correlation coefficient (SPSS<br />
s<strong>of</strong>tware) was used for the correlation analysis. The values<br />
were considered significant when the P-value was inferior<br />
to 0.05.<br />
3. Results<br />
3.1. Bread composition<br />
The mean weight <strong>of</strong> both breads after baking was about<br />
750 g, corresponding to a loss <strong>of</strong> water <strong>of</strong> about 100 g.<br />
There was no difference between <strong>spelt</strong> vs. <strong>wheat</strong> breads<br />
concerning this parameter. The nutritional composition<br />
<strong>of</strong> flours <strong>and</strong> breads is shown in Table 2. Thus, the <strong>spelt</strong><br />
bread was richer in proteins (8.28 g/100 g for <strong>spelt</strong> vs.<br />
7.37 g/100 g for <strong>wheat</strong>) <strong>and</strong> lipids (1 g/100 g for <strong>spelt</strong> vs.<br />
0.79 g/100 g for <strong>wheat</strong>) than <strong>wheat</strong> bread. The proportion<br />
<strong>of</strong> monounsaturated fatty acids (MUFA) in <strong>spelt</strong> flour was<br />
twice as high that <strong>of</strong> <strong>wheat</strong> flour (14.10% <strong>of</strong> total lipids for<br />
<strong>spelt</strong> vs. 7.9% <strong>of</strong> total lipids for <strong>wheat</strong>).<br />
By considering both flours <strong>and</strong> breads analysis, no difference<br />
was observed in the total carbohydrate quantity<br />
or in total fibre level. However, a more accurate analysis<br />
<strong>of</strong> fibre showed a lower soluble fibre content in <strong>spelt</strong><br />
bread vs. <strong>wheat</strong> bread (1.45 g/100 g for <strong>spelt</strong> vs. 1.76 g/<br />
100 g for <strong>wheat</strong>). Fructans analysis showed that olig<strong>of</strong>ructose<br />
(with a mean number <strong>of</strong> fructosyl moeties <strong>of</strong> about<br />
4) represented the major fructosyl oligomer fraction.<br />
C. Marques et al. / Food Chemistry 100 (2007) 1265–1271 1267<br />
Table 2<br />
Nutritional composition <strong>of</strong> <strong>wheat</strong> <strong>and</strong> <strong>spelt</strong> white flours <strong>and</strong> <strong>wheat</strong> <strong>and</strong><br />
<strong>spelt</strong> white breads<br />
Quantitative analysis revealed a higher content <strong>of</strong><br />
olig<strong>of</strong>ructose in <strong>spelt</strong> flour than <strong>wheat</strong> flour (0.9 g/100 g<br />
for <strong>spelt</strong> vs. 0.7 g/100 g for <strong>wheat</strong>). The nutritional<br />
composition also showed that <strong>wheat</strong> bread was richer in<br />
maltose than <strong>spelt</strong> bread (1.61 g/100 g for <strong>spelt</strong> vs.<br />
3.64 g/100 g for <strong>wheat</strong>).<br />
3.2. Glycemic response <strong>of</strong> breads<br />
Wheat<br />
flour<br />
Spelt<br />
flour<br />
Wheat<br />
bread<br />
Spelt<br />
bread<br />
Dry matters 90.58 90.65 65.1 65.2<br />
Proteins<br />
Lipids<br />
10.53 11.83 7.37 8.28<br />
Total 1.14 1.43 0.79 1.00<br />
Saturated fatty acids (%) 20.67 21.01 20.67 21.01<br />
Mono unsaturated fatty acids (%) 7.9 14.10 7.9 14.10<br />
Poly unsaturated fatty acids (%)<br />
Carbohydrate<br />
67.04 60.49 67.04 60.49<br />
Total 75.94 74.20 53.16 51.94<br />
Starch 71.84 72.07 50.28 50.45<br />
Sugar 4.10 2.13 2.87 1.49<br />
Fructose 0 0 0 0<br />
Glucose 0.22 0.28 0.15 0.20<br />
Sucrose 0.24 0.24 0.17 0.16<br />
Maltose<br />
Fibres<br />
3.64 1.61 2.55 1.13<br />
Total 2.52 2.65 1.76 1.86<br />
Insoluble 0 0.58 0 0.41<br />
Soluble 2.52 2.07 1.76 1.45<br />
OFS 0.7 0.9 0.49 0.63<br />
Ash 0.45 0.54 1.15 1.18<br />
The nutritional composition <strong>of</strong> both breads has been evaluated after a<br />
chemical analysis <strong>of</strong> both flours by AOAC methods. Values are mean <strong>of</strong><br />
duplicate analysis on the sample <strong>and</strong> are expressed in g per 100 g <strong>of</strong><br />
sample.<br />
The <strong>glycemic</strong> responses to <strong>spelt</strong> <strong>and</strong> <strong>wheat</strong> breads are<br />
shown in Fig. 1. The fasting glycemia was similar for<br />
each experiment in the same subject with similar means<br />
for <strong>spelt</strong> <strong>and</strong> <strong>wheat</strong> breads (4.59 ± 0.15 mM for <strong>spelt</strong><br />
bread vs. 4.59 ± 0.44 mM for <strong>wheat</strong> bread). No difference<br />
was observed between both breads neither for <strong>glycemic</strong><br />
peak nor for glycemia 120 min after the meal. The <strong>glycemic</strong><br />
peaks are observed 45 min after the start <strong>of</strong> the meal<br />
for both breads with a mean <strong>of</strong> 7.23 ± 0.25 mM for <strong>spelt</strong><br />
bread <strong>and</strong> 7.21 ± 0.25 mM for <strong>wheat</strong> bread. The glycemia<br />
value observed 120 min after the <strong>spelt</strong> bread consumption<br />
is also similar to that <strong>of</strong> <strong>wheat</strong> bread<br />
(5.51 ± 0.21 mM for <strong>spelt</strong> bread vs. 5.45 ± 0.27 mM for<br />
<strong>wheat</strong> bread). The calculation <strong>of</strong> IAUC for each subject<br />
<strong>and</strong> for each bread allows evaluating the GI <strong>of</strong> <strong>spelt</strong><br />
bread (Table 3). No significant differences between IAUC<br />
<strong>of</strong> both breads were observed leading to a GI <strong>of</strong> <strong>spelt</strong><br />
bread <strong>of</strong> 93 ± 9.
1268 C. Marques et al. / Food Chemistry 100 (2007) 1265–1271<br />
Glycemia (mmol/l)<br />
8<br />
6<br />
4<br />
2<br />
0<br />
0 15 30 45 60 75 90 105 120<br />
4. Results <strong>of</strong> questionnaires<br />
Time (min)<br />
4.1. Effect <strong>of</strong> <strong>spelt</strong> <strong>and</strong> <strong>wheat</strong> breads on the satiety<br />
Questionnaire results showed no difference between the<br />
two breads for satiety, or for sensation related to digestion<br />
(data not shown).<br />
4.2. Correlation analysis with the IAUC values<br />
Wheat bread<br />
Spelt bread<br />
Fig. 1. Pr<strong>of</strong>ile <strong>of</strong> glycemia after consumption either <strong>wheat</strong> bread or <strong>spelt</strong><br />
bread. Pr<strong>of</strong>ile <strong>of</strong> glycemia (mmol/l) for 120 min after consumption <strong>of</strong> <strong>spelt</strong><br />
white bread or <strong>wheat</strong> white bread containing 50 g carbohydrates. Values<br />
are means ± SEM.<br />
For each subject, the food analysis allowed evaluation<br />
<strong>of</strong> the nutrient intake <strong>of</strong> the last meal before doing the<br />
test (data not shown). The correlation analysis showed<br />
that the carbohydrate intake <strong>of</strong> the meal preceding the<br />
test influences the IAUC value (Fig. 2) (r = 0.397,<br />
P < 0.01): the higher the carbohydrate intake, the lower<br />
the IAUC values. No significant relation was observed<br />
between the last intake <strong>of</strong> lipids or fibres <strong>and</strong> the IAUC<br />
values (data not shown). A negative correlation was also<br />
found between the fasting glycemia values <strong>and</strong> the IAUC<br />
values (Fig. 3) (r = 0.353, P < 0.01). The carbohydrate<br />
0<br />
0 50 100 150 200<br />
intake <strong>of</strong> the last meal before the experiment was not<br />
significantly associated with the fasting glycemia values<br />
(Fig. 4).<br />
Table 3<br />
Incremental area under the blood glucose response curve (IAUC) <strong>of</strong> <strong>spelt</strong> <strong>and</strong> <strong>wheat</strong> breads <strong>and</strong> <strong>glycemic</strong> <strong>index</strong> (GI) value <strong>of</strong> <strong>spelt</strong> bread<br />
Spelt bread Wheat bread GI<br />
IAUC 1 IAUC 2 IAUC 3 Mean IAUC 1 IAUC 2 IAUC 3 Mean<br />
F1 239 281 190 237 133 132 379 215 110<br />
F2 320 195 219 245 278 179 351 269 91<br />
F3 257 281 195 244 302 263 230 265 92<br />
F4 141 61 169 124 165 55 96 105 118<br />
F5 202 186 196 195 222 124 176 174 112<br />
H1 73 64 152 96 120 157 179 152 63<br />
H2 115 125 90 110 216 93 122 144 76<br />
H3 28 33 41 34 152 103 25 93 37<br />
H4 168 86 173 142 140 116 142 133 107<br />
H5 122 140 149 137 110 163 59 111 123<br />
Mean ± SEM 93 ± 9<br />
IAUC 1,2,3 correspond to measurement performed at three separate days (see Section 2). GI corresponds <strong>of</strong> the ratio <strong>of</strong> the mean Spelt bread/mean Wheat<br />
bread · 100. There is no significant difference between IAUC <strong>of</strong> both breads (P-value > 0,05; paired studentÕs test).<br />
IAUC values (mmol.min/l)<br />
400<br />
350<br />
300<br />
250<br />
200<br />
150<br />
100<br />
50<br />
Carbohydrate intake (g)<br />
Fig. 2. Correlation between carbohydrate intake <strong>of</strong> the last meal before the<br />
experiment <strong>and</strong> the IAUC values. Negative correlation between carbohydrate<br />
intake (grams) <strong>of</strong> the last meal before the experiment <strong>and</strong> the IAUC<br />
values (mmol min/l) measured in all subjects for all experimental conditions<br />
(6 IAUC evaluation per subject; n = 10 volunteers; r = 0.397, P < 0.01).<br />
IAUC values (mmol.min/l)<br />
400<br />
350<br />
300<br />
250<br />
200<br />
150<br />
100<br />
50<br />
0<br />
2.5 3 3.5 4 4.5 5 5.5<br />
Fasting glycemia values (mmol/l)<br />
Fig. 3. Correlation between fasting glycemia <strong>and</strong> IAUC for glycemia.<br />
Negative correlation between the fasting glycemia values (mmol/l) <strong>and</strong> the<br />
IAUC values (mmol min/l) measured in all subjects for all experimental<br />
conditions (6 IAUC evaluation per subject; n = 10 volunteer; r = 0.353,<br />
P < 0.01).
Fasting glycemia values (mmol/l)<br />
6<br />
5.5<br />
5<br />
4.5<br />
4<br />
3.5<br />
3<br />
2.5<br />
0 50 100 150 200<br />
5. Discussion<br />
carbohydrate intake (g)<br />
Fig. 4. Relationship between carbohydrate intake <strong>of</strong> the last meal before<br />
the experiment <strong>and</strong> fasting glycemia. Relationship between carbohydrate<br />
intake (grams) <strong>of</strong> the last meal before the experiment <strong>and</strong> the fasting<br />
glycemia (mmol/l) measured in all subjects for all experimental conditions<br />
(6 evaluations <strong>of</strong> fasting glycemia per subject; n = 10 volunteers). Non<br />
significant correlation (r = 0.211, P > 0.05).<br />
A study carried out by Bonafaccia et al. (2000) showed<br />
that <strong>spelt</strong> cultivars compared to common <strong>wheat</strong> had a<br />
higher content <strong>of</strong> some nutrients implicated in the drop<br />
<strong>of</strong> GI, such as proteins <strong>and</strong> soluble fibres. Those two<br />
parameters were not different in the <strong>spelt</strong> <strong>and</strong> <strong>wheat</strong> flours<br />
used in the present experiment. For the first time, the fructans<br />
present in both breads were determined <strong>and</strong> we found<br />
that olig<strong>of</strong>ructose content was higher in <strong>spelt</strong> than in <strong>wheat</strong><br />
flour. Olig<strong>of</strong>ructose has been recognised as a dietary fibre<br />
which is largely fermented in the caeco-colon, <strong>and</strong> produces<br />
several effects in the gastrointestinal tract (prebiotic effect,<br />
decrease in pH, increased absorption <strong>of</strong> minerals, etc.),<br />
but also in the systemic circulation (decrease in triglyceridemia,<br />
in glycemia, in uremia, etc.), this phenomenon being<br />
linked to its fermentation pattern (Delzenne, 2003). Moreover,<br />
the <strong>spelt</strong> flour was two times less rich in maltose – a<br />
carbohydrate responsible for a rapid increase in glycemia,<br />
<strong>and</strong> richer in MUFA than <strong>wheat</strong> flour, two nutrients susceptible<br />
to influence GI in an opposite way.<br />
The presence <strong>of</strong> MUFA in higher quantity could influence<br />
the GI <strong>of</strong> bread. In fact, Gatti et al. (1992) have found<br />
a reduction in postpr<strong>and</strong>ial glucose responses to <strong>wheat</strong><br />
bread after the addition <strong>of</strong> olive oil (rich in MUFA) <strong>and</strong><br />
corn oil (polyunsaturated fatty acids), but not butter (saturated<br />
fatty acids). However, a recent study performed by<br />
Maclntosh, Holt, <strong>and</strong> Br<strong>and</strong>-Miller (2003) has shown that<br />
substitution <strong>of</strong> monounsaturated or polyunsaturated fatty<br />
acids by saturated fatty acids does not improve acute postpr<strong>and</strong>ial<br />
hyperglycaemia. The question thus remains open:<br />
are the differences in maltose, MUFA, <strong>and</strong>/or fructans content<br />
observed in <strong>spelt</strong> vs. <strong>wheat</strong> bread sufficient to lessen<br />
the glucose response?<br />
By using a test based on the in vitro starch hydrolysis<br />
assay, the GI <strong>of</strong> <strong>spelt</strong> bread did not differ from <strong>wheat</strong> bread<br />
(Foster-Powell et al., 2002; Skrabanja et al., 2001). However,<br />
it is not yet known if the in vitro method is a reliable<br />
C. Marques et al. / Food Chemistry 100 (2007) 1265–1271 1269<br />
means to evaluate the GI <strong>of</strong> all types <strong>of</strong> foods. Some factors<br />
could affect the post-pr<strong>and</strong>ial glycemia in vivo without<br />
modifying the rate <strong>of</strong> starch hydrolysis in vitro.<br />
Furthermore, most <strong>of</strong> the <strong>spelt</strong>-based foods are not prepared<br />
with <strong>spelt</strong> cereal above <strong>and</strong> a previous study in our<br />
laboratory has shown that no bread commercially available<br />
on the Belgian market place with denomination ‘‘<strong>spelt</strong><br />
bread’’ was made with pure <strong>spelt</strong> flour. As a general rule,<br />
the baker uses a mix <strong>of</strong> <strong>spelt</strong> <strong>and</strong> <strong>wheat</strong> flour to facilitate<br />
the baking <strong>of</strong> bread. In order to compare <strong>spelt</strong> <strong>and</strong> <strong>wheat</strong><br />
bread with equal composition, both breads were baked in<br />
our laboratory under the same conditions with authentic<br />
<strong>spelt</strong> or <strong>wheat</strong> flour manufactured in the same mill. At<br />
the end <strong>of</strong> this experiment <strong>and</strong> according to the in vitro<br />
study, our results showed that <strong>spelt</strong> bread GI was close<br />
to 100, which is the GI attributed to <strong>wheat</strong> bread. However,<br />
GI values variability between subjects <strong>and</strong> within<br />
the same subject was very high. Under one study performed<br />
by Wolever et al. (2003), GI values were not significantly<br />
related to the method used for glucose measurement<br />
or subject characteristics. Furthermore, capillary blood<br />
glucose was less variable than venous plasma glucose.<br />
These observed differences led us to look for other factors<br />
which could modulate IAUC values <strong>and</strong> influence GI values.<br />
According to correlation analysis, our results suggest<br />
that the IAUC values are significantly associated to fasting<br />
glycemia values <strong>and</strong> carbohydrate intake during the last<br />
evening meal before the experiment. However, the fasting<br />
glycemia was not correlated to the carbohydrate amount<br />
ingested the previous day, which suggests that these two<br />
observations are independent. Consequently, the GI value<br />
does not depend only on glucose availability in the food,<br />
but also on the fasting glycemia <strong>and</strong> the carbohydrate<br />
quantity ingested in the previous meal. Furthermore, it<br />
seems that the GI was not due to the appearance <strong>of</strong> glucose<br />
in the blood, but to glucose removal by tissue (Schenk,<br />
Davidson, Zderic, Byerley, & Coyle, 2003). The GI <strong>of</strong><br />
two breakfast cereals was different despite no significant<br />
differences in the rate <strong>of</strong> glucose entry into the blood. This<br />
suggests that the GI depends more on glucose metabolism<br />
than glucose absorption. This could explain the influence<br />
<strong>of</strong> the last carbohydrate intake or the fasting glycemia on<br />
the GI.<br />
In fact, it seems that a high-carbohydrate evening meal<br />
improves glucose tolerance after an oral glucose tolerance<br />
test (OGTT) the next morning. A high nocturnal insulin<br />
concentration should prime the system <strong>and</strong> the subject<br />
should be more insulin sensitive, enhancing insulindependent<br />
glucose disposal <strong>and</strong> inhibiting hepatic glucose<br />
production (Robertson, Henderson, Vist, & Rumsey, 2002).<br />
Henceforth, in order to avoid more variability, we suggest<br />
to include in the method a st<strong>and</strong>ardised carbohydrate<br />
quantity in the evening meal before the experiment.<br />
According to the <strong>glycemic</strong> pr<strong>of</strong>ile observed after bread<br />
intakes, no effect <strong>of</strong> <strong>spelt</strong> bread on satiety compared to<br />
<strong>wheat</strong> bread was noticed. Indeed, the postpr<strong>and</strong>ial<br />
glycemia could be negatively correlated to the sensation
1270 C. Marques et al. / Food Chemistry 100 (2007) 1265–1271<br />
<strong>of</strong> hunger. However, a study carried out by Bard et al.<br />
(2003) showed the effect <strong>of</strong> <strong>spelt</strong> bread on satiety compared<br />
to <strong>wheat</strong> bread. Yet, the authors have not used <strong>spelt</strong> <strong>and</strong><br />
<strong>wheat</strong> breads baked with a st<strong>and</strong>ardised recipe. Furthermore,<br />
they have not given an indication <strong>of</strong> the origin <strong>of</strong><br />
the flour used to bake these breads. Could the presence<br />
<strong>of</strong> additives or other substances such as sucrose or emulsifiers<br />
influence the results? In fact, thanks to their smallscale<br />
production, <strong>spelt</strong> breads are <strong>of</strong>ten exempt <strong>of</strong> bread<br />
improvers that may be responsible <strong>of</strong> a more important<br />
satiety effect.<br />
In conclusion, the <strong>spelt</strong> bread has a GI <strong>of</strong> 93 <strong>and</strong> its <strong>glycemic</strong><br />
pr<strong>of</strong>ile was not different than that <strong>of</strong> <strong>wheat</strong> bread.<br />
Consequently, we suggest that the differences in nutrients<br />
contents such as fibres, fructans, or fatty acids in the <strong>spelt</strong><br />
bread compared to <strong>wheat</strong> bread are not physiologically<br />
relevant, at least in term <strong>of</strong> GI modulation. Furthermore,<br />
the IAUC values seem to be correlated to fasting glycemia<br />
<strong>and</strong> carbohydrate intake <strong>of</strong> the evening meal before the<br />
test. Those parameters will have to be taken into account<br />
in the evaluation <strong>of</strong> GI.<br />
Acknowledgements<br />
We thank Roche for providing the gluco-meters, ORA-<br />
FTI (Tienen, Belgium) for the measurement <strong>of</strong> fructans in<br />
both flours, <strong>and</strong> Igr Pijke <strong>of</strong> Institut Paul Lambin for the<br />
analysis <strong>of</strong> the nutrition composition <strong>of</strong> both flours. This<br />
project has been supported by the Région Wallonne (Grant<br />
Recherche dÕInitiative n° 011/4666).<br />
References<br />
Abdel Aal, E. S. M., Hucl, P., & Sosulski, F. W. (1995). Composition <strong>and</strong><br />
nutritional characteristics <strong>of</strong> spring einkorn <strong>and</strong> <strong>spelt</strong> <strong>wheat</strong>s. Cereal<br />
Chemistry, 72, 621–624.<br />
Abdel Aal, E. S. M., Sosulski, F. W., & Hucl, P. (1998). Origins,<br />
characteristics <strong>and</strong> potentials <strong>of</strong> ancient <strong>wheat</strong>s. Cereal Food World, 9,<br />
708–715.<br />
Association <strong>of</strong> Official Analytical Chemists (2000). Method 994.13; The<br />
Uppsala Enzymatic/Chemical Method.<br />
Augustin, L. S., Dal Maso, L., La Vecchia, C., Parpinel, M., Negri, E.,<br />
Vaccarelle, S., et al. (2001). Dietary <strong>glycemic</strong> <strong>index</strong> <strong>and</strong> <strong>glycemic</strong> load,<br />
<strong>and</strong> breast cancer risk: a case-control study. Annals <strong>of</strong> Oncology, 12,<br />
1533–1538.<br />
Augustin, L. S., Franceschi, S., Jenkins, D. J. A., Kendall, C. W. C., & La<br />
Vecchia, C. (2002). Glycemic <strong>index</strong> in chronic disease: a review.<br />
European Journal <strong>of</strong> Clinical Nutrition, 56, 1049–1071.<br />
Augustin, L. S., Gallus, S., Bosetti, C., Levi, F., Negri, E., Franceschi, S.,<br />
et al. (2003a). Glycemic <strong>index</strong> <strong>and</strong> <strong>glycemic</strong> load in endometrial<br />
cancer. International Journal <strong>of</strong> Cancer, 105, 404–407.<br />
Augustin, L. S., Polesel, J., Bosetti, C., Kendall, C. W., La Vecchia, C.,<br />
Parpinel, M., et al. (2003b). Dietary <strong>glycemic</strong> <strong>index</strong>, <strong>glycemic</strong> load <strong>and</strong><br />
ovarian cancer risk: a case-control study in Italy. Annals <strong>of</strong> Oncology,<br />
14, 78–84.<br />
Augustin, L. S., Gallus, S., Franceschi, S., Negri, E., Jenkins, D. J.,<br />
Kendall, C. W., et al. (2003c). Glycemic <strong>index</strong> <strong>and</strong> load <strong>and</strong> risk <strong>of</strong><br />
upper aero-digestive tract neoplasms (Italy). Cancer Causes Control,<br />
14, 657–662.<br />
Ball, S. D., Keller, K. R., Moyer-Mileur, L. J., Ding, Y.-W., Donaldson,<br />
D., & Jackson, D. (2003). Prolongation <strong>of</strong> satiety after low versus<br />
moderately high <strong>glycemic</strong> <strong>index</strong> meals in obese adolescents. Pediatrics,<br />
111, 488–494.<br />
Bard, J. M., Bonn<strong>and</strong>-Ducasse, M., Le Néel, T., Cazaubiel, M., Zaïr, Y.,<br />
Krempf, M., et al. (2003). Effet du pain dÕépeautre sur la satiété et les<br />
réponses glucidique et insulinémique post-pr<strong>and</strong>iales. Médecine et<br />
Nutrition, 39, 169–176.<br />
Bonafaccia, G., Galli, V., Francisci, R., Mair, V., Skrabanja, V., & Kreft,<br />
I. (2000). Characteristics <strong>of</strong> <strong>spelt</strong> <strong>wheat</strong> products <strong>and</strong> nutritional value<br />
<strong>of</strong> <strong>spelt</strong> <strong>wheat</strong>-based bread. Food Chemistry, 68, 437–444.<br />
Delzenne, N. M. (2003). Oligosaccharides: state <strong>of</strong> the art. Proceedings <strong>of</strong><br />
the Nutrition, 62, 177–182.<br />
FAO/WHO. (1998). Report <strong>of</strong> a joint FAO/WHO expert consultation<br />
Rome, 14–18 April 1997.<br />
Foster-Powell, K., Holt, S. H. A., & Br<strong>and</strong>-Miller, J. C. (2002).<br />
International table <strong>of</strong> <strong>glycemic</strong> <strong>index</strong> <strong>and</strong> <strong>glycemic</strong> load values: 2002.<br />
American Journal <strong>of</strong> Clinical Nutrition, 76, 5–56.<br />
Franceschi, S., Dal Maso, L., Augustin, L., Negri, E., Parpinel, M., Boyle,<br />
P., et al. (2001). Dietery <strong>glycemic</strong> load <strong>and</strong> colorectal cancer risk.<br />
Annals <strong>of</strong> Oncology, 12, 173–178.<br />
Gatti, E., Noe, D., Pazzucconi, F., Gianfranceschi, G., Porrini, M.,<br />
Testolin, G., et al. (1992). Differential effect <strong>of</strong> unsaturated oils <strong>and</strong><br />
butter on blood glucose <strong>and</strong> insulin response to carbohydrate in<br />
normal volunteers. European Journal <strong>of</strong> Clinical Nutrition, 46, 161–<br />
166.<br />
Granfeldt, Y., Bjorck, I., Drews, A., & Tovar, J. (1992). An in vitro<br />
procedure based on chewing to predict metabolic response to starch in<br />
cereal <strong>and</strong> legume products. European Journal <strong>of</strong> Clinical Nutrition, 46,<br />
649–660.<br />
Hodge, A. M., English, D. R., OÕDea, K., & Giles, G. G. (2004). Glycemic<br />
<strong>index</strong> <strong>and</strong> dietary fiber <strong>and</strong> the risk <strong>of</strong> type 2 diabetes. Diabetes Care,<br />
27, 2701–2706.<br />
Jenkins, D. J. A., Wolever, T. M., Taylor, R. H., Barker, H., Fielden, H.,<br />
Baldwin, J. M., et al. (1981). Glycemic <strong>index</strong> <strong>of</strong> foods: a physiological<br />
basis for carbohydrate exchange. American Journal <strong>of</strong> Clinical Nutrition,<br />
34, 362–366.<br />
Joye, D., & Hoebregs, H. (2000). Determination <strong>of</strong> olig<strong>of</strong>ructose, a soluble<br />
dietary fiber, by high-temperature capillary gas chromatography.<br />
Journal <strong>of</strong> AOAC International, 83, 1020–1025.<br />
Ludwig, D. S. (2002). The <strong>glycemic</strong> <strong>index</strong>: physiologique mechanisms to<br />
obesity, diabetes <strong>and</strong> cardiovascular disease. Journal <strong>of</strong> the American<br />
Medical Association, 287, 2414–2423.<br />
Maclntosh, C. G., Holt, S. H. A., & Br<strong>and</strong>-Miller, J. C. (2003). The degree<br />
<strong>of</strong> fat saturation does not alter <strong>glycemic</strong>, insulinemic or satiety<br />
responses to a starchy staple in healthy men. Journal <strong>of</strong> Nutriton, 133,<br />
2577–2580.<br />
Ranhotra, G. S., Gelroth, J. A., Glaser, B. K., & Stallknecht, G. F. (1996).<br />
Nutritional pr<strong>of</strong>ile <strong>of</strong> three <strong>spelt</strong> <strong>wheat</strong> cultivars grown at five different<br />
locations. Cereal Chemistry, 73, 533–535.<br />
Roberts, S. B. (2000). High-<strong>glycemic</strong> <strong>index</strong> foods, hunger; <strong>and</strong> obesity: is<br />
there a connection? Nutrition Reviews, 58, 163–169.<br />
Robertson, M. D., Henderson, R. A., Vist, G. E., & Rumsey, R. D.<br />
(2002). Extended effects <strong>of</strong> evening meal carbohydrate-to-fat ratio on<br />
fasting <strong>and</strong> postpr<strong>and</strong>ial substrate metabolism. American Journal <strong>of</strong><br />
Clinical Nutrition, 75, 505–510.<br />
Schenk, S., Davidson, C. J., Zderic, T. W., Byerley, L. O., & Coyle, E. F.<br />
(2003). Different <strong>glycemic</strong> <strong>index</strong> <strong>of</strong> breakfast cereals are not due to<br />
glucose entry into blood but to glucose removal by tissue. American<br />
Journal <strong>of</strong> Clinical Nutrition, 78, 742–748.<br />
Skrabanja, V., Kovac, B., Golob, T., Elmstahl, H. G. M. L., Björck, I. M.<br />
E., & Kreft, I. (2001). Effect <strong>of</strong> <strong>spelt</strong> <strong>wheat</strong> flour <strong>and</strong> kernel on bread<br />
composition <strong>and</strong> nutritional characteristics. Journal <strong>of</strong> Agricultural <strong>and</strong><br />
Food Chemistry, 49, 497–500.<br />
Warren, J. M., Henry, C. J. K., & Simonite, V. (2003). Low <strong>glycemic</strong> <strong>index</strong><br />
breakfasts <strong>and</strong> reduced food intake in preadolescent children. Pediatrics,<br />
112, 414–419.<br />
Wolever, T. M. S., Jenkins, D. J. A., Jenkins, A. L., & Josse, R. (1991).<br />
The <strong>glycemic</strong> <strong>index</strong>: methodology <strong>and</strong> clinical implications. Ameican<br />
Journal <strong>of</strong> Clinical Nutrition, 54, 846–854.
Wolever, T. M., Vorster, H. H., Bjorck, I., Br<strong>and</strong>-Miller, J., Brighenti, F.,<br />
Mann, J. I., et al. (2003). Determination <strong>of</strong> glycaemic <strong>index</strong> <strong>of</strong> foods:<br />
interlaboratory study. European Journal <strong>of</strong> Clinical Nutrition, 57,<br />
475–482.<br />
C. Marques et al. / Food Chemistry 100 (2007) 1265–1271 1271<br />
Wu, C. L., Nicholas, C., Williams, C., Took, A., & Hardy, L. (2003). The<br />
influence <strong>of</strong> high-carbohydrate meals with different glycaemic indices<br />
on substrate utilisation during subsequent exercise. British Journal <strong>of</strong><br />
Nutrition, 90, 1049–1056.