Steam Digest 2002 - CiteSeerX
Steam Digest 2002 - CiteSeerX
Steam Digest 2002 - CiteSeerX

Create successful ePaper yourself
Turn your PDF publications into a flip-book with our unique Google optimized e-Paper software.
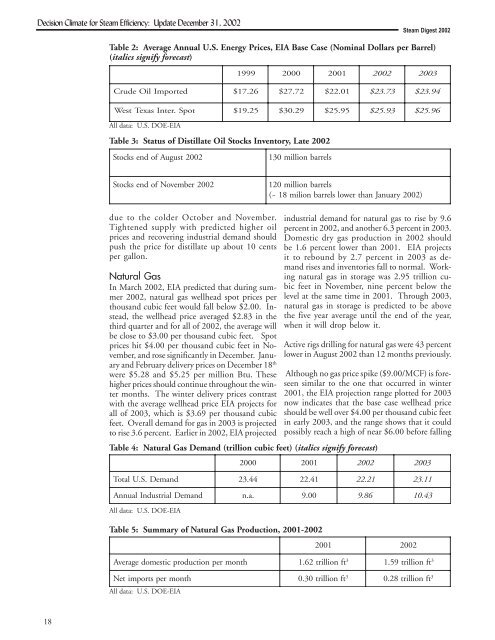
Decision Climate for <strong>Steam</strong> Efficiency: Update December 31, <strong>2002</strong><br />
18<br />
due to the colder October and November.<br />
Tightened supply with predicted higher oil<br />
prices and recovering industrial demand should<br />
push the price for distillate up about 10 cents<br />
per gallon.<br />
Natural Gas<br />
In March <strong>2002</strong>, EIA predicted that during summer<br />
<strong>2002</strong>, natural gas wellhead spot prices per<br />
thousand cubic feet would fall below $2.00. Instead,<br />
the wellhead price averaged $2.83 in the<br />
third quarter and for all of <strong>2002</strong>, the average will<br />
be close to $3.00 per thousand cubic feet. Spot<br />
prices hit $4.00 per thousand cubic feet in November,<br />
and rose significantly in December. January<br />
and February delivery prices on December 18 th<br />
were $5.28 and $5.25 per million Btu. These<br />
higher prices should continue throughout the winter<br />
months. The winter delivery prices contrast<br />
with the average wellhead price EIA projects for<br />
all of 2003, which is $3.69 per thousand cubic<br />
feet. Overall demand for gas in 2003 is projected<br />
to rise 3.6 percent. Earlier in <strong>2002</strong>, EIA projected<br />
<strong>Steam</strong> <strong>Digest</strong> <strong>2002</strong><br />
Table 2: Average Annual U.S. Energy Prices, EIA Base Case (Nominal Dollars per Barrel)<br />
(italics signify forecast)<br />
19992000 2001 <strong>2002</strong>2003 CrudeOilImported$ 17.<br />
26<br />
$ 27.<br />
72<br />
$ 22.<br />
01<br />
$ 23.<br />
73<br />
$ 23.<br />
94<br />
WestTexasInter. Spot<br />
$ 19.<br />
25<br />
$ 30.<br />
29<br />
$ 25.<br />
95<br />
$ 25.<br />
93<br />
$ 25.<br />
96<br />
All data: U.S. DOE-EIA<br />
Table 3: Status of Distillate Oil Stocks Inventory, Late <strong>2002</strong><br />
StocksendofAugust<strong>2002</strong>130millionbarrels StocksendofNovember<strong>2002</strong>120millionbarrels ( ~ 18<br />
milion<br />
barrels<br />
lower<br />
than<br />
January<br />
<strong>2002</strong>)<br />
industrial demand for natural gas to rise by 9.6<br />
percent in <strong>2002</strong>, and another 6.3 percent in 2003.<br />
Domestic dry gas production in <strong>2002</strong> should<br />
be 1.6 percent lower than 2001. EIA projects<br />
it to rebound by 2.7 percent in 2003 as demand<br />
rises and inventories fall to normal. Working<br />
natural gas in storage was 2.95 trillion cubic<br />
feet in November, nine percent below the<br />
level at the same time in 2001. Through 2003,<br />
natural gas in storage is predicted to be above<br />
the five year average until the end of the year,<br />
when it will drop below it.<br />
Active rigs drilling for natural gas were 43 percent<br />
lower in August <strong>2002</strong> than 12 months previously.<br />
Although no gas price spike ($9.00/MCF) is foreseen<br />
similar to the one that occurred in winter<br />
2001, the EIA projection range plotted for 2003<br />
now indicates that the base case wellhead price<br />
should be well over $4.00 per thousand cubic feet<br />
in early 2003, and the range shows that it could<br />
possibly reach a high of near $6.00 before falling<br />
Table 4: Natural Gas Demand (trillion cubic feet) (italics signify forecast)<br />
20002001 <strong>2002</strong>2003 TotalU. S.<br />
Demand<br />
23. 44<br />
22. 41<br />
22. 21<br />
23.<br />
11<br />
A nnual<br />
Industrial<br />
Demand<br />
n. a.<br />
9. 00<br />
9. 86<br />
10.<br />
43<br />
All data: U.S. DOE-EIA<br />
Table 5: Summary of Natural Gas Production, 2001-<strong>2002</strong><br />
2001<strong>2002</strong> 3 Averagedomesticproductionpermonth1. 62<br />
trillion<br />
ft<br />
1.<br />
59<br />
trillion<br />
ft<br />
Netimportspermonth All data: U.S. DOE-EIA<br />
3 0. 30<br />
trillion<br />
ft<br />
0.<br />
28<br />
trillion<br />
ft<br />
3<br />
3