RIVM rapport 350070001 Dutch National Food Consumption Survey ...
RIVM rapport 350070001 Dutch National Food Consumption Survey ...
RIVM rapport 350070001 Dutch National Food Consumption Survey ...

Create successful ePaper yourself
Turn your PDF publications into a flip-book with our unique Google optimized e-Paper software.
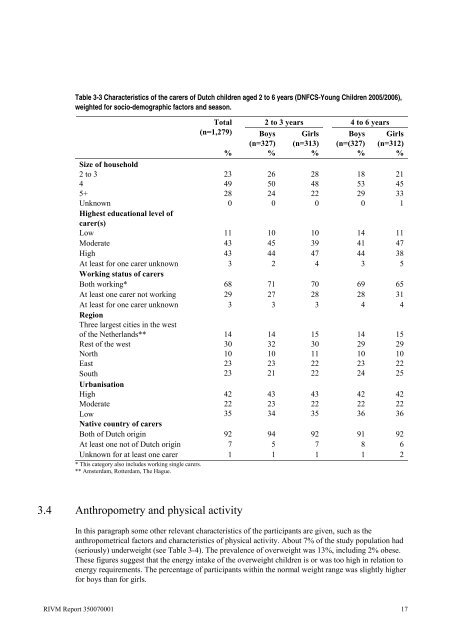
Table 3-3 Characteristics of the carers of <strong>Dutch</strong> children aged 2 to 6 years (DNFCS-Young Children 2005/2006),<br />
weighted for socio-demographic factors and season.<br />
Total 2 to 3 years 4 to 6 years<br />
(n=1,279) Boys Girls Boys Girls<br />
(n=327) (n=313) (n=(327) (n=312)<br />
% % % % %<br />
Size of household<br />
2 to 3 23 26 28 18 21<br />
4 49 50 48 53 45<br />
5+ 28 24 22 29 33<br />
Unknown<br />
Highest educational level of<br />
carer(s)<br />
0 0 0 0 1<br />
Low 11 10 10 14 11<br />
Moderate 43 45 39 41 47<br />
High 43 44 47 44 38<br />
At least for one carer unknown<br />
Working status of carers<br />
3 2 4 3 5<br />
Both working* 68 71 70 69 65<br />
At least one carer not working 29 27 28 28 31<br />
At least for one carer unknown<br />
Region<br />
Three largest cities in the west<br />
3 3 3 4 4<br />
of the Netherlands**<br />
14 14 15 14 15<br />
Rest of the west 30 32 30 29 29<br />
North 10 10 11 10 10<br />
East 23 23 22 23 22<br />
South<br />
Urbanisation<br />
23 21 22 24 25<br />
High 42 43 43 42 42<br />
Moderate 22 23 22 22 22<br />
Low<br />
Native country of carers<br />
35 34 35 36 36<br />
Both of <strong>Dutch</strong> origin 92 94 92 91 92<br />
At least one not of <strong>Dutch</strong> origin 7 5 7 8 6<br />
Unknown for at least one carer<br />
* This category also includes working single carers.<br />
** Amsterdam, Rotterdam, The Hague.<br />
1 1 1 1 2<br />
3.4 Anthropometry and physical activity<br />
In this paragraph some other relevant characteristics of the participants are given, such as the<br />
anthropometrical factors and characteristics of physical activity. About 7% of the study population had<br />
(seriously) underweight (see Table 3-4). The prevalence of overweight was 13%, including 2% obese.<br />
These figures suggest that the energy intake of the overweight children is or was too high in relation to<br />
energy requirements. The percentage of participants within the normal weight range was slightly higher<br />
for boys than for girls.<br />
<strong>RIVM</strong> Report <strong>350070001</strong> 17